Lactate is an energy substrate for rodent cortical neurons and enhances their firing activity
- Sorbonne Université, CNRS, INSERM, Neurosciences Paris Seine - Institut de Biologie Paris Seine (NPS-IBPS), France
- Brain Plasticity Unit, CNRS UMR 8249, CNRS, ESPCI Paris, France
- Institute for Neurophysiology, Goethe University Frankfurt, Germany
- Institute for Neuroanatomy, University Medical Center Göttingen, Georg-August- University Göttingen, Germany
- Graduate School of Biostudies, Kyoto University, Japan
- Division of Molecular and Metabolic Medicine, Kobe University Graduate School of Medicine, Japan
Figures
Figure 1 with 1 supplement
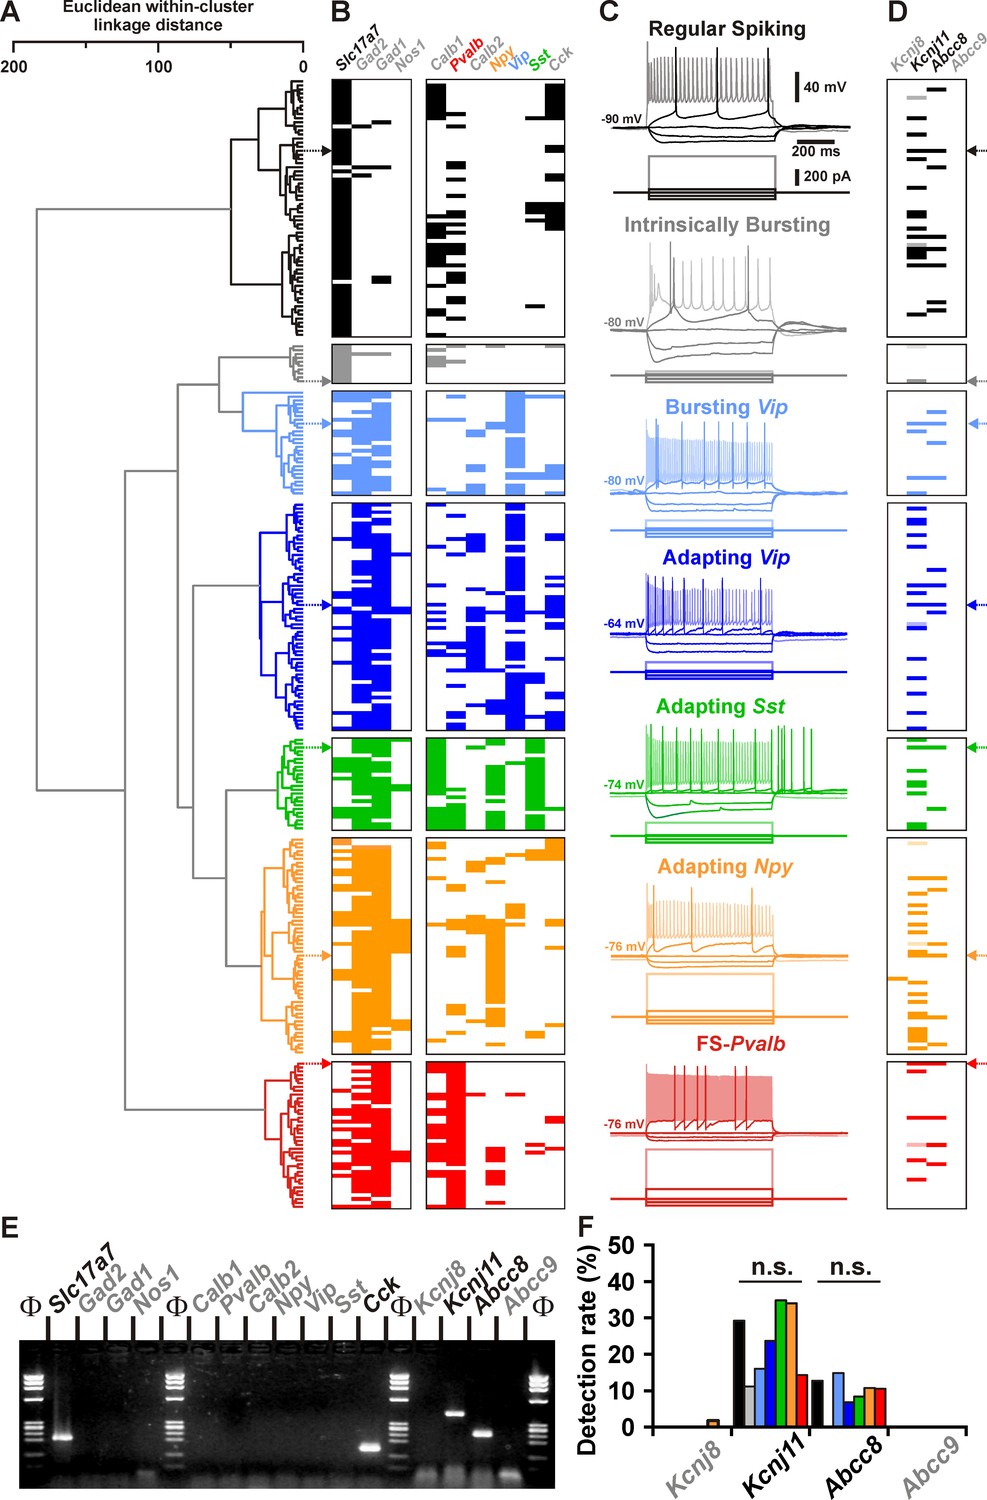
Detection of Kcnj11 and Abcc8 KATP channel subunits in cortical neuron subtypes.
(A) Ward’s clustering of 277 cortical neurons (left panel). The x-axis represents the average within-cluster linkage distance, and the y-axis the individuals. (B) Gene detection profile across the different cell clusters. For each cell, colored and white rectangles indicate presence and absence of genes, respectively. (C) Representative voltage responses induced by injection of current pulses (bottom traces) corresponding to −100, −50, and 0 pA, rheobase and intensity inducing a saturating firing frequency (shaded traces) of a regular spiking neuron (black), an intrinsically bursting neuron (gray), a bursting vasoactive intestinal polypeptide (Vip) interneuron (light blue), an adapting Vip interneuron (blue), an adapting Sst interneuron (green), an adapting Npy interneuron (orange), and a Fast Spiking-Parvalbumin interneuron (FS-Pvalb, red). The colored arrows indicate the expression profiles of neurons whose firing pattern is illustrated in (C). (D) Detection of the subunits of the KATP channels in the different clusters. Shaded rectangles represent potential Kcnj11 false positives in which genomic DNA was detected in the harvested material. (E) Single-cell RT-PCR (scRT-PCR) analysis of the regular spiking (RS) neuron depicted in (A–D). (F) Histograms summarizing the detection rate of KATP channel subunits in identified neuronal types. n.s., not statistically significant.
-
Figure 1—source data 1
Somatic, electrophysiological, and molecular properties of the cortical neurons shown in Figure 1A–D.
- https://cdn.elifesciences.org/articles/71424/elife-71424-fig1-data1-v2.xls
-
Figure 1—source data 2
Original file of the full raw unedited gel shown in Figure 1E.
- https://cdn.elifesciences.org/articles/71424/elife-71424-fig1-data2-v2.zip
-
Figure 1—source data 3
Uncropped gel shown in Figure 1E with relevant bands labeled.
- https://cdn.elifesciences.org/articles/71424/elife-71424-fig1-data3-v2.zip
-
Figure 1—source data 4
Statistcal comparisons of the detection of KATP channel subunits in different types of cortical neurons shown in Figure 1F.
- https://cdn.elifesciences.org/articles/71424/elife-71424-fig1-data4-v2.xls
Figure 1—figure supplement 1
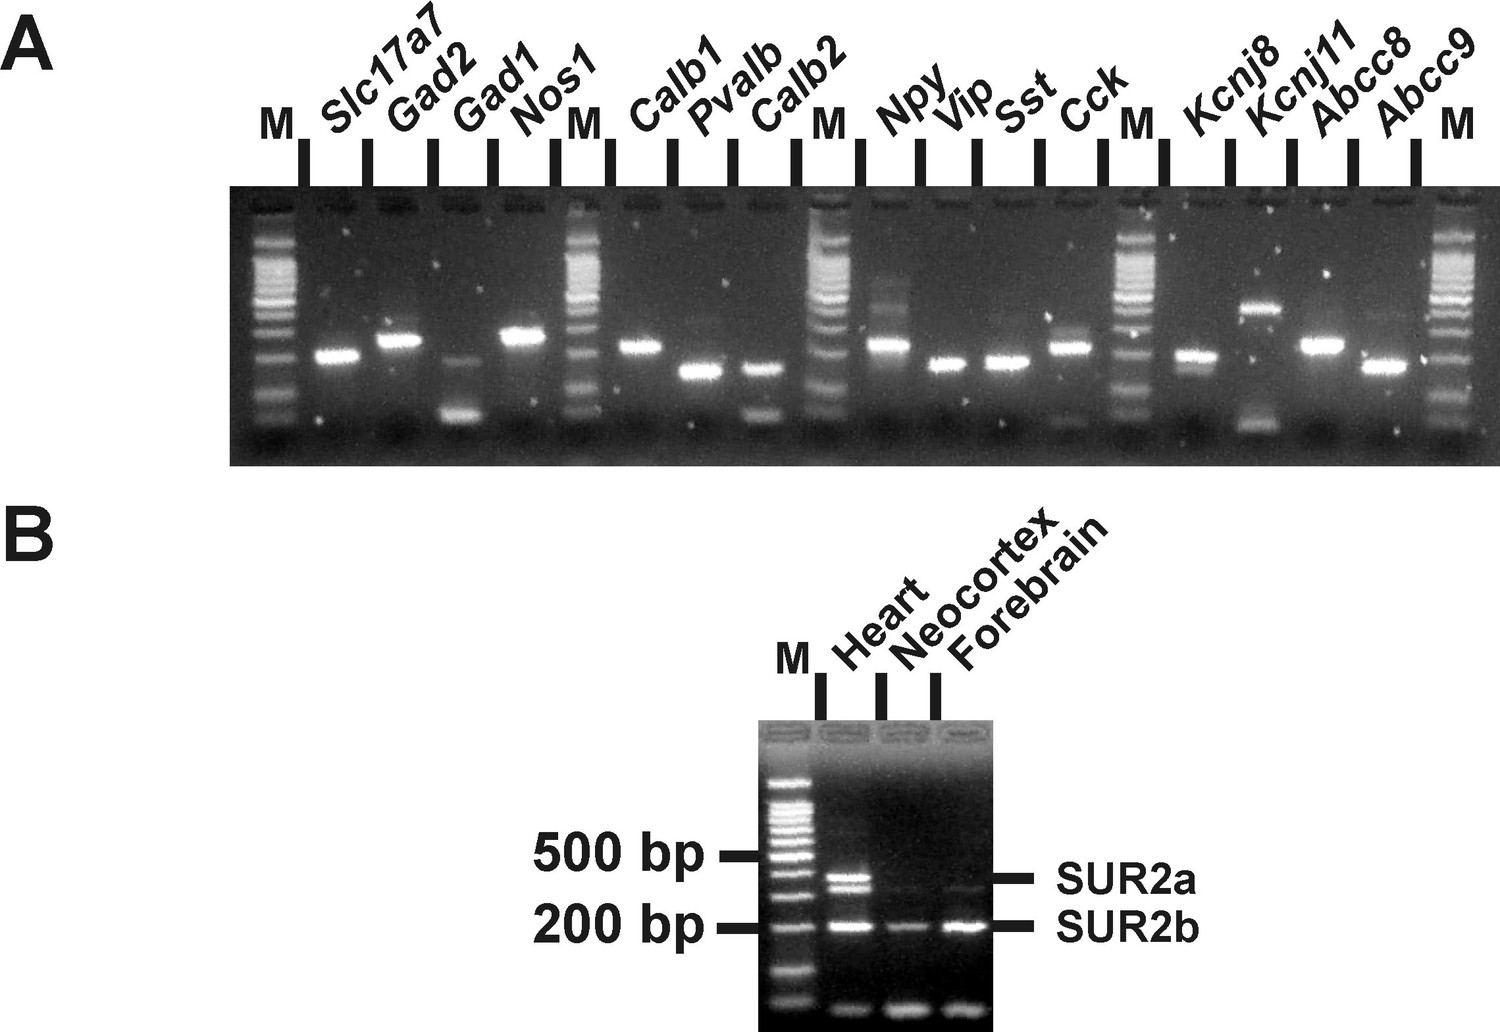
Molecular expression of KATP channels.
(A) RT-PCR products generated from 500 pg of total cortical RNAs. M: 100 bp ladder molecular weight marker. (B) Abcc9 splice variants-specific RT-PCR analysis of 1 ng total RNAs from rat heart, neocortex, and forebrain.
-
Figure 1—figure supplement 1—source data 1
Original file of the full raw unedited gel shown in Figure 1—figure supplement 1A.
- https://cdn.elifesciences.org/articles/71424/elife-71424-fig1-figsupp1-data1-v2.zip
-
Figure 1—figure supplement 1—source data 2
Uncropped gel shown in Figure 1—figure supplement 1A with relevant lanes labeled.
Yellow rectangles denote bands of the expected size.
- https://cdn.elifesciences.org/articles/71424/elife-71424-fig1-figsupp1-data2-v2.zip
-
Figure 1—figure supplement 1—source data 3
Original file of the full raw unedited gel shown in Figure 1—figure supplement 1B.
- https://cdn.elifesciences.org/articles/71424/elife-71424-fig1-figsupp1-data3-v2.zip
-
Figure 1—figure supplement 1—source data 4
Uncropped gel shown in Figure 1—figure supplement 1B with relevant bands labeled.
- https://cdn.elifesciences.org/articles/71424/elife-71424-fig1-figsupp1-data4-v2.zip
Figure 2 with 2 supplements

Pharmacological and biophysical characterization of KATP channels in cortical neurons.
(A) Representative voltage responses of a Fast Spiking-Parvalbumin (FS-Pvalb) interneuron induced by injection of current pulses (bottom traces). (B) Protocol of voltage pulses from −70 to −60 mV (left trace). Responses of whole-cell currents in the FS-Pvalb interneurons shown in (A) in control condition (black) and in presence of pinacidil (blue), piazoxide (green) and tolbutamide (red) at the time indicated by a–d in (C). (C) Stationary currents recorded at −60 mV (filled circles) and membrane resistance (open circles) changes induced by KATP channel modulators. The colored bars and shaded zones indicate the duration of application of KATP channel modulators. Upper and lower insets: changes in whole-cell currents and relative changes in membrane resistance induced by KATP channel modulators, respectively. (D) Whole-cell current–voltage relationships measured under diazoxide (green trace) and tolbutamide (red trace). KATP I/V curve (black trace) obtained by subtracting the curve under diazoxide by the curve under tolbutamide. The arrow indicates the reversal potential of KATP currents. Histograms summarizing the KATP current reversal potential (E, F) and relative KATP conductance (G,H) in identified neuronal subtypes (E, G) or between glutamatergic and GABAergic neurons (F, G). Data are expressed as mean ± standard error of the mean (SEM), and the individual data points are depicted. n.s., not statistically significant. *, ** and *** indicate statistically significant with p< 0.05, 0.01 and 0.001 respectively.
-
Figure 2—source data 1
Statistical analyses of whole-cell current and membrane resistance changes induced by KATP channel modulators (shown in Figure 2C insets).
- https://cdn.elifesciences.org/articles/71424/elife-71424-fig2-data1-v2.xls
-
Figure 2—source data 2
Statistical comparisons of KATP current reversal potential and relative KATP conductance between neuronal subtypes and groups (shown in Figure 2E–H) and of whole-cell KATP conductance and current density (shown in Figure 2—figure supplement 2).
- https://cdn.elifesciences.org/articles/71424/elife-71424-fig2-data2-v2.xls
Figure 2—figure supplement 1
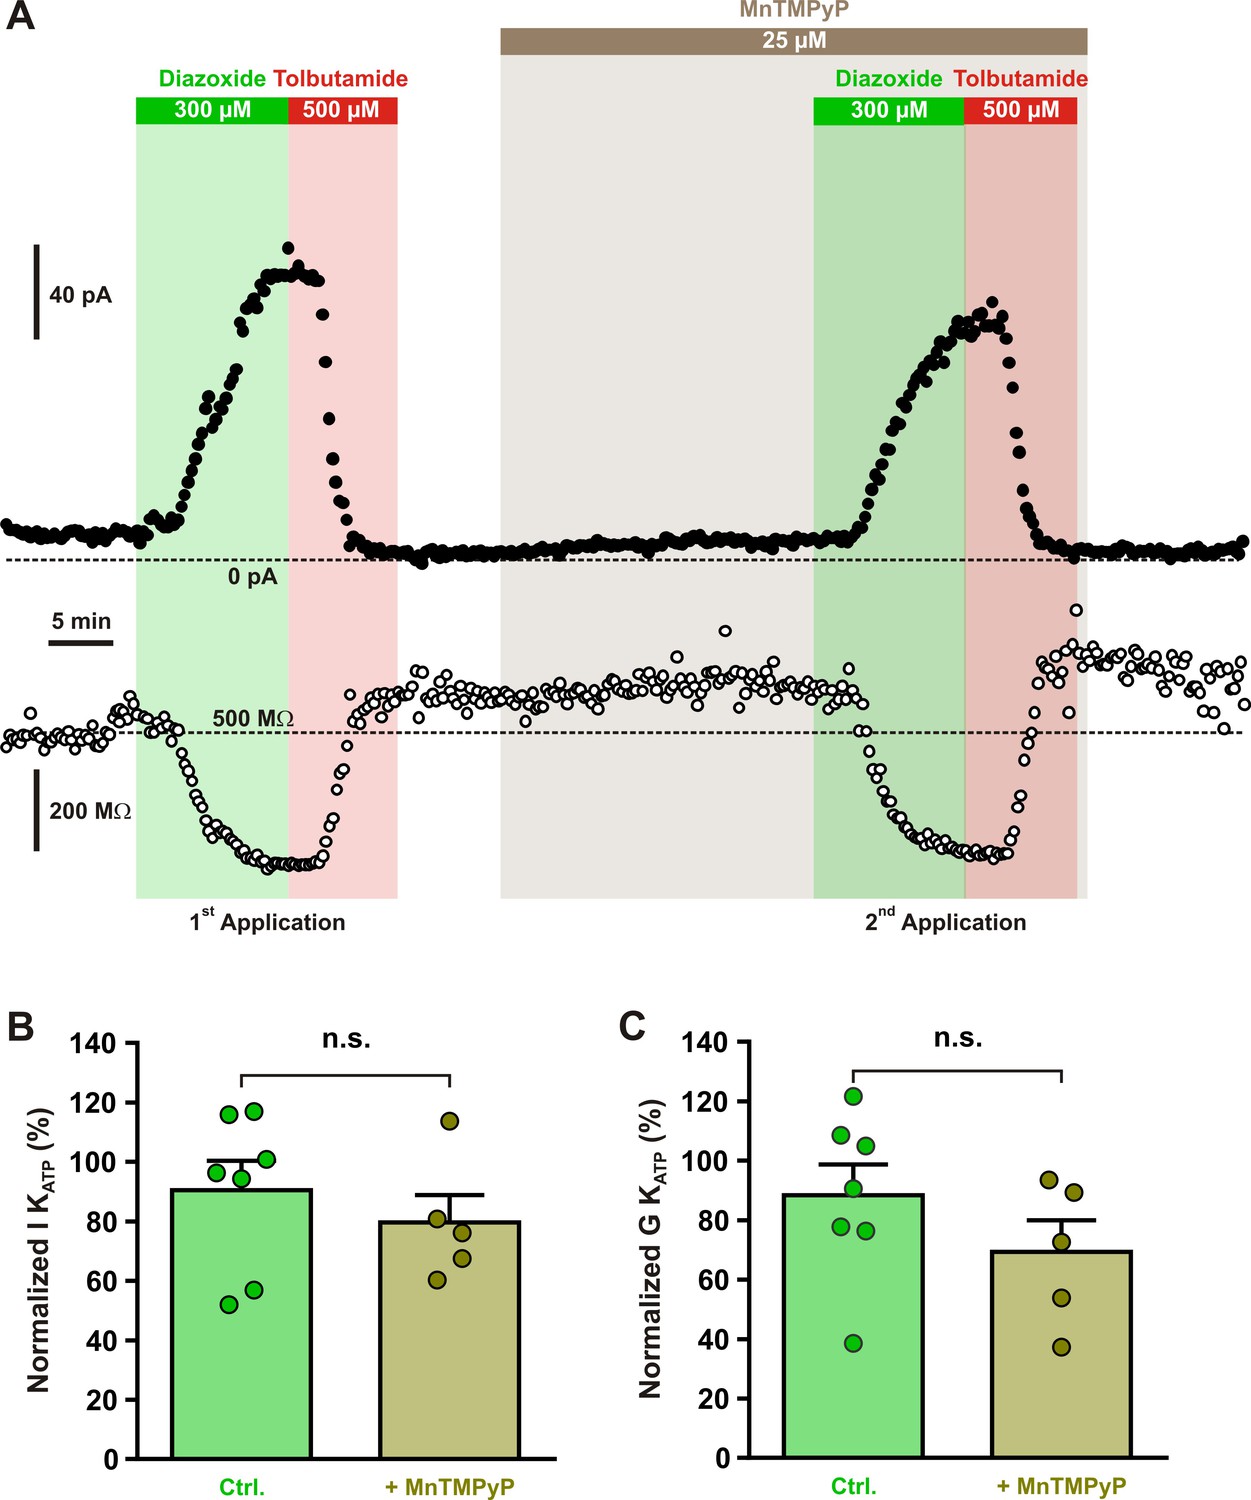
Diazoxide-induced current is independent of reactive oxygen species (ROS) production.
(A) Representative stationary currents at −60 mV (filled circles) and membrane resistance (open circles) changes induced by diazoxide and tolbutamide under control condition and in presence of the superoxide dismutase and catalase mimetic, MnTMPyP. The colored bars and shaded zones indicate the duration of application. Histograms summarizing the relative KATP currents (B) and relative whole-cell KATP conductance (C) evoked by two consecutive diazoxide and tolbutamide applications in control condition (Ctrl.) and after the presence of MnTMPyP. Data are normalized by the data measured during first application, expressed as mean ± standard error of the mean (SEM), and the individual data points are depicted. n.s., not statistically significant.
-
Figure 2—figure supplement 1—source data 1
Statistical analyses of the effect of MnTMPyP on normalized KATP currents and conducatnce whole-cell KATP conductance (shown in Figure 2—figure supplement 2B,C).
- https://cdn.elifesciences.org/articles/71424/elife-71424-fig2-figsupp1-data1-v2.xls
Figure 2—figure supplement 2
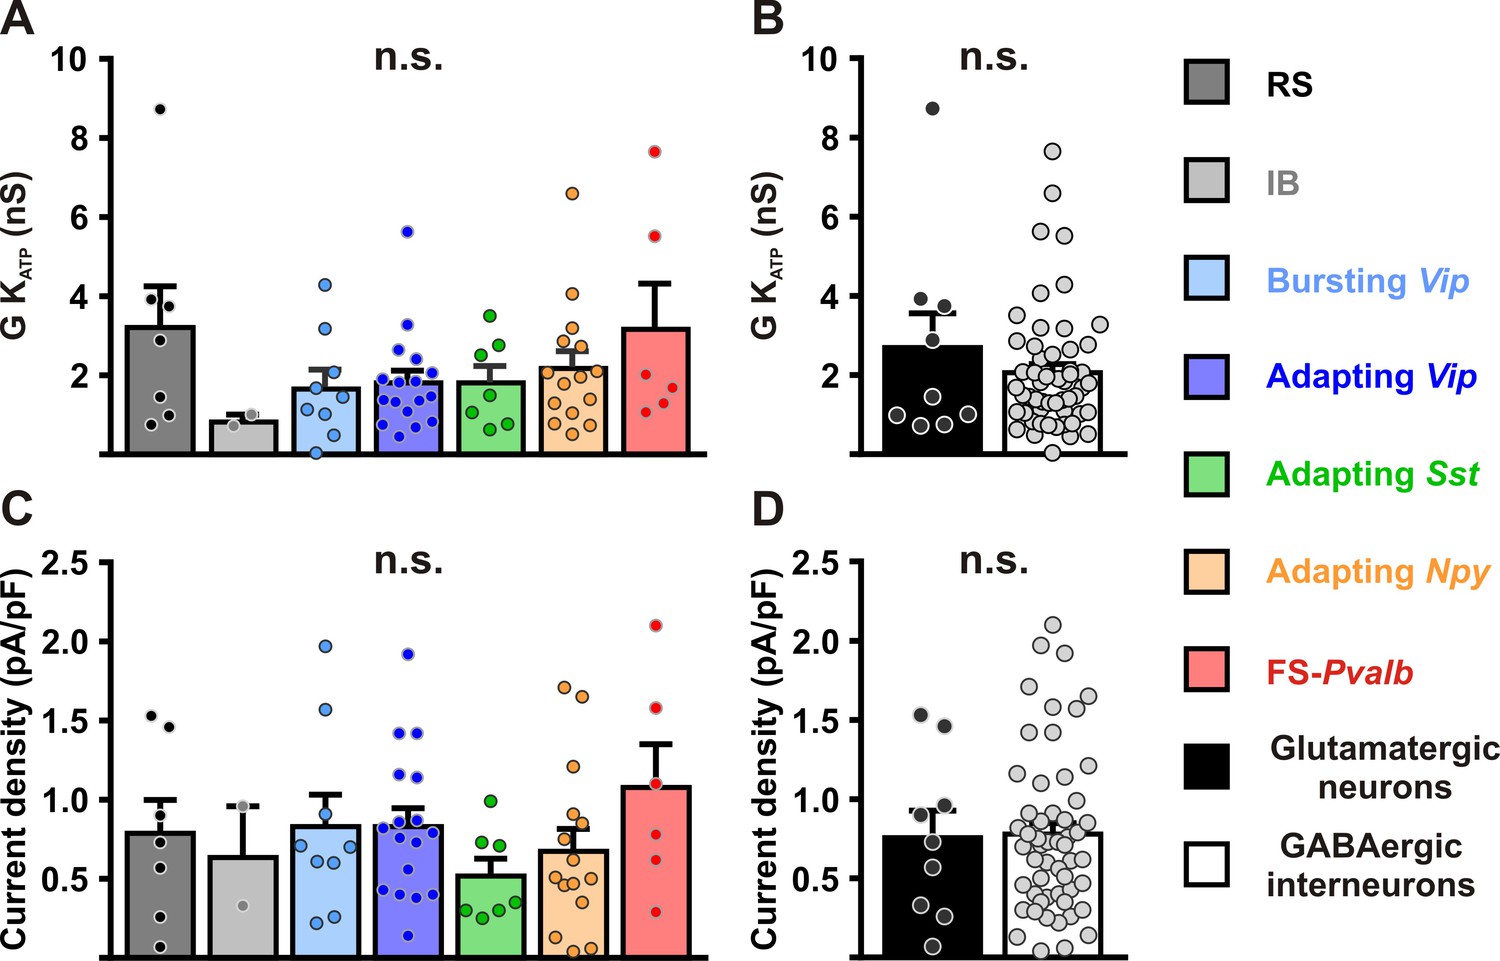
Characterization of KATP channels in different cortical neurons.
Histograms summarizing the whole-cell KATP conductance (A, B) and KATP current density (C, D) and KATP current reversal potential in identified neuronal subtypes (A,C) or between glutamatergic and GABAergic neurons (B,D). Data are expressed as mean ± standard error of the mean (SEM), and the individual data points are depicted. n.s., not statistically significant.
Figure 3
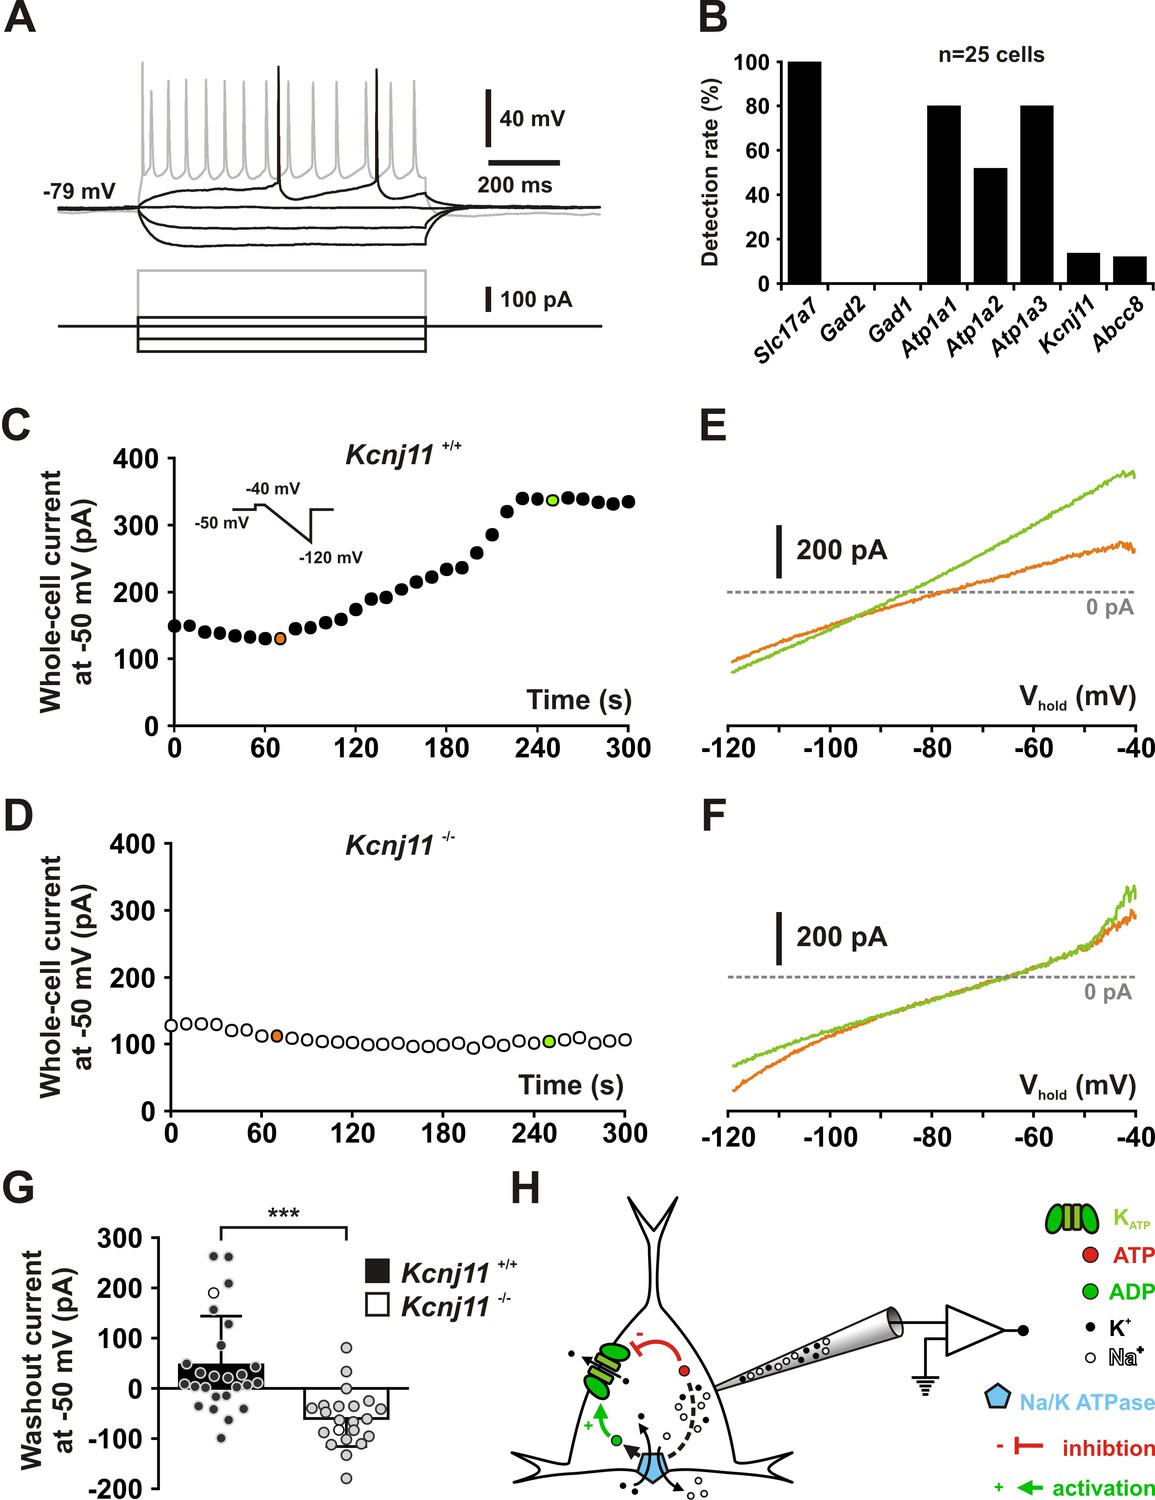
KCNJ11 is the pore-forming subunit of KATP channels in cortical neurons.
(A) Representative voltage responses of a mouse layer II/III regular spiking (RS) pyramidal cell induced by injection of current pulses (bottom traces). (B) Histograms summarizing the detection rate of Slc17a7, Gad2 and 1, the Atp1a1-3 subunits of the Na/K ATPase and the Kcnj11 and Abcc8 KATP channel subunits in layer II/III regular spiking (RS) pyramidal cells from Kcnj11+/+ mice. (C, D) Whole-cell stationary currents recorded at 50 mV during dialysis with ATP-free pipette solution in cortical neurons of Kcnj11+/+ (C) and Kcnj11−/− (D) mice. Inset: voltage clamp protocol. (E, F) Current–voltage relationships obtained during ATP washout at the time indicated by green and orange circles in (C, D) in cortical neurons of Kcnj11+/+ (E) and Kcnj11−/− (F) mice. (G) Histograms summarizing the whole-cell ATP washout currents in Kcnj11+/+ (black) and Kcnj11−/− (white) cortical neurons. Data are expressed as mean ± standard error of the mean (SEM), and the individual data points are depicted. Open symbols in Kcnj11+/+ and Kcnj11−/− bar plots indicate the cells illustrated in (C, D) and (E, F), respectively. (H) Diagram depicting the principle of the ATP washout experiment. *** indicates statistically significant with p< 0.001.
-
Figure 3—source data 1
Molecular profile of layer II–III pyramidal neurons shown in Figure 3B.
- https://cdn.elifesciences.org/articles/71424/elife-71424-fig3-data1-v2.xls
-
Figure 3—source data 2
Statistical analysis of whole-cell ATP washout currents in Kcnj11+/+ and Kcnj11−/− cortical neurons (shown in Figure 3G).
- https://cdn.elifesciences.org/articles/71424/elife-71424-fig3-data2-v2.xls
Figure 4 with 1 supplement
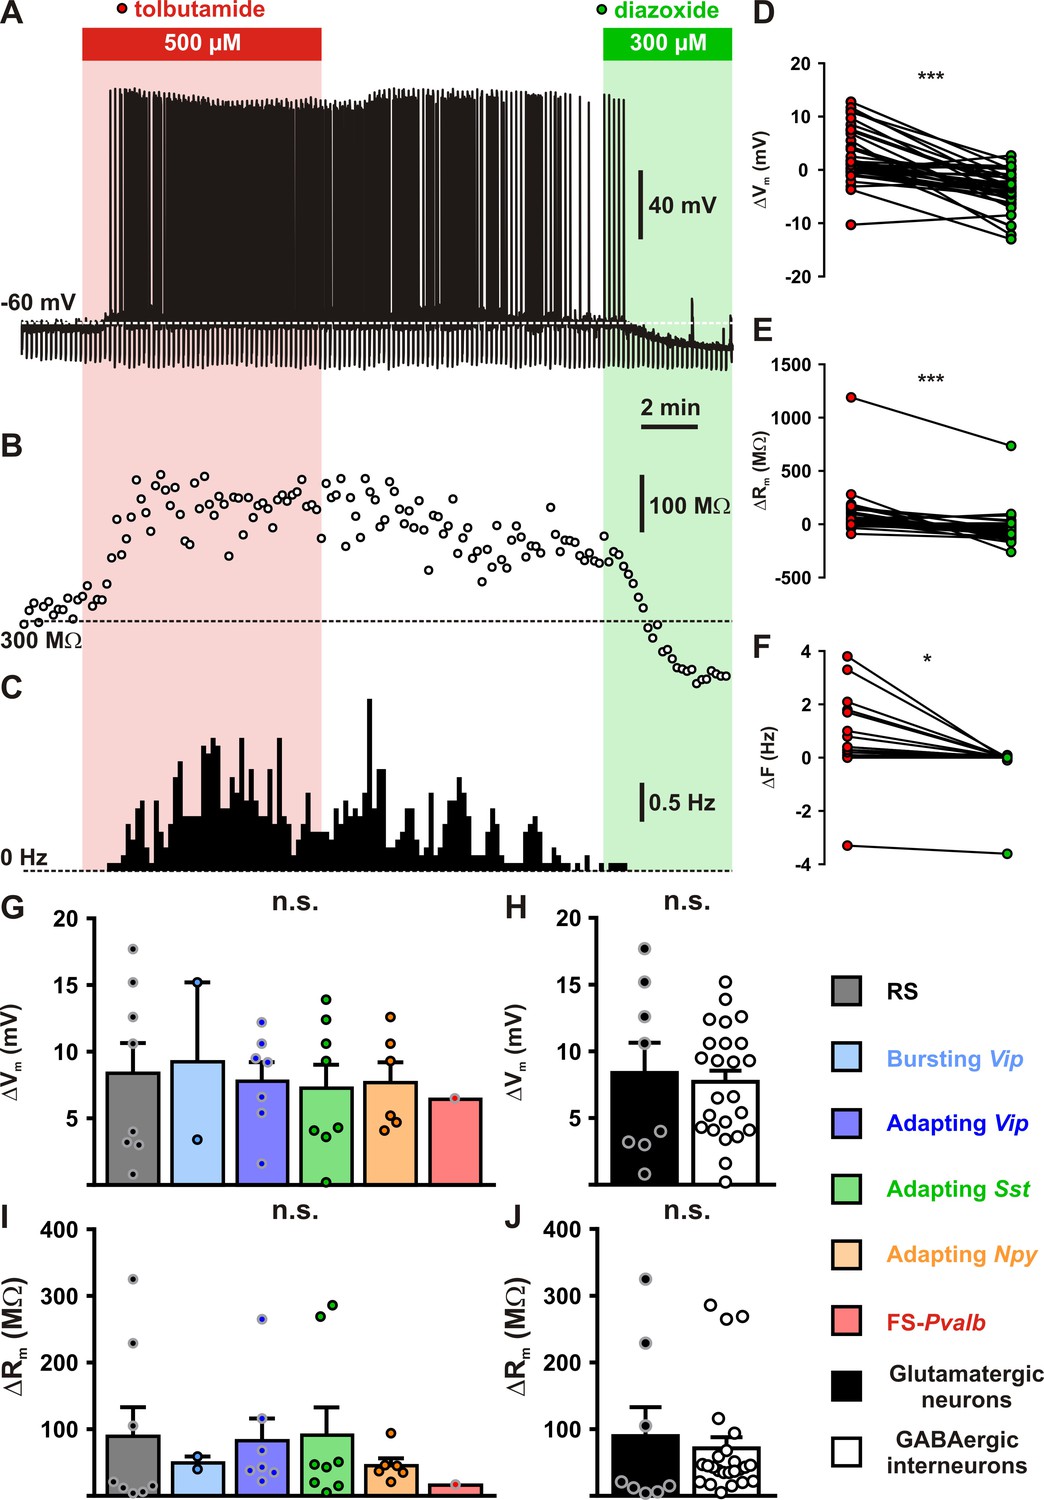
Modulation of cortical neuronal excitability and activity by KATP channels.
Representative example of a regular spiking (RS) neurons showing the changes in membrane potential (A), resistance (B, open circles) and spiking activity (C) induced by application of tolbutamide (red) and diazoxide (green). The colored bars and shaded zones indicate the application duration of KATP channel modulators. Relative changes in membrane potential (D), resistance (E), and firing rate (F) induced by tolbutamide and diazoxide in cortical neurons. Histograms summarizing the modulation of membrane potential (G, H(5,32) = 0.15856, p = 0.999, and H, U(8,24) = 96, p = 1.0000) and resistance (I, H(5,32) = 2.7566, p = 0.737, and J, U(8,24) = 73, p = 0.3345) by KATP channels in neuronal subtypes (G, I) and groups (H, J). Data are expressed as mean ± standard error of the mean (SEM), and the individual data points are depicted. n.s., not statistically significant. * and *** indicate statistically ignificant with p<0.05 and 0.001.
-
Figure 4—source data 1
Statistical analyses of membrane potential, membrane resistance and firing rate changes induced by KATP channel modulators (shown in Figure 4D, E).
- https://cdn.elifesciences.org/articles/71424/elife-71424-fig4-data1-v2.xls
-
Figure 4—source data 2
Statistical comparisons between neuronal subtypes and groups of the effect KATP channel modulators on membrane potential, membrane resistance (shown in Figure 4G–J) and firing rate (shown in Figure 4—figure supplement 1C,D) as well as of the proportion of responsive neurons (shown in Figure 4—figure supplement 1A,B).
- https://cdn.elifesciences.org/articles/71424/elife-71424-fig4-data2-v2.xls
Figure 4—figure supplement 1
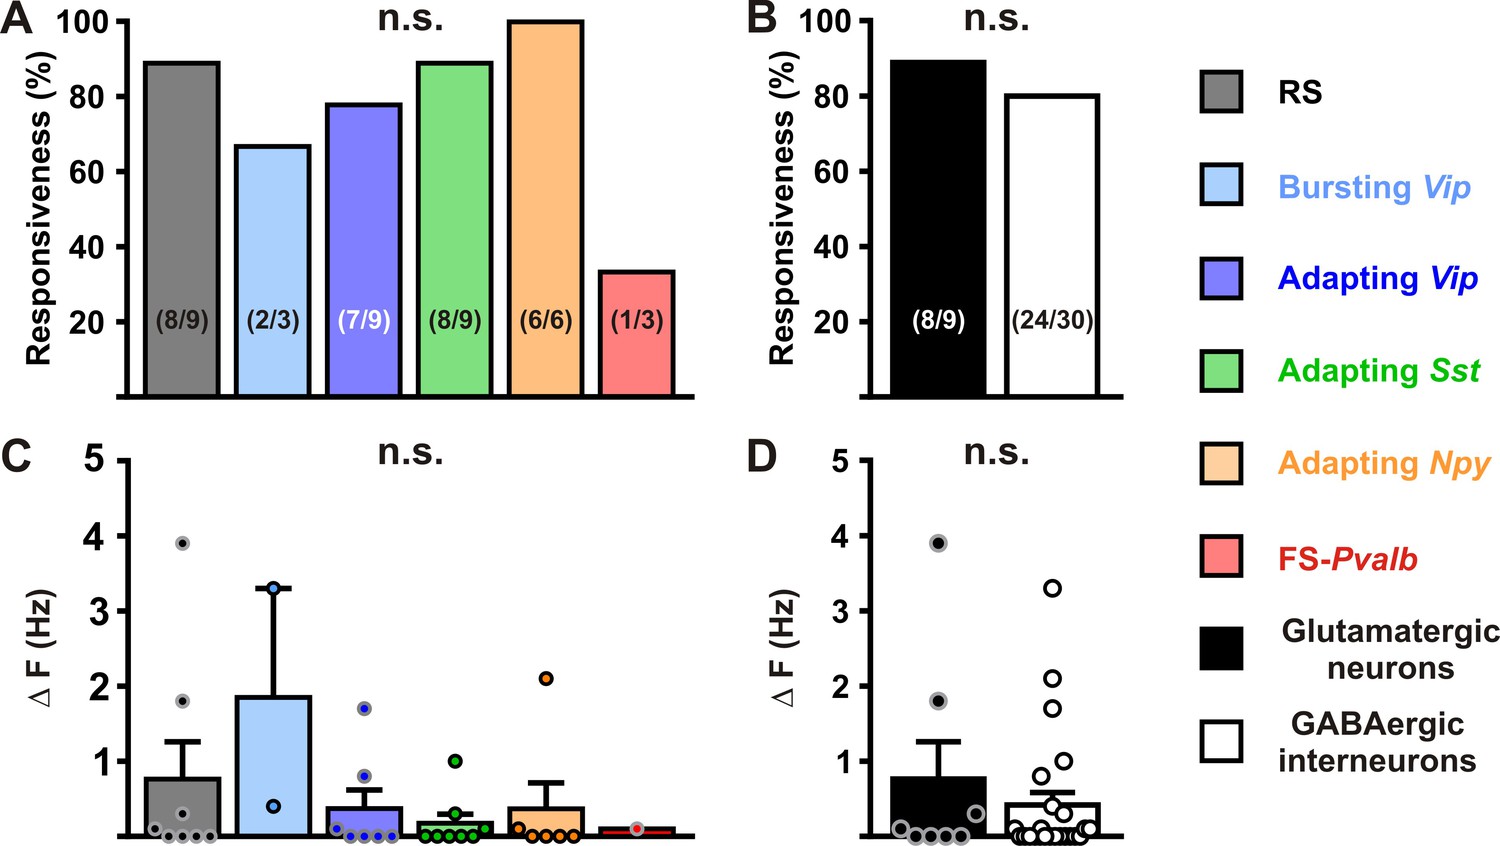
Modulation of neuronal activity in different cortical neurons by KATP channels.
Histograms summarizing the proportion of responsive neurons (A, Κ2(5) = 7.3125, p = 0.1984, and B, p = 1.0000) and modulation firing rate (C, H(5,32) = 5.0202, p = 0.413, and D, U(8,24) = 87, p = 0.7169) by KATP channels in neuronal subtypes (A, C) and groups (B, D). The numbers in brackets indicate the number of responsive cells and analyzed cells, respectively. Data are expressed as mean ± standard error of the mean (SEM), and the individual data points are depicted. n.s., not statistically significant.
Figure 5
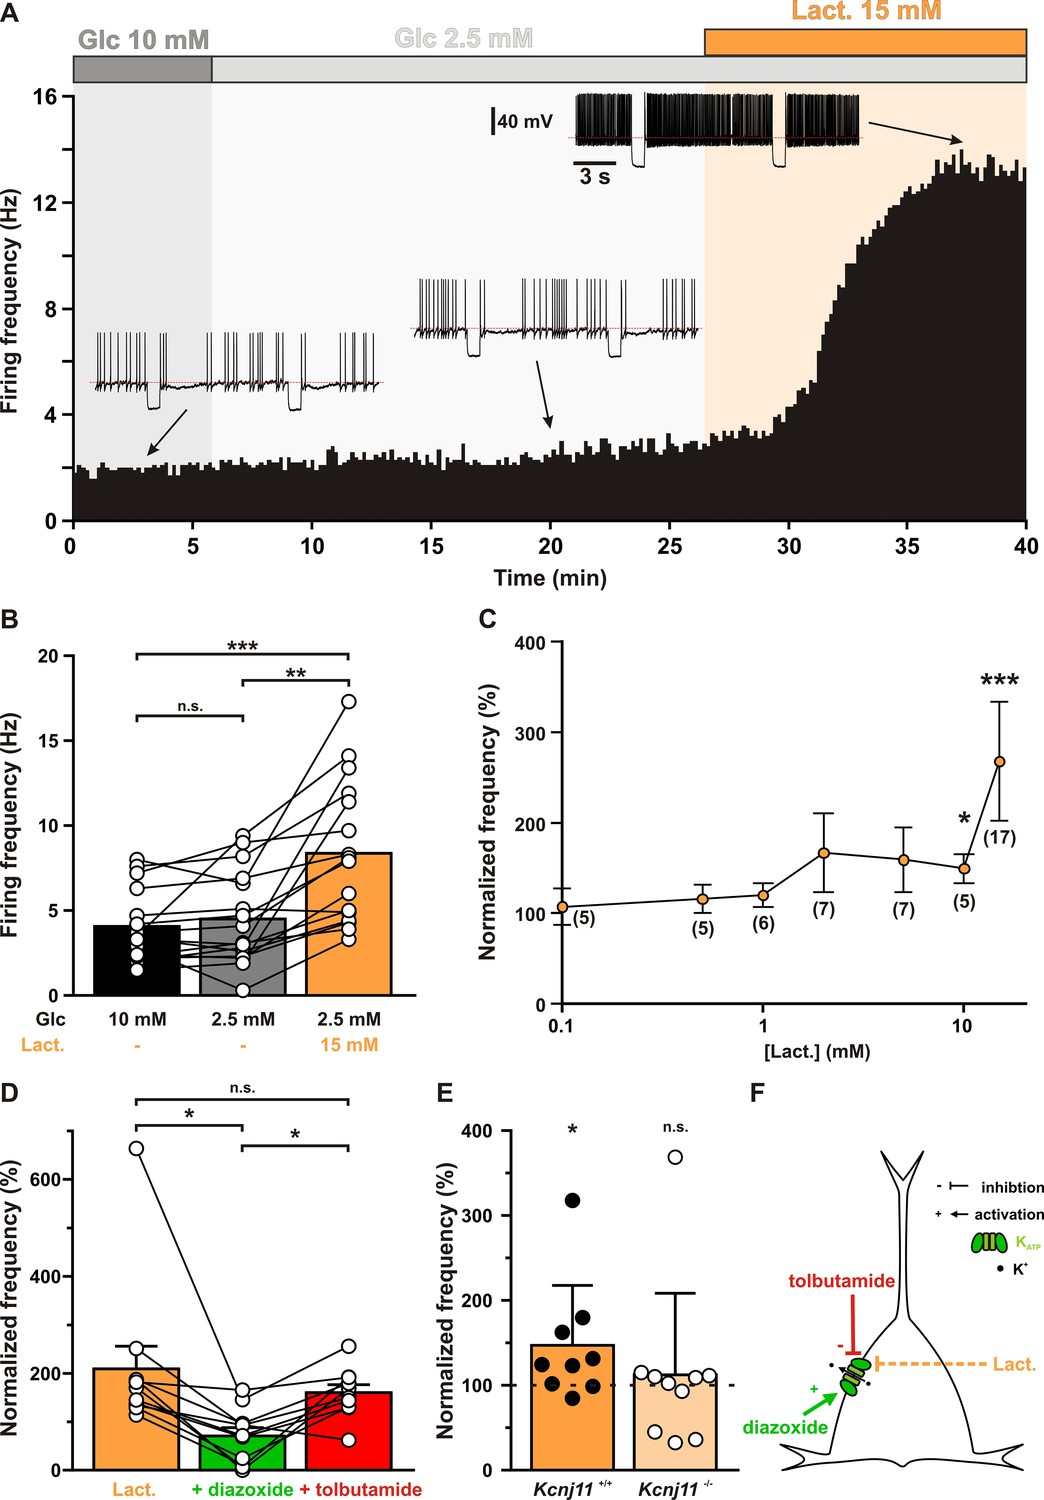
Lactate enhances cortical neuronal activity via KATP channel modulation.
(A) Representative perforated patch recording of an adapting vasoactive intestinal polypeptide (VIP) neuron showing the modulation of firing frequency induced by changes in the extracellular concentrations of metabolites. The colored bars and shaded zones indicate the concentration in glucose (gray) and lactate (orange). Voltage responses recorded at the time indicated by arrows. The red dashed lines indicate −40 mV. (B) Histograms summarizing the mean firing frequency during changes in extracellular concentration of glucose (black and gray) and lactate (orange). Data are expressed as mean ± standard error of the mean (SEM), and the individual data points are depicted. n.s., not statistically significant. *, ** and *** indicate statistically significant with p< 0.05, 0.01 and 0.001, respectively. (C) Dose-dependent enhancement of firing frequency by lactate. Data are normalized by the mean firing frequency in absence of lactate and are expressed as mean ± SEM. Numbers in brackets indicate the number of recorded neurons at different lactate concentrations. (D) Histograms summarizing the normalized frequency under 15 mM lactate (orange) and its modulation by addition of diazoxide (green) or tolbutamide (red). Data are expressed as mean ± SEM, and the individual data points are depicted. n.s., not statistically significant. (E) Histograms summarizing the enhancement of normalized frequency by 15 mM lactate in Kcnj11+/+ (orange) and Kcnj11−/− (pale orange) mouse cortical neurons. The dash line indicates the normalized mean firing frequency in absence of lactate. Data are expressed as mean ± SEM, and the individual data points are depicted. (F) Diagram depicting the enhancement of neuronal activity by lactate via modulation of KATP channels.
-
Figure 5—source data 1
Statistical analysis of the effect of glucose and lactate on firing rate (shown in Figure 5B).
- https://cdn.elifesciences.org/articles/71424/elife-71424-fig5-data1-v2.xls
-
Figure 5—source data 2
Statistical analysis of dose-dependent enhancement of firing frequency by lactate (shown in Figure 5C).
- https://cdn.elifesciences.org/articles/71424/elife-71424-fig5-data2-v2.xls
-
Figure 5—source data 3
Statistical analysis of the effect of diazoxide and tolbutamide on firing rate enhancement by lactate (shown in Figure 5D).
- https://cdn.elifesciences.org/articles/71424/elife-71424-fig5-data3-v2.xls
-
Figure 5—source data 4
Statistical comparison of lactate enhancement of normalized frequency in Kcnj11+/+ and Kcnj11−/− (shown in Figure 5E).
- https://cdn.elifesciences.org/articles/71424/elife-71424-fig5-data4-v2.xls
Figure 6 with 2 supplements
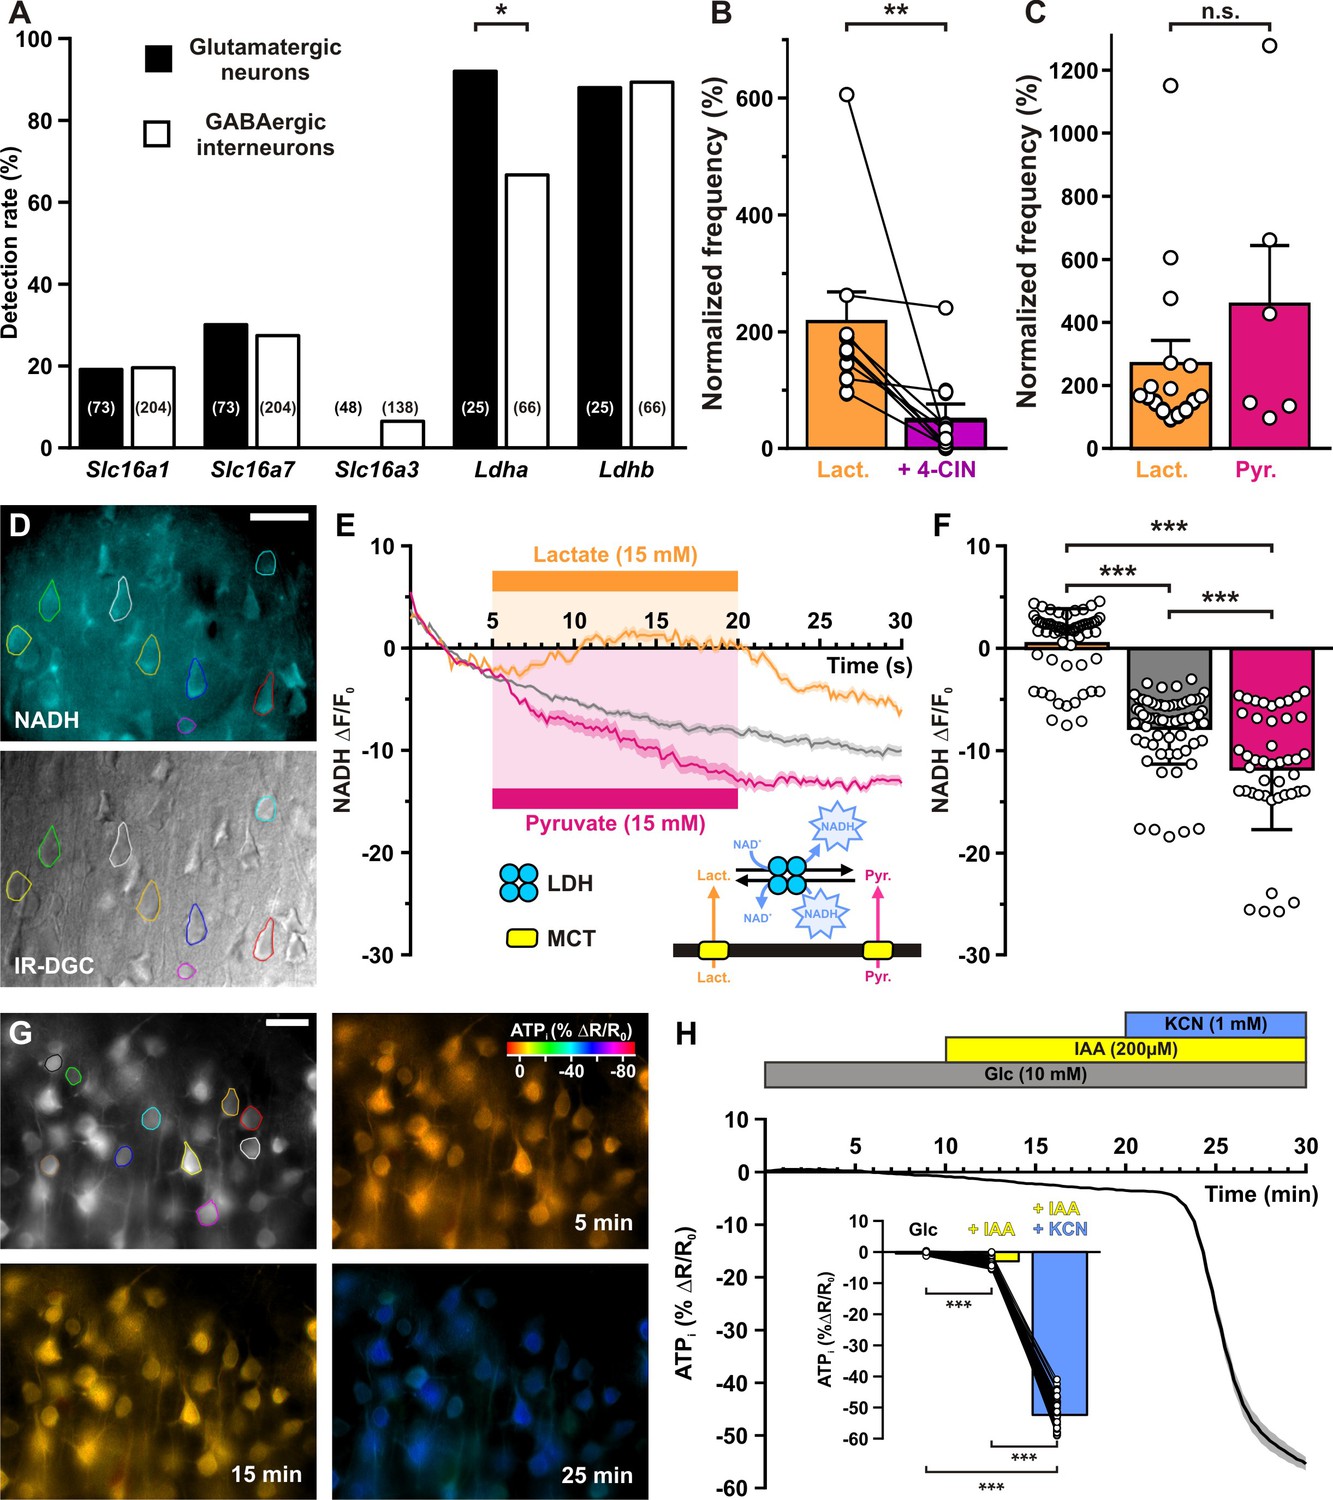
Lactate enhancement of cortical neuronal activity involves lactate uptake and metabolism.
(A) Histograms summarizing the detection rate of the monocarboxylate transporters Slc16a1, 7, and 3 and Ldha and b lactate dehydrogenase subunits in glutamatergic neurons (black) and GABAergic interneurons (white). The numbers in brackets indicate the number of analyzed cells. (B) Histograms summarizing the enhancement of normalized frequency by 15 mM lactate (orange) and its suppression by the monocarboxylate transporters (MCTs) inhibitor α-cyano-4-hydroxycinnamic acid (4-CIN; purple). Data are expressed as mean ± standard error of the mean (SEM), and the individual data points are depicted. (C) Histograms summarizing the enhancement of normalized frequency by 15 mM lactate (orange) and pyruvate (magenta). Data are expressed as mean ± SEM, and the individual data points are depicted n.s., not statistically significant. (D) Widefield NADH (reduced form of nicotinamide adenine dinucleotide) autofluorescence (upper panel, scale bar: 20 µm) and corresponding field of view observed under IR-DGC (lower panel). The somatic regions of interest are delineated. (E) Mean relative changes in NADH autofluorescence in control condition (gray) and in response to 15 mM lactate (orange) or pyruvate (magenta). The colored bars indicate the duration of applications. Data are expressed as mean ± SEM. Inset: diagram depicting the NADH changes induced by lactate and pyruvate uptake by MCT and their interconversion by lactate dehydrogenase (LDH). (F) Histograms summarizing the mean relative changes in NADH autofluorescence measured during the last 5 min of 15 mM lactate (orange) or pyruvate (magenta) application and corresponding time in control condition (gray). Data are expressed as mean ± SEM, and the individual data points are depicted. (G) Widefield YFP fluorescence of the ATP biosensor AT1.03YEMK (upper left panel, scale bar: 30 µm) and pseudocolor images showing the intracellular ATP (YFP/CFP ratio value coded by pixel hue, see scale bar in upper right panel) and the fluorescence intensity (coded by pixel intensity) at different times under 10 mM extracellular glucose (upper right panel) and after addition of iodoacetic acid (IAA; lower left panel) and potassium cyanide (KCN; lower right panel). (H) Mean relative changes in intracellular ATP (relative YFP/CFP ratio) measured under 10 mM extracellular glucose (gray) and after addition of IAA (yellow) and KCN (blue). Data are expressed as mean ± SEM. The colored bars indicate the time and duration of metabolic inhibitor application. Inset: Histograms summarizing the mean relative changes in intracellular ATP (relative YFP/CFP ratio) ratio under 10 mM extracellular glucose (gray) and after addition of IAA (yellow) and KCN (blue). Data are expressed as mean ± SEM, and the individual data points are depicted. *, ** and *** indicate statistically significant with p< 0.05, 0.05 and 0.001, respectively.
-
Figure 6—source data 1
Statistcal comparisons of the detection rate of monocarboxylate transporters and lactate dehydrogenase subunits between neuronal groups (shown in Figure 6A) and subtypes (shown in Figure 6—figure supplement 1).
- https://cdn.elifesciences.org/articles/71424/elife-71424-fig6-data1-v2.xls
-
Figure 6—source data 2
Statistical analysis of the effect of monocarboxylate transporter (MCT) inhibition by α-cyano-4-hydroxycinnamic acid (4-CIN) on lactate-enhanced firing rate (shown in Figure 6B).
- https://cdn.elifesciences.org/articles/71424/elife-71424-fig6-data2-v2.xls
Figure 6—figure supplement 1
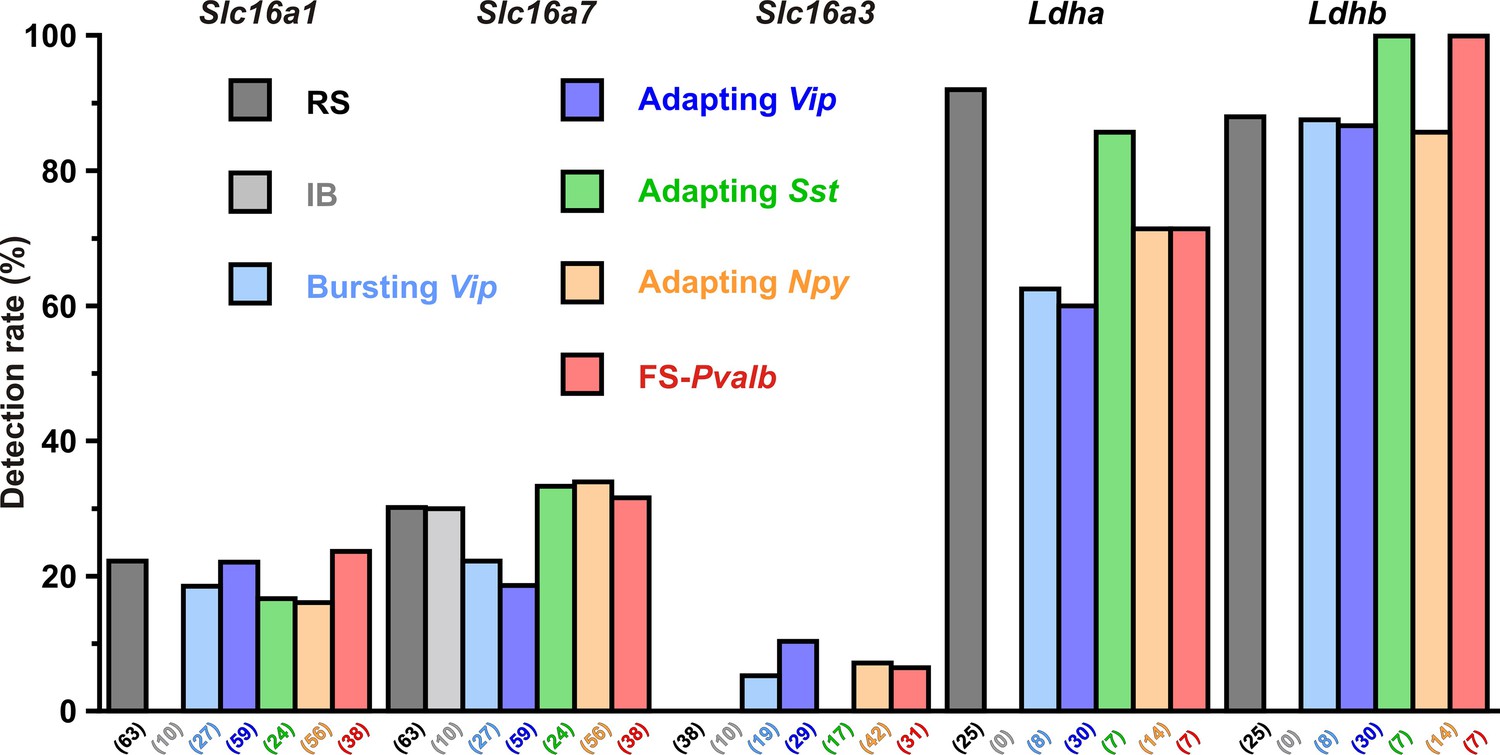
Detection rate of monocarboxylate transporters and lactate dehydrogenase subunits in different cortical neuronal types.
Histograms summarizing the detection rate of the monocarboxylate transporterMCTs Slc16a1, 7, and 3 and Ldha and b LDHlactate dehydrogenase subunits in different neuronal subtypes. The numbers in brackets indicate the number of analyzed cells.
Figure 6—figure supplement 2
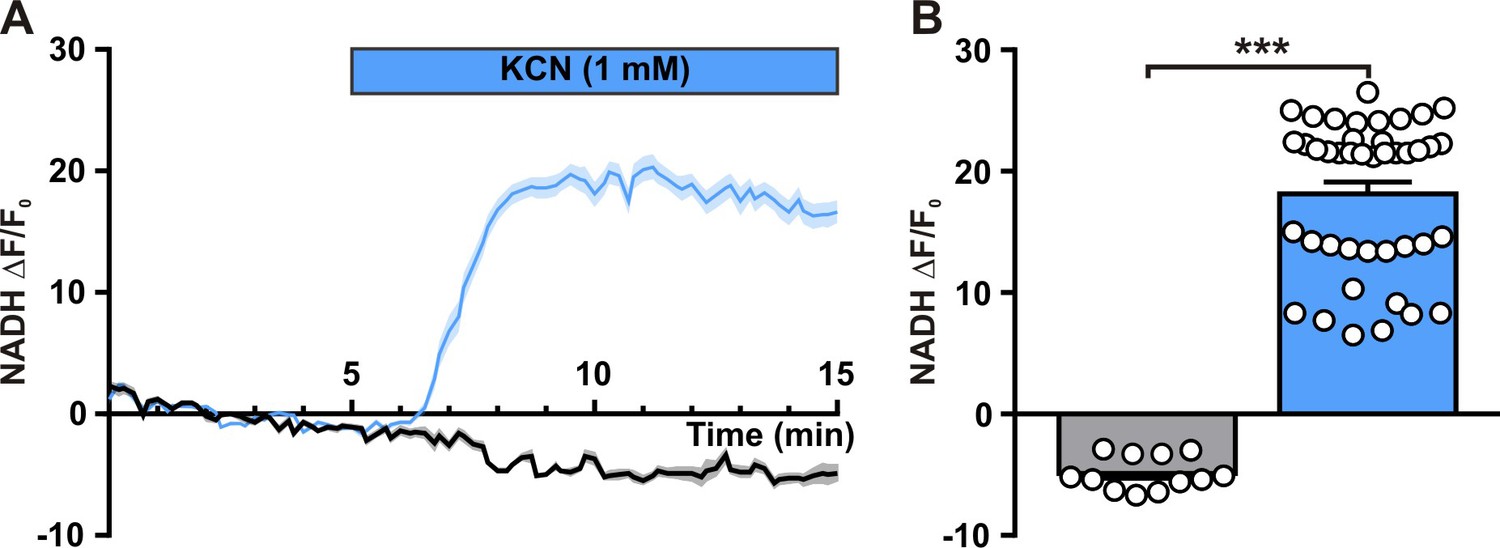
Neuronal NADH autofluorescence increase by blockade of oxidative phosphorylation.
(A) Mean relative changes in NADH autofluorescence in control condition (gray) and in response to 1 mM potassium cyanide (KCN; blue). The colored bar indicates the duration of KCN applications. Data are expressed as mean ± SEM. (B) Histograms summarizing the mean relative changes in NADH autofluorescence measured during the last 5 min of 1 mM KCN application (blue) and corresponding time in control condition (gray). Data are expressed as mean ± SEM, and the individual data points are depicted. *** indicates statistically significant with p < 0.001.
-
Figure 6—figure supplement 2—source data 1
Statistcal analysis of effect of potassium cyanide (KCN) on the mean relative changes in NADH autofluorescence (shown in Figure 6—figure supplement 2).
- https://cdn.elifesciences.org/articles/71424/elife-71424-fig6-figsupp2-data1-v2.xls
Figure 7
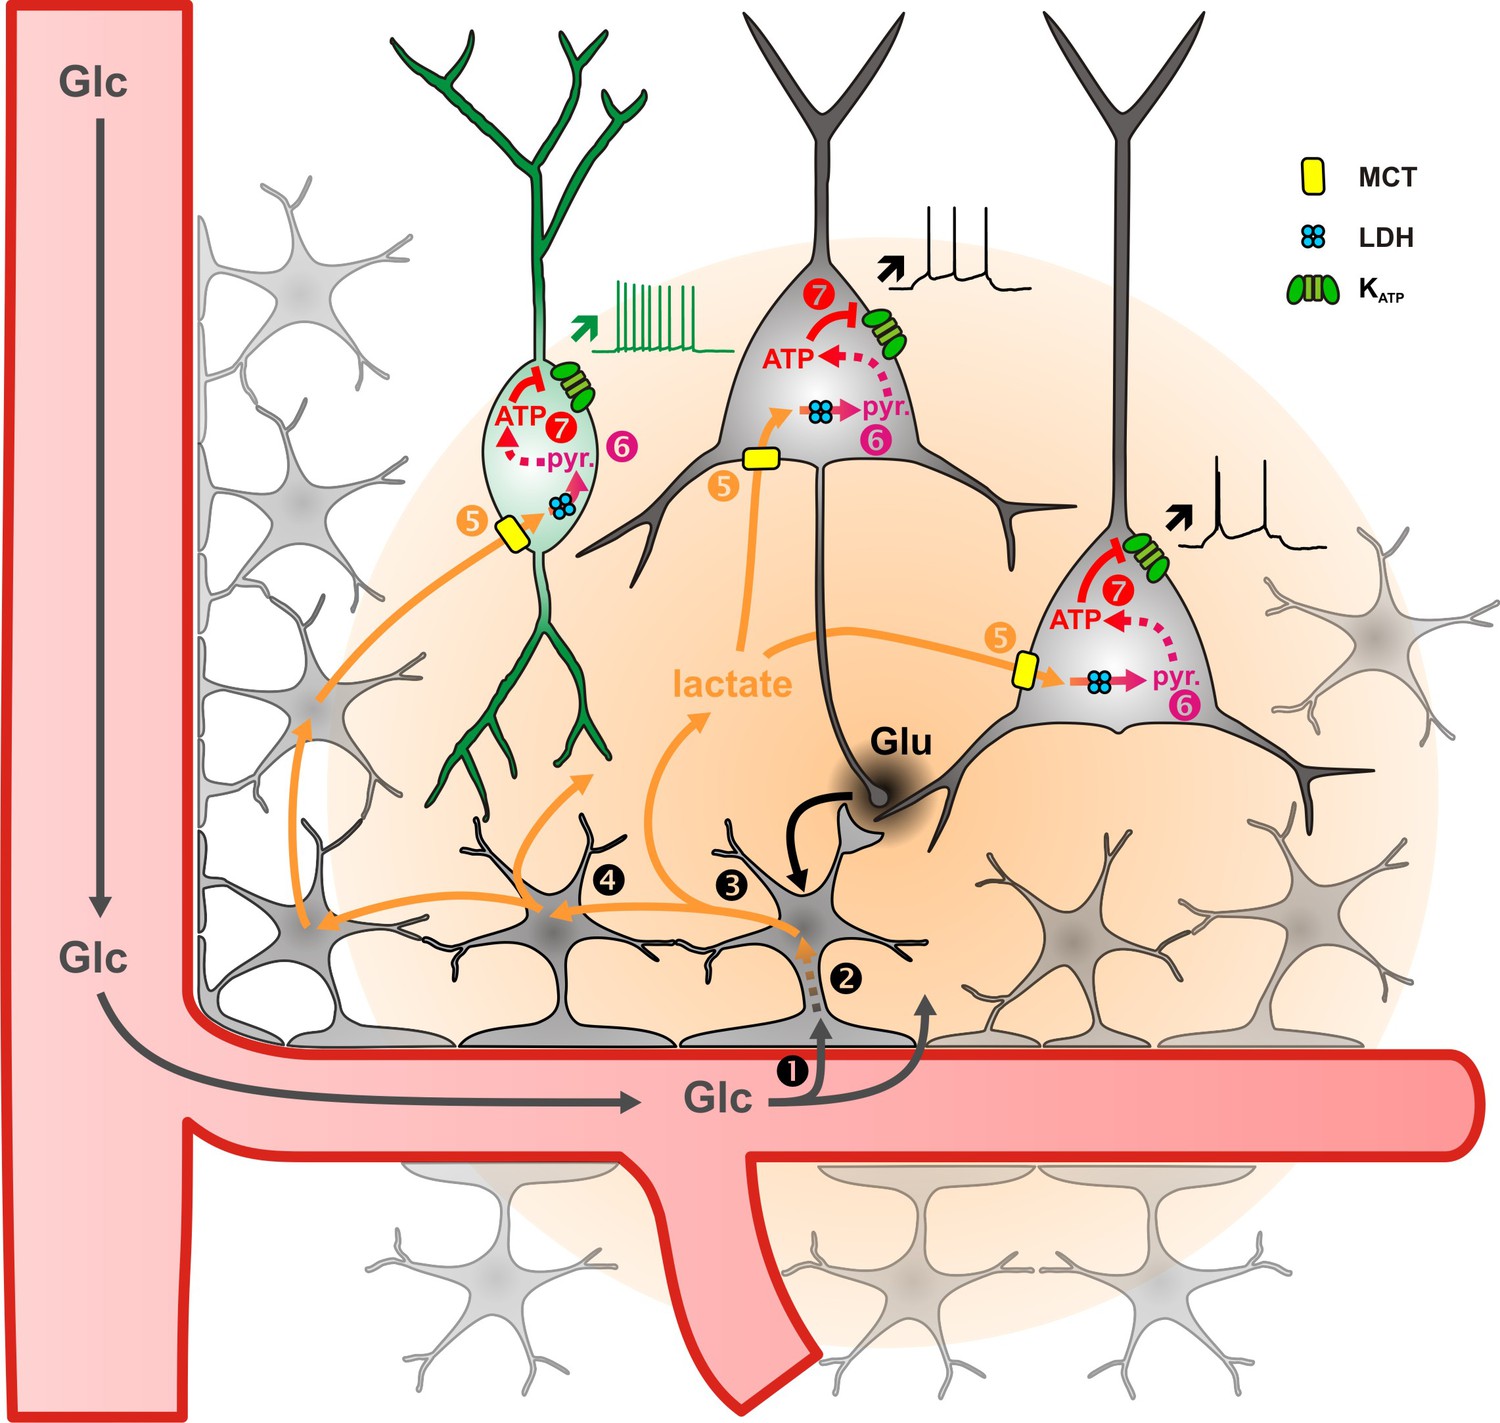
Diagram summarizing the mechanism of lactate sensing in the cortical network.
Glutamate (Glu) released during synaptic transmission stimulates (1) blood glucose (Glc) uptake in astrocytes, (2) aerobic glycolysis, (3) lactate release, and (4) diffusion through the astrocytic network. Lactate is then (5) taken up by neurons via monobarboxylate transporters (MCT) and (6) oxidized into pyruvate by lactate dehydrogenase (LDH). The ATP produced by pyruvate oxidative metabolism (7) closes KATP channels and increases the spiking activity of both pyramidal cells (black) and inhibitory interneurons (green). The color gradient of the circles represents the extent of glutamate (black) and lactate (orange) diffusion, respectively. Dashed arrows indicate multisteps reactions.
Tables
Appendix 1—key resources table
| Reagent type (species) or resource | Designation | Source or reference | Identifiers | Additional information |
|---|---|---|---|---|
| Strain, strain background (Rattus norvegicus, Wistar, male) | Wistar | Janvier Labs | jHan:WI | |
| Strain, strain background (Mus musculus, C57BL/6RJ, male and female) | Wild type, Kcnj11 +/+ | Janvier Labs | C57BL/6RJ | |
| Strain, strain background (Mus musculus, B6.129P2, male and female) | B6.129P2-Kcnj11tm1Sse, Kcnj11−/− | PMID:9724715 (Miki et al., 1998) | RRID: MGI:5433111 | |
| Cell line (Mesocricetus auratus) | BHK-21 clone 13 (baby hamster kidneys fibroblasts) | ATCC | CCL-10, RRID: CVCL_1915 | |
| Recombinant DNA reagent | pcDNA-ATeam1.03YEMK (plasmid) | PMID:19720993( Imamura et al., 2009) | ||
| Recombinant DNA reagent | pSinRep5 (plasmid) | Invitrogen | K750-01 | |
| Recombinant DNA reagent | pDH(26 S) (helper plasmid) | Invitrogen | K750-01 | |
| Sequence-based reagent | rat Slc17a7 external sense | PMID:16339088 (Gallopin et al., 2006) | PCR primers | GGCTCCTTTTTCTGGGGGTAC |
| Sequence-based reagent | rat Slc17a7 external antisense | PMID:16339088 (Gallopin et al., 2006) | PCR primers | CCAGCCGACTCCGTTCTAAG |
| Sequence-based reagent | rat Slc17a7 internal sense | PMID:16339088 (Gallopin et al., 2006) | PCR primers | TGGGGGTACATTGTCACTCAGA |
| Sequence-based reagent | rat Slc17a7 internal antisense | PMID:16339088 (Gallopin et al., 2006) | PCR primers | ATGGCAAGCAGGGTATGTGAC |
| Sequence-based reagent | rat/mouse Gad2 external sense | PMID:19295167 (Karagiannis et al., 2009) | PCR primers | CCAAAAGTTCACGGGCGG |
| Sequence-based reagent | rat/mouse Gad2 external antisense | PMID:19295167 (Karagiannis et al., 2009) | PCR primers | TCCTCCAGATTTTGCGGTTG |
| Sequence-based reagent | rat Gad2 internal sense | PMID:19295167 (Karagiannis et al., 2009) | PCR primers | TGAGAAGCCAGCAGAGAGCG |
| Sequence-based reagent | rat Gad2 internal antisense | PMID:19295167 (Karagiannis et al., 2009) | PCR primers | TGGGGTAATGGAAATCAATCACTT |
| Sequence-based reagent | rat Gad1 external sense | PMID:19295167 (Karagiannis et al., 2009) | PCR primers | ATGATACTTGGTGTGGCGTAGC |
| Sequence-based reagent | rat Gad1 external antisense | PMID:19295167 (Karagiannis et al., 2009) | PCR primers | GTTTGCTCCTCCCCGTTCTTAG |
| Sequence-based reagent | rat Gad1 internal sense | PMID:19295167 (Karagiannis et al., 2009) | PCR primers | CAATAGCCTGGAAGAGAAGAGTCG |
| Sequence-based reagent | rat Gad1 internal antisense | PMID:19295167 (Karagiannis et al., 2009) | PCR primers | GTTTGCTCCTCCCCGTTCTTAG |
| Sequence-based reagent | rat Nos1 external sense | PMID:19295167 (Karagiannis et al., 2009) | PCR primers | CCTGGGGCTCAAATGGTATG |
| Sequence-based reagent | rat Nos1 external antisense | PMID:19295167 (Karagiannis et al., 2009) | PCR primers | CACAATCCACACCCAGTCGG |
| Sequence-based reagent | rat Nos1 internal sense | PMID:19295167 (Karagiannis et al., 2009) | PCR primers | CCTCCCCGCTGTGTCCAA |
| Sequence-based reagent | rat Nos1 internal antisense | PMID:19295167 (Karagiannis et al., 2009) | PCR primers | GAGTGGTGGTCAACGATGGTCA |
| Sequence-based reagent | rat Calb1 external sense | PMID:19295167 (Karagiannis et al., 2009) | PCR primers | GAAAGAAGGCTGGATTGGAG |
| Sequence-based reagent | rat Calb1 external antisense | PMID:19295167 (Karagiannis et al., 2009) | PCR primers | CCCACACATTTTGATTCCCTG |
| Sequence-based reagent | rat Calb1 internal sense | PMID:19295167 (Karagiannis et al., 2009) | PCR primers | ATGGGCAGAGAGATGATGGG |
| Sequence-based reagent | rat Calb1 internal antisense | PMID:19295167 (Karagiannis et al., 2009) | PCR primers | TATCATCCACGGTCTTGTTTGC |
| Sequence-based reagent | rat Pvalb external sense | PMID:19295167 (Karagiannis et al., 2009) | PCR primers | GCCTGAAGAAAAAGAGTGCGG |
| Sequence-based reagent | rat Pvalb external antisense | PMID:19295167 (Karagiannis et al., 2009) | PCR primers | GTCCCCGTCCTTGTCTCCAG |
| Sequence-based reagent | rat Pvalb internal sense | PMID:19295167 (Karagiannis et al., 2009) | PCR primers | GCGGATGATGTGAAGAAGGTG |
| Sequence-based reagent | rat Pvalb internal antisense | PMID:19295167 (Karagiannis et al., 2009) | PCR primers | CAGCCATCAGCGTCTTTGTT |
| Sequence-based reagent | rat Calb2 external sense | PMID:19295167 (Karagiannis et al., 2009) | PCR primers | TTGATGCTGACGGAAATGGGTA |
| Sequence-based reagent | rat Calb2 external antisense | PMID:19295167 (Karagiannis et al., 2009) | PCR primers | CAAGCCTCCATAAACTCAGCG |
| Sequence-based reagent | rat Calb2 internal sense | PMID:19295167 (Karagiannis et al., 2009) | PCR primers | GCTGGAGAAGGCAAGGAAAGG |
| Sequence-based reagent | rat Calb2 internal antisense | PMID:19295167 (Karagiannis et al., 2009) | PCR primers | ATTCTCTTCGGTTGGCAGGA |
| Sequence-based reagent | rat Npy external sense | PMID:19295167 (Karagiannis et al., 2009) | PCR primers | CGAATGGGGCTGTGTGGA |
| Sequence-based reagent | rat Npy external antisense | PMID:19295167 (Karagiannis et al., 2009) | PCR primers | AGTTTCATTTCCCATCACCACAT |
| Sequence-based reagent | rat Npy internal sense | PMID:19295167 (Karagiannis et al., 2009) | PCR primers | CCCTCGCTCTATCCCTGCTC |
| Sequence-based reagent | rat Npy internal antisense | PMID:19295167 (Karagiannis et al., 2009) | PCR primers | GTTCTGGGGGCATTTTCTGTG |
| Sequence-based reagent | rat Vip external sense | PMID:19295167 (Karagiannis et al., 2009) | PCR primers | TTATGATGTGTCCAGAAATGCGAG |
| Sequence-based reagent | rat Vip external antisense | PMID:19295167 (Karagiannis et al., 2009) | PCR primers | TTTTATTTGGTTTTGCTATGGAAG |
| Sequence-based reagent | rat Vip internal sense | PMID:19295167 (Karagiannis et al., 2009) | PCR primers | TGGCAAACGAATCAGCAGTAGC |
| Sequence-based reagent | rat Vip internal antisense | PMID:19295167 (Karagiannis et al., 2009) | PCR primers | GAATCTCCCTCACTGCTCCTCT |
| Sequence-based reagent | rat Sst external sense | PMID:19295167 (Karagiannis et al., 2009) | PCR primers | ATGCTGTCCTGCCGTCTCCA |
| Sequence-based reagent | rat Sst external antisense | PMID:17068095 (Férézou et al., 2007) | PCR primers | GCCTCATCTCGTCCTGCTCA |
| Sequence-based reagent | rat Sst internal sense | PMID:19295167 (Karagiannis et al., 2009) | PCR primers | GCATCGTCCTGGCTTTGGG |
| Sequence-based reagent | rat Sst internal antisense | PMID:19295167 (Karagiannis et al., 2009) | PCR primers | AGGCTCCAGGGCATCGTTCT |
| Sequence-based reagent | rat Cck external sense | PMID:19295167 (Karagiannis et al., 2009) | PCR primers | TGTCTGTGCGTGGTGATGGC |
| Sequence-based reagent | rat Cck external antisense | PMID:19295167 (Karagiannis et al., 2009) | PCR primers | GCATAGCAACATTAGGTCTGGGAG |
| Sequence-based reagent | rat Cck internal sense | PMID:19295167 (Karagiannis et al., 2009) | PCR primers | ATACATCCAGCAGGTCCGCAA |
| Sequence-based reagent | rat Cck internal antisense | PMID:19295167 (Karagiannis et al., 2009) | PCR primers | GGTCGTGTGCGTGGTTGTTT |
| Sequence-based reagent | rat Kcnj8 external sense | This paper | PCR primers | CTGGCTCACAAGAACATCCG |
| Sequence-based reagent | rat Kcnj8 external antisense | This paper | PCR primers | AGCGTCTCTGCCCTTCTGTG |
| Sequence-based reagent | rat Kcnj8 internal sense | PMID:26156991 (Varin et al., 2015) | PCR primers | GCTGGCTGCTCTTCGCTATC |
| Sequence-based reagent | rat Kcnj8 internal antisense | This paper | PCR primers | TTCTCCCTCCAAACCCAATG |
| Sequence-based reagent | rat Kcnj11 external sense | This paper | PCR primers | CCCCACACGCTGCTCATTTT |
| Sequence-based reagent | rat Kcnj11 external antisense | This paper | PCR primers | AGGAGCCAGGTCGTAGAGCG |
| Sequence-based reagent | rat Kcnj11 internal sense | This paper | PCR primers | GCGTCACAAGCATCCACTCC |
| Sequence-based reagent | rat Kcnj11 internal antisense | This paper | PCR primers | CCACCCACACCGTTCTCCAT |
| Sequence-based reagent | rat Abcc8 external sense | This paper | PCR primers | GGTGAAGAAGCCTCCGATGA |
| Sequence-based reagent | rat Abcc8 external antisense | This paper | PCR primers | GGTGAAGAAGCCTCCGATGA |
| Sequence-based reagent | rat Abcc8 internal sense | This paper | PCR primers | GGTTCGGTCCACTGTCAAGG |
| Sequence-based reagent | rat Abcc8 internal antisense | This paper | PCR primers | GTCAGCGTCTCCATCCGTGC |
| Sequence-based reagent | rat Abcc9 external sense | This paper | PCR primers | CGCTGCCTTTTGAGTCCTGT |
| Sequence-based reagent | rat Abcc9 external antisense | This paper | PCR primers | GATGGCAAGGAGGAGAGACG |
| Sequence-based reagent | rat Abcc9 internal sense | This paper | PCR primers | TGGACAACTACGAGCAGGCG |
| Sequence-based reagent | rat Abcc9 internal antisense | This paper | PCR primers | CACAACCCACCTGACCCACA |
| Sequence-based reagent | rat Sst intron external sense | PMID:17267760 (Hill et al., 2007) | PCR primers | GGAAATGGCTGGGACTCGTC |
| Sequence-based reagent | rat Sst intron external antisense | PMID17267760 (Hill et al., 2007) | PCR primers | AAACCATGGATGATAGGAAGTCGT |
| Sequence-based reagent | rat Sst intron internal sense | This paper | PCR primers | GTCCCCTTTGCGAATTCCCT |
| Sequence-based reagent | rat Sst intron internal antisense | This paper | PCR primers | TTCGAGCAGCTCCATTTTCC |
| Sequence-based reagent | rat SUR2A/B sense | This paper | PCR primers | ACTTCAGCGTTGGACAGAGACA |
| Sequence-based reagent | rat SUR2A/B antisense | This paper | PCR primers | GGTCAGCAGTCAGAATGGTGTG |
| Sequence-based reagent | mouse Slc17a7 external sense | PMID:23565079 (Cabezas et al., 2013) | PCR primers | GGCTCCTTTTTCTGGGGCTAC |
| Sequence-based reagent | mouse Slc17a7 external antisense | PMID:23565079 (Cabezas et al., 2013) | PCR primers | CCAGCCGACTCCGTTCTAAG |
| Sequence-based reagent | mouse Slc17a7 internal sense | PMID:23565079 (Cabezas et al., 2013) | PCR primers | ATTCGCAGCCAACAGGGTCT |
| Sequence-based reagent | mouse Slc17a7 internal antisense | PMID:23565079 (Cabezas et al., 2013) | PCR primers | TGGCAAGCAGGGTATGTGAC |
| Sequence-based reagent | mouse Gad2 external sense | PMID:22754499 (Perrenoud et al., 2012) | PCR primers | CCAAAAGTTCACGGGCGG |
| Sequence-based reagent | mouse Gad2 external antisense | PMID:22754499 (Perrenoud et al., 2012) | PCR primers | TCCTCCAGATTTTGCGGTTG |
| Sequence-based reagent | mouse Gad2 internal sense | PMID:22754499 (Perrenoud et al., 2012) | PCR primers | CACCTGCGACCAAAAACCCT |
| Sequence-based reagent | mouse Gad2 internal antisense | PMID:22754499 (Perrenoud et al., 2012) | PCR primers | GATTTTGCGGTTGGTCTGCC |
| Sequence-based reagent | mouse Gad1 external sense | PMID:12196560 (Férézou et al., 2002) | PCR primers | TACGGGGTTCGCACAGGTC |
| Sequence-based reagent | mouse Gad1 external antisense | PMID:23565079 (Cabezas et al., 2013) | PCR primers | CCCAGGCAGCATCCACAT |
| Sequence-based reagent | mouse Gad1 internal sense | PMID:23565079 (Cabezas et al., 2013) | PCR primers | CCCAGAAGTGAAGACAAAAGGC |
| Sequence-based reagent | mouse Gad1 internal antisense | PMID:23565079 (Cabezas et al., 2013) | PCR primers | AATGCTCCGTAAACAGTCGTGC |
| Sequence-based reagent | mouse Atp1a1 external sense | PMID:29985318 (Devienne et al., 2018) | PCR primers | CAGGGCAGTGTTTCAGGCTAAS |
| Sequence-based reagent | mouse Atp1a1 external antisense | PMID:29985318(Devienne et al., 2018) | PCR primers | CCGTGGAGAAGGATGGAGC |
| Sequence-based reagent | mouse Atp1a1 internal sense | PMID:29985318 (Devienne et al., 2018) | PCR primers | TAAGCGGGCAGTAGCGGG |
| Sequence-based reagent | mouse Atp1a1 internal antisense | PMID:29985318 (Devienne et al., 2018) | PCR primers | AGGTGTTTGGGCTCAGATGC |
| Sequence-based reagent | mouse Atp1a2 external sense | PMID:29985318 (Devienne et al., 2018) | PCR primers | AGTGAGGAAGATGAGGGACAGG |
| Sequence-based reagent | mouse Atp1a2 external antisense | PMID:29985318 (Devienne et al., 2018) | PCR primers | ACAGAAGCCCAGCACTCGTT |
| Sequence-based reagent | mouse Atp1a2 internal sense | PMID:29985318 (Devienne et al., 2018) | PCR primers | AAATCCCCTTCAACTCCACCA |
| Sequence-based reagent | mouse Atp1a2 internal antisense | PMID:29985318 (Devienne et al., 2018) | PCR primers | GTTCCCCAAGTCCTCCCAGC |
| Sequence-based reagent | mouse Atp1a3 external sense | PMID:29985318 (Devienne et al., 2018) | PCR primers | CGGAAATACAATACTGACTGCGTG |
| Sequence-based reagent | mouse Atp1a3 external antisense | PMID:29985318 (Devienne et al., 2018) | PCR primers | GTCATCCTCCGTCCCTGCC |
| Sequence-based reagent | mouse Atp1a3 internal sense | PMID:29985318 (Devienne et al., 2018) | PCR primers | TGACACACAGTAAAGCCCAGGA |
| Sequence-based reagent | mouse Atp1a3 internal antisense | PMID:29985318 (Devienne et al., 2018) | PCR primers | CCACAGCAGGATAGAGAAGCCA |
| Sequence-based reagent | mouse Kcnj11 external sense | PMID:29985318 (Devienne et al., 2018) | PCR primers | CGGAGAGGGCACCAATGT |
| Sequence-based reagent | mouse Kcnj11 external antisense | PMID:29985318 (Devienne et al., 2018) | PCR primers | CACCCACGCCATTCTCCA |
| Sequence-based reagent | mouse Kcnj11 internal sense | PMID:29985318 (Devienne et al., 2018) | PCR primers | CATCCACTCCTTTTCATCTGCC |
| Sequence-based reagent | mouse Kcnj11 internal antisense | PMID:29985318 (Devienne et al., 2018) | PCR primers | TCGGGGCTGGTGGTCTTG |
| Sequence-based reagent | mouse Abcc8 external sense | PMID:29985318 (Devienne et al., 2018) | PCR primers | CAGTGTGCCCCCCGAGAG |
| Sequence-based reagent | mouse Abcc8 external antisense | PMID:29985318 (Devienne et al., 2018) | PCR primers | GGTCTTCTCCCTCGCTGTCTG |
| Sequence-based reagent | mouse Abcc8 internal sense | PMID:29985318 (Devienne et al., 2018) | PCR primers | ATCATCGGAGGCTTCTTCACC |
| Sequence-based reagent | mouse Abcc8 internal antisense | PMID:29985318 (Devienne et al., 2018) | PCR primers | GGTCTTCTCCCTCGCTGTCTG |
| Sequence-based reagent | mouse Sst intron external sense | PMID:12930808 (Thoby-Brisson et al., 2003) | PCR primers | CTGTCCCCCTTACGAATCCC |
| Sequence-based reagent | mouse Sst intron external antisense | PMID:12930808 (Thoby-Brisson et al., 2003) | PCR primers | CCAGCACCAGGGATAGAGCC |
| Sequence-based reagent | mouse Sst intron internal sense | PMID:20427660 Cea-del Rio et al., 2010 | PCR primers | CTTACGAATCCCCCAGCCTT |
| Sequence-based reagent | mouse Sst intron internal antisense | PMID:20427660 (Cea-del Rio et al., 2010) | PCR primers | TTGAAAGCCAGGGAGGAACT |
| Sequence-based reagent | rat Slc16a1 external sense | This paper | PCR primers | GTCAGCCTTCCTCCTTTCCA |
| Sequence-based reagent | rat Slc16a1 external antisense | This paper | PCR primers | TCCGCTTTCTGTTCTTTGGC |
| Sequence-based reagent | rat Slc16a1 internal sense | This paper | PCR primers | TTGTTGCGAATGGAGTGTGC |
| Sequence-based reagent | rat Slc16a1 internal antisense | This paper | PCR primers | CACGCCACAAGCCCAGTATG |
| Sequence-based reagent | rat Slc16a7 external sense | This paper | PCR primers | GCGAAGTCTAAAAGTAAGGTTGGC |
| Sequence-based reagent | rat Slc16a7 external antisense | This paper | PCR primers | ATTTACCAGCCAGGGGAGGG |
| Sequence-based reagent | rat Slc16a7 internal sense | This paper | PCR primers | CCGTATGCTAAGGACAAAGGAGT |
| Sequence-based reagent | rat Slc16a7 internal antisense | This paper | PCR primers | GGGAAGAACTGGGCAACACT |
| Sequence-based reagent | rat Slc16a3 external sense | This paper | PCR primers | CATTGGTCTCGTGCTGCTGTS |
| Sequence-based reagent | rat Slc16a3 external antisense | This paper | PCR primers | CCCCGTTTTTCTCAGGCTCT |
| Sequence-based reagent | rat Slc16a3 internal sense | This paper | PCR primers | TGTGGCTGTGCTCATCGGAC |
| Sequence-based reagent | rat Slc16a3 internal antisense | This paper | PCR primers | CCTCTTCCTCTTCCCGATGC |
| Sequence-based reagent | rat Ldha external sense | This paper | PCR primers | GAAGAACAGGTCCCCCAGAA |
| Sequence-based reagent | rat Ldha external antisense | This paper | PCR primers | GGGTTTGAGACGATGAGCAGT |
| Sequence-based reagent | rat Ldha internal sense | This paper | PCR primers | CAGTTGTTGGGGTTGGTGCT |
| Sequence-based reagent | rat Ldha internal antisense | This paper | PCR primers | TCTCTCCCTCTTGCTGACGG |
| Sequence-based reagent | rat Ldhb external sense | This paper | PCR primers | ACTGCCGTCCCGAACAACAA |
| Sequence-based reagent | rat Ldhb external antisense | This paper | PCR primers | ACTCTCCCCCTCCTGCTGG |
| Sequence-based reagent | rat Ldhb internal sense | This paper | PCR primers | TCTGGGGAAGTCTCTGGCTGA |
| Sequence-based reagent | rat Ldhb internal antisense | This paper | PCR primers | TTGGCTGTCACGGAGTAATCTTT |
| Commercial assay or kit | MEGAscript SP6 Transcription Kit | Ambion | AM1330 | |
| Chemical compound, drug | Pinacidil monohydrate | Sigma-Aldrich | P154 | |
| Chemical compound, drug | Diazoxide | Sigma-Aldrich | D9035 | |
| Chemical compound, drug | Tolbutamide | Sigma-Aldrich | T0891 | |
| Chemical compound, drug | Mn(III)tetrakis(1-methyl-4-pyridyl)porphyrin | Millipore | 475,872 | |
| Chemical compound, drug | Gramicidin from Bacillus aneurinolyticus (Bacillus brevis) | Sigma-Aldrich | G5002 | |
| Chemical compound, drug | Sodium L-lactate | Sigma-Aldrich | L7022 | |
| Chemical compound, drug | α-Cyano-4-hydroxycinnamic Acid | Sigma-Aldrich | C2020 | |
| Chemical compound, drug | Sodium pyruvate | Sigma-Aldrich | P2256 | |
| Chemical compound, drug | Sodium iodoacetate | Sigma-Aldrich | I2512 | |
| Chemical compound, drug | Potassium cyanide | Sigma-Aldrich | 60,178 | |
| Chemical compound, drug | Dithiothreitol | VWR | 443,852 A | |
| Chemical compound, drug | Primer ‘random’ | 4731001 | ||
| Chemical compound, drug | dNTPs | GE Healthcare Life Sciences | 28-4065-52 | |
| Chemical compound, drug | Mineral Oil | Sigma-Aldrich | M5904 | |
| Chemical compound, drug | RNasin Ribonuclease Inhibitors | Promega | N2511 | |
| Chemical compound, drug | SuperScript II Reverse Transcriptase | Invitrogen | 18064014 | |
| Chemical compound, drug | Taq DNA Polymerase | Qiagen | 201,205 | |
| Chemical compound, drug | Penicillin-Streptomycin | Sigma-Aldrich | P4333-100ML | |
| Software, algorithm | Pclamp v 10.2 | Molecular Devices | RRID: SCR_011323 | |
| Software, algorithm | Matlab v 2018b | MathWorks | RRID: SCR_001622 | |
| Software, algorithm | Statistica v 6.1 | Statsoft | RRID: SCR_014213 | |
| Software, algorithm | GraphPad Prism v 7 | GraphPad | RRID: SCR_002798 | |
| Software, algorithm | ImagingWorkbench v 6.0.25 | INDEC Systems | ||
| Software, algorithm | FIJI | PMID:22743772 (Schindelin et al., 2012) | RRID: SCR_002285 | MID:29985318 |
| Software, algorithm | Image-Pro Analyzer v 7 | MediaCybernetics | ||
| Other | Vibratome | Leica | VT1000S RRID: SCR_016495 | |
| Other | Upright microscope | Olympus | BX51WI | |
| Other | Dual port module | Olympus | WI-DPMC | |
| Other | ×60 Objective | Olympus | LUMPlan Fl /IR 60 x/0.90 W | |
| Other | ×40 Objetive | Olympus | LUMPlan Fl /IR 40 x/0.80 W | |
| Other | CCD camera | Roper Scientific | CoolSnap HQ2 | |
| Other | Axopatch 200B | Molecular Devices | RRID: SCR_018866 | |
| Other | Digidata 1440A | Molecular Devices | RRID: SCR_021038 | |
| Other | S900 stimulator | Dagan Corporation | ||
| Other | pE-2 | CoolLED | ||
| Other | Dichroic mirror | Semrock | FF395/495/610-Di01-25 × 36 | |
| Other | Emission filter | Semrock | FF01-425/527/685-25 | |
| Other | 780 nm Collimated LED | Thorlabs | M780L3-C1 | |
| Other | Dodt Gradient Contrast | Luigs and Neumann | 200-100 200 0155 | |
| Other | Beam splitter | Semrock | 725 DCSPXR | |
| Other | Analogic CCD camera | Sony | XC ST-70 CE | |
| Other | Millicell | Millipore | PICM0RG50 | |
| Other | Excitation filter | Semrock | FF02-438/24-25 | |
| Other | Dichroic mirror | Semrock | FF458-Di02-25 × 36 | |
| Other | Emission filter | Semrock | FF01-483/32-25 | |
| Other | Emission filter | Semrock | FF01-542/27-25 | |
| Other | Filter wheel | Sutter Instruments | Lambda 10B |
Additional files
-
Supplementary file 1
Somatic properties of different neuronal types n, number of cells, < significantly smaller with p ≤ 0.05; << significantly smaller with p ≤ 0.01; <<< significantly smaller with p ≤ 0.001.
n.s., not statistically significant.
- https://cdn.elifesciences.org/articles/71424/elife-71424-supp1-v2.doc
-
Supplementary file 2
Detection rate of molecular markers in different neuronal types.
Detection rates are given in %; n, number of cells; > significantly larger with p ≤ 0.05; >> significantly larger with p ≤ 0.01; >>> significantly larger with p ≤ 0.001. n.s., not statistically significant.
- https://cdn.elifesciences.org/articles/71424/elife-71424-supp2-v2.docx
-
Supplementary file 3
Passive properties of different neuronal types n, number of cells, < significantly smaller with p ≤ 0.05; << significantly smaller with p ≤ 0.01; <<< significantly smaller with p ≤ 0.001.
- https://cdn.elifesciences.org/articles/71424/elife-71424-supp3-v2.docx
-
Supplementary file 4
Just above threshold properties of different neuronal types n, number of cells; < significantly smaller with p ≤ 0.05; << significantly smaller with p ≤ 0.01; <<< significantly smaller with p ≤ 0.001.
- https://cdn.elifesciences.org/articles/71424/elife-71424-supp4-v2.docx
-
Supplementary file 5
Firing properties of different neuronal types n, number of cells; < significantly smaller with p ≤ 0.05; << significantly smaller with p ≤ 0.01; <<< significantly smaller with p ≤ 0.001.
- https://cdn.elifesciences.org/articles/71424/elife-71424-supp5-v2.docx
-
Supplementary file 6
Action potentials properties of different neuronal types n, number of cells; < significantly smaller with p ≤ 0.05; << significantly smaller with p ≤ 0.01; <<< significantly smaller with p ≤ 0.001.
- https://cdn.elifesciences.org/articles/71424/elife-71424-supp6-v2.docx
-
Supplementary file 7
AH and AD properties of different neuronal types n, number of cells; < significantly smaller with p ≤ 0.05; << significantly smaller with p ≤ 0.01; <<< significantly smaller with p ≤ 0.001.
- https://cdn.elifesciences.org/articles/71424/elife-71424-supp7-v2.docx
-
Transparent reporting form
- https://cdn.elifesciences.org/articles/71424/elife-71424-transrepform1-v2.docx
-
Source data 1
Statistcal comparisons of somatic properties in different neuronal types.
- https://cdn.elifesciences.org/articles/71424/elife-71424-supp8-v2.xls
-
Source data 2
Statistcal comparisons of detection rate of molecular markers in different neuronal types.
- https://cdn.elifesciences.org/articles/71424/elife-71424-supp9-v2.xls
-
Source data 3
Statistcal comparisons of passive properties in different neuronal types.
- https://cdn.elifesciences.org/articles/71424/elife-71424-supp10-v2.xls
-
Source data 4
Statistcal comparisons of just above threshold properties in different neuronal types.
- https://cdn.elifesciences.org/articles/71424/elife-71424-supp11-v2.xls
-
Source data 5
Statistcal comparisons of firing properties in different neuronal types.
- https://cdn.elifesciences.org/articles/71424/elife-71424-supp12-v2.xls
-
Source data 6
Statistcal comparisons of action potentials properties in different neuronal types.
- https://cdn.elifesciences.org/articles/71424/elife-71424-supp13-v2.xls
-
Source data 7
Statistcal comparisons of AH and AD properties in different neuronal types.
- https://cdn.elifesciences.org/articles/71424/elife-71424-supp14-v2.xls
Download links
A two-part list of links to download the article, or parts of the article, in various formats.
Downloads (link to download the article as PDF)
Open citations (links to open the citations from this article in various online reference manager services)
Cite this article (links to download the citations from this article in formats compatible with various reference manager tools)
Lactate is an energy substrate for rodent cortical neurons and enhances their firing activity
eLife 10:e71424.
https://doi.org/10.7554/eLife.71424


