TMEM120A contains a specific coenzyme A-binding site and might not mediate poking- or stretch-induced channel activities in cells
- National Laboratory of Biomacromolecules, CAS Center for Excellence in Biomacromolecules, Institute of Biophysics, Chinese Academy of Sciences, China
- College of Life Sciences, University of Chinese Academy of Sciences, China
- State Key Laboratory of Membrane Biology; Tsinghua-Peking Center for Life Sciences; Beijing Advanced Innovation Center for Structural Biology; IDG/McGovern Institute for Brain Research; School of Pharmaceutical Sciences, Tsinghua University, China
- State Key Laboratory of Brain and Cognitive Science, Institute of Biophysics, Chinese Academy of Sciences, China
Figures
Figure 1 with 1 supplement
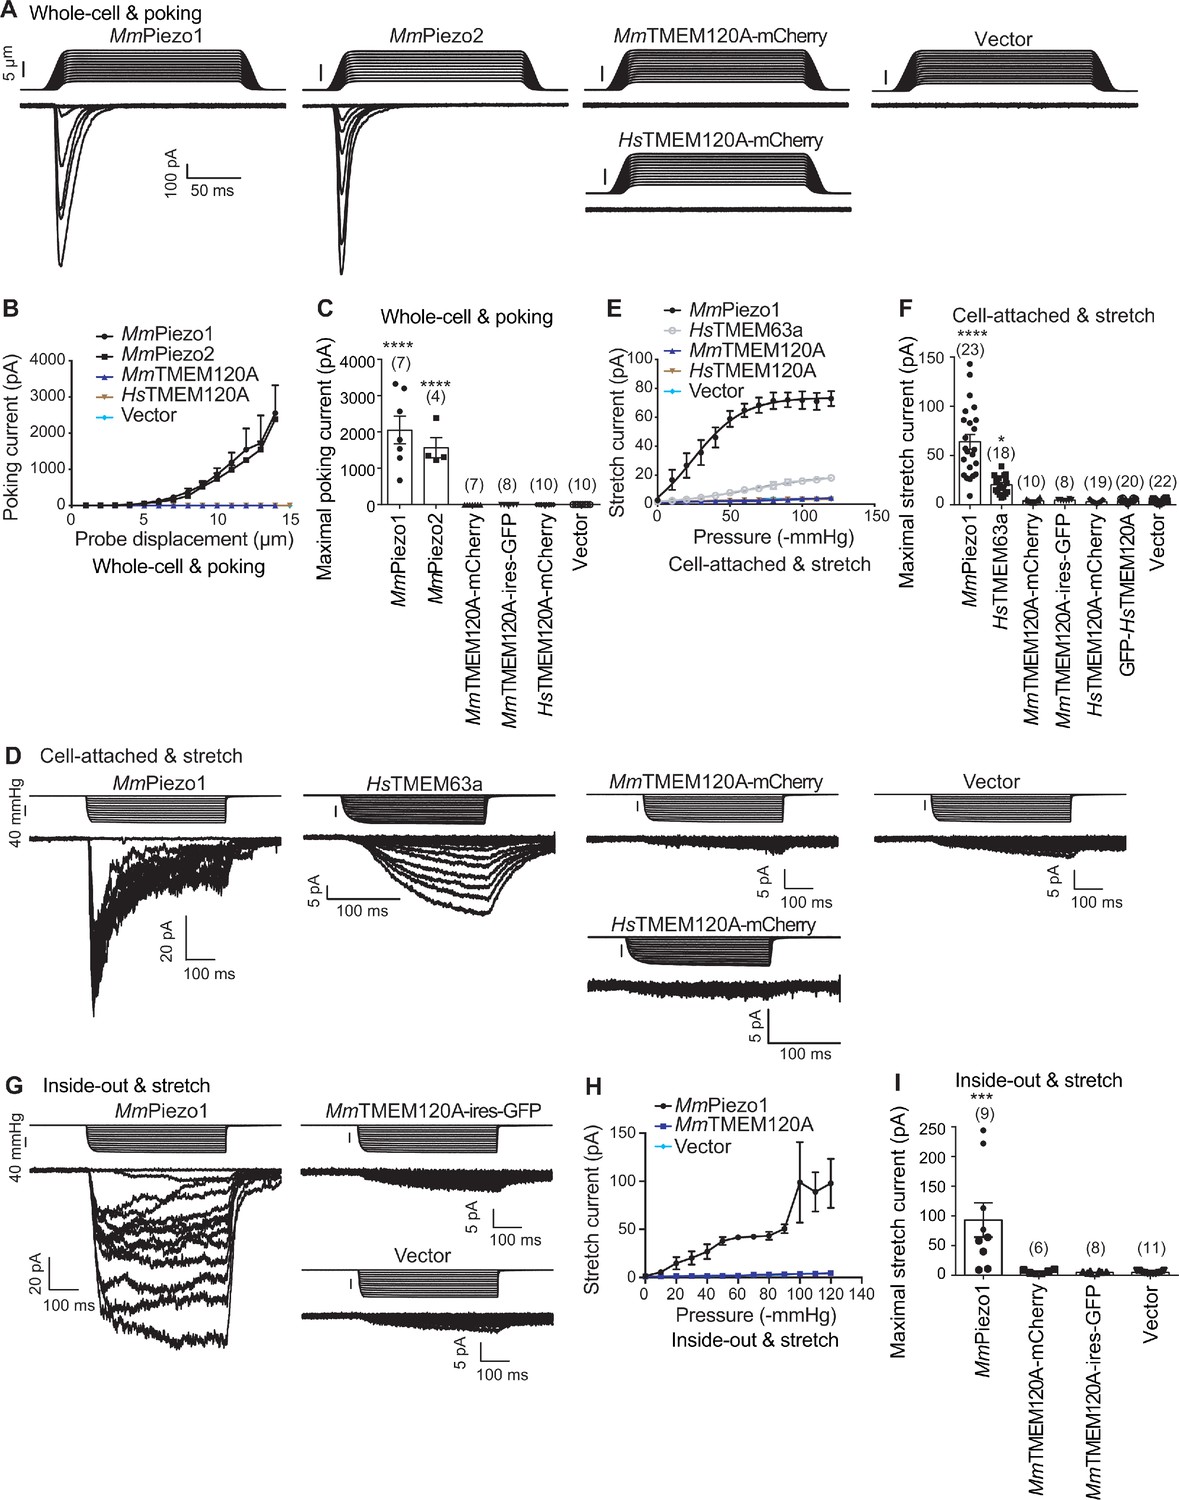
TMEM120A does not mediate poking- or stretch-induced currents in P1-KO-HEK cells.
(A) Representative poking-evoked whole-cell currents from P1-KO-HEK cells transfected with the indicated constructs. (B) Current-displacement curves showing poking-evoked whole-cell currents from P1-KO-HEK cells transfected with the indicated constructs in response to the increased probe displacement steps. The MmTMEM120A group includes data from both MmTMEM120A-mCherry- and MmTMEM120A-ires-GFP-transfected cells. (C) Scatter plot of the maximal poking-evoked whole-cell currents. (D) Representative stretch-induced currents from P1-KO-HEK cells transfected with the indicated constructs under the cell-attached patch configuration. (E) Current-pressure curves showing stretch-induced currents under cell-attached patch configuration from P1-KO-HEK cells transfected with the indicated constructs in response to the increased negative pressures. The MmTMEM120A group includes data from both MmTMEM120A-mCherry- and MmTMEM120A-ires-GFP-transfected cells, while the HsTMEM120A group includes data from both HsTMEM120A-mCherry- and GFP-HsTMEM120A-transfected cells. (F) Scatter plot of the maximal stretch-induced currents. (G) Representative stretch-induced currents from P1-KO-HEK cells transfected with the indicated constructs under the inside-out patch configuration. (H) Current-pressure curves showing stretch-induced currents under inside-out patch configuration from P1-KO-HEK cells transfected with the indicated constructs in response to the increased negative pressures. (I) Scatter plot of the maximal stretch-induced currents. In panels (C), (F), and (I), each bar represents mean ± sem, and the recorded cell number is labeled above the bar. One-way analysis of variance (ANOVA) with comparison to the vector. ***p<0.001; ****p<0.0001.
-
Figure 1—source data 1
Source files for the electrophysiology data.
- https://cdn.elifesciences.org/articles/71474/elife-71474-fig1-data1-v2.zip
Figure 1—figure supplement 1
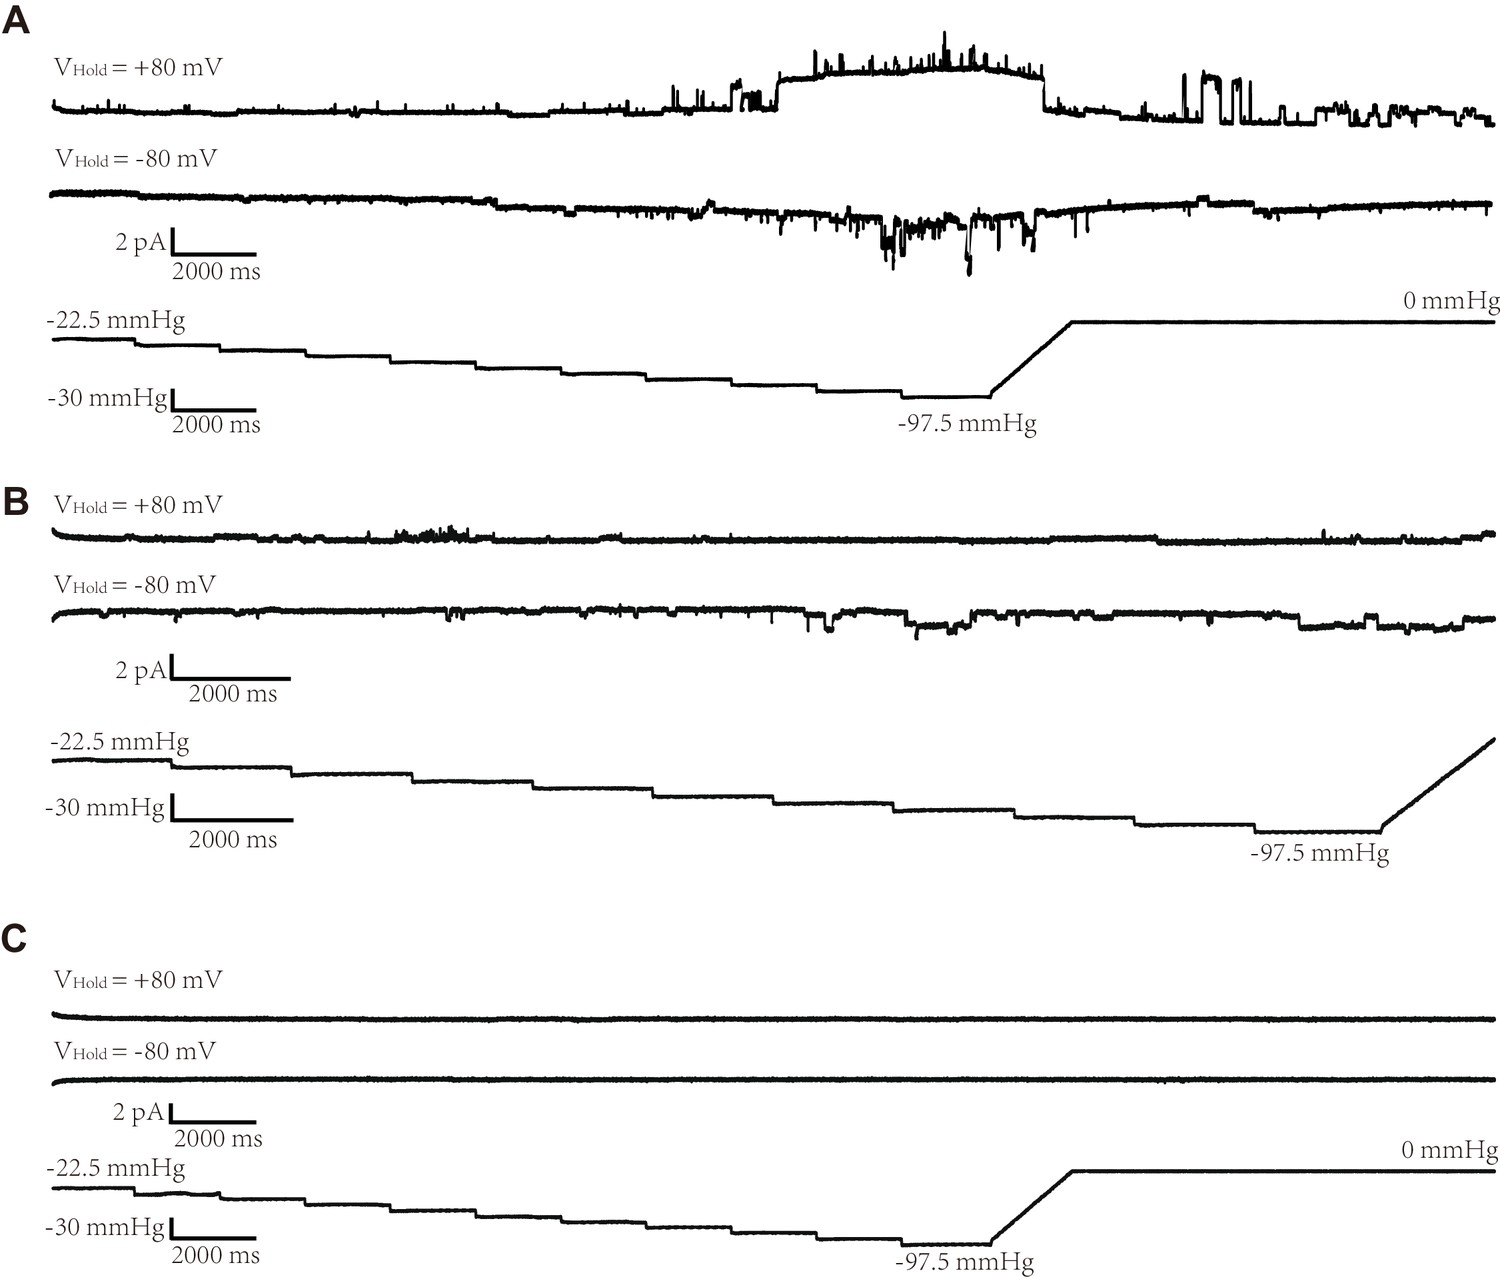
Representative excised inside-out patch recordings of HsTMEM120A reconstituted in GUVs.
(A) Traces of ion channel activities responding to the increase of negative pressure at both +80 and −80 mV. (B) A different patch of membrane exhibiting distinct behaviors of ion channel activities at +80 and −80 mV. While the trace recorded at −80 mV exhibits stimulated channel activities in response to increasing pressures, the one at +80 mV appears to be insensitive to increasing pressure. (C) A silent patch with no pressure-dependent ion channel activities. The traces from three representative patches were obtained by holding the patch at −80 mV and +80 mV with a pressure pulse protocol shown at the bottom: −22.5 to −97.5 mmHg with −7.5 mmHg step. All recordings were performed with a symmetrical pipette and a bath solution containing 500 mM NaCl, 10 mM CaCl2, and 10 mM 4-(2-hydroxyethyl)-1-piperazineethanesulfonic acid (HEPES) (pH 7.4, ~300 Osm/l).
-
Figure 1—figure supplement 1—source data 1
Source file for the representative excised inside-out patch recordings shown in Figure 1—figure supplement 1 A.
- https://cdn.elifesciences.org/articles/71474/elife-71474-fig1-figsupp1-data1-v2.zip
-
Figure 1—figure supplement 1—source data 2
Source file for the representative excised inside-out patch recordings shown in Figure 1—figure supplement 1 B.
- https://cdn.elifesciences.org/articles/71474/elife-71474-fig1-figsupp1-data2-v2.zip
-
Figure 1—figure supplement 1—source data 3
Source file for the representative excised inside-out patch recordings shown in Figure 1—figure supplement 1 C.
- https://cdn.elifesciences.org/articles/71474/elife-71474-fig1-figsupp1-data3-v2.zip
Figure 2 with 1 supplement
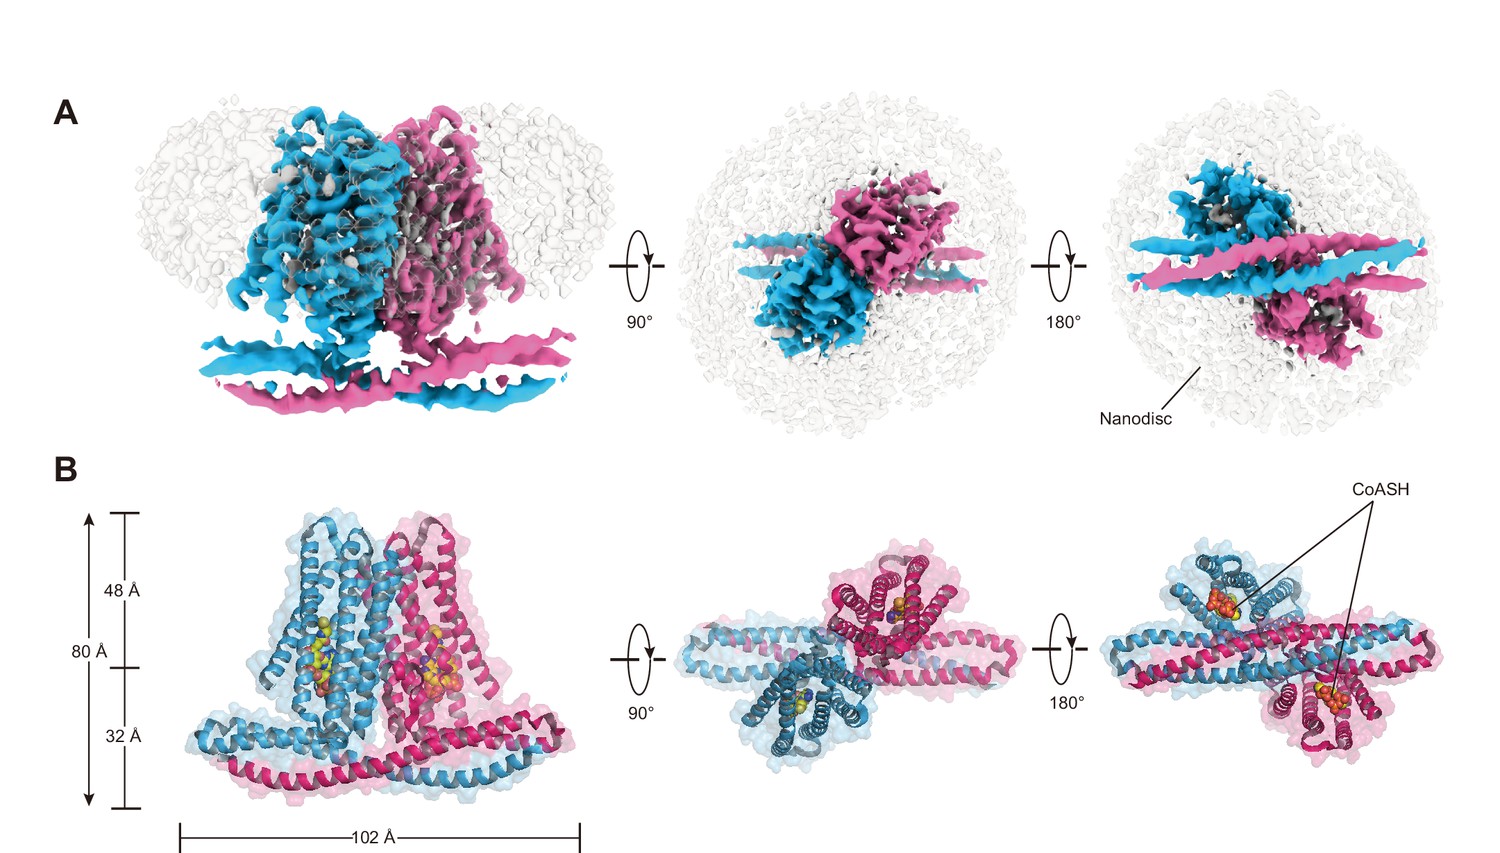
Cryo-EM density and overall architecture of HsTMEM120A homodimer in complex with CoASH molecules.
(A) Cryo-electron microscopy (cryo-EM) density of HsTMEM120A-CoASH complex dimer embedded in a lipid nanodisc. The densities of two HsTMEM120A protein subunits are colored blue and pink, while those of coenzyme A (CoASH) and the lipid nanodisc are colored silver. Side view along membrane plane, top view from extracellular side, and bottom view from intracellular side are shown from left to right. (B) Cartoon representations of the HsTMEM120A-CoASH complex structure. The proteins are shown as cartoon models, whereas CoASH molecules are presented as sphere models. The views are the same as the corresponding ones in (A).
Figure 2—figure supplement 1
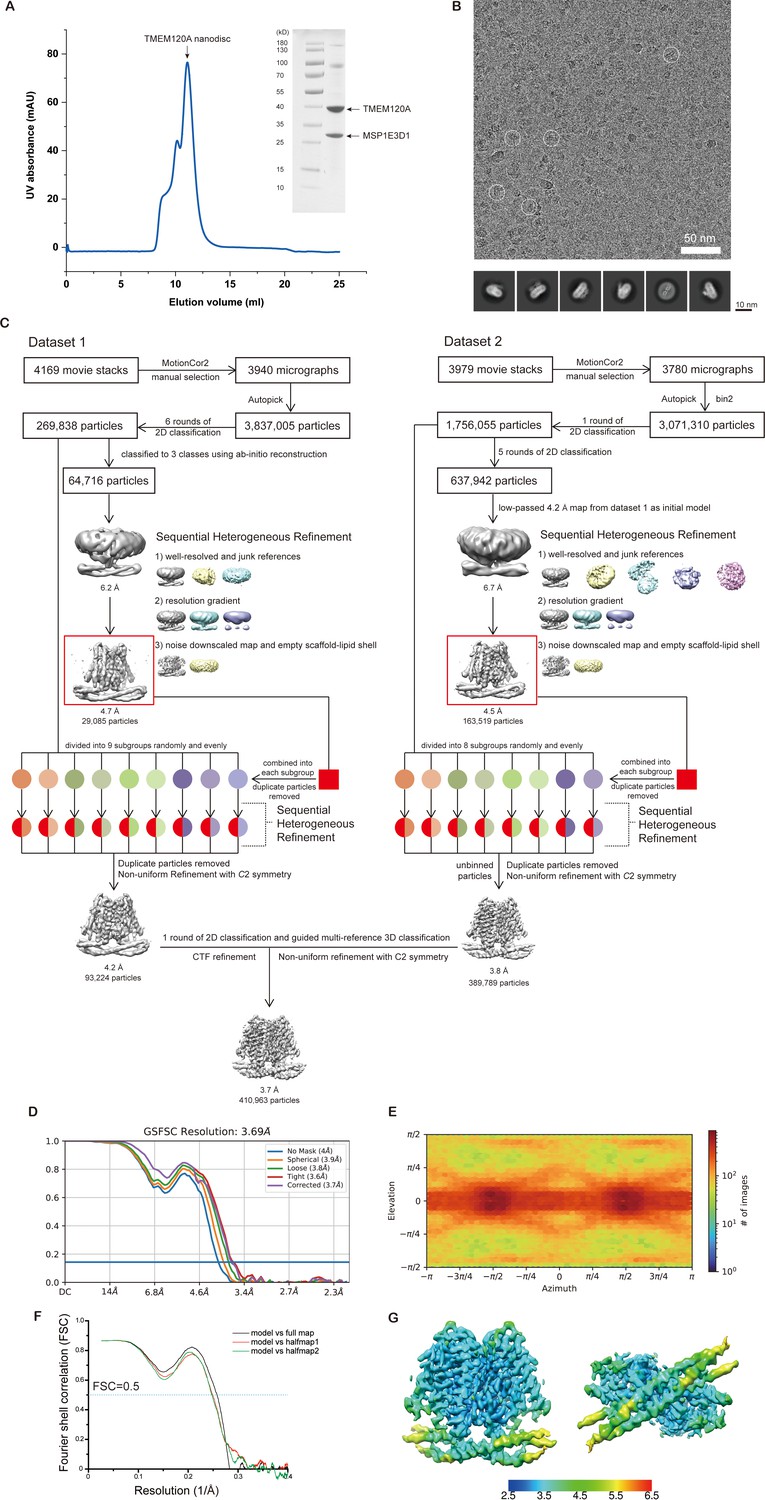
Sample preparation, cryo-EM data collection, and processing of the HsTMEM120A-CoASH complex reconstituted in nanodiscs.
(A) Size-exclusion chromatography of the HsTMEM120A-CoASH complex reconstituted in nanodiscs. The image of sodium dodecyl sulfate-polyacrylamide gel electrophoresis (SDS-PAGE) analysis of the peak fraction is shown on the right. (B) Representative cryo-electron microscopy (cryo-EM) image of the HsTMEM120A-CoASH complex in nanodiscs and 2D classification images. (C) The flow chart of data processing, 3D classification, and refinement. (D) The gold standard Fourier shell correlation (GSFSC) curves for the 3D refinement of the final cryo-EM map. Blue, the FSC curve obtained without application of a mask; orange, the FSC curve obtained with a spherical mask; green and red, the FSC curve obtained with loose and tight masks around the protein density, respectively; purple, the FSC curve obtained with a corrected mask. (E) Angular distribution of the particles used for the final reconstruction. (F) The FSC curves between the structural model and full map as well as two half maps. (G) Estimation of the local resolution of the final cryo-EM map. The unit for the numbers labeled nearby the gradient color bar is Å.
-
Figure 2—figure supplement 1—source data 1
Source file for the gel image data shown in Figure 2–figure supplement 1A.
- https://cdn.elifesciences.org/articles/71474/elife-71474-fig2-figsupp1-data1-v2.zip
Figure 3 with 1 supplement
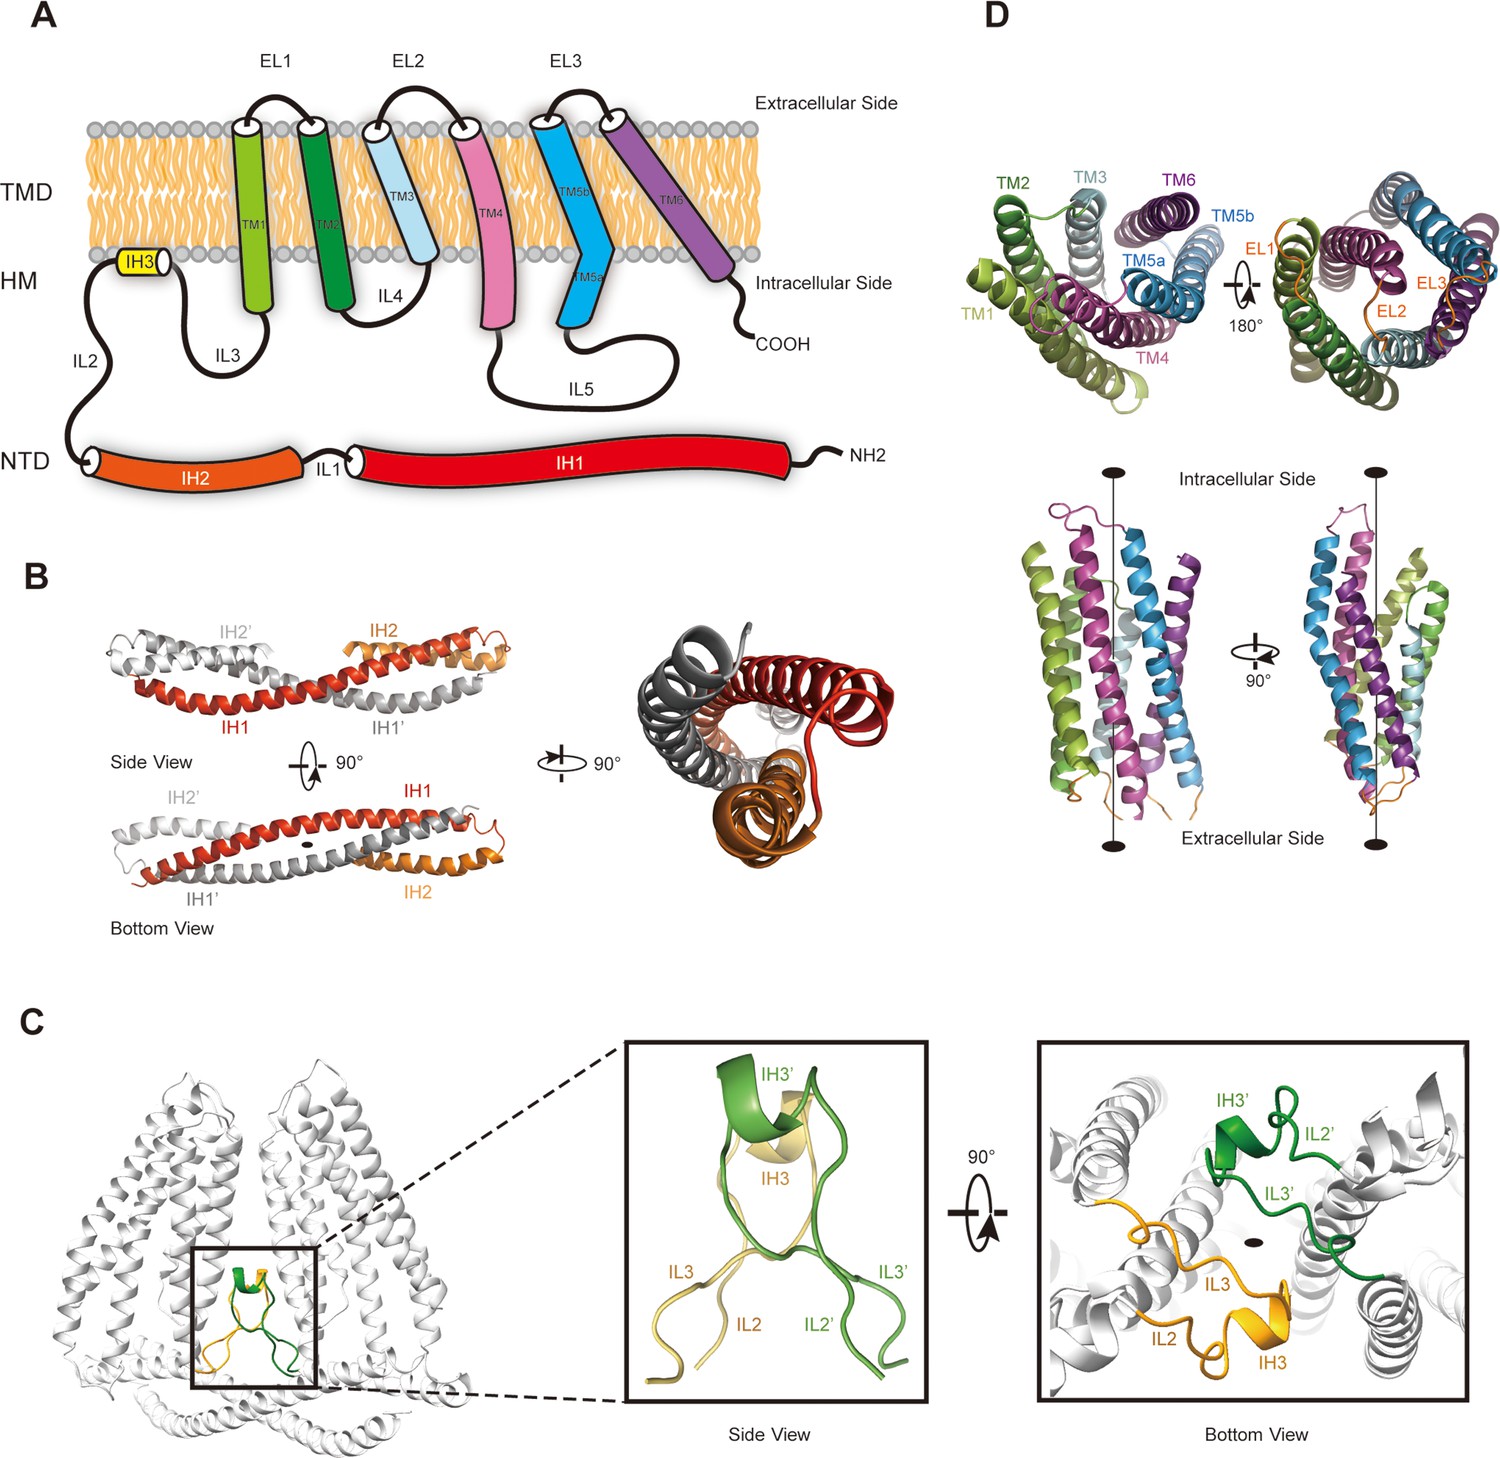
The membrane topology and domain structure of HsTMEM120A monomer.
(A) The topology of HsTMEM120A monomer and arrangement of different parts relative to the membrane. The α-helices are presented as cylinder models. IH1-3, the intracellular helices 1–3; TM1-6, transmembrane helices 1–6; IL1-5, intracellular loops 1–6; EL1-3, extracellular loops 1–3. (B) The N-terminal domain (NTD) with two long and two short α-helices. (C) The role of hinge-like motif (HM) in mediating dimerization of HsTMEM120A at the monomer-monomer interface. The solid elliptical rings in (B) and (C) indicate the central twofold axis of HsTMEM120A homodimer. (D) The transmembrane domain with a bundle of six transmembrane helices. TM1, TM2, and TM3 are related to TM6, TM5, and TM4 through a pseudo-C2 axis as indicated in the lower half.
Figure 3—figure supplement 1
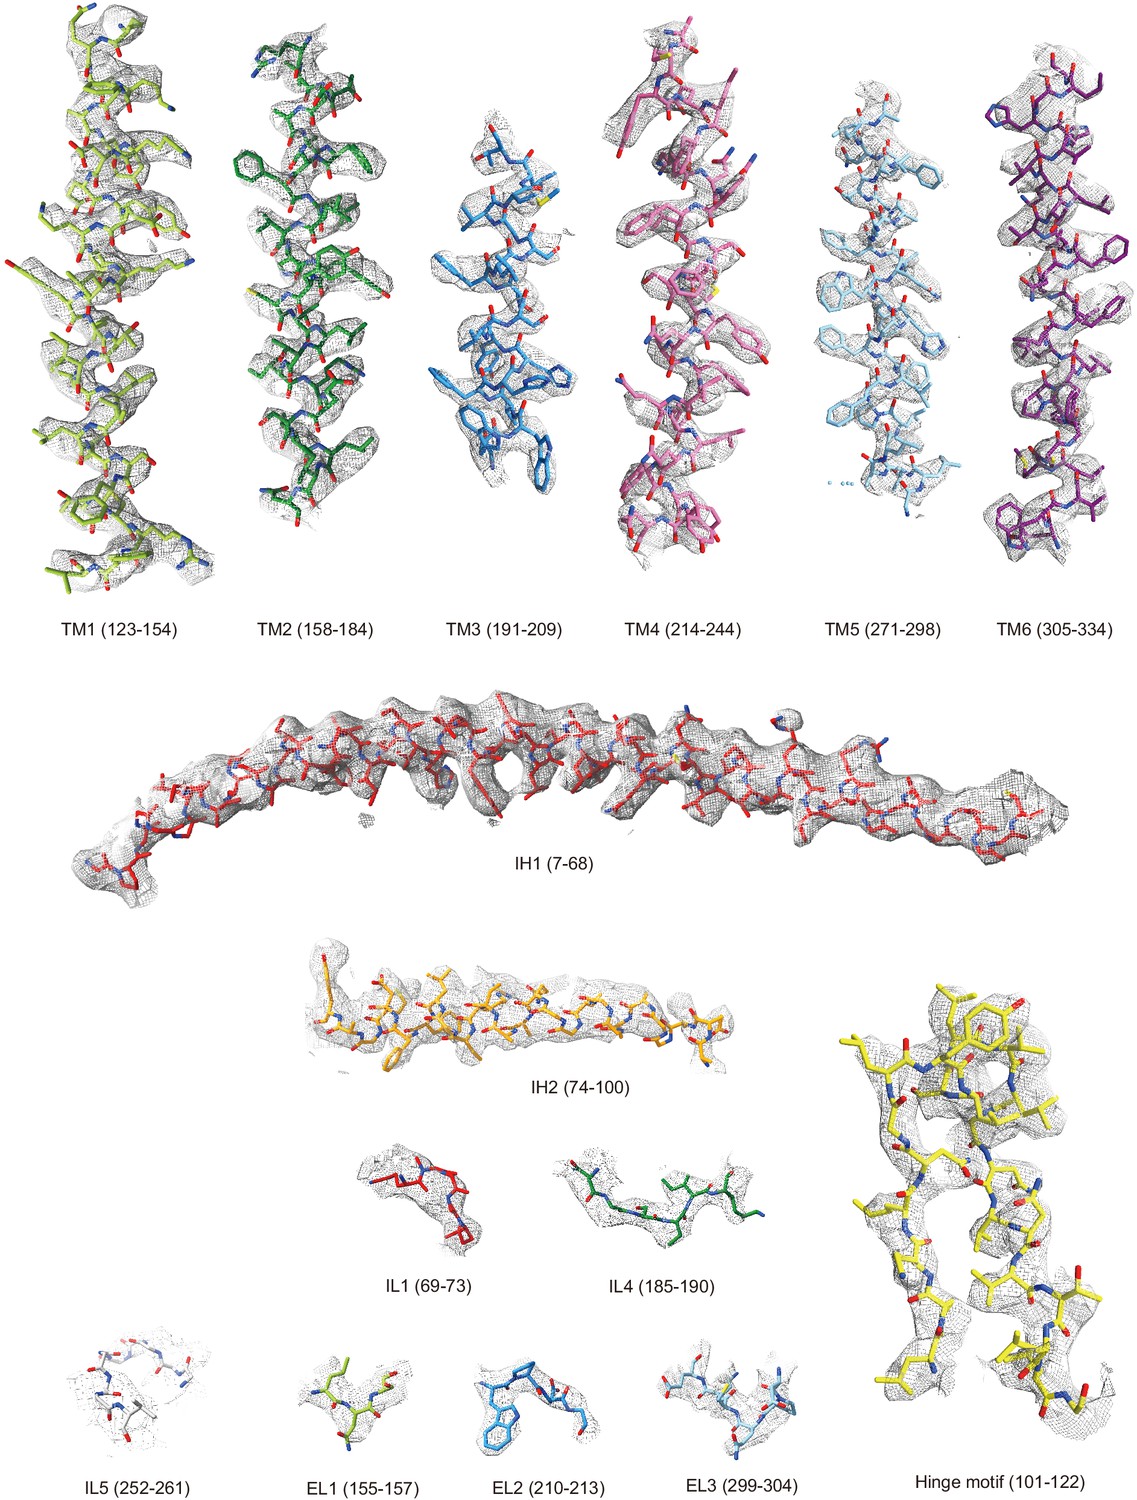
Fitting of the structural model with the cryo-EM densities of various local regions of HsTMEM120A in nanodiscs.
The refined structural models superposed on the map are shown as stick models. The map is contoured at 6.7–13.1 rmsd level. TM2 (158–184), TM3 (191–209), TM4 (214–244), and EL2 (210–213), 13.1 rmsd; hinge motif (101–122), TM1 (123–154), and TM5 (271–298), 11.0 rmsd; TM6 (305–334), EL1 (155–157), and IL4 (185–190), 9.1 rmsd; IH1 (7–68), IH2 (74–100), IL1 (69–73), and EL3 (299–304), 6.73 rmsd; IL5 (252–261), 4.33 rmsd.
Figure 4 with 4 supplements
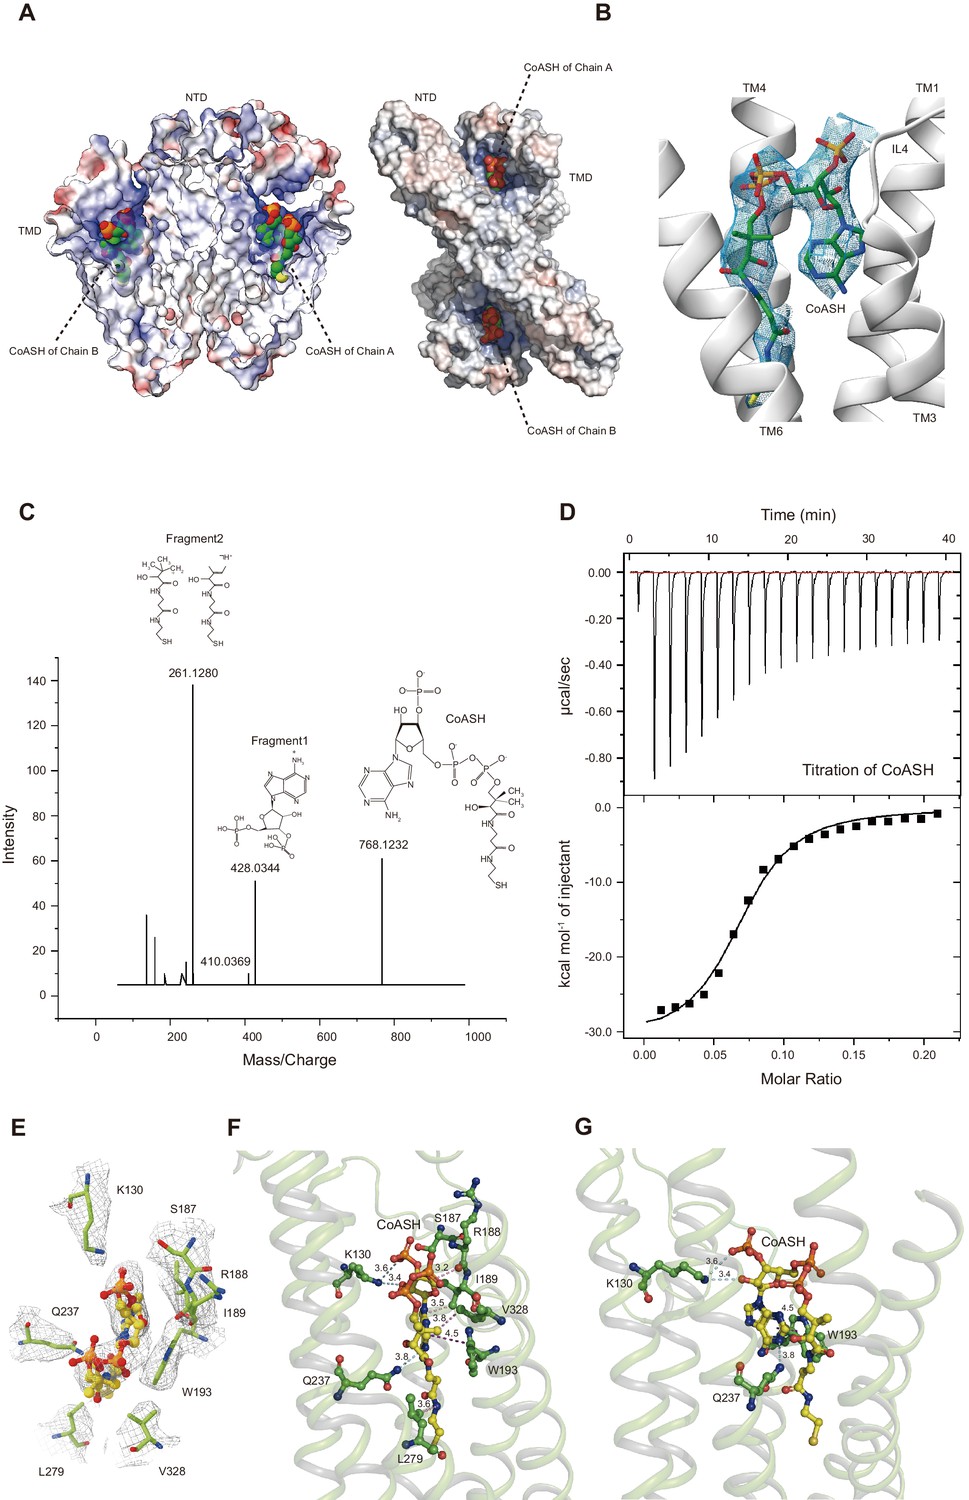
HsTMEM120A contains an internal CoASH-binding site within each monomer.
(A) Electrostatic potential surface presentation of HsTMEM120A dimer reveals a deep coenzyme A (CoASH)-binding cavity with an electropositive surface. Left, side view; right, top view along the membrane normal from the intracellular side. The CoASH molecules are presented as sphere models. (B) The cryo-electron microscopy (cryo-EM) density of the ligand molecule bound to HsTMEM120A fitted with a refined structural model of CoASH. (C) Mass spectrometry analysis of the small molecule extracted from the purified HsTMEM120A protein. The chemical models of CoASH molecule and its fragments are shown above the corresponding peaks with m/z values 768.1232, 428.0344, and 261.1280. (D) Isothermal titration calorimetry analysis on the kinetic interactions between CoASH and HsTMEM120A. The background heat of control was subtracted from the heat generated during binding of CoASH to HsTMEM120A. The result is fit with the single-site-binding isotherm model with ΔH = –31.09 ± 0.97 kcal/mol and Kd = 0.685 ± 0.045 μM. (E) Top view of the CoASH-binding site from the cytosolic side. The cryo-EM densities of CoASH and the surrounding amino acid residues (contoured at 9.5 rmsd) are superposed on the structural model. (F, G) Side views of the detailed interactions between CoASH and the adjacent amino acid residues of HsTMEM120A from two different angles. The blue dotted lines indicate the hydrogen bonds or the salt bridge between Lys130 NZ and CoASH O2B (3.6 Å), Lys130 NZ and CoASH O8A (3.4 Å), and Gln237 NE2 and CoASH N1A (3.8 Å). The purple dotted line shows the π-π interaction between Trp193 and CoASH at 4.2–4.5 Å distances. The pink dotted lines exhibit the non-polar interactions between CoASH and the adjacent residues (Arg188, Ile189, Leu279, and Val328) at <4 Å distance.
Figure 4—figure supplement 1

Fitting of the cofactor density with various small-molecule models.
(A) Coenzyme A (CoASH). (B) Acetyl-CoA. The area in the dashed box indicates the local region with clashes between the acetyl group of acetyl-CoA model and Gly282-His283 region of the protein. (C) Propionyl-CoA. The local region in the dashed box at the bottom right has a clash between the propionyl group of propionyl-CoA model and the protein. For palmitoyl- or oleoyl-CoA, the fatty acyl group is too long to fit in the density. (D) Adenosine triphosphate (ATP). There is an extra density of the cofactor not covered by the ATP model. (E) Nicotinamide adenine dinucleotide (NAD). Note that the bulky nicotinamide group does not match with the cofactor density. (F) Flavin adenine dinucleotide (FAD). The bulky flavin group of FAD is not covered by the cofactor density. In (A-F), the cryo-electron microscopy (cryo-EM) map of HsTMEM120A in the nanodisc is contoured at 6.4 rmsd level.
Figure 4—figure supplement 2
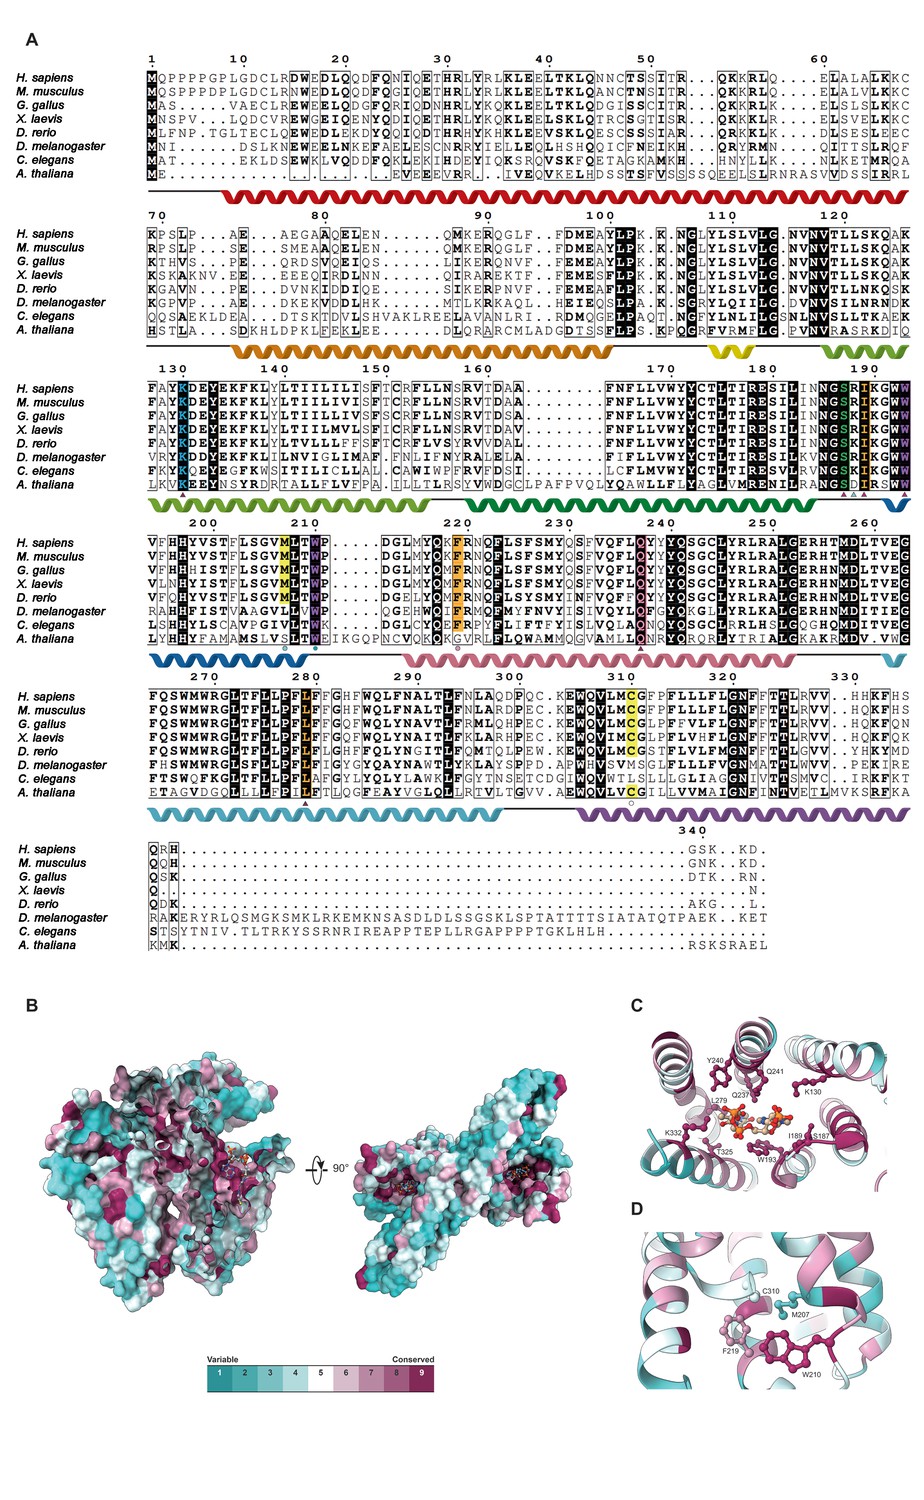
The conserved features of TMEM120A.
(A) Sequence alignment of HsTMEM120A with other homologs from different species. The highly conserved amino acid residues are highlighted in a dark background. The triangles denote the coenzyme A (CoASH)-binding residues, and the color code is the same as the one for ConSurf conservation score bar shown in (B). The circles indicate the amino acid residues located in the narrowest region of channel pore. The α-helices and associated loops are indicated by the helical ribbons and dark lines labeled above the sequences, respectively. Accession codes: Homo sapiens (NP_114131.1), Mus musculus (NP_766129.1), Gallus gallus (XP_040543083.1), Xenopus laevis (NP_001091170.1), Danio rerio (NP_001076452.1), Drosophila melanogaster (NP_001245509.1), Caenorhabditis elegans (NP_001370801.1), and Arabidopsis thaliana (CAD5314357.1). (B) Mapping of the conserved amino acid residues on the surface of HsTMEM120A structure. The conserved residues are shown in dark pink, while the variable ones are in cyan. (C, D) The amino acid residues located at the CoASH-binding site and the constriction area, respectively.
Figure 4—figure supplement 3
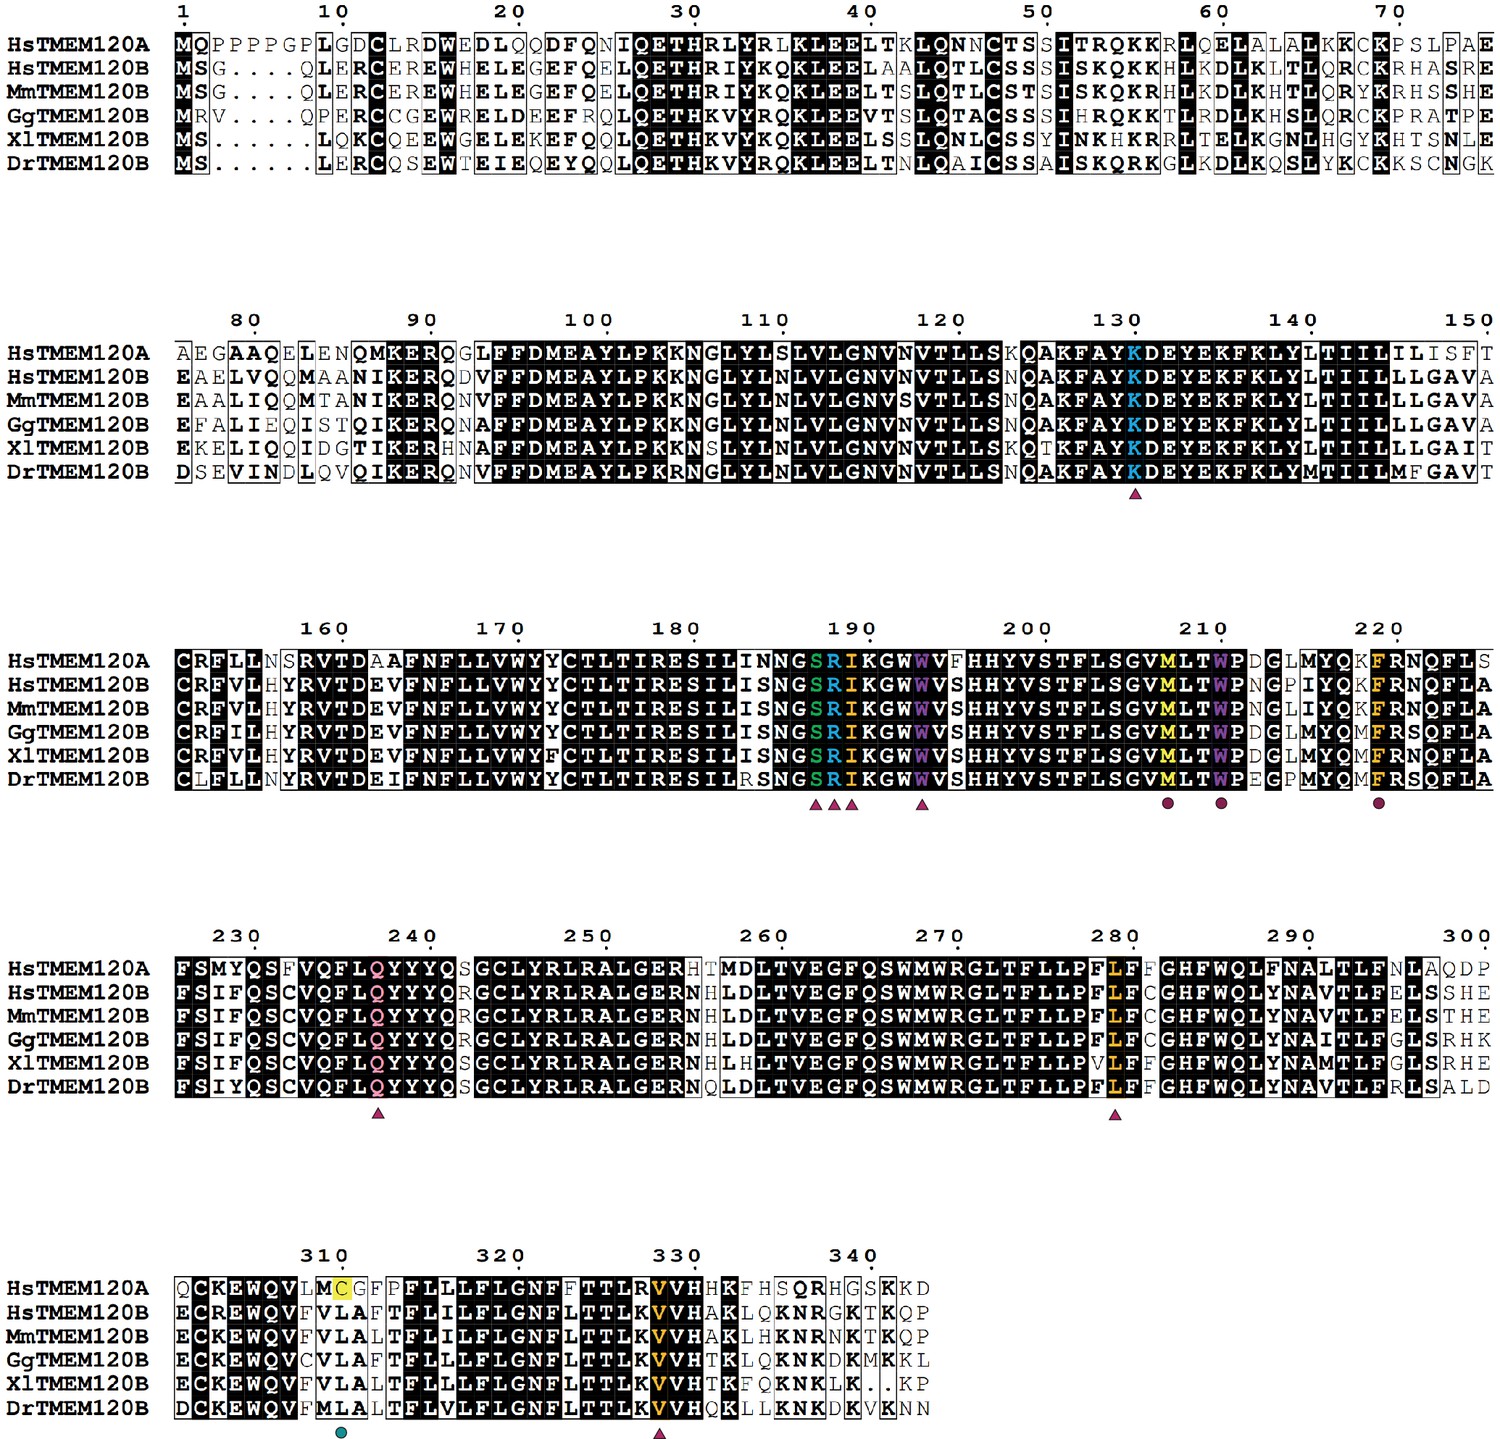
Sequence alignment of HsTMEM120A with various TMEM120B orthologs.
Hs, Homo sapiens (NP_001074294.2); Mm, Mus musculus (NP_001034812.1); Gg, Gallus gallus (NP_001376307.1); Xl, Xenopus laevis (NP_001086700.1); Dr, Danio rerio (XP_005169279.1).
Figure 4—figure supplement 4

Analysis of CoASH-binding property of the W193A mutant of HsTMEM120A.
(A) Sodium dodecyl sulfate-polyacrylamide gel electrophoresis (SDS-PAGE) and western blot analyses of the purified W193A protein. (B) Isothermal titration calorimetry (ITC) analysis of W193A protein sample titrated with coenzyme A (CoASH). The data were fit with the single-site-binding isotherm model with Kd = 198.41 ± 0.81 μM.
-
Figure 4—figure supplement 4—source data 1
Source files for the ITC data, gel image, and western blot (Figure 4—figure supplement 4A,B).
- https://cdn.elifesciences.org/articles/71474/elife-71474-fig4-figsupp4-data1-v2.zip
Figure 5 with 2 supplements
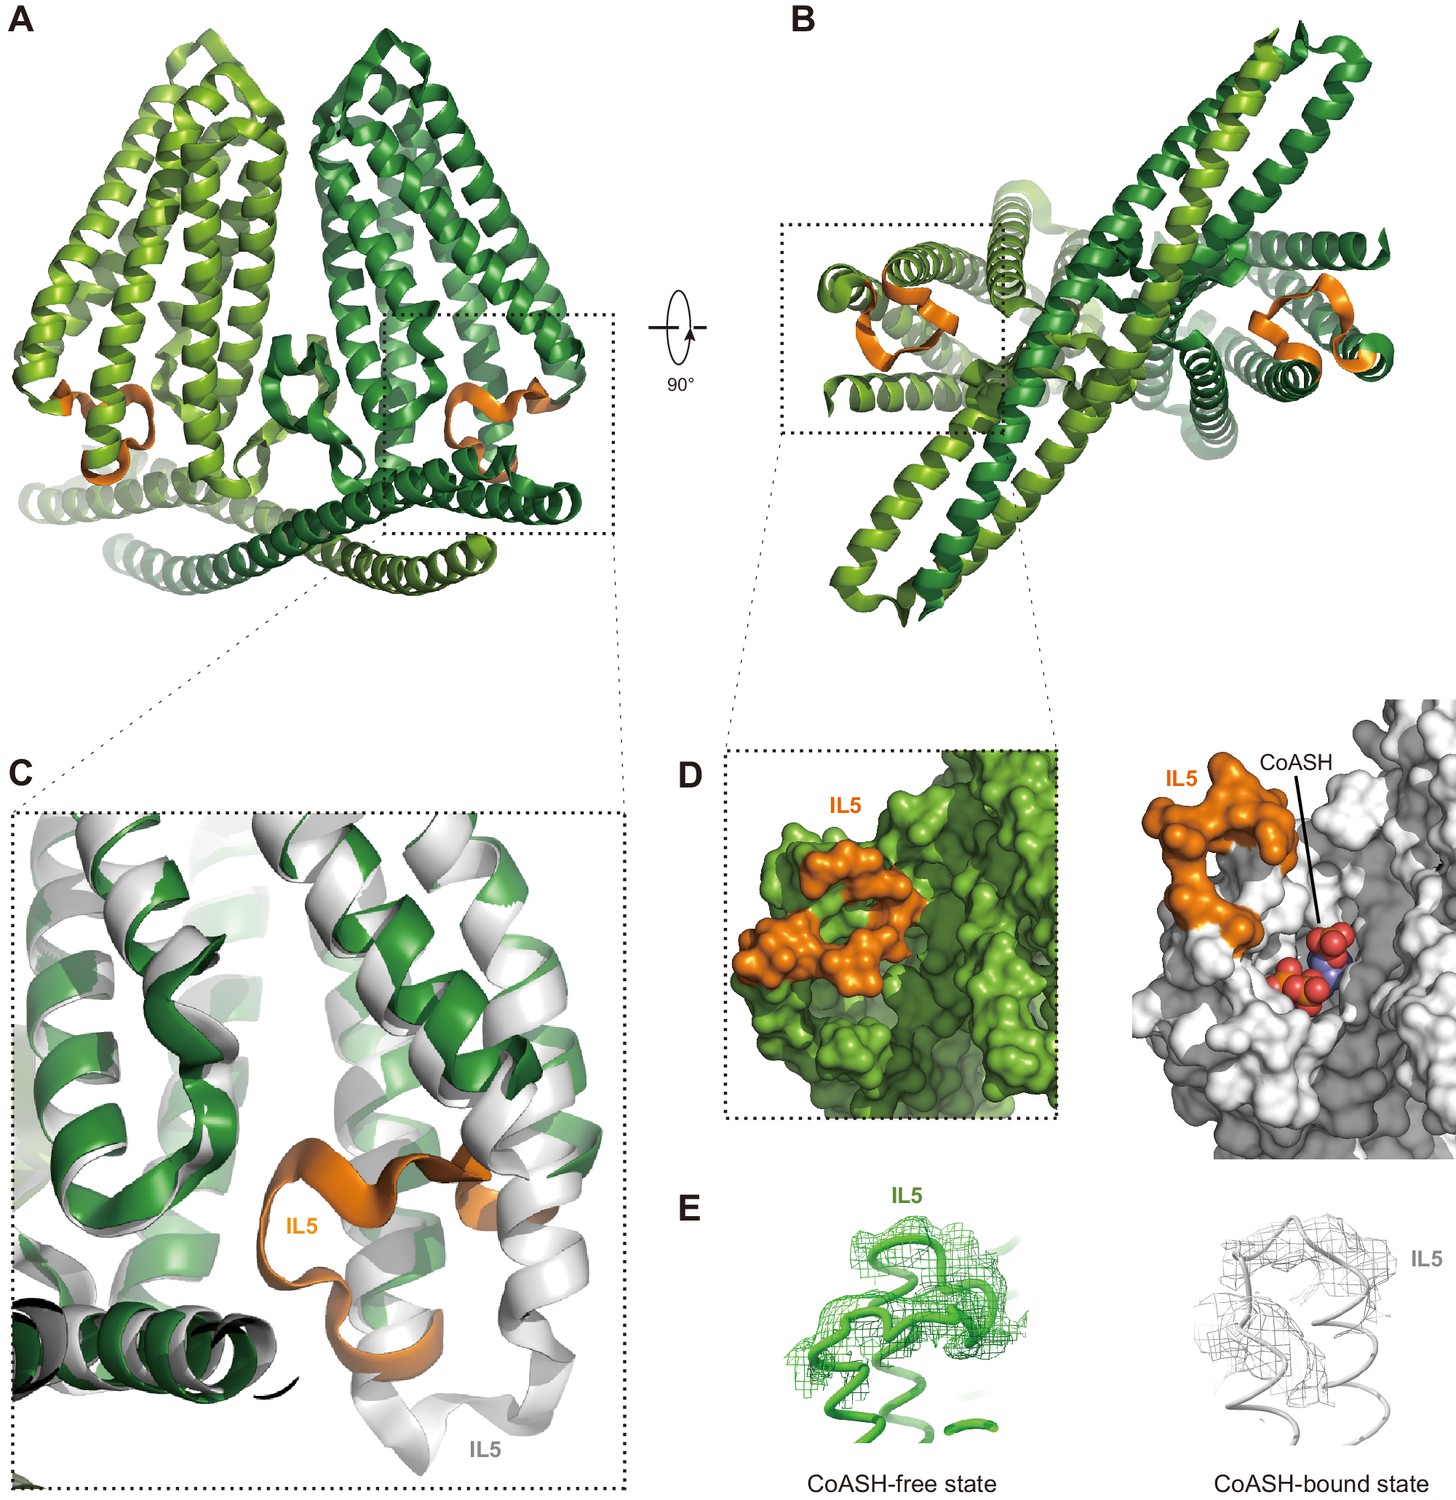
Structure of HsTMEM120A at the CoASH-free state in comparison with the CoASH-bound state.
(A, B) The overall structure of HsTMEM120A without coenzyme A (CoASH) bound. The side view (A) and bottom view from intracellular side (B) are shown. The two monomers are colored light and dark green, respectively, while the intracellular loop IL5 is highlighted in orange. (C) Superposition of the structures of HsTMEM120A at the CoASH-free state (green for the bulk region and orange for IL5) and CoASH-bound state (silver). The view is similar to the one in the dashed box of panel (A). (D) Surface presentation of the region around the CoASH-binding site in the CoASH-free (left) and CoASH-bound (right) HsTMEM120A structures. The IL5 loop region is highlighted in orange. (E) Cryo-electron microscopy (cryo-EM) densities of the IL5 loop in the CoASH-free (left, contoured at 4.5 rmsd) and CoASH-bound (right, contoured at 3.3 rmsd) HsTMEM120A structures.
Figure 5—figure supplement 1
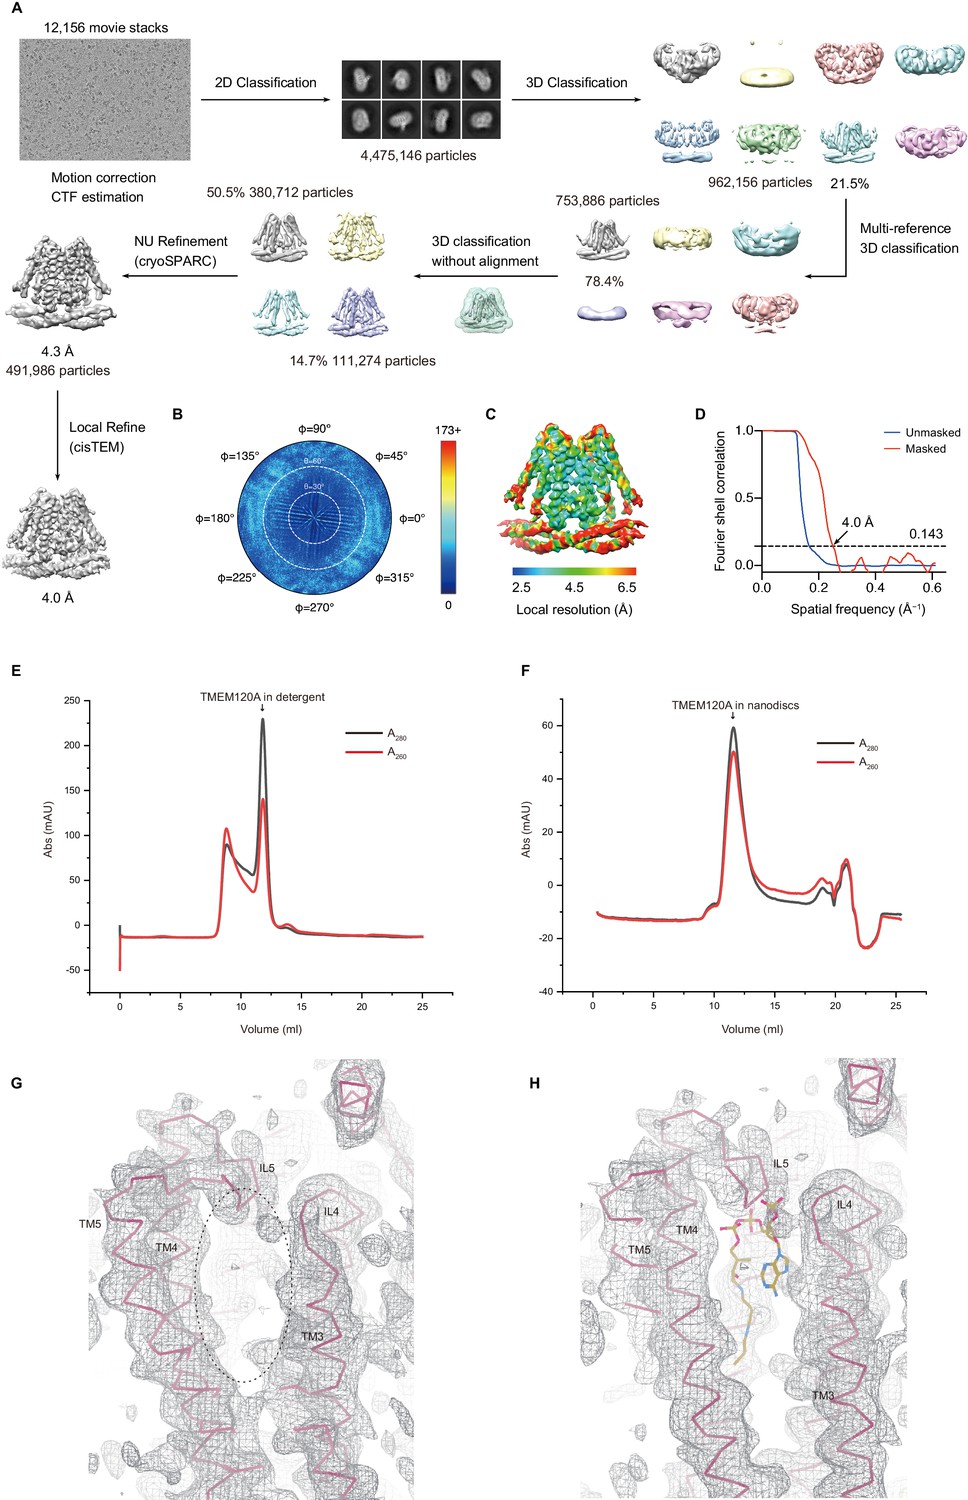
Cryo-EM data collection and processing of HsTMEM120A protein purified in detergent micelle.
(A) The flow chart of data collection, 2D classification, 3D classification, and refinement process. A total of 12,156 movie stacks were collected, and a representative motion-corrected micrograph is shown. Particles were subjected to several rounds of 2D and 3D classifications. The final map was generated by applying local refine procedure in cisTEM. (B) Angular distribution diagram of the particles contributing to the final reconstruction. (C) Estimation of the local resolution in the sharpened 4.0 Å cryo-electron microscopy (cryo-EM) map of HsTMEM120A protein. (D) The Fourier shell correlation (FSC) curves of the map with (red) or without (blue) an applied mask. The resolution was estimated according to the gold standard Fourier shell correlation (GSFSC) (FSC = 0.143) criterion. (E) Gel filtration profile ofHsTMEM120A protein eluted in a detergent solution. (F) Gel filtration profile of HsTMEM120A reconstituted in nanodiscs. Note the apparently lower A260/A280 peak ratio in (E) when compared to the one in (F). (G) The local area in the coenzyme A (CoASH)-binding cavity of the HsTMEM120A structure solved in the detergent. The elliptical dash ring indicates the CoASH-binding site as observed in the structure of the nanodisc complex. (H) A CoASH model from the nanodisc complex structure is superposed on the map region shown in (G). Note that there is no density feature accounting for the CoASH molecule in the cavity. The cryo-EM map at 4.0 Å shown in (G) and (H) is contoured at 5.0 V/4.5 rmsd level, while the other map at 4.2 Å resolution contoured at 0.25 V/3.5 rmsd level shows a similar weak density feature in the cavity and a more continuous density for the IL5 loop.
Figure 5—figure supplement 2
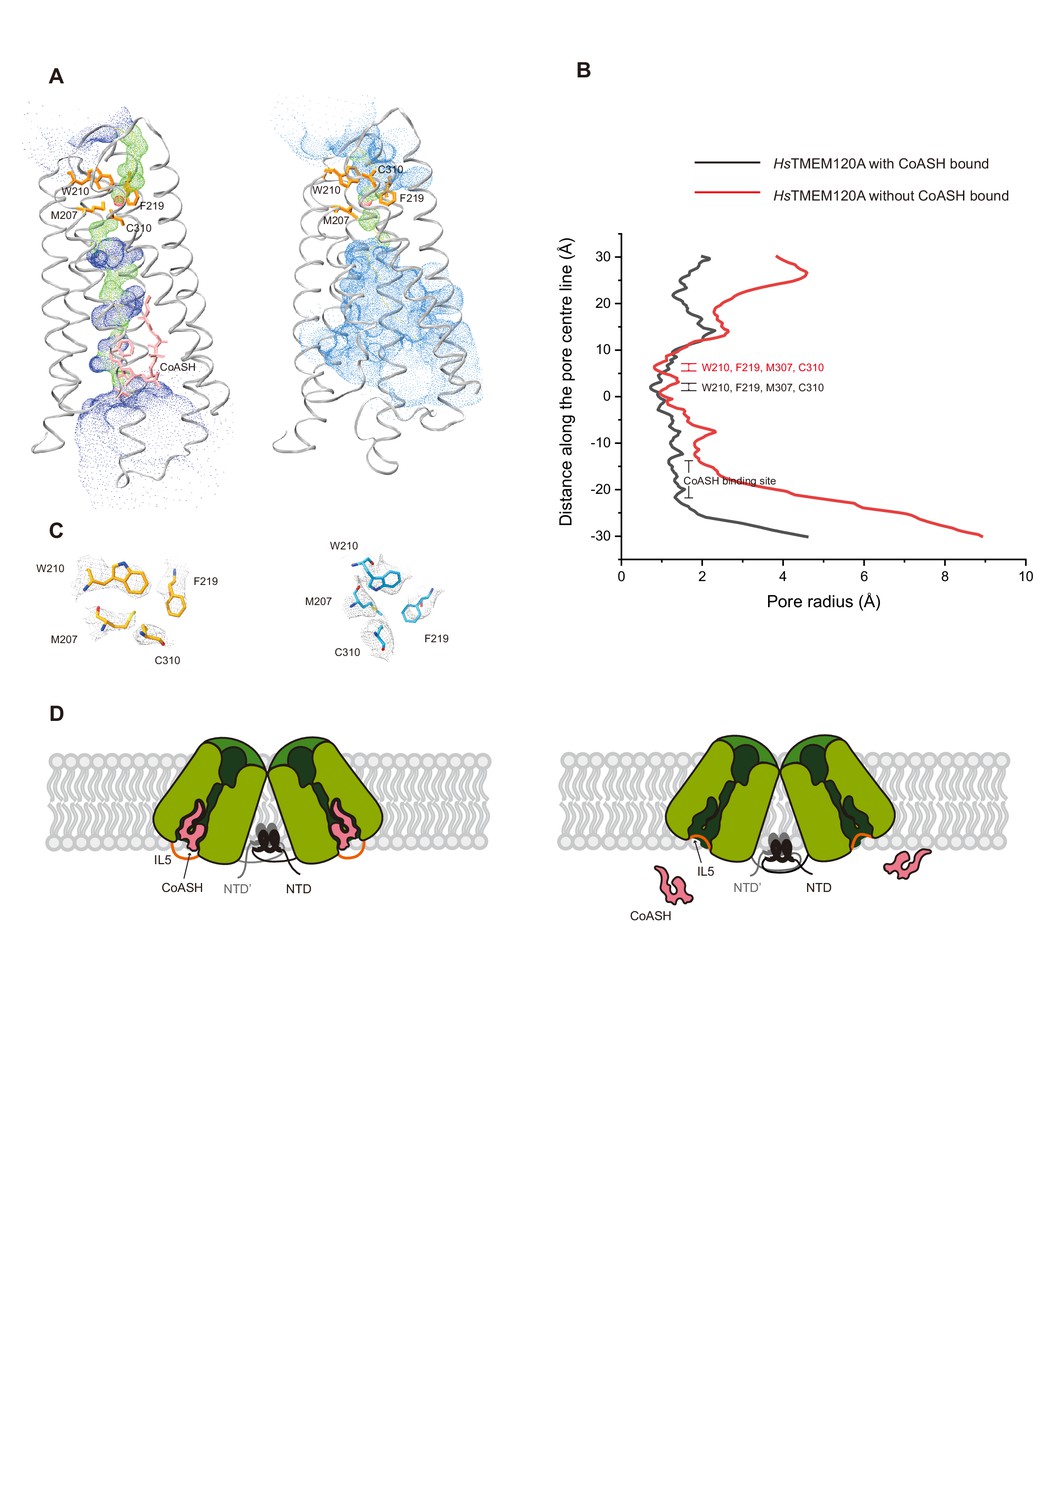
The occluded cavity of HsTMEM120A with CoASH bound in comparison with the open cavity without CoASH bound.
(A) Hole profiles of the coenzyme A (CoASH)-bound (left) and CoASH-free (right) HsTMEM120A structures. Red, pore radius < 1.15 Å; green, 1.15 Å < pore radius < 2.30 Å; blue, pore radius > 2.30 Å. The amino acid residues surrounding the narrowest site on the extracellular side and the CoASH molecule are shown as stick models in orange and pink, respectively. (B) Distribution of the pore radius along the central axes of the HsTMEM120A-CoASH complex and CoASH-free HsTMEM120A. The constricted area around CoASH on the intracellular side and four amino acid residues on the extracellular side are labeled on the right. (C) Cryo-electron microscopy (cryo-EM) densities of the four amino acid residues at the narrowest site on the extracellular side of HsTMEM120A at the CoASH-bound (left, contoured at 12.4 rmsd) and CoASH-free (right, contoured at 3.5 rmsd) states. (D) A mechanistic model accounting for two different functional states of TMEM120A in the cells.
Tables
Key resources table
| Reagent type (species) or resource | Designation | Source or reference | Identifiers | Additional information |
|---|---|---|---|---|
| Gene (Homo sapiens) | HsTMEM120A-pFastBac Dual | Synthetic/ Genscript | N/A | Custom-synthesized cDNA |
| Gene (H. sapiens) | HsTMEM120A-mCherry-pDEST | Yulong Li lab in Peking University | N/A | |
| Gene (Mus musculus) | MmTMEM120A-pEG BacMam | Synthetic | N/A | |
| Gene (M. musculus) | MmTMEM120A- pcDNA3.1 | Synthetic | N/A | FP: gccctctagactcgagcggccgcgccaccATGCAGTCCCCGCCCCCGGAC RP: GGCGCGCCAAGCTTCTAGTCCTTCTTGTTCCCGTGCTGCTGGCTG |
| Gene (M. musculus) | MmPiezo1-mRuby2 pcDNA3.1 | Zhao et al., 2018 | N/A | |
| Gene (M. musculus) | MmPiezo2-GST-ires-GFP pcDNA3.1 | Wang et al., 2019 | N/A | |
| Gene (H. sapiens) | HsTMEM63A-mCherry-pDEST | Yulong Li lab in Peking University | N/A | |
| Strain, strain background (Escherichia coli) | Turbo Chemically Competent Cell | AngYuBio | Cat# X17012 | |
| Strain, strain background (E. coli) | DH10Bac Chemically Competent Cell | AngYuBio | Cat# G6006 | |
| Cell line (Spodoptera frugiperda) | Sf9 | ATCC | Cat# CRL-1711 RRID:CVCL_0549 | |
| Cell line (H. sapiens) | HEK293T-Piezo1-KO | Cahalan et al., 2015 | N/A | |
| Antibody | THE NWSHPQFEK Tag Antibody [HRP] (mouse monoclonal) | Genscript | Cat# A01742 RRID:AB_2622218 | WB (1:10,000) |
| Recombinant DNA reagent | HsTMEM120A W193A-pFastBac Dual | This study | N/A | Construct made and maintained in Z Liu lab |
| Sequence-based reagent | W193A _Forward | Beijing Genomics Institution | PCR primers | CGTATCAAGGGTTGGGCCGTGTTCCACCACTAC |
| Sequence-based reagent | W193A_Reverse | Beijing Genomics Institution | PCR primers | GTAGTGGTGGAACACGGCCCAACCCTTGATACG |
| Chemical compound, drug | Cellfectin II Reagent | Gibco | Cat# 11605102 | |
| Chemical compound, drug | ESF 921 Insect Cell Culture Medium, Protein Free | Expression Systems | Cat# 96-001-01 | |
| Chemical compound, drug | Grace's Insect Medium, supplemented | Gibco | Cat# 11605102 | |
| Chemical compound, drug | n-Dodecyl-β-D-Maltopyranoside (β-DDM) | Anatrace | Cat# D310 | |
| Chemical compound, drug | Cholesteryl Hemisuccinate (CHS) | Anatrace | Cat# CH210 | |
| Chemical compound, drug | CHAPS | Anatrace | Cat# C316 | |
| Chemical compound, drug | GDN | Anatrace | Cat# GDN101 | |
| Chemical compound, drug | Streptavidin Beads 6FF | Smart Lifesciences | Cat# SA021100 | |
| Chemical compound, drug | d-Desthiobiotin | Sigma-Aldrich | Cat# D1411 | |
| Chemical compound, drug | 18:1 (Δ9-Cis) PE (DOPE) | Avanti | Cat# 850725 | Powder |
| Chemical compound, drug | 16:0-18:1 PS (POPS) | Avanti | Cat# 840034 | Powder |
| Chemical compound, drug | 16:0-18:1 PC (POPC) | Avanti | Cat# 850457 | Powder |
| Chemical compound, drug | Bio-Beads SM-2 adsorbents | Bio-Rad | Cat# 1523920 | |
| Chemical compound, drug | Perchloric acid | SCR | Cat# 10015160 | |
| Chemical compound, drug | Coenzyme A sodium salt hydrate | Sigma-Aldrich | Cat# C4780 | |
| Chemical compound, drug | Lipofectamine3000 transfection kit | ThermoFisher | Cat# L3000015 | |
| Chemical compound, drug | poly-D-lysine | Beyotime | Cat# C0312 | |
| Chemical compound, drug | L-α-phosphatidylcholine | Sigma-Aldrich | Cat# P3644 | Powder |
| Chemical compound, drug | Cholesterol | Sigma-Aldrich | Cat# C8667 | Powder |
| Chemical compound, drug | 4ME 16:0 PC (DPhPC) | Avanti | Cat# 850356 | Powder |
| Software, algorithm | Serial EM | http://bio3d.colorado.edu/SerialEM | RRID:SCR_017293 | https://doi.org/10.1016/j.jsb.2005.07.007 |
| Software, algorithm | MotionCor2 | http://msg.ucsf.edu/em/software/motioncor2.html | RRID:SCR_016499 | https://doi.org/10.1038/nmeth.4193 |
| Software, algorithm | CTFFIND 4.1.10 | http://grigoriefflab.janelia.org/ctffind4 | RRID:SCR_016732 | https://doi.org/10.1016/j.jsb.2015.08.008 |
| Software, algorithm | cryoSPARC v3.1 | https://cryosparc.com/ | RRID:SCR_016501 | https://doi.org/10.1038/nmeth.4169 |
| Software, algorithm | Chimera | https://www.cgl.ucsf.edu/chimera/download.html | RRID:SCR_004097 | https://doi.org/10.1002/jcc.20084 |
| Software, algorithm | Gctf | https://www.mrclmb.cam.ac.uk/kzhang/Gctf/ | RRID:SCR_016500 | https://doi.org/10.1016/j.jsb.2015.11.003 |
| Software, algorithm | Gautomatch | https://hpc.nih.gov/apps/gautomatch.html | N/A | http://www.mrc-lmb.cam.ac.uk/kzhang/ |
| Software, algorithm | Topaz | http://cb.csail.mit.edu/cb/topaz/ | N/A | https://doi.org/10.1038/s41592-019-0575-8 |
| Software, algorithm | cisTEM | https://cistem.org/ | RRID:SCR_016502 | https://doi.org/10.7554/eLife.35383 |
| Software, algorithm | MonoRes | http://scipion.i2pc.es/ | N/A | https://doi.org/10.1016/j.str.2017.12.018 |
| Software, algorithm | COOT 0.8.9 | http://www2.mrclmb.cam.ac.uk/personal/pemsley/coot | RRID:SCR_014222 | https://doi.org/10.1107/S0907444910007493 |
| Software, algorithm | PSIPRED 4.0 | http://bioinf.cs.ucl.ac.uk/psipred | RRID:SCR_010246 | https://doi.org/10.1093/nar/gkz297 |
| Software, algorithm | PHENIX | https://www.phenix-online.org | RRID:SCR_014224 | https://doi.org/10.1107/S0907444909052925 |
| Software, algorithm | HOLE | http://www.holeprogram.org/ | N/A | https://doi.org/10.1016/s0263-7855(97)00009-x |
| Software, algorithm | ChimeraX | https://www.rbvi.ucsf.edu/chimerax/ | RRID:SCR_015872 | https://doi.org/10.1002/pro.3943 |
| Software, algorithm | PyMol 2.1.1 | Schrödinger, LLC | RRID:SCR_000305 | https://pymol.org/ |
| Software, algorithm | Peakview 2.1 | https://sciex.com/products/software/peakview-software | RRID:SCR_015786 | |
| Software, algorithm | MicroCal ITC200 | https://www.malvernpanalytical.com/ | RRID:SCR_020260 | |
| Software, algorithm | ESPript 3 | https://espript.ibcp.fr | RRID:SCR_006587 | https://doi.org/10.1093/nar/gku316 |
| Software, algorithm | T-COFFEE | http://tcoffee.crg.cat/apps/tcoffee/index.html | RRID:SCR_019024 | https://doi.org/10.1006/jmbi.2000.4042 |
| Software, algorithm | The ConSurf Server | https://consurf.tau.ac.il/ | RRID:SCR_002320 | https://doi.org/10.1093/nar/gkw408 |
| Software, algorithm | VMD 1.9.3 | https://www.ks.uiuc.edu/Research/vmd/ | RRID:SCR_001820 | |
| Software, algorithm | PatchMaster | HEKA http://www.heka.com/downloads/downloads_main.html#down_patchmaster | RRID:SCR_000034 | |
| Software, algorithm | GraphPad Prism | GraphPad Software Inc http://www.graphpad.com/scientific-software/prism/ | RRID:SCR_002798 | |
| Software, algorithm | Origin 9.2 | OriginLab http://www.originlab.com/ | RRID:SCR_014212 | |
| Software, algorithm | Igor Pro | WaveMetrics https://www.wavemetrics.com/ | RRID:SCR_000325 | |
| Other | Structural model of human TMEM120A in the CoASH-bound state and the corresponding cryo-EM map | This study | PDB ID 7F3T, EMD-31440 | Available for download in the webpage https://www.rcsb.org/structure/7F3T |
| Other | Structural model of human TMEM120A in the CoASH-free state and the corresponding cryo-EM map | This study | PDB ID 7F3U, EMD-31441 | Available for download in the webpage https://www.rcsb.org/structure/7F3U |
| Other | R1.2/1.3 100 Holey Carbon Films Cu 200 mesh | Quantifoil | Cat# Q56244 | |
| Other | R1.2/1.3 100 Holey Carbon Films Cu 300 mesh | Quantifoil | Cat# Q55987 | |
| Other | Immobilon-PSQtransfer membrane | Merck Millipore | Cat# ISEQ00010 | Filter type: PVDF |
Additional files
-
Supplementary file 1
Cryo-EM data collection and processing, refinement, and validation statistics of HsTMEM120A structures.
- https://cdn.elifesciences.org/articles/71474/elife-71474-supp1-v2.docx
-
Transparent reporting form
- https://cdn.elifesciences.org/articles/71474/elife-71474-transrepform-v2.docx
Download links
A two-part list of links to download the article, or parts of the article, in various formats.
Downloads (link to download the article as PDF)
Open citations (links to open the citations from this article in various online reference manager services)
Cite this article (links to download the citations from this article in formats compatible with various reference manager tools)
TMEM120A contains a specific coenzyme A-binding site and might not mediate poking- or stretch-induced channel activities in cells
eLife 10:e71474.
https://doi.org/10.7554/eLife.71474


