Mutation saturation for fitness effects at human CpG sites
- Department of Biological Sciences, Columbia University, United States
- Department of Systems Biology, Columbia University, United States
Figures
Figure 1 with 4 supplements
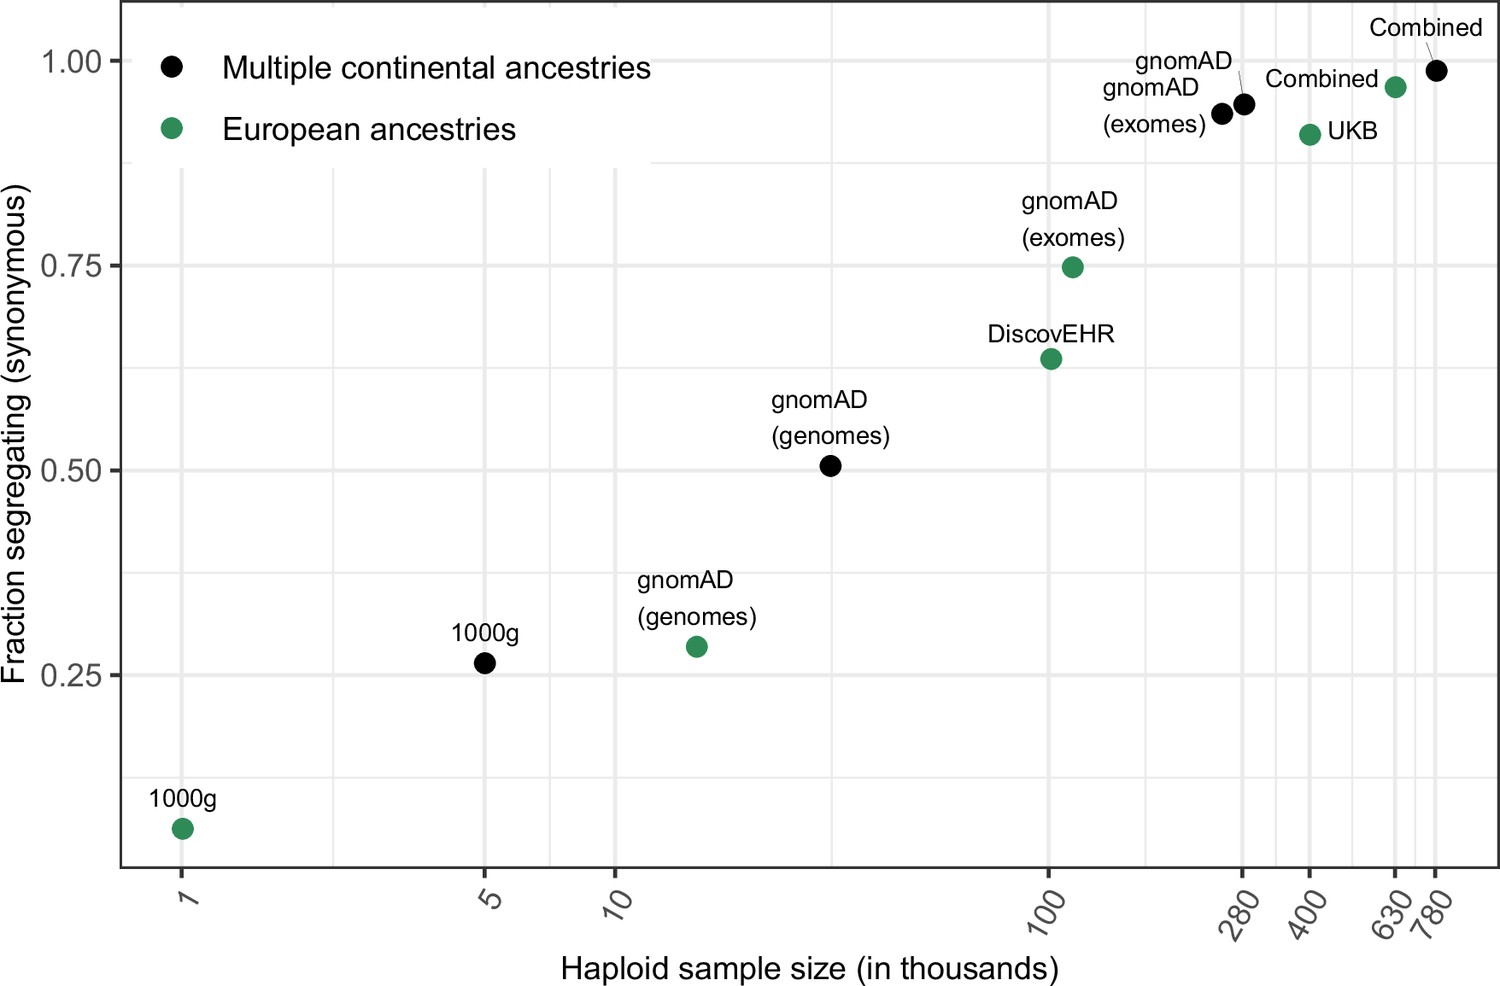
Fraction of methylated CpG sites that are polymorphic for a transition, by sample size.
The combined dataset encompasses three non-overlapping data sources: gnomAD (v2.1), the UK Biobank (UKB), and the DiscovEHR cohort. ‘European’ samples include the populations designated as ‘EUR’ in 1000 Genomes, ‘Non-Finnish European’ subsets of exome and whole genome datasets in gnomAD, as well as the UK Biobank and DiscovEHR, which have >90% samples labeled as of European ancestry.
Figure 1—figure supplement 1
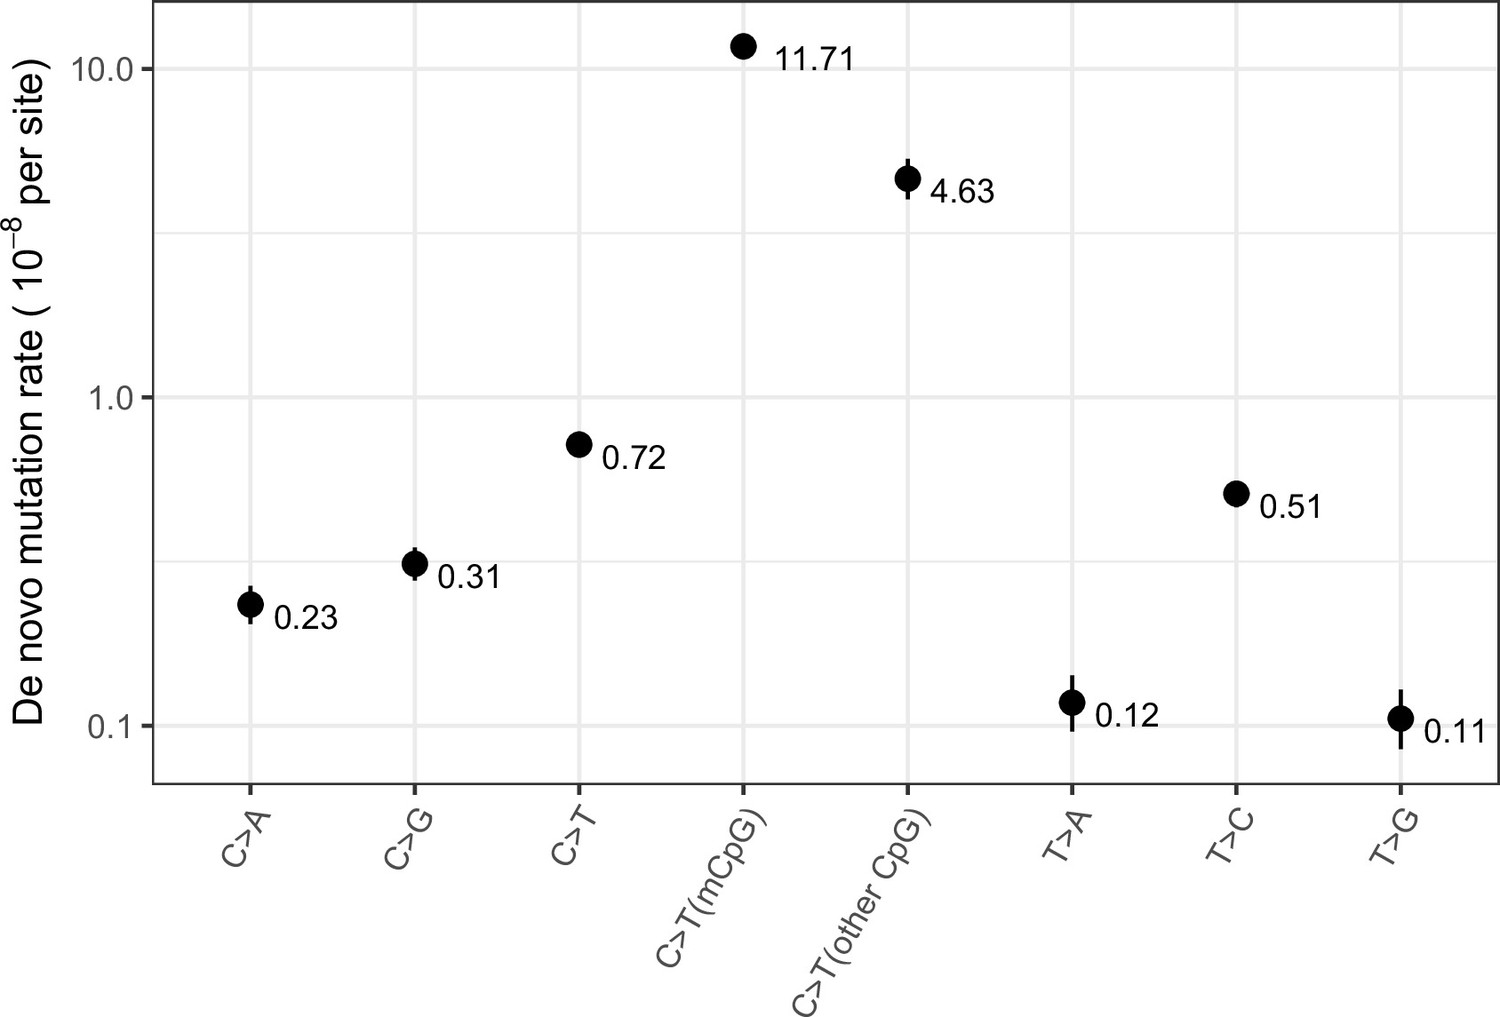
Exonic de novo mutation rates per generation per site estimated from a sample of 2976 parent-offspring trios data from Halldorsson et al., 2019, by mutation type.
‘mCpG’ refers to a CpG site with methylation level ≥65 % in both testes and ovaries, and ‘other CpG’ to a CpG site with methylation level <65% in either testes or ovaries. Error bars reflect the 95 % Poisson confidence interval around mutation counts for each type.
Figure 1—figure supplement 2
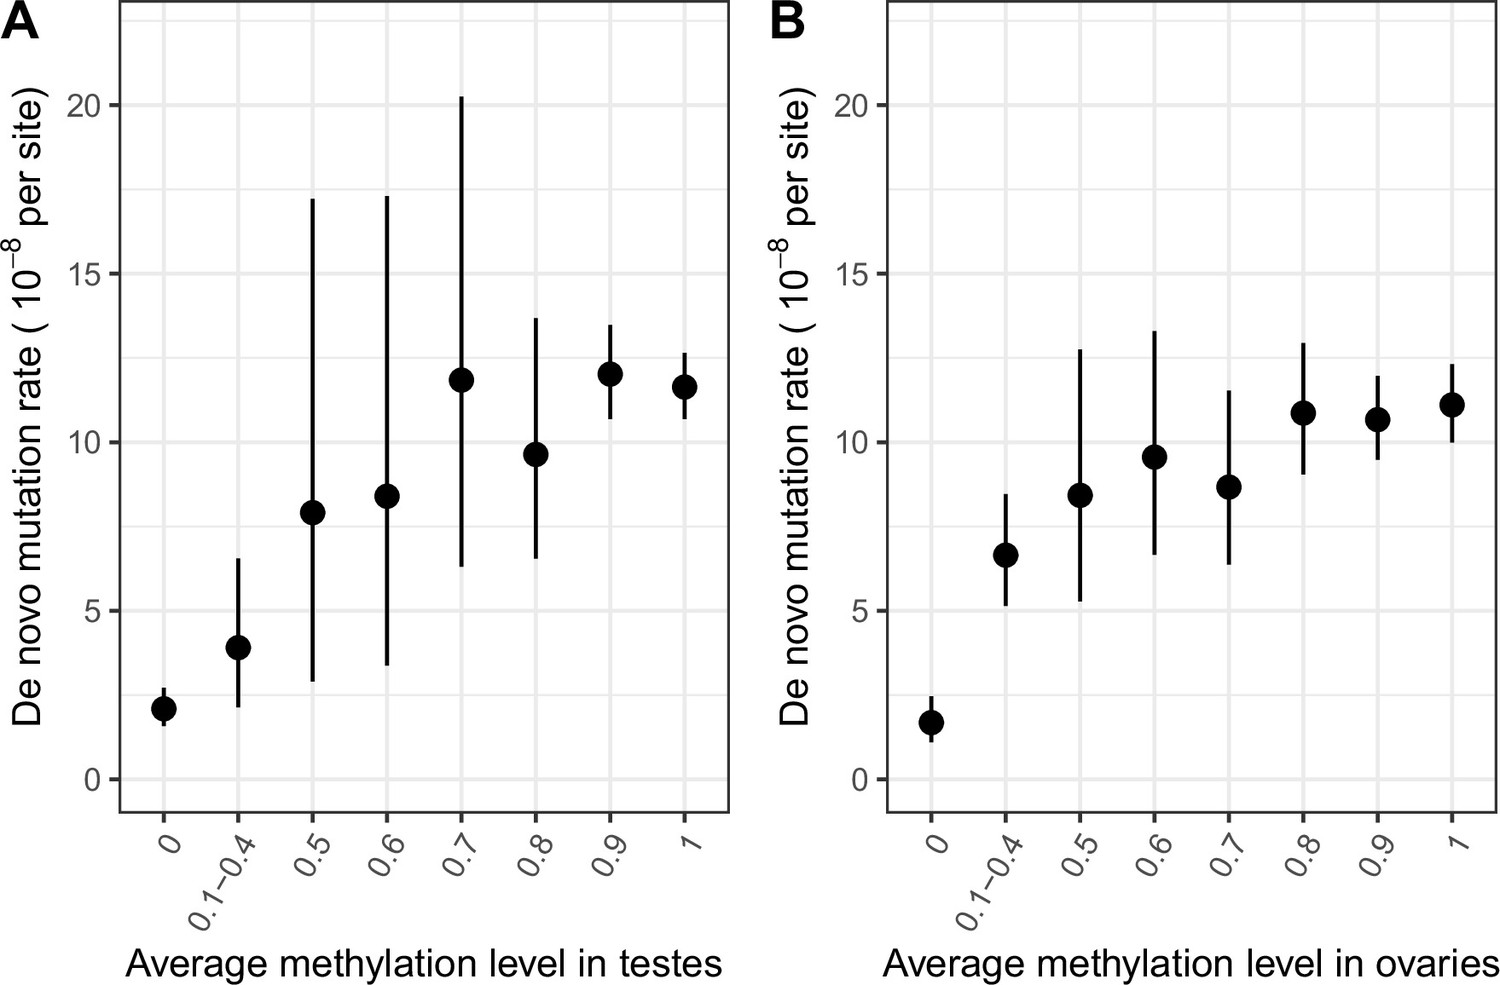
De novo mutation rate in exons in a sample of 2976 parent-offspring trios, by average methylation levels.
(a) De novo mutation rate by average methylation levels in testes (b) De novo mutation rate by average methylation levels in ovaries. Error bars reflect the 95 % Poisson confidence interval around mutation counts in each group (the minimum number of DNMs in each bin is 5).
Figure 1—figure supplement 3
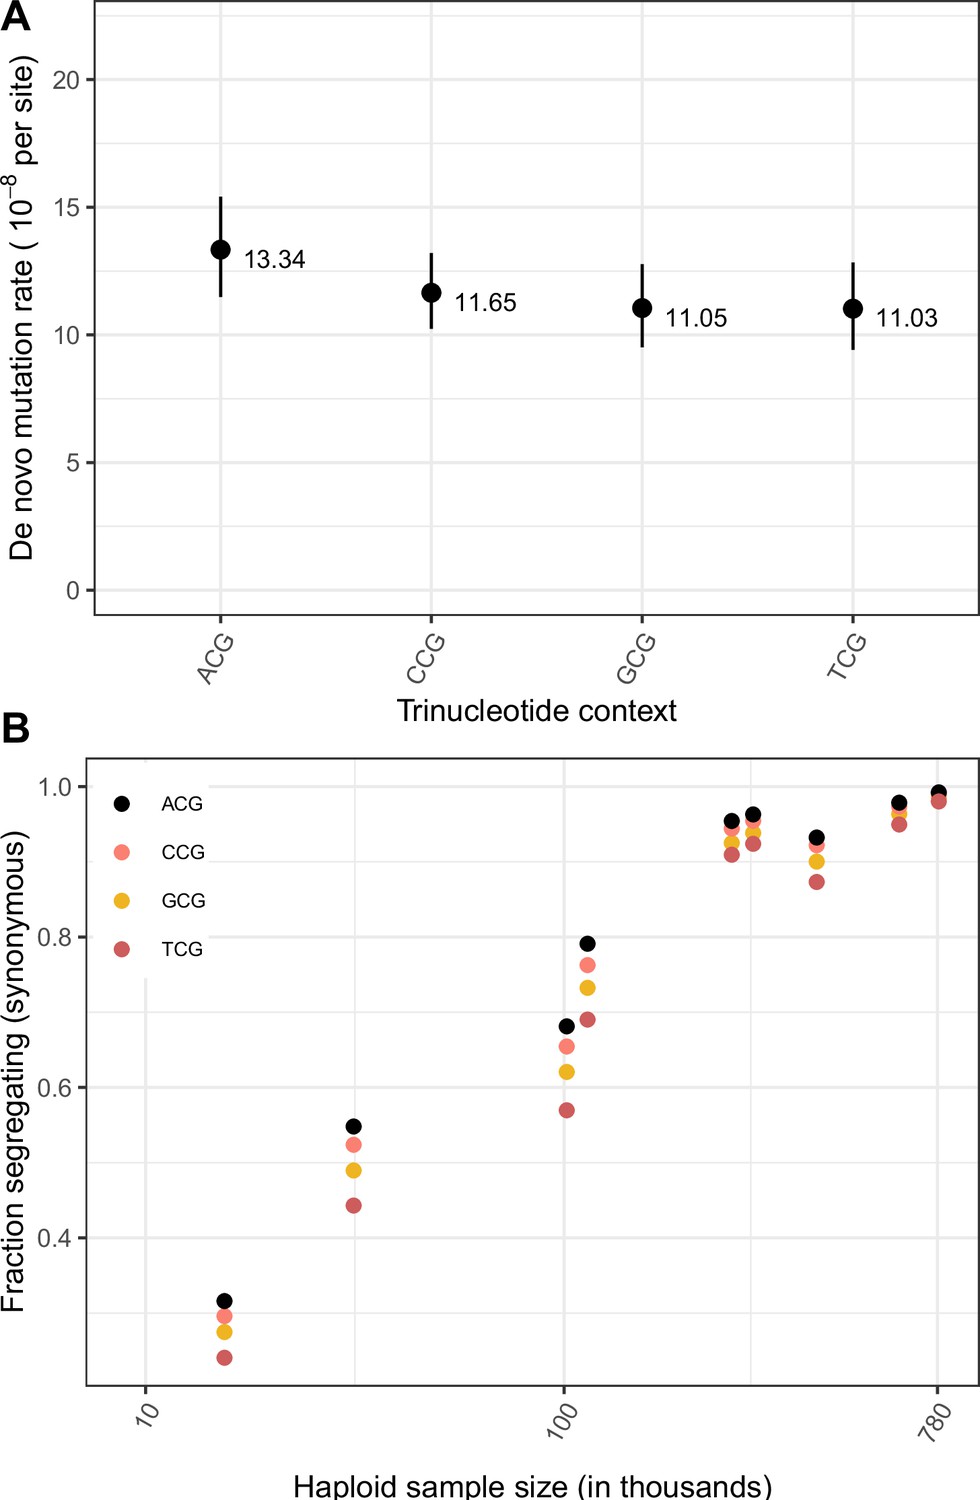
Effect of trinucleotide context on mutation rate and mutation saturation at methylated CpG sites.
(a) Exonic de novo mutation rates at methylated CpG sites, by trinucleotide context. Error bars reflect the 95% Poisson confidence interval around mutation counts for each context. (b) Fraction of possible synonymous C > T mutations at methylated CpG sites that are observed in a sample of given size, by trinucleotide context.
Figure 1—figure supplement 4
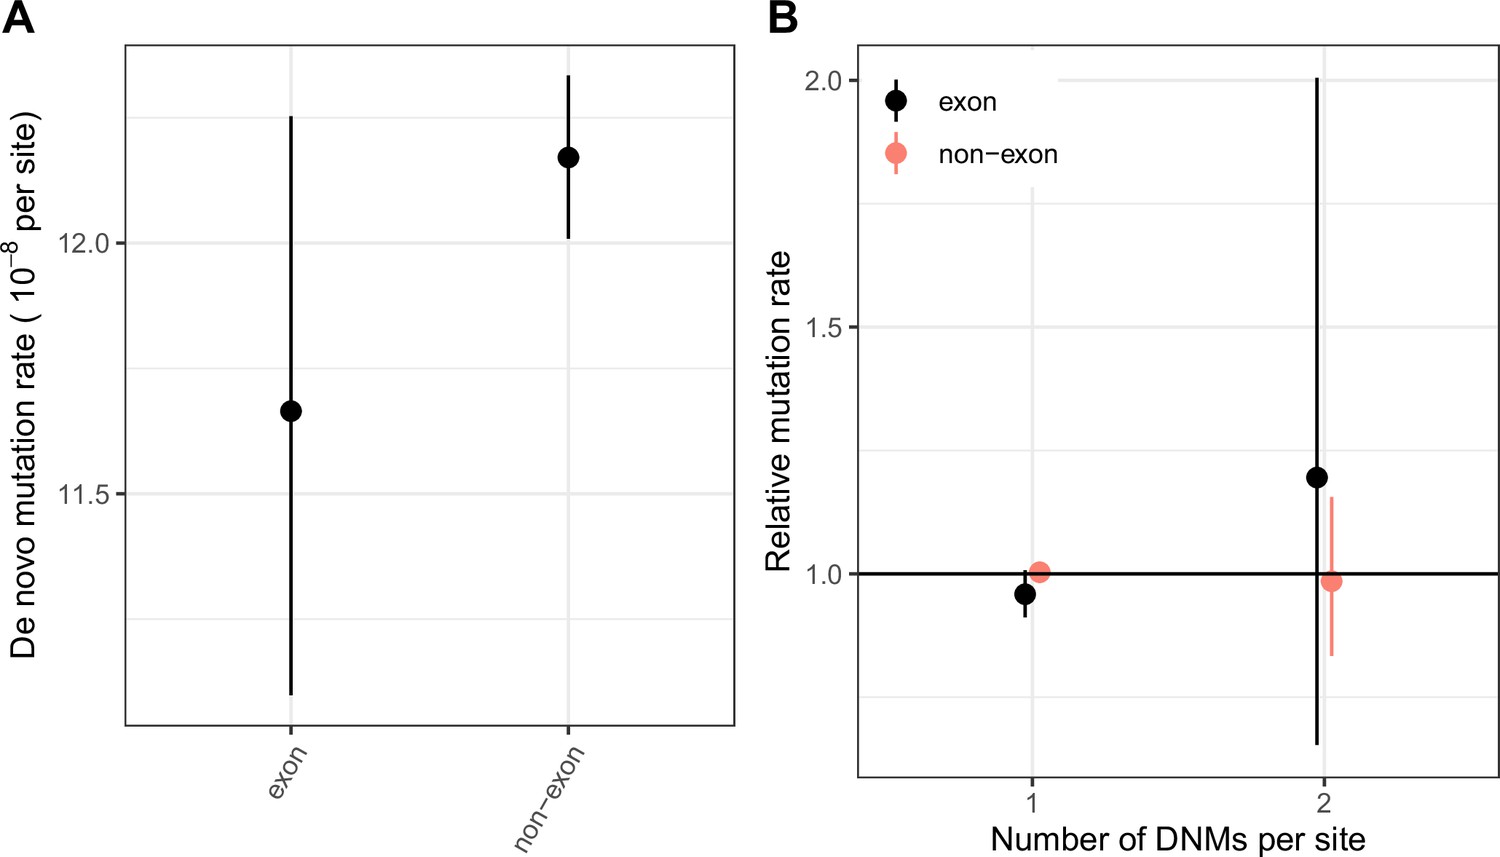
Comparing the distribution of CpG transition rates at methylated sites within and ouside exons.
(a) DNM rates for CpG transitions at methylated sites in exons (exonic regions obtained from Gencode V19; see Materials and methods) vs. non-exons, with 95 % Poisson confidence intervals. (b) The rate of single hits (one DNM at a site) and double hits (two DNMs at a site) in exons vs non-exons, rescaled to the average rate of single and double hits in the genome, with 95 % Poisson confidence intervals.
Figure 2 with 5 supplements
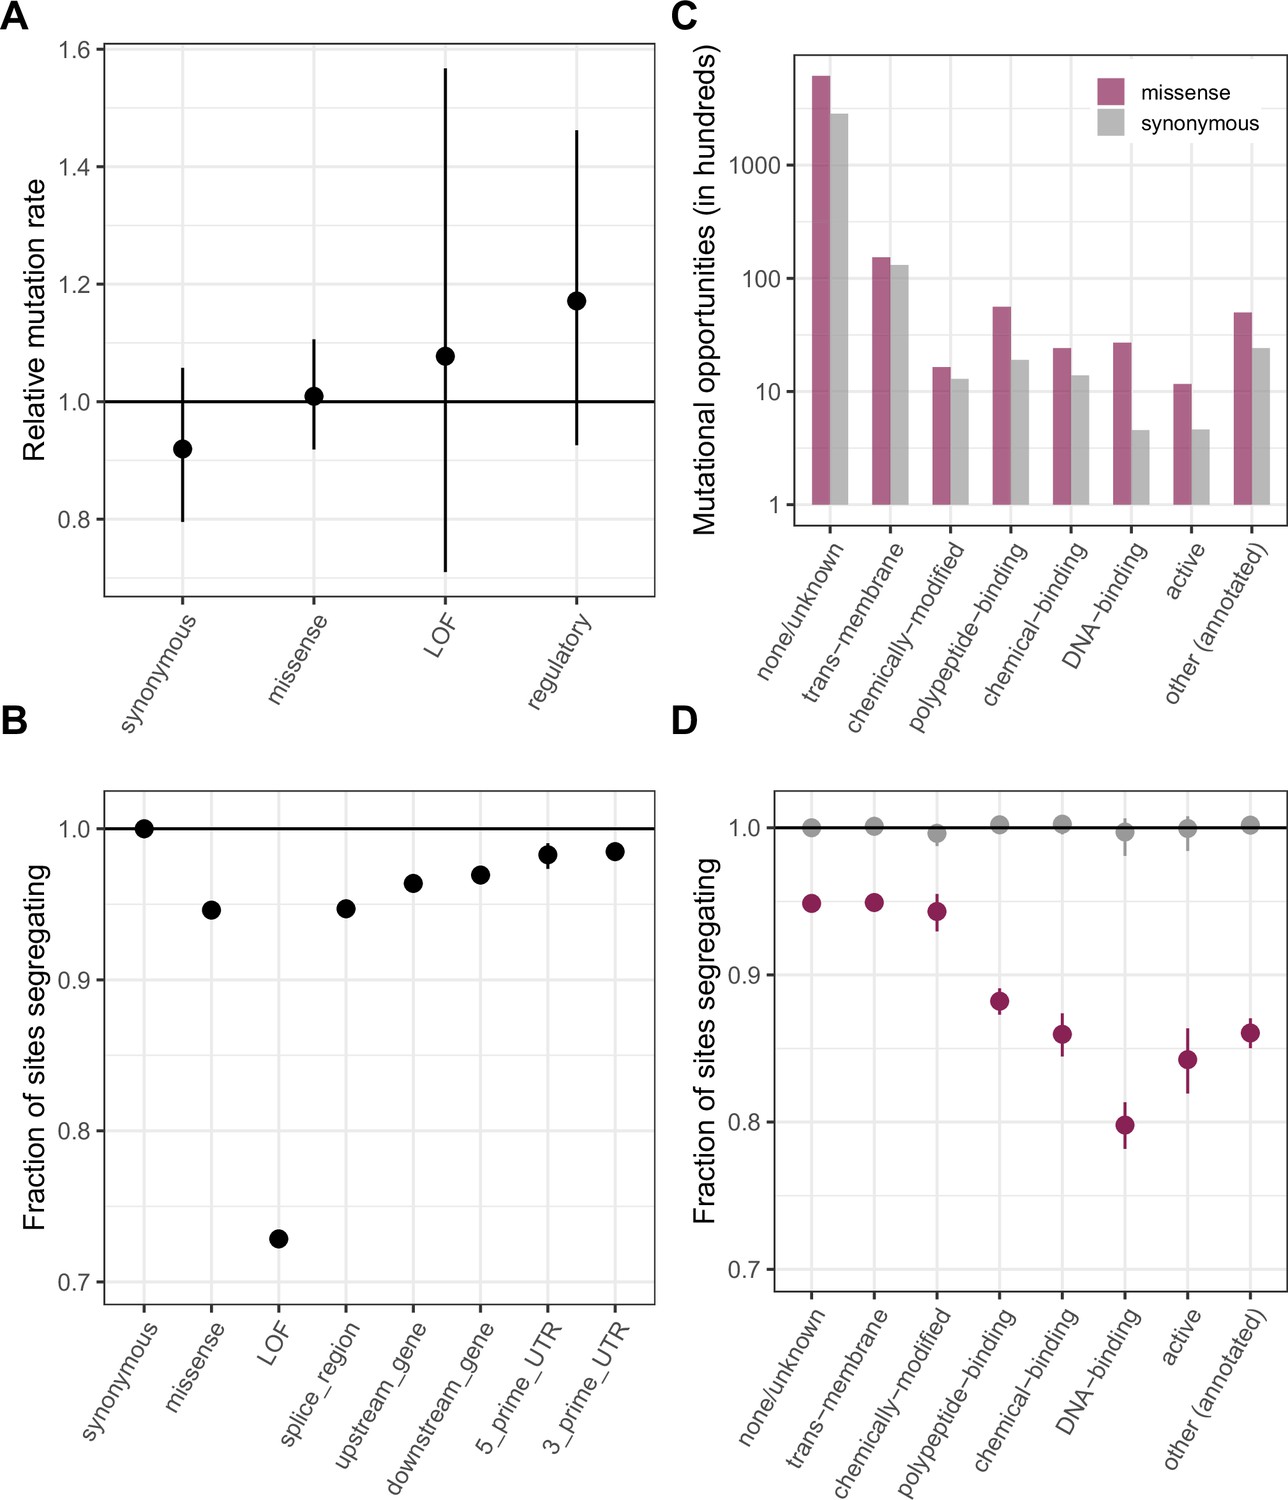
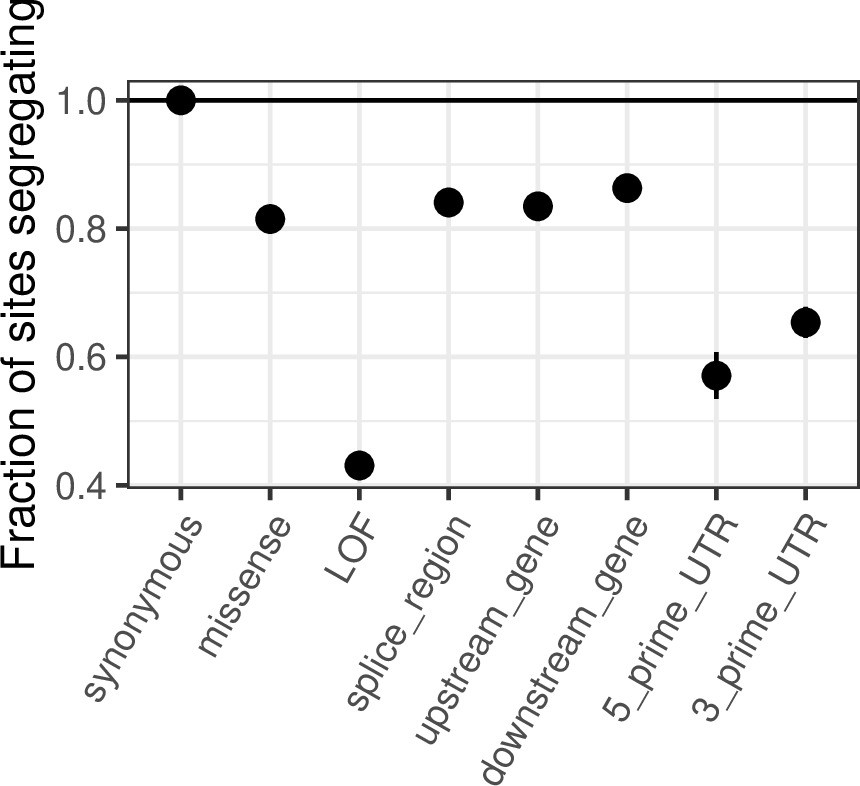
Comparing de novo mutation rates and the fraction of segregating sites across annotations.
(a) DNM rates for CpG transitions at highly methylated sites by annotation class, rescaled by the total DNM rate in exons. Fisher exact tests (FETs) of the proportion of sites with DNMs in each annotation compared to all other annotations yield p-values > 0.1 in all cases. (b) Fraction of highly methylated CpG sites that are segregating as a C/T polymorphism in an annotation class, relative to the fraction of synonymous sites segregating. Error bars are 95 % confidence intervals assuming the number of segregating sites is binomially distributed (FET p-values << 10–5 for comparisons of all annotations with synonymous sites). LOF variants are defined as stop-gained and splice donor/acceptor variants that do not fall near the end of the transcript, and meet the other criteria to be classified as ‘high-confidence’ loss-of-function in the gnomAD data (see Materials and Methods). (c) The amount of data for synonymous and missense changes involving highly methylated CpG transitions by the type of functional protein site. (d) The proportion of synonymous and missense segregating C/T polymorphisms in different classes of functional sites. Error bars are 95 % confidence intervals assuming the number of segregating sites is binomially distributed (FET p-values << 10–5 for comparisons of all missense annotations with synonymous sites; Materials and methods). All annotations are obtained using the canonical transcripts of protein coding genes (see Materials and methods).
Figure 2—figure supplement 1
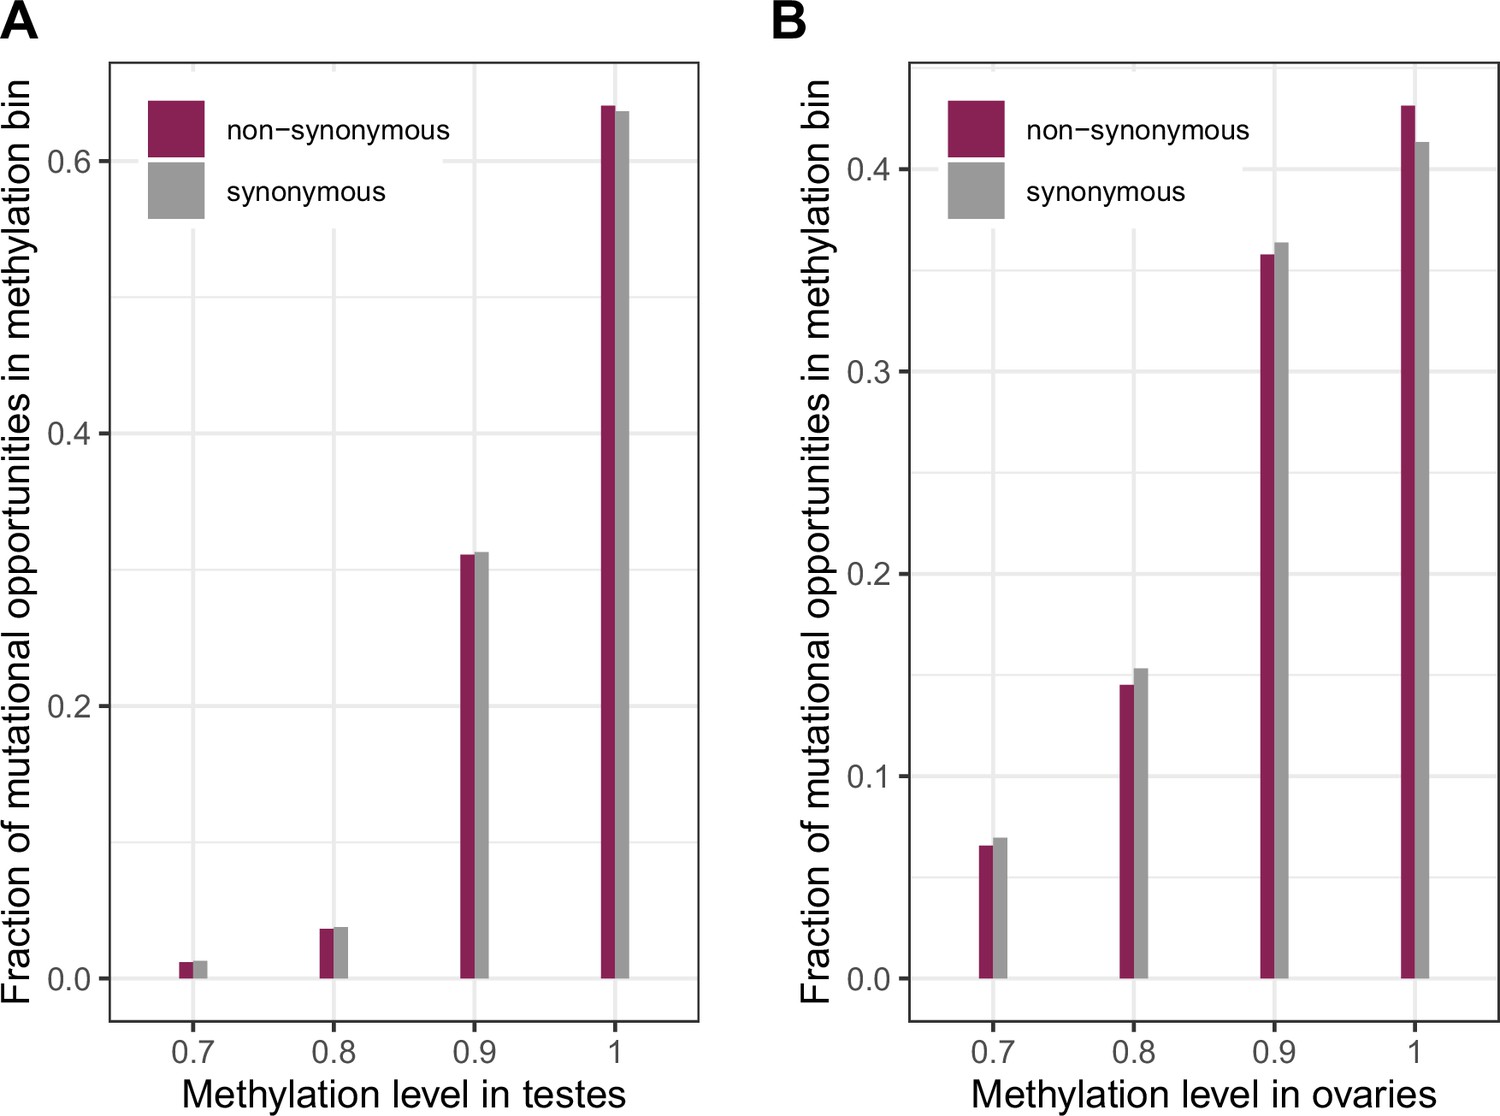
Distribution of methylation levels at synonymous and non-synonymous methylated CpG sites in testes and ovaries.
(a) The distribution of methylation levels in testes (chi-squared test p-value << 10–5) (b) The distribution of methylation levels in ovaries (chi-squared test p-value << 10–5). The small but significant shift towards higher methylation for non-synonymous sites compared to synonymous ones suggests a small shift towards higher mutation rates at these sites compared to synonymous sites, which should be conservative with regard to identifying non-synonymous sites under selection.
Figure 2—figure supplement 2
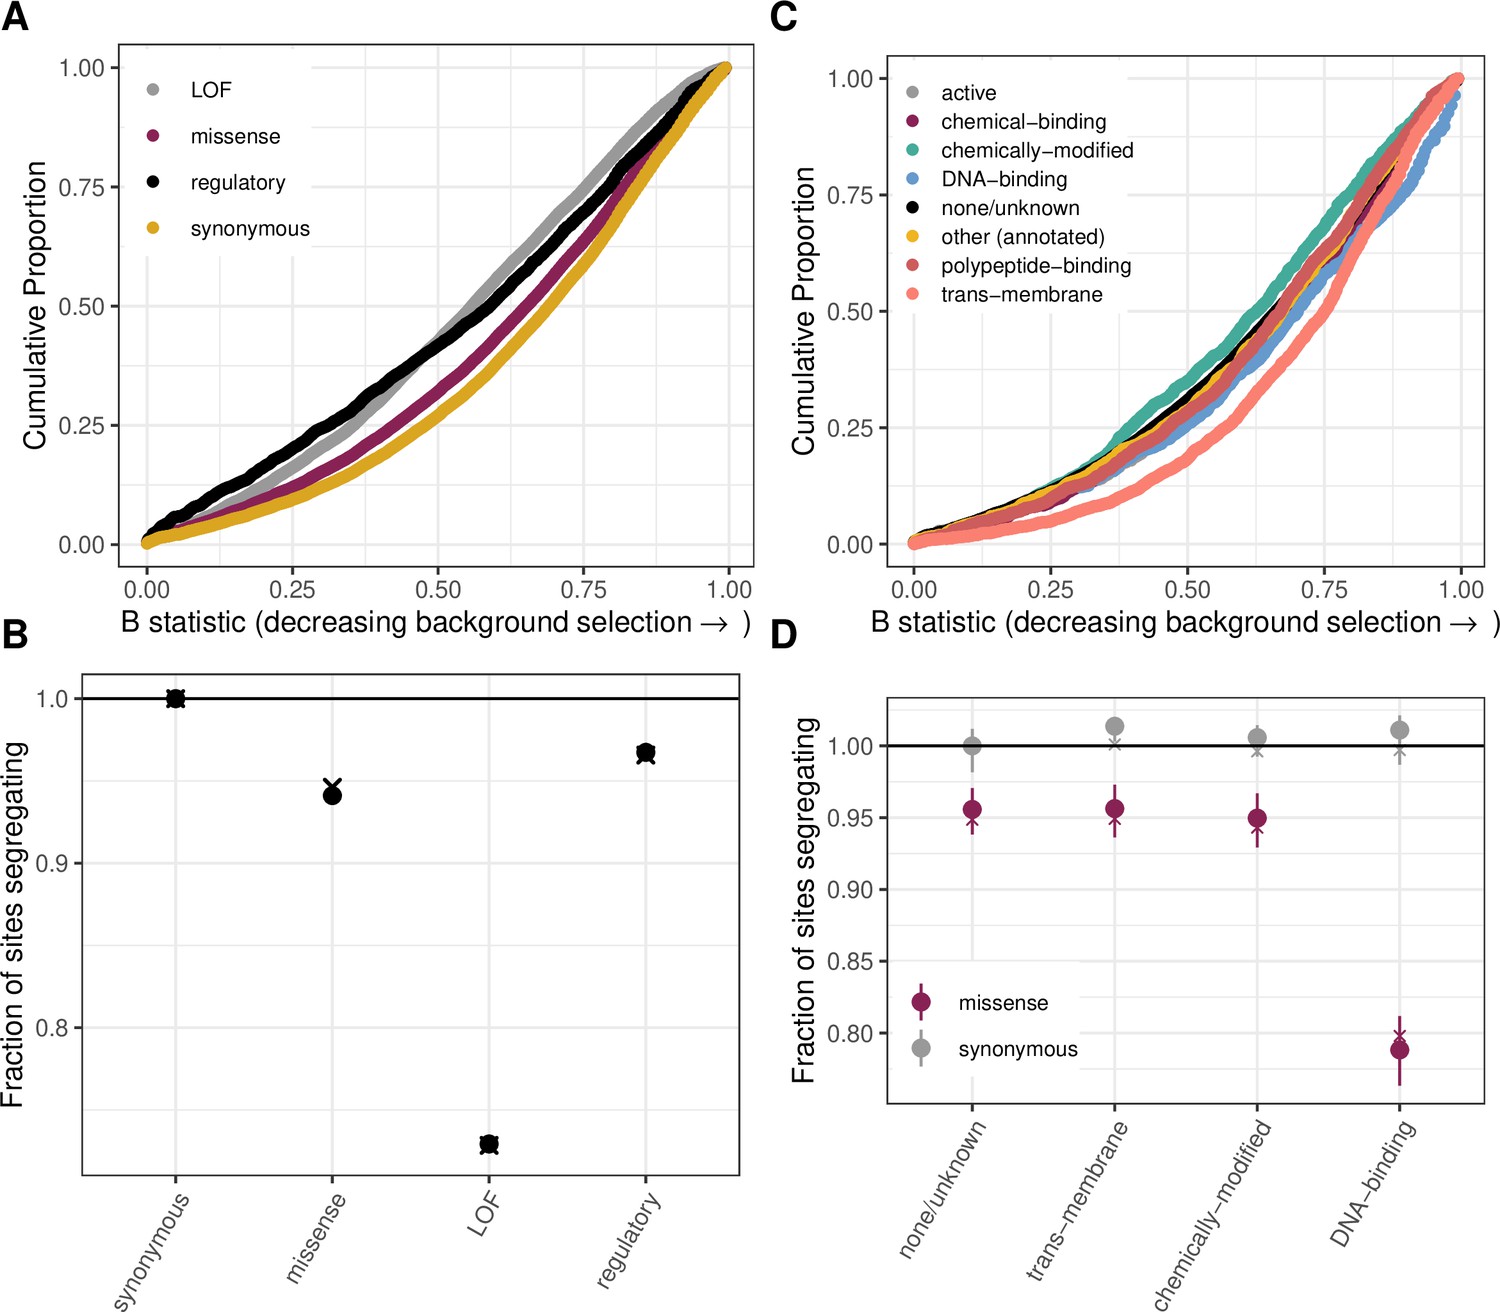
The effect of background selection on the fraction of sites segregating in each annotation.
(a) Cumulative distribution of the B-statistic from McVicker et al., 2009 for all possible CpG transitions at methylated sites by annotation class. (b) Fraction of methylated CpG sites that are segregating as a C/T polymorphism in an annotation class, relative to the fraction of synonymous sites segregating, after matching the distribution of the B-statistic across annotations. The fraction segregating without matching for B-statistics (shown in Figure 2b) is denoted by crosses, to enable comparison. Regulatory variants include non-LOF splice region variants and UTRs. (c) Cumulative distribution of the B-statistic for all possible CpG transitions at methylated sites by functional class. (d) The proportion of synonymous and missense segregating C/T polymorphisms for four functional classes, after matching the distribution of the B-statistic across categories. Error bars are 95 % confidence intervals assuming the number of segregating sites is binomially distributed. The fraction segregating without matching for B-statistics (shown in Figure 2d) is denoted by crosses, to enable comparison.
Figure 2—figure supplement 3
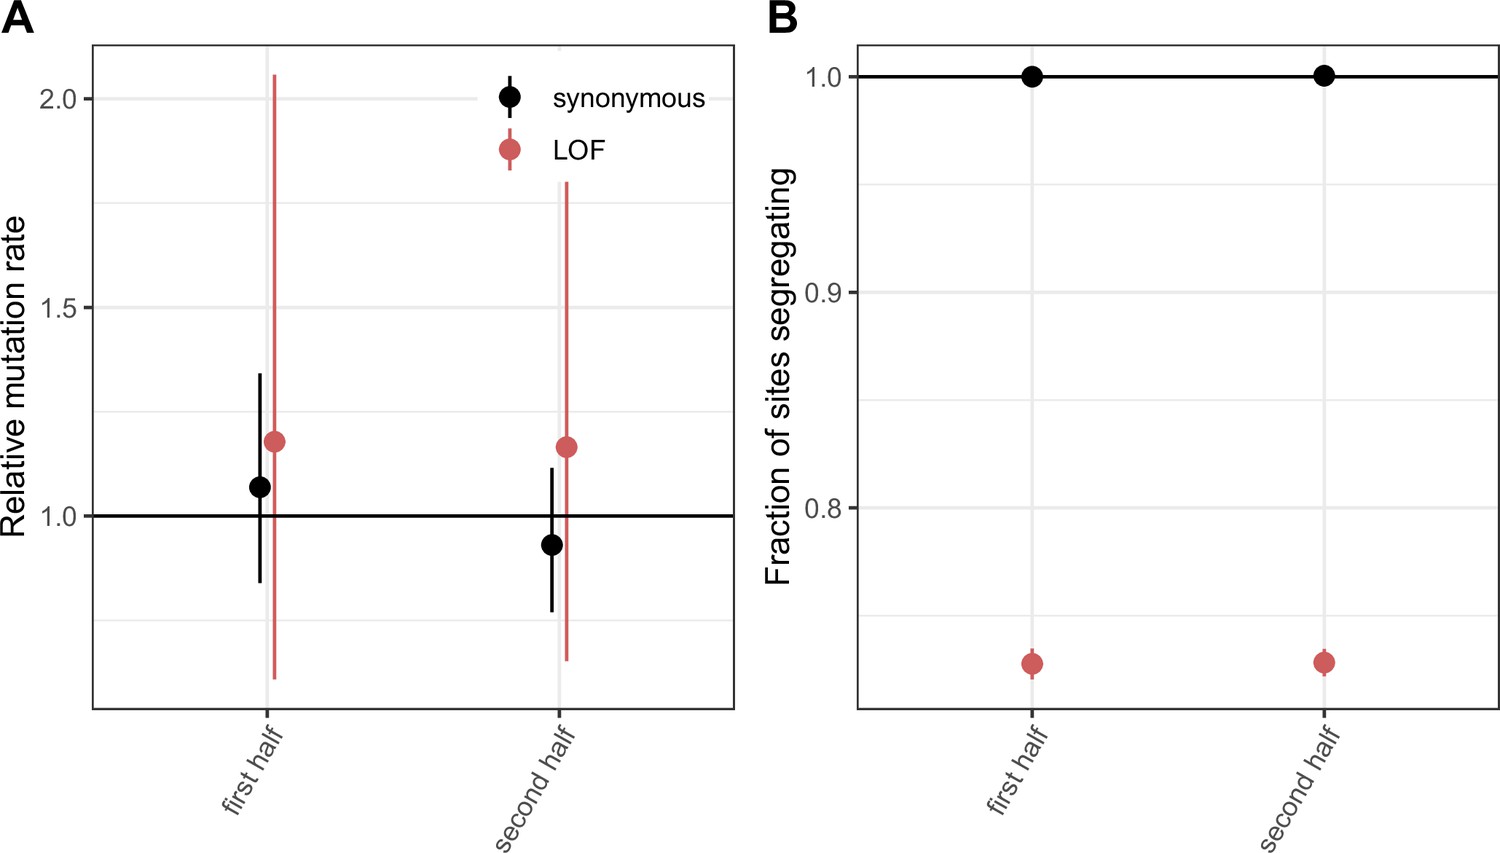
Comparing LOF CpG transitions at methylated sites in exons that constitute the first vs. second halves of canonical protein coding transcripts.
(a) DNM rates for synonymous and LOF CpG transitions at methylated sites in exons that constitute the first vs. second halves of canonical protein coding transcripts, rescaled to the total DNM rate in exons, with 95 % Poisson confidence intervals. (b) Fraction of methylated CpG sites that are segregating as a synonymous or LOF C/T polymorphism in exons that constitute the first vs. second halves of canonical protein coding transcripts, relative to the fraction of all synonymous sites segregating. Error bars are 95 % confidence intervals assuming the number of segregating sites is binomially distributed (see Methods). LOF variants are defined as stop-gained and splice donor/acceptor variants that do not fall near the end of the transcript, and meet the other criteria to be classified as ‘high-confidence’ loss-of-function in gnomAD (Karczewski et al., 2020).
Figure 2—figure supplement 4
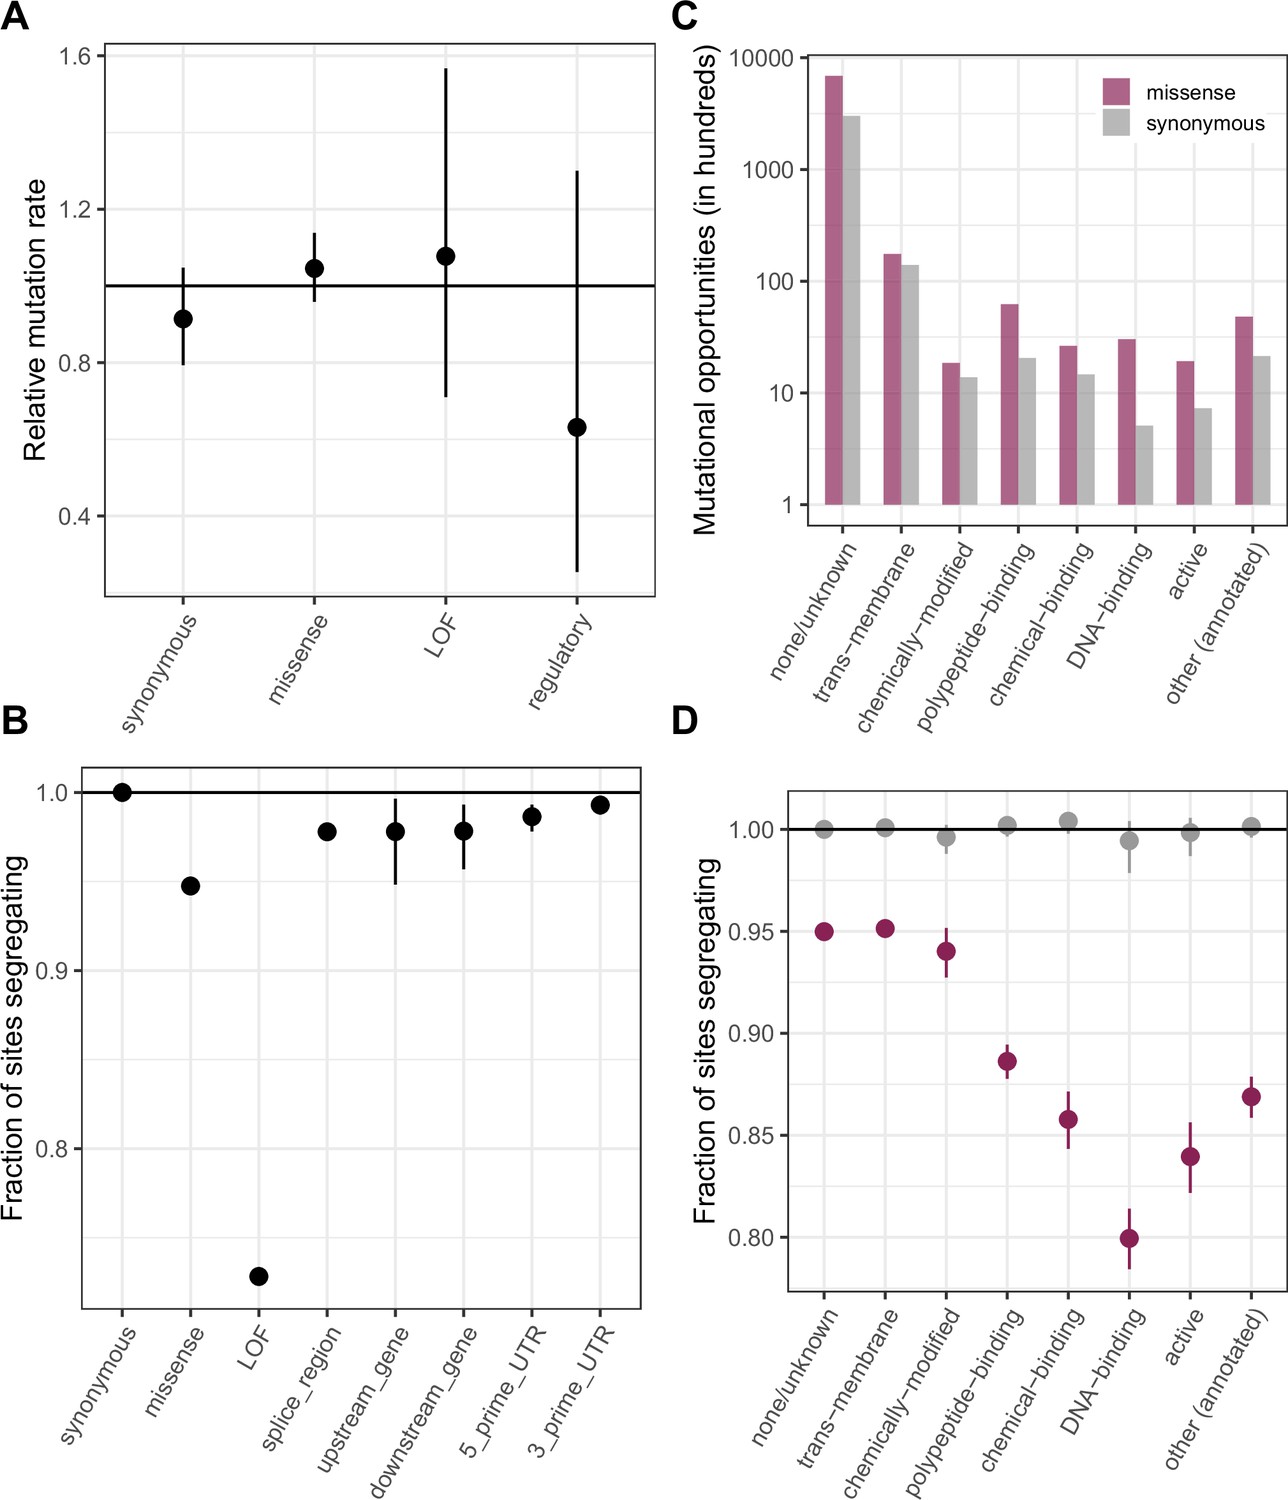
Comparing de novo mutation rates and the fraction of segregating sites across annotations obtained using the worst consequence in protein coding transcripts by predicted severity, instead of canonical transcripts as in Figure 2.
The order of preference by which functional sites are assigned to a single category is detailed in Materials and methods. (a) DNM rates for CpG transitions at methylated sites by annotation class, rescaled by the total DNM rate in exons, with 95 % Poisson confidence intervals (b) Fraction of methylated CpG sites that are segregating as a C/T polymorphism in an annotation class, relative to the fraction of synonymous sites segregating. Error bars are 95 % confidence intervals assuming the number of segregating sites is binomially distributed. LOF variants are defined as stop-gained and splice donor/acceptor variants that do not fall near the end of the transcript, and meet the other criteria to be classified as “high-confidence” loss-of-function in gnomAD. (c) The number of opportunities for synonymous and missense changes involving methylated CpG transitions by the type of functional protein site. (d) The proportion of synonymous and missense segregating C/T polymorphisms in different classes of functional sites.
Figure 2—figure supplement 5
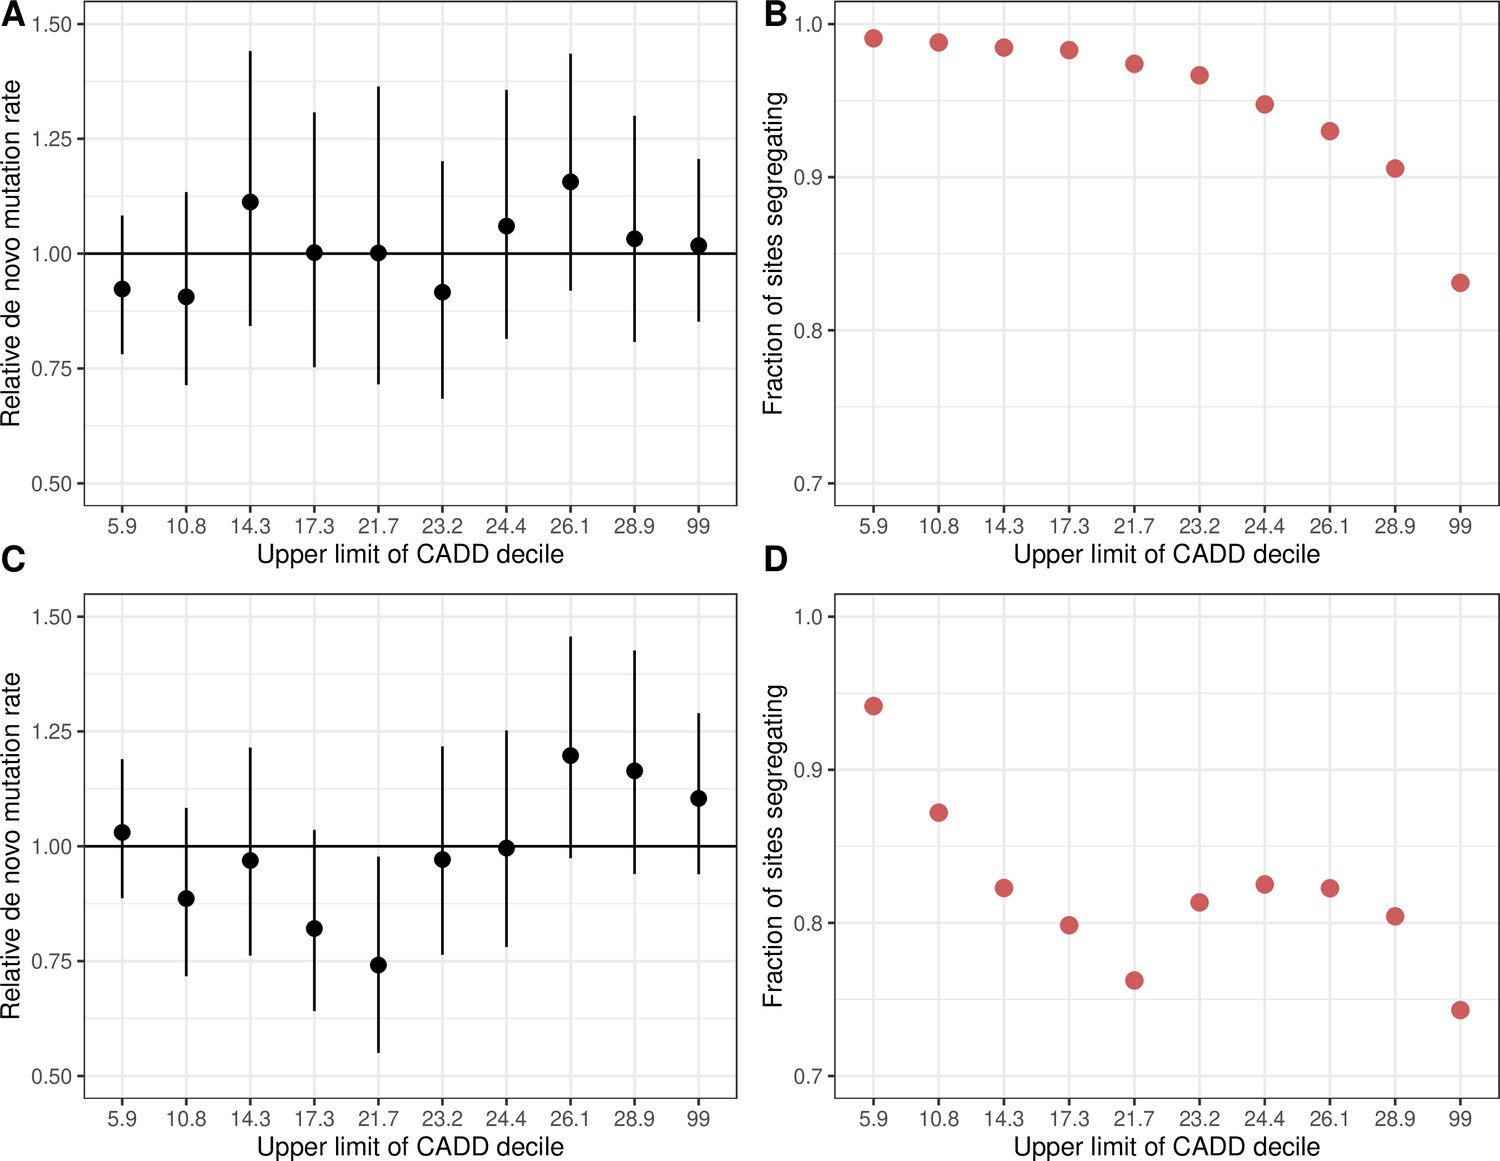
De novo C>T mutation rates at methylated CpG sites and the fraction of sites segregating in CADD score bins.
(a) De novo C > T mutation rate at methylated CpGs in deciles of CADD scores in exons, rescaled by the total rate of methylated CpG transitions in exons. Error bars reflect the 95 % Poisson confidence interval around mutation counts in each group. (b) Fraction of methylated CpG sites that are segregating as a C/T polymorphism in a CADD score decile, relative to the fraction of synonymous sites segregating. (c) The same as (a) but for C > T mutations at all CpG sites, including unmethylated and less methylated CpGs as well as methylated ones. (d) The same as (b) but for C > T mutations at all CpG sites. Higher CADD scores reflect stronger predicted constraint.
Figure 3 with 2 supplements

Comparing the fraction of sites observed and expected to be segregating under neutrality, by mutation type and sample size.
(a) Fraction of possible synonymous C > T mutations at CpG sites methylated in the germline and at all other C sites, and the fraction of possible synonymous T > A mutations that are observed in a sample of given size. (b) Fraction of sites segregating in simulations, assuming neutrality, a specific demographic model and a given mutation rate (see Materials and methods).
Figure 3—figure supplement 1
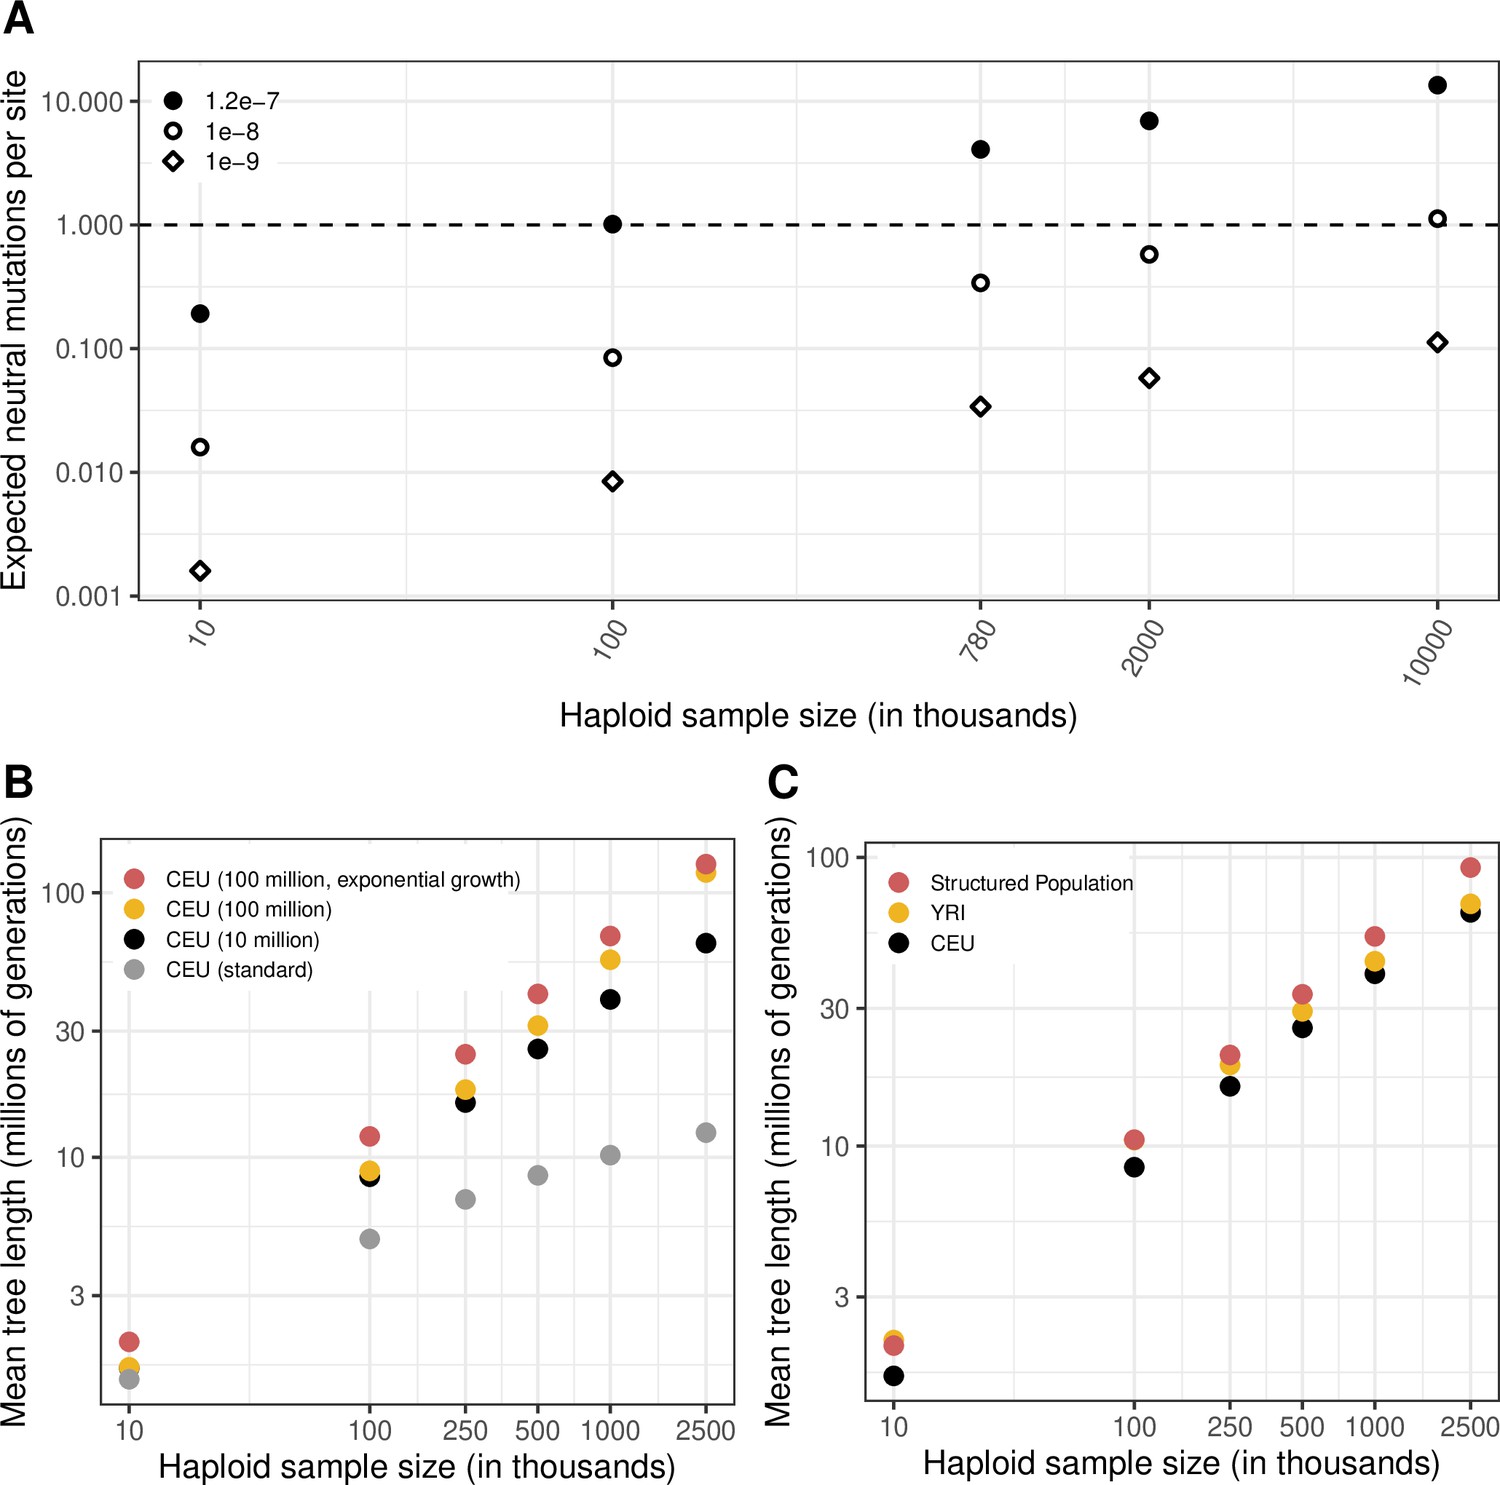
The expected length of the genealogy under different demographic models and for varying sample sizes.
(a) The expected number of neutral mutations at a site, for three mutation rates and varying sample sizes, calculated as the expected length of the genealogy (sum of branch lengths, averaged over 20 simulations) multiplied by the mutation rate, for a CEU population with a recent Ne of 10 million for the last 50 generations (see Materials and Methods). (b) A comparison of mean genealogy lengths for the standard Schiffels-Durbin demographic model for a CEU population and three variations with increased current Ne, namely, CEU demographic history for 50,000 generations with a recent Ne of 10 million or 100 million for the last 50 generations, and CEU demographic history with 4.5 % exponential growth for the past ~200 generations. (c) A comparison of mean genealogy lengths for samples from YRI and CEU populations, and samples from a structured population derived from an ancestral population 2000 generations ago.
Figure 3—figure supplement 2
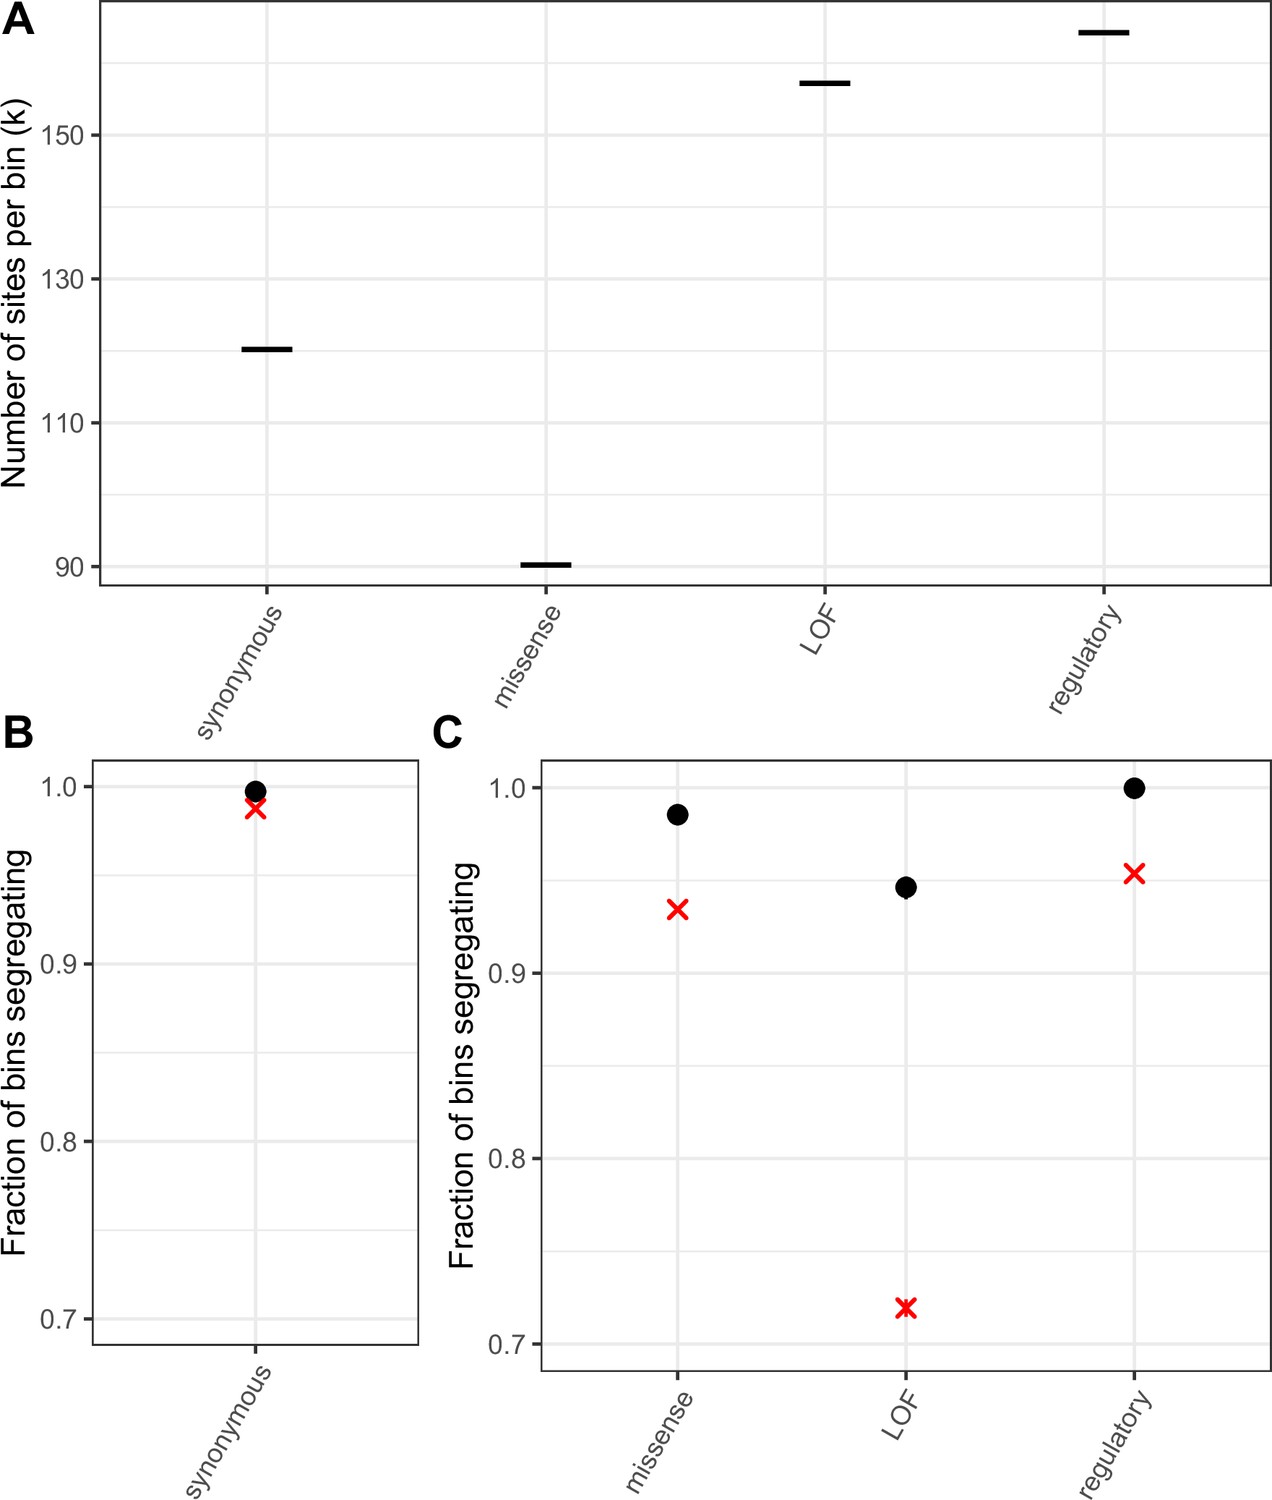
Mutation saturation in bins of sites compared to single mCpG sites.
(a) k, the number of T sites per bin, such that the average T > A mutation rate per bin is the same as the average transition rate at a single methylated CpG site in that annotation (b) Fraction of bins of synonymous T sites that have at least one T/A polymorphism. A cross is indicated for the corresponding fraction at synonymous methylated CpG sites. As expected if synonymous sites are neutral and the mutation rate for a bin matches that of methylated CpGs, the two fractions are very similar. (c) Fraction of bins that have at least one T/A polymorphism, by non-synonymous annotation. A cross is indicated for the corresponding fraction at methylated CpG sites. Error bars are 95 % confidence intervals assuming the number of segregating bins is binomially distributed. For bins including sites under selection the fractions for CpG sites and other mutation types are not expected to match, depending on the extent of variation in mutation rates and fitness effects across sites within a bin (see Materials and methods).
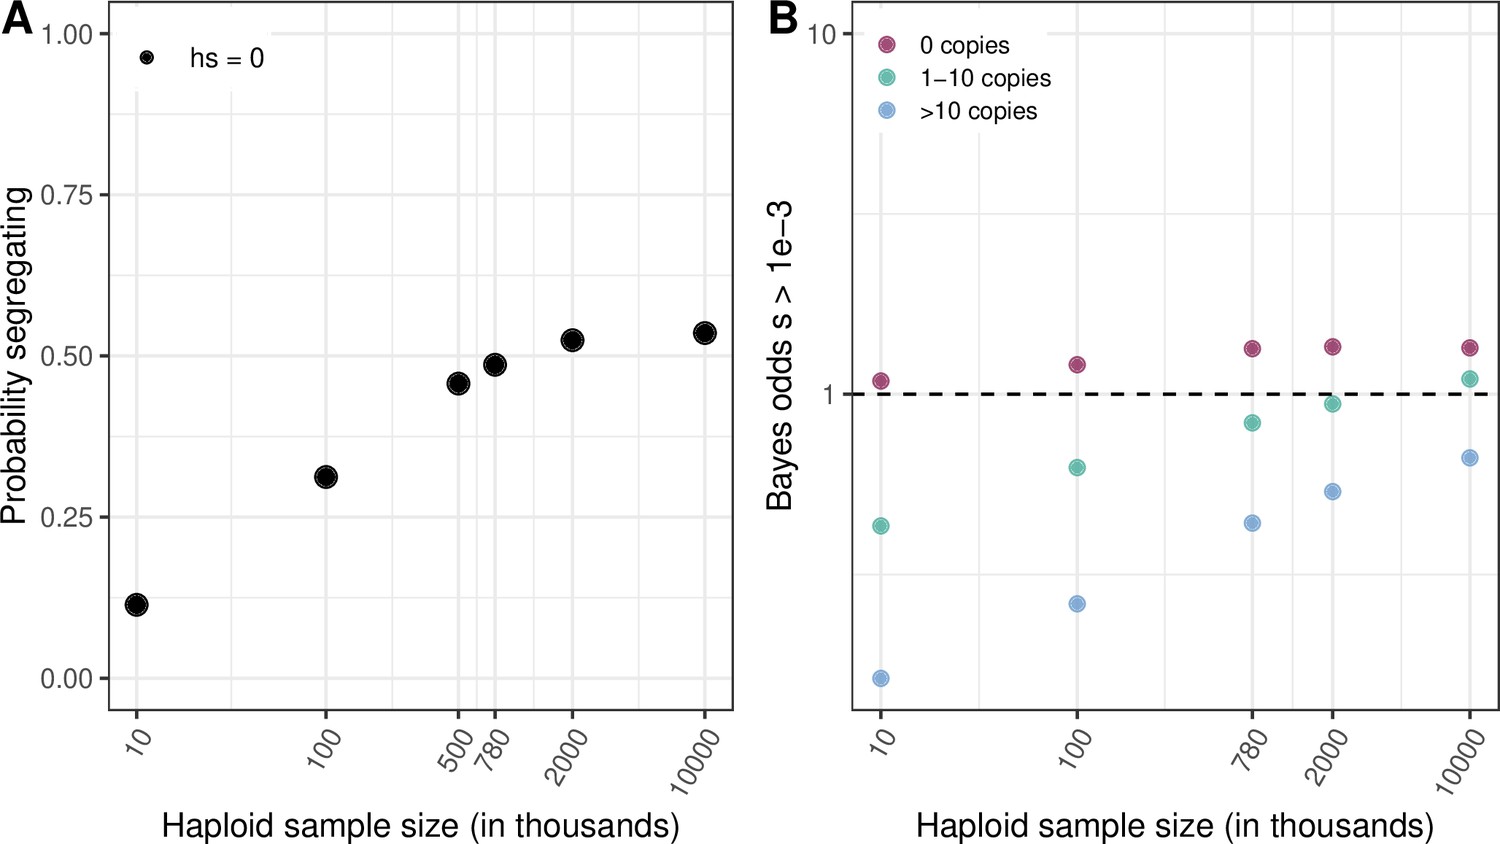
Figure 4 with 5 supplements
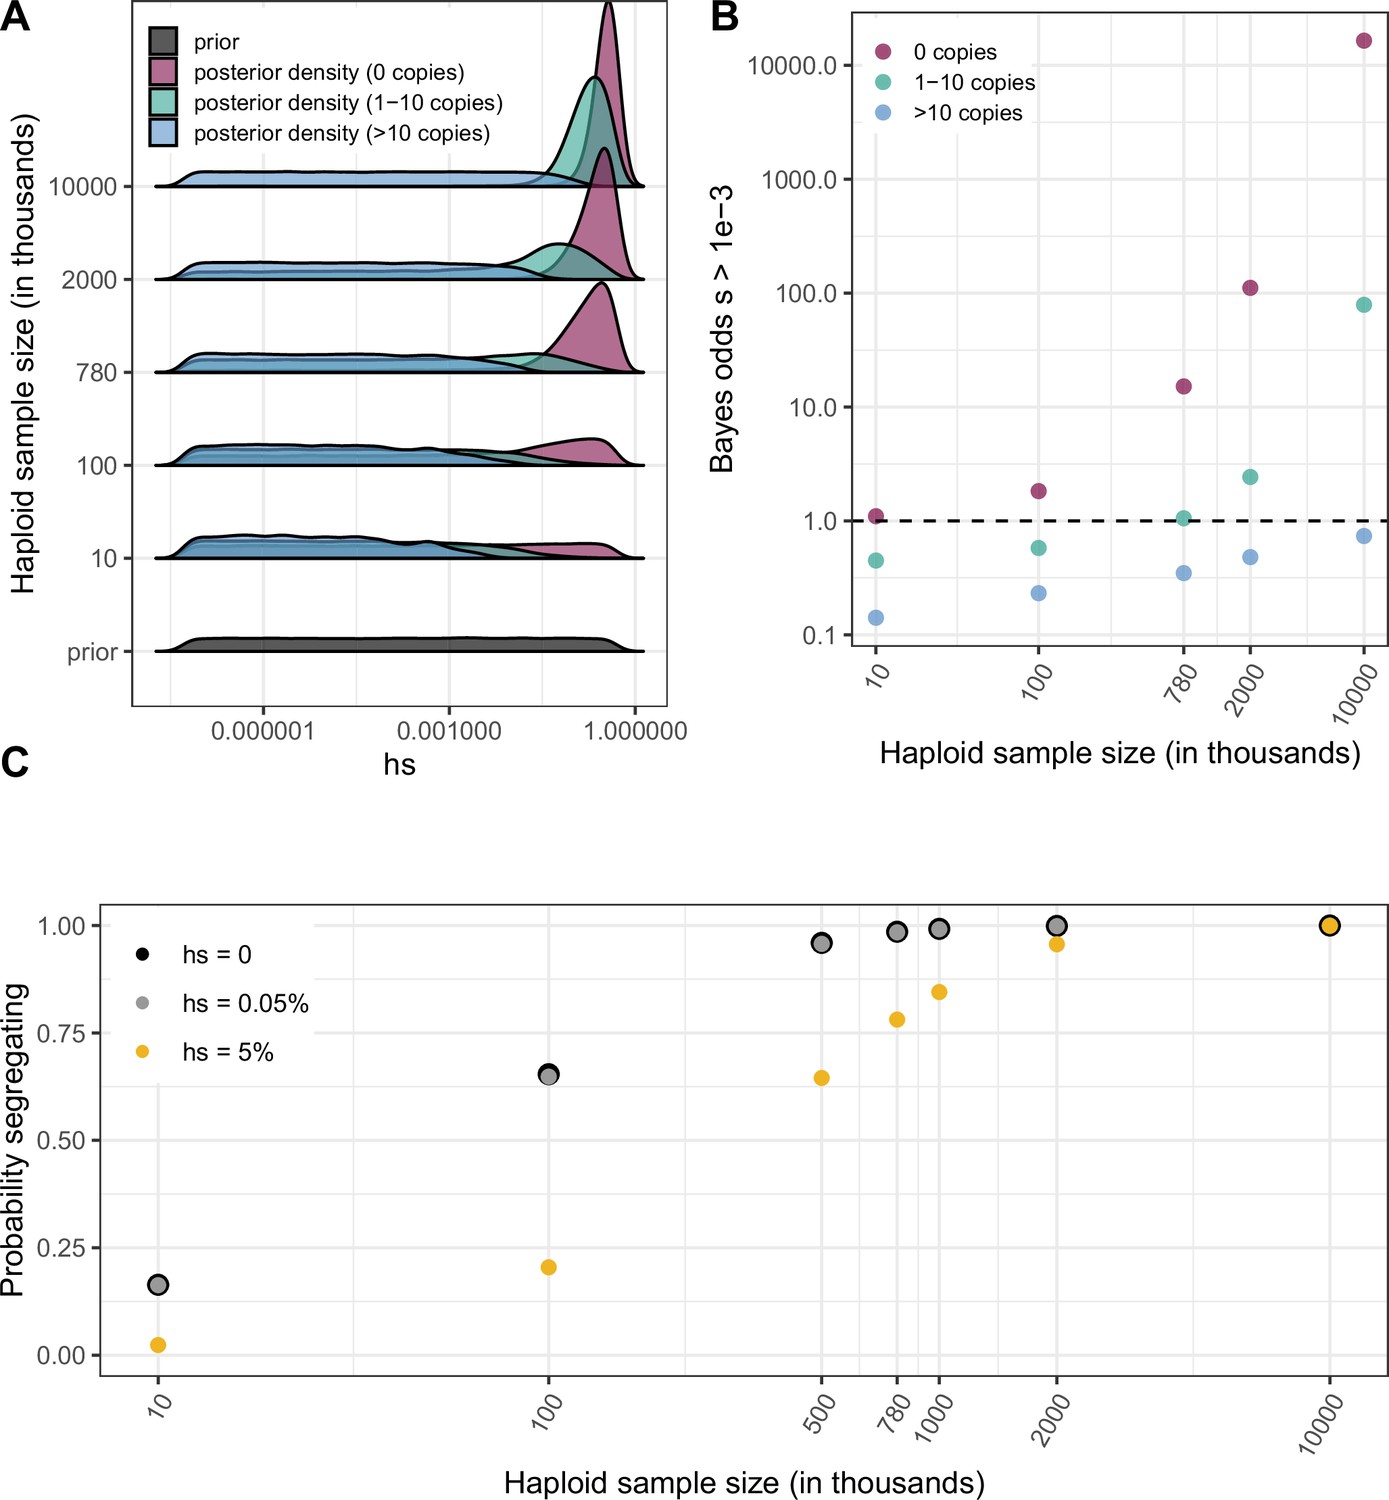
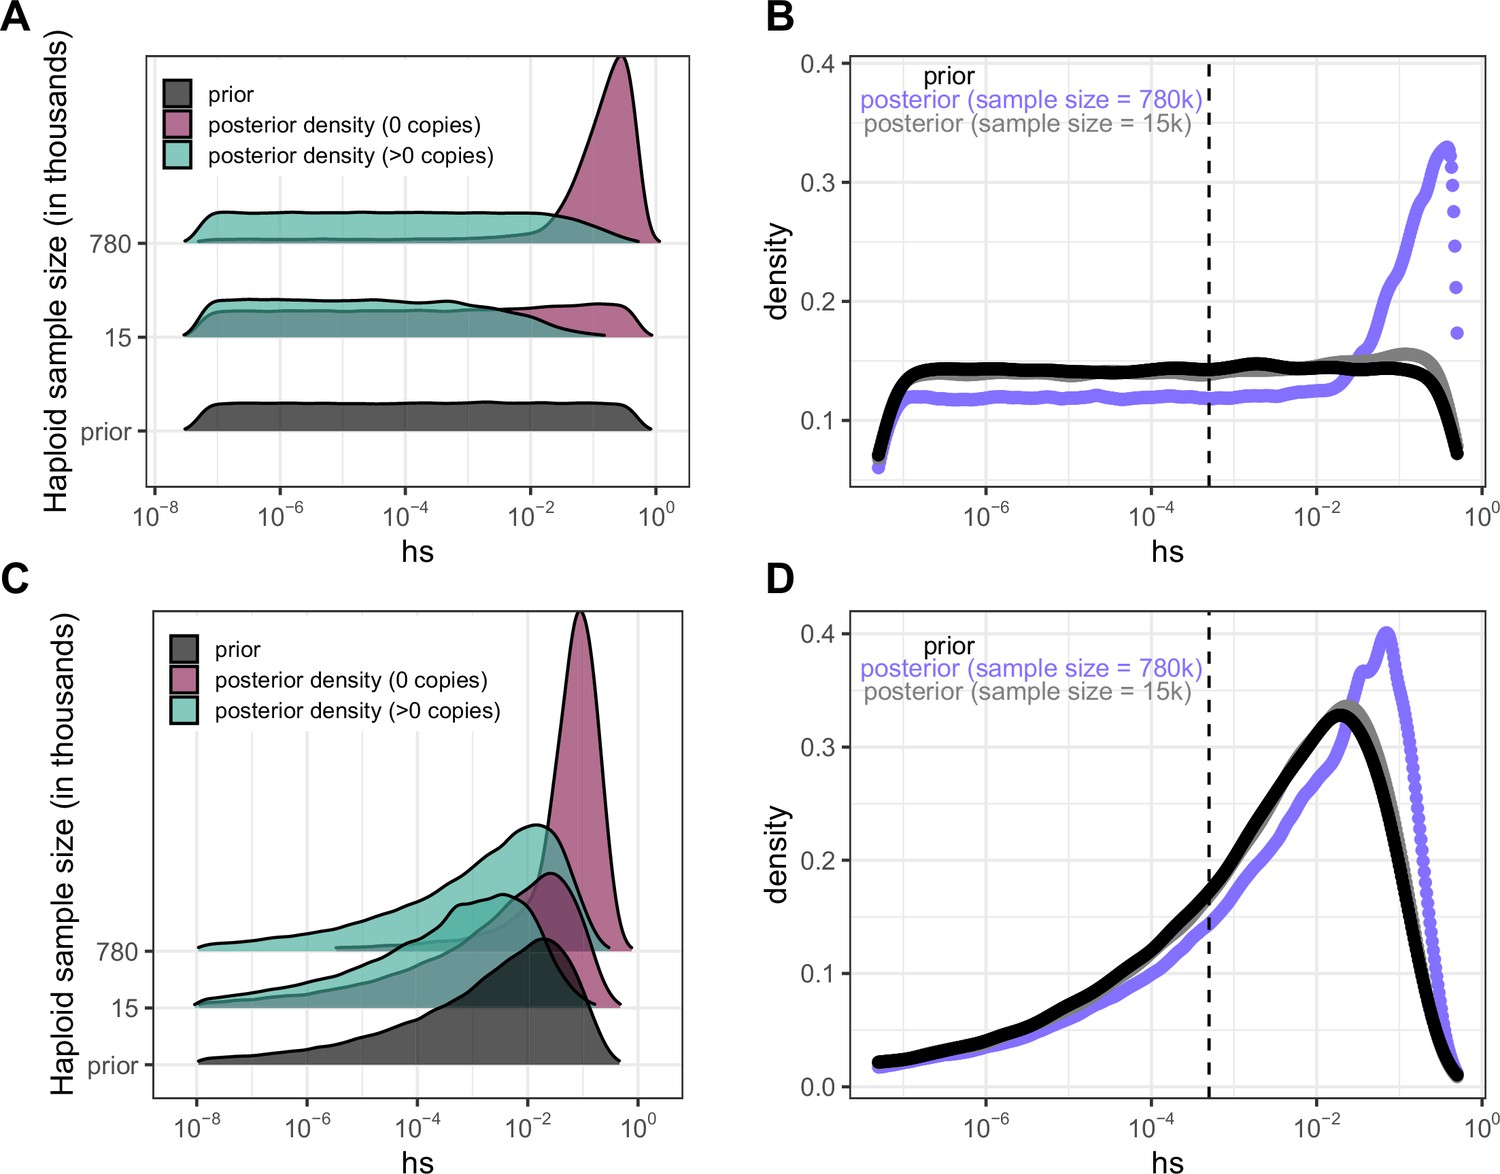
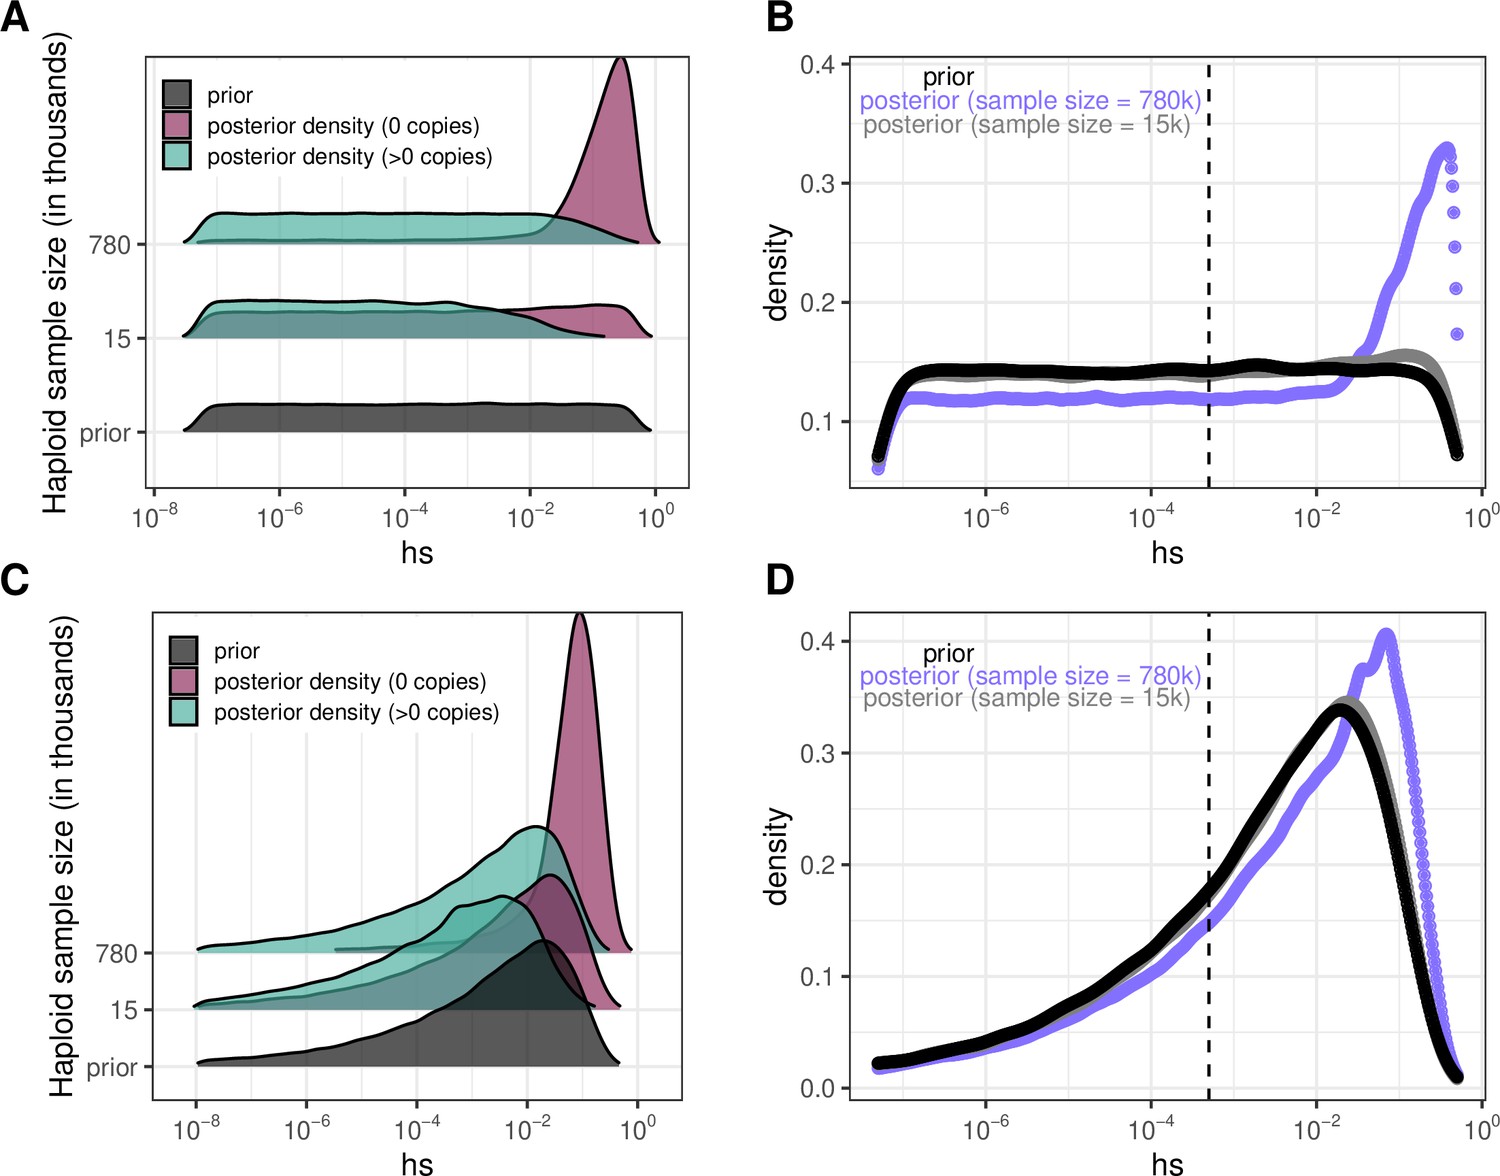
Quantifying the strength of selection associated with invariant and segregating sites.
(a) Prior and Posterior log densities of hs for a C > T mutation at a methylated CpG site observed at 0, 1–10, or >10 copies at various sample sizes. (b) Bayes odds (i.e. posterior odds divided by prior odds) of s > 0.001 for a C > T mutation at a methylated CpG site observed at 0, 1–10, or >10 copies, at various sample sizes. (c) Probability of a methylated CpG site segregating a T allele in simulations, if the mutation has no fitness effects (hs = 0) and if it is deleterious (with a heterozygote selection coefficient hs = 0.05%) or highly deleterious (with a heterozygote selection coefficient hs = 5%).
Figure 4—figure supplement 1
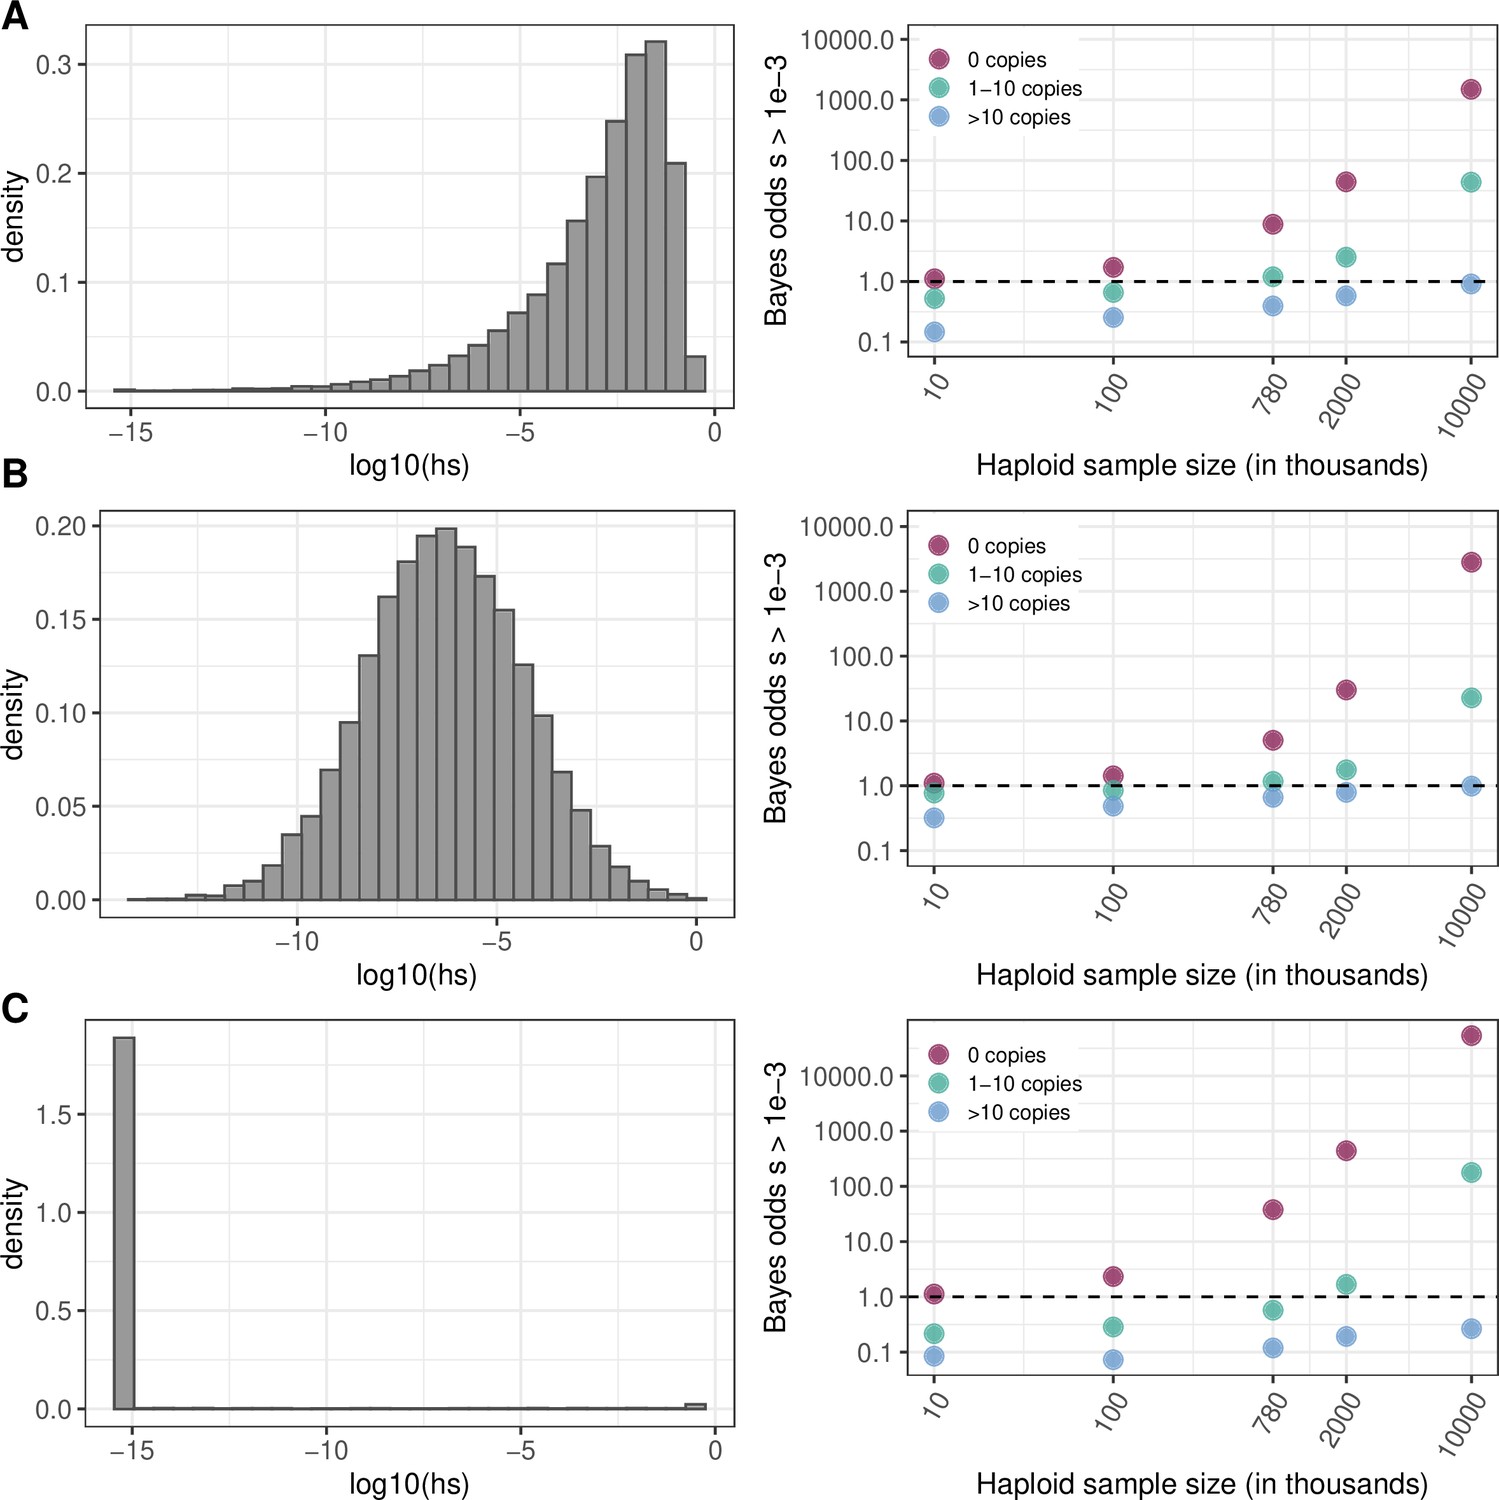
Effect of the choice of prior on Bayes odds of hs > 0.5x10⁻³.
The prior on hs (left column) and Bayes odds that s > 10–3 given that a mutation at a site is observed at 0, 1–10, or >10 copies, for various sample sizes (right column). h is fixed at 0.5 (see Materials and methods). The odds are calculated using 10,000 draws from the prior and posterior distributions. (a) Nes ~ Gamma(shape = 0.23, scale = 425/0.23), with Ne = 10,000, the parameters inferred in Eyre-Walker et al., 2006. (b) log(s)~N(–6,2) (c) s~Beta(alpha = 0.001,beta = 0.1). Values below 10–10 are binned as 10–10.
Figure 4—figure supplement 2

Odds of non-synonymous variants having been classified as pathogenic in ClinVar and DDD if they occur at sites that are either invariant (0 copies) or segregating ( > 0 copies) in a sample of 780 K chromosomes.
The odds for invariant sites are calculated as the ratio of p(pathogenic | 0 copies) / p(benign | 0 copies) and p(pathogenic)/p(benign) (see Methods). In DDD, variants that fall in 380 ‘consensus’ genes (Kaplanis et al., 2020), for which there is strong evidence of being causal for developmental disorders are considered ‘pathogenic’, and variants in all other genes ‘benign’. In ClinVar, variants classified as ‘likely pathogenic’ are assumed to be pathogenic; these are compared to two sets of benign variants, one limited to variants classified in ClinVar as ‘likely benign’, and the other inclusive of variants for which the evidence is uncertain or inconclusive. Note that since both ClinVar classifications and the identification of consensus genes in DDD rely in part on whether a site is segregating in datasets like ExAC, the degree of enrichment is hard to interpret.
Figure 4—figure supplement 3
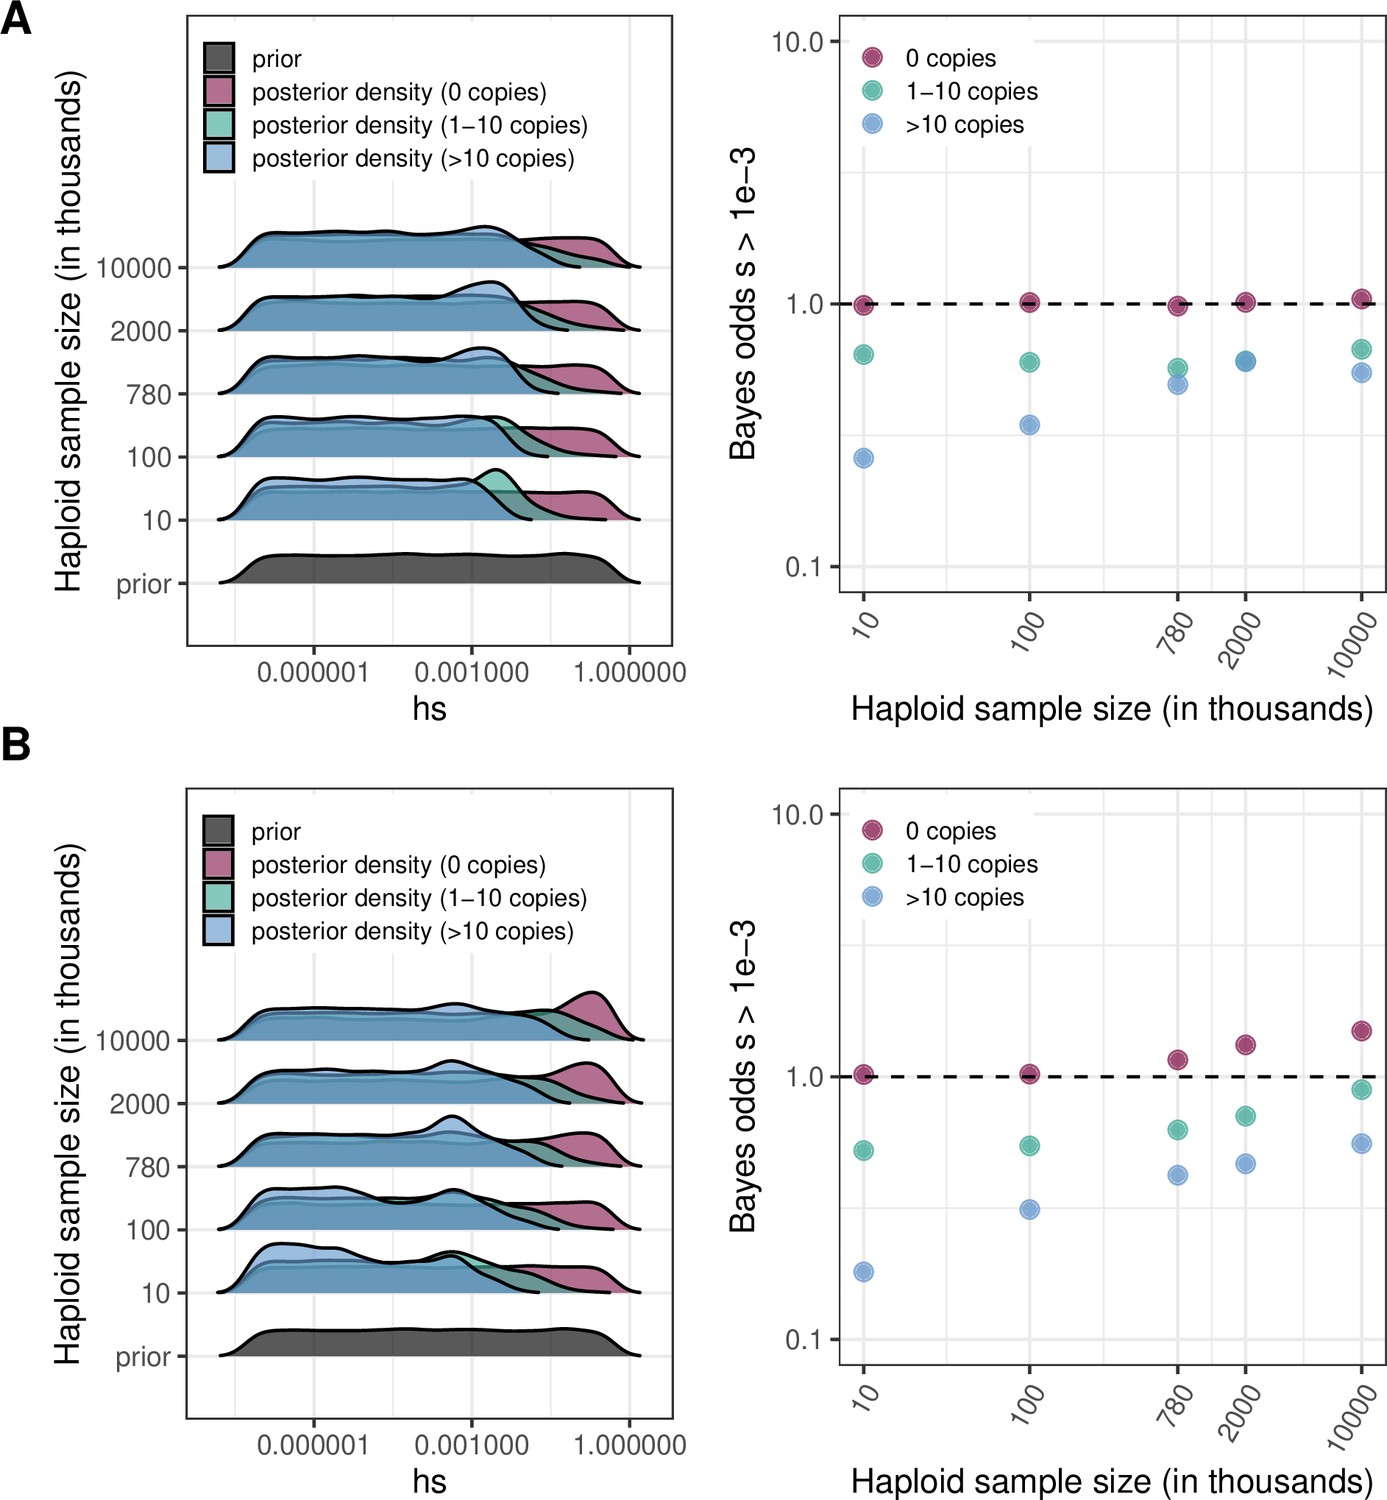
For various sample sizes, prior and posterior log densities for hs, and the Bayes odds of s > 10–3 (and h = 0.5) for a mutation observed at 0, 1–10, or >10 copies.
The prior distribution of s is log-uniform over [10–7,1]. The odds are calculated from 15,000 draws from the prior and posterior distributions. (a) At a site with mutation rate ~10–9 (b) At a site with mutation rate ~10–8.
Figure 4—figure supplement 4
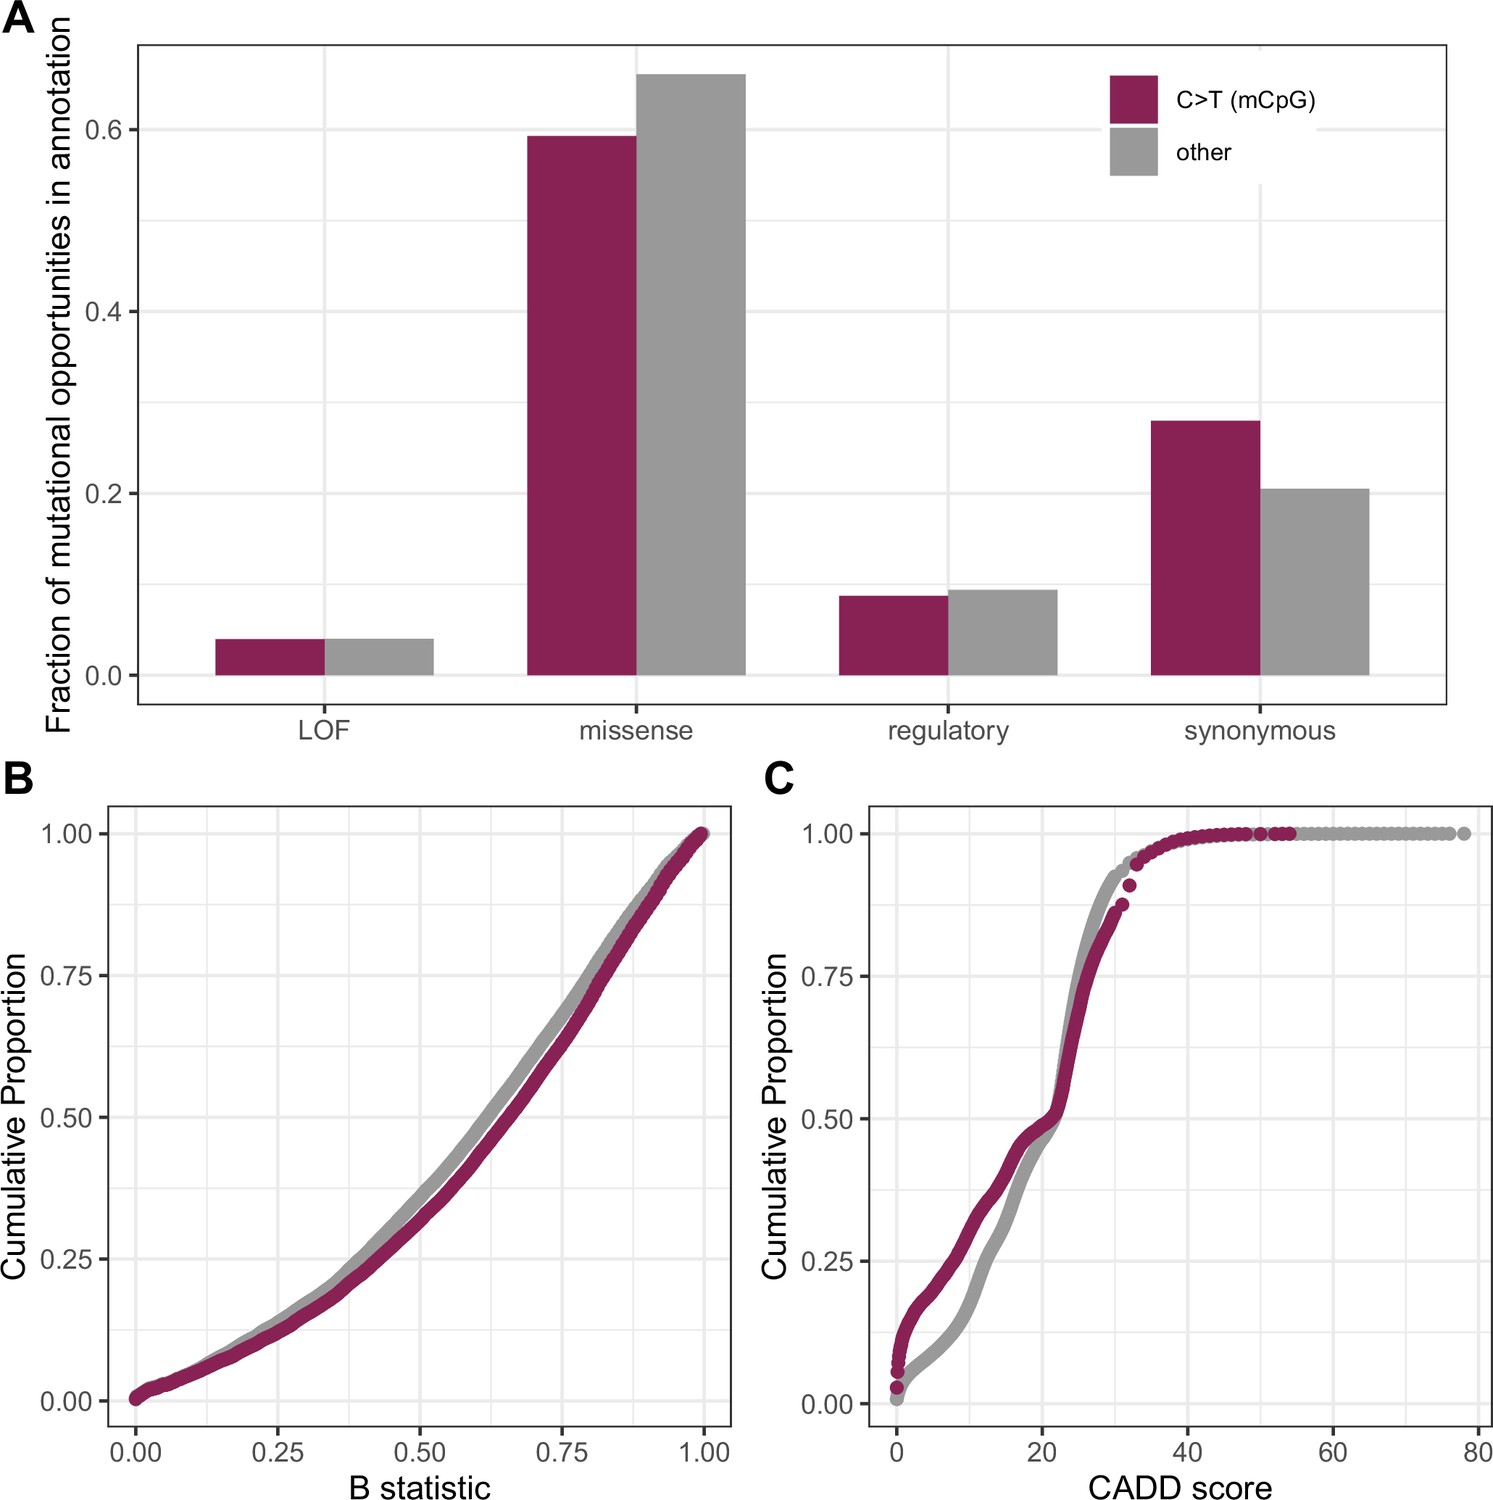
Comparison of measures of deleteriousness at 1.1 million mutational opportunities for methylated CpG (mCpG) transitions vs. 90 million other mutational opportunities in exons.
(a) Fraction of mutational opportunities for methylated-CpG transitions vs. all other mutational opportunities in exons by their putative functional effect. The difference is statistically significant for missense, regulatory, and synonymous categories (Fisher exact test p-value << 10–5) but not for the LOF class (p-value = 0.06). (b) Cumulative distribution of the B-statistic from McVicker et al., 2009 for methylated CpG sites vs. all other types of sites in exons (Kolmogorov-Smirnov test p-value << 10–5). (c) Distribution of CADD scores at mutational opportunities for methylated-CpG transitions vs. all other mutational opportunities in exons (p-value from a Kolmogorov-Smirnov test <<10–5); some skew towards lower values may be expected from the behavior of CADD scores in the presence of mutation rate variation. Despite these significant differences, these statistics are overall pretty similar for methylated CpG sites and other mutation types.
Figure 4—figure supplement 5
Estimating the DFE of LOF mutations using posterior densities of hs for invariant and segregating mCpG sites.
(a) Posterior log densities of hs for a C>T mutation at a methylated CpG site that is observed at 0 or >0 copies, in sample sizes of 15K and 780K, given a log-uniform prior on s and h=0.5 (see Methods). (b) The DFEs estimated by weighting the posterior densities in (a) by the fraction of LOF mCpG sites that are segregating (73% at 780K; 9% at 15K) and invariant (27% and 91% respectively). (c) Posterior log densities of hs for a C>T mutation at a methylated CpG site that is observed at 0 or >0 copies, in sample sizes of 15k and 780k, given a gamma prior with parameters inferred in Eyre-Walker et al., 2006 (see Methods). (d) The DFEs estimated by weighting the posterior densities in (c) by the fraction of LOF mCpG sites that are segregating (73% at 780K; 9% at 15K) and invariant (27% and 91% respectively). For the sample size of 15K, the posterior distribution recapitulates the prior, because there is little information about selection in whether a site is observed to be segregating or invariant, and particularly about strong selection. In the sample of 780K, there is more information about selection in a site being invariant and therefore, there is a shift towards stronger selection coefficients regardless of the prior.
Author response image 1
Author response image 2
Author response image 3
Tables
Appendix 1—table 1
List of data sources.
Additional files
Download links
A two-part list of links to download the article, or parts of the article, in various formats.
Downloads (link to download the article as PDF)
Open citations (links to open the citations from this article in various online reference manager services)
Cite this article (links to download the citations from this article in formats compatible with various reference manager tools)
Mutation saturation for fitness effects at human CpG sites
eLife 10:e71513.
https://doi.org/10.7554/eLife.71513


