Oct4 differentially regulates chromatin opening and enhancer transcription in pluripotent stem cells
- Max Planck Institute for Multidisciplinary Sciences, Department of Molecular Biology, Germany
- Max Planck Institute for Molecular Biomedicine, Department of Cell and Developmental Biology, Germany
Figures
Figure 1 with 1 supplement
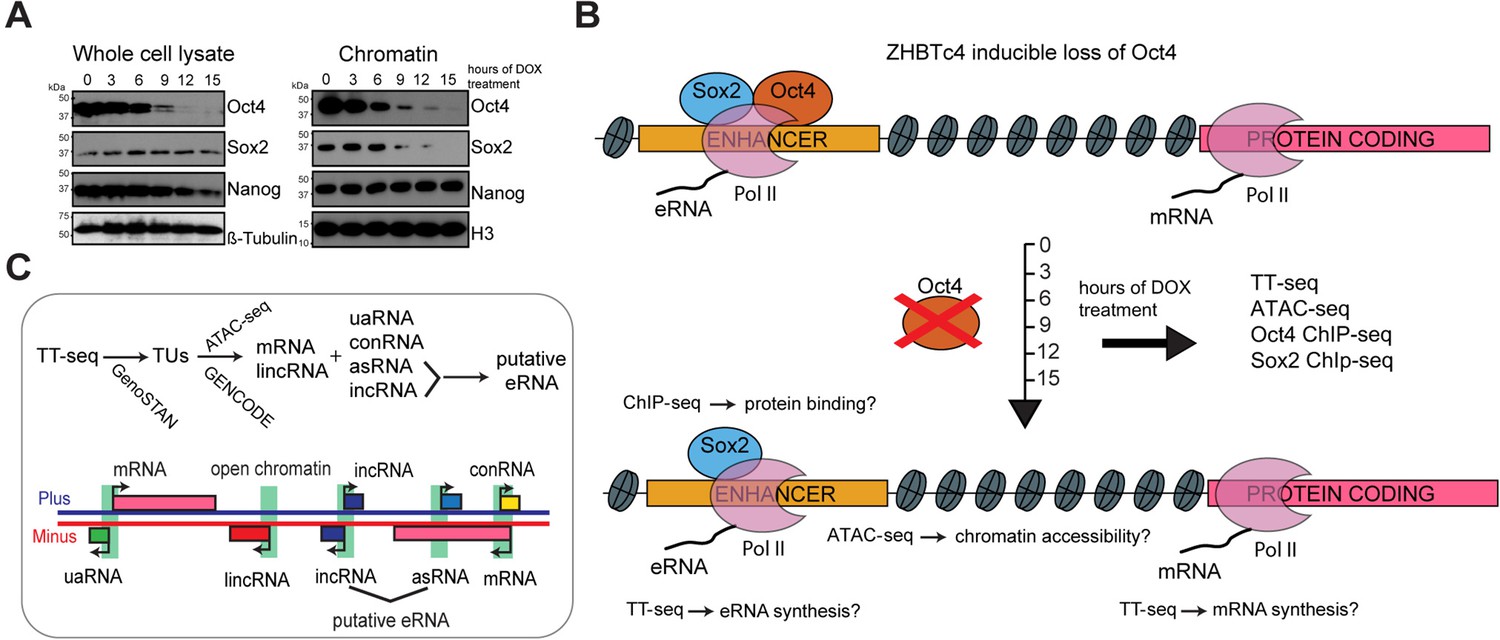
Oct4 depletion in ZHBTc4 mouse embryonic stem cells (ESCs).
(A) Western blot analysis of whole cell lysate and chromatin samples over the time course of doxycycline (DOX) treatment using Oct4, Sox2, Nanog, β-Tubulin (control), and H3 (control) antibodies. In the chromatin fraction Oct4 levels gradually decreased to 87.5% (3 hr), 50.5% (6 hr), 17.0% (9 hr), 7.0% (12 hr), and 2.5% (15 hr), whereas Sox2 levels slightly increased to 126.8% (3 hr) and 112.5% (6 hr), and then decreased to 32.4% (9 hr), 16.4% (12 hr), and 1.7% (15 hr) compared to 0 hr. (B) Schematic of methodology and samples collected. TT-seq, ATAC-seq, Oct4, and Sox2 ChIP-seq experiments were performed after 0, 3, 6, 9, 12, and 15 hr of DOX treatment in ZHBTc4 mouse ESCs. (C) Transcription unit (TU) annotation. Genome segmentation with GenoSTAN was used to annotate TUs from TT-seq data. ATAC-seq data and mouse GENCODE annotation were then used to classify TUs.
-
Figure 1—source data 1
Source data for Figure 1A.
The original files of the raw unedited western blots of the whole cell lysate and their quantification.
- https://cdn.elifesciences.org/articles/71533/elife-71533-fig1-data1-v1.zip
-
Figure 1—source data 2
Source data for Figure 1A.
The original files of the raw unedited western blots of the chromatin samples and their quantification.
- https://cdn.elifesciences.org/articles/71533/elife-71533-fig1-data2-v1.zip
Figure 1—figure supplement 1
Transcription unit annotation in ZHBTc4 mouse ES cell line, related to Figure 1.
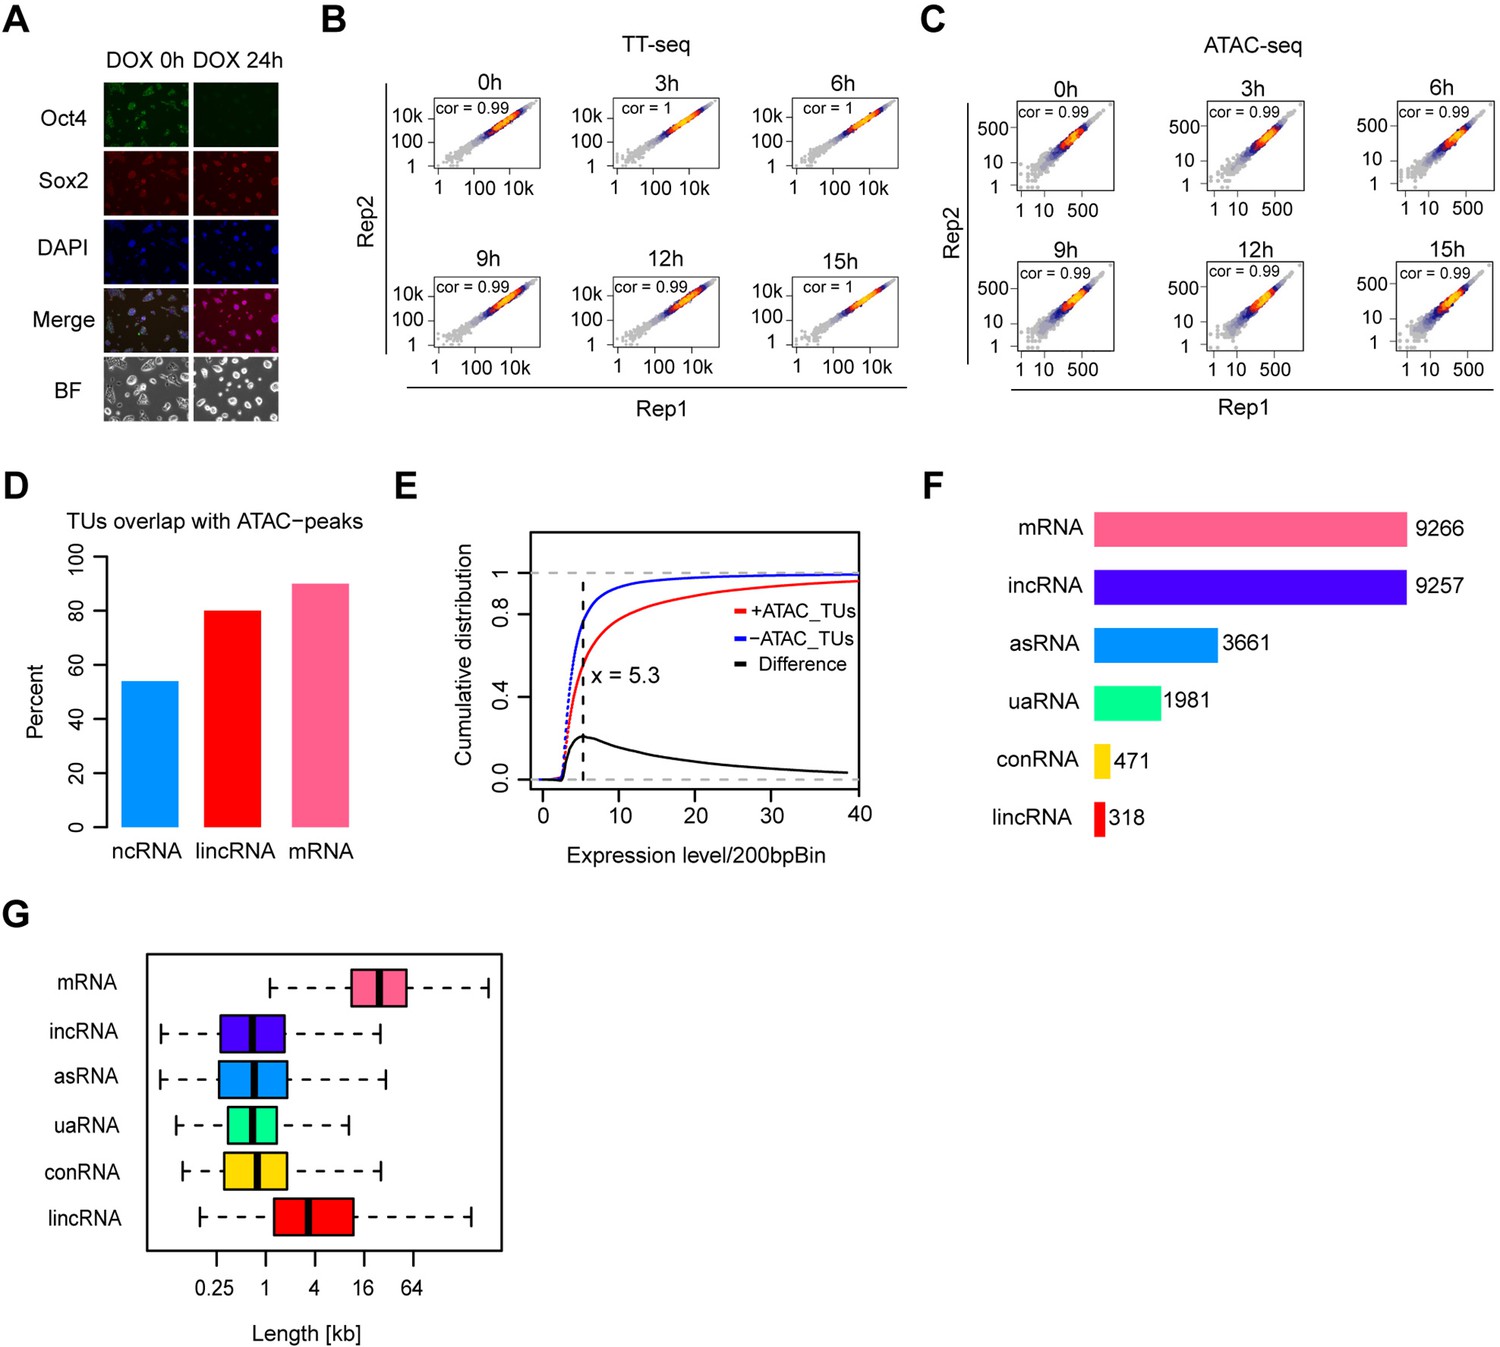
(A) Immunofluorescence of ZHBTc4 cells after 0 and 24 hr of 1 μg/ml doxycycline (DOX) treatment. Green: Oct4, red: Sox2, blue: DAPI, BF: Brightfield. (B) Scatter plots showing correlation between two biological replicates of TT-seq data at each time point. Normalized TT-seq counts of annotated mRNA (n = 9266) were plotted. Spearman’s rank correlation coefficient was calculated and shown in each plot. (C) Scatter plots showing correlation between two biological replicates of ATAC-seq data at each time point. Normalized ATAC-seq counts for Oct4-bound transcribed enhancers (n = 2223) were plotted. Spearman’s rank correlation coefficient was calculated and shown in each plot. (D) Bar graph illustrating percentage of overlap of GenoSTAN annotated ncRNAs, lincRNAs, and mRNAs with chromatin open regions defined by ATAC-seq peaks. (E) Cumulative distribution of expression level of TUs with (red) or without (blue) ATAC-seq peaks overlapping. Black line indicates the difference between distribution of expression level for TUs with or without ATAC-seq peaks overlapping. Dash black line indicates the maximum point for the difference. (F) Numbers of different types of annotated TUs. In order to create a unified annotation independent of a specific time point, all TT-seq samples were combined. (G) Length distribution of different types of annotated TUs.
Figure 2 with 1 supplement
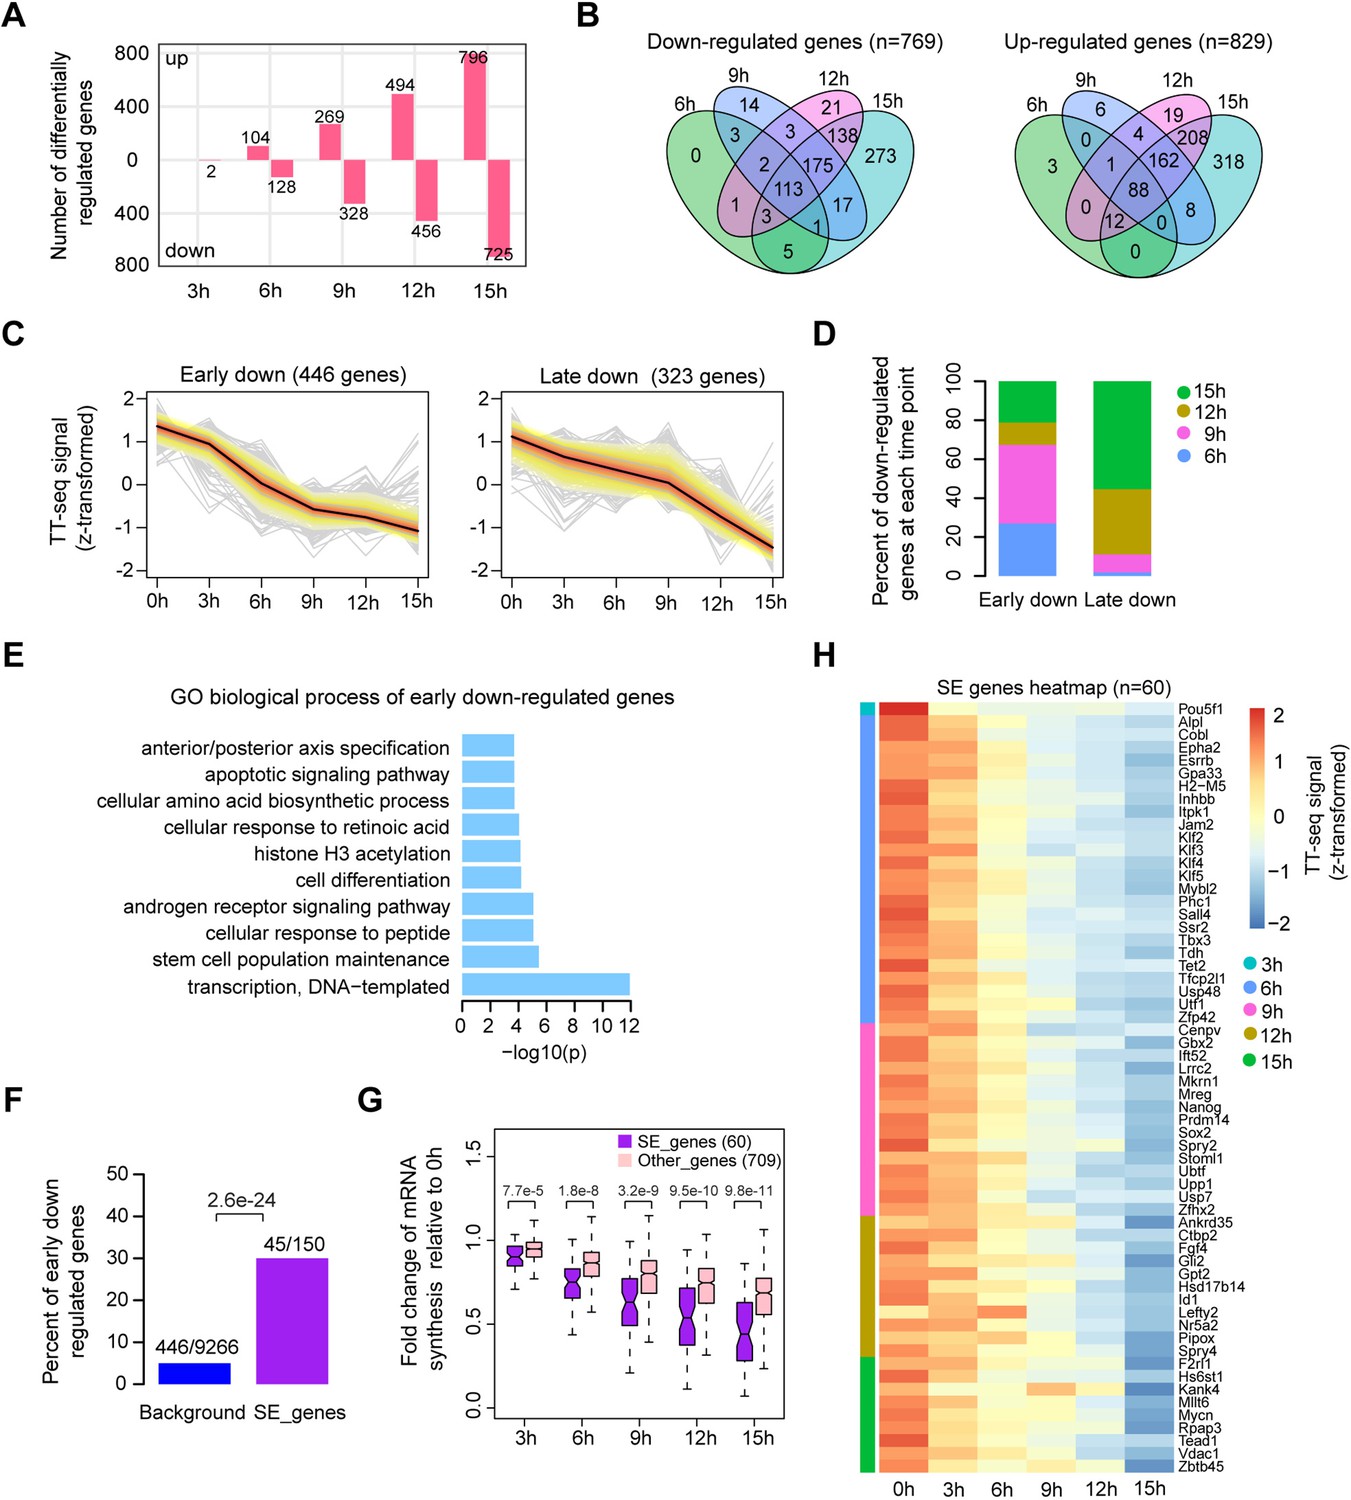
Oct4 maintains the transcriptional network governing pluripotency.
(A) The number of differentially expressed mRNAs detected by DESeq2 after each time point of doxycycline (DOX) treatment. (B) Venn diagram showing the overlap for differentially expressed mRNAs detected by DESeq2 at each time point of DOX treatment. (C) k-Means clustering of 769 downregulated mRNAs into early (left) and late (right) downregulated groups. y-Axis indicates z-score transformed TT-seq counts. (D) Differentially regulated time point composition for early (left) and late (right) downregulated gene groups. y-Axis indicates percentage. (E) Gene ontology (GO) biological process enrichment of early downregulated mRNAs. (F) Bar graph depicting the percentage of early downregulated mRNAs in all annotated mRNAs (blue, as background) and SE-controlled mRNAs (purple). Superenhancer (SE) annotation was obtained from Whyte et al., 2013. p value was calculated by Fisher’s exact test. (G) Boxplot indicating the changes in mRNA synthesis for putative SE-controlled downregulated genes (n = 60, purple) versus other downregulated genes (n = 709, pink). y-Axis indicates fold change of mRNA synthesis relative to 0 hr. p values were calculated by Wilcoxon rank sum test. Black bars represent the median values for each group. Lower and upper boxes are the first and third quartiles, respectively. The ends of the whiskers extend the box by 1.5 times the interquartile range. Outliers are not drawn. (H) Heatmap indicating the kinetics of SE-controlled downregulated genes (n = 60). Genes were ordered by the corresponding time of significant downregulation. Note that data from two biological replicates were generated for TT-seq and that the two replicates were merged for illustration.
-
Figure 2—source data 1
Source data for Figure 2.
Normalized HTSeq-count table for all annotated mRNA.
- https://cdn.elifesciences.org/articles/71533/elife-71533-fig2-data1-v1.xls
Figure 2—figure supplement 1
Differential gene expression analysis and clustering, related to Figure 2.
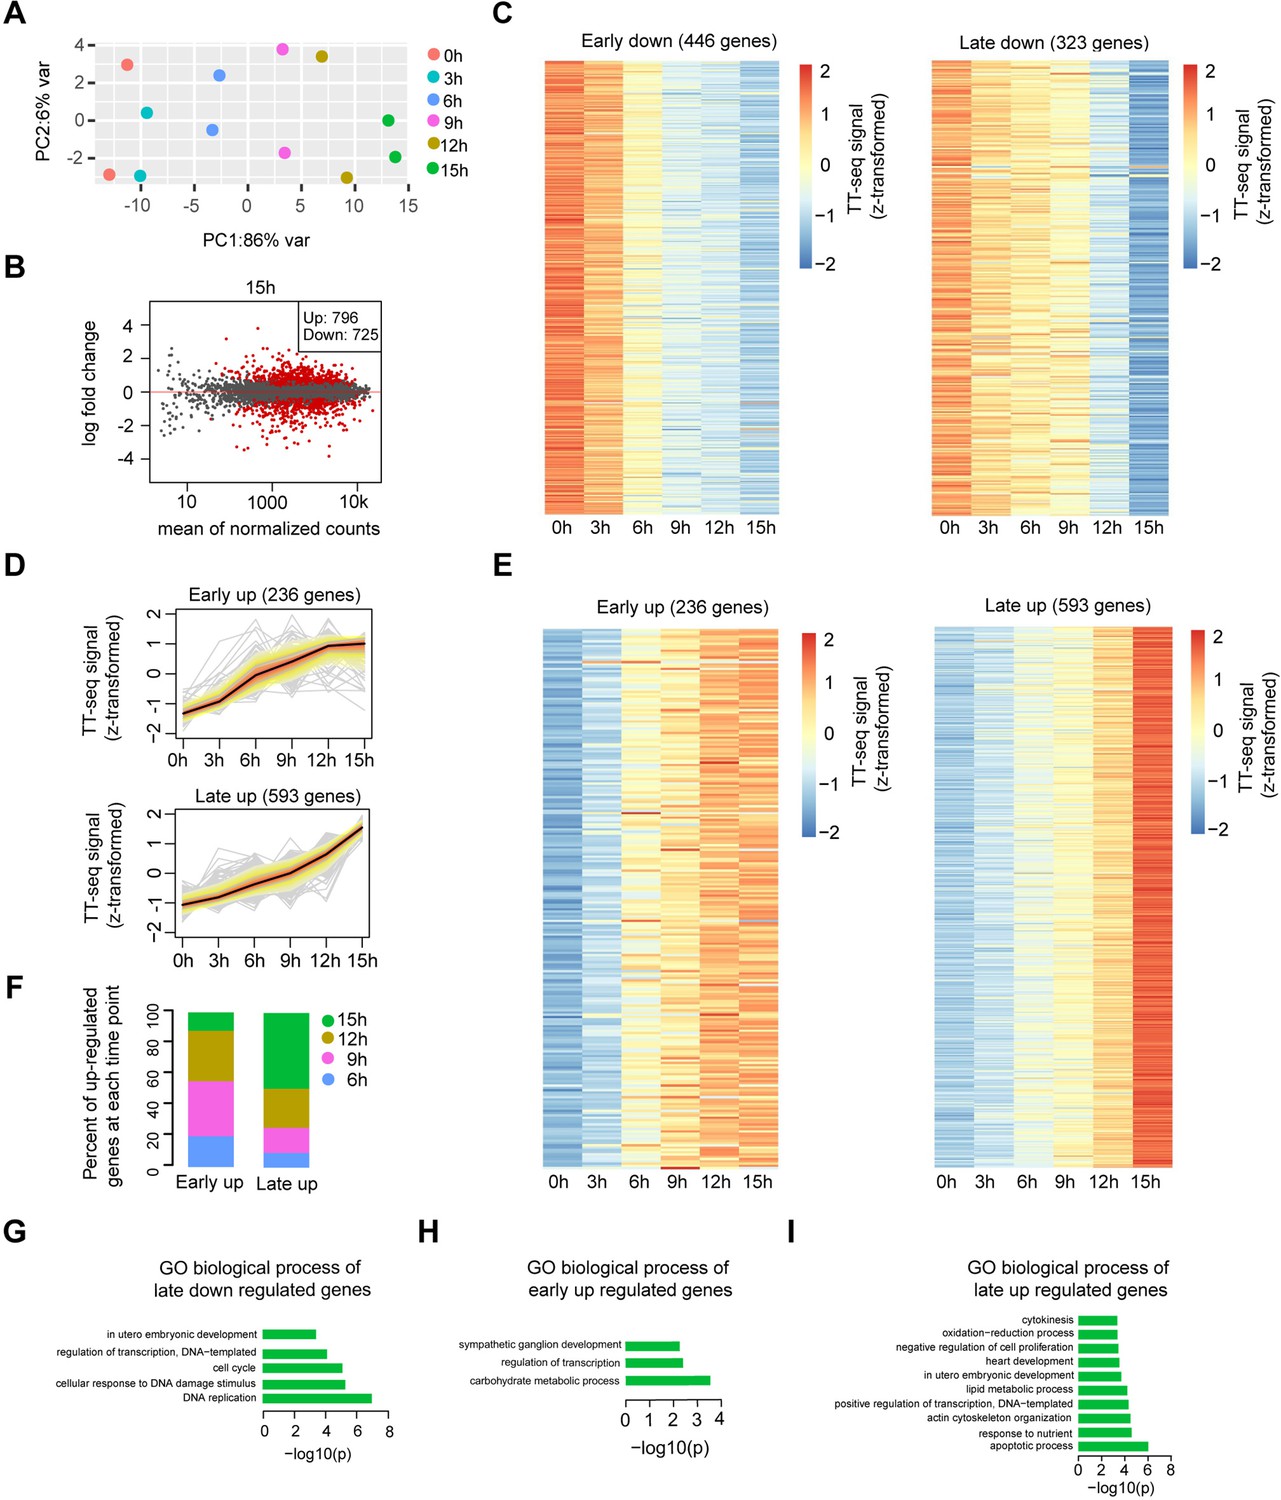
(A) Principle component analysis of TT-seq annotated mRNA (n = 9226) over time course of doxycycline (DOX) treatment (0, 3, 6, 9, 12, and 15 hr) for two biological replicates. (B) MA plot showing differentially regulated mRNAs detected by DESeq2 after 15 hr of DOX treatment. Statistically significantly regulated mRNAs are depicted in red. (C) Heatmap indicating the kinetics of early and late downregulated genes. (D) k-Means clustering of upregulated genes divided into early (top) and late (bottom) upregulated gene groups. y-Axis indicates z-score transformed TT-seq counts. (E) Heatmap indicating the kinetics of early and late upregulated genes. (F) Differentially regulated time point composition for early (left) and late (right) upregulated gene groups. y-Axis indicates percentage. Gene ontology (GO) biological process enrichment for late downregulated genes (G), early upregulated genes (H), and late upregulated genes (I).
Figure 3 with 1 supplement
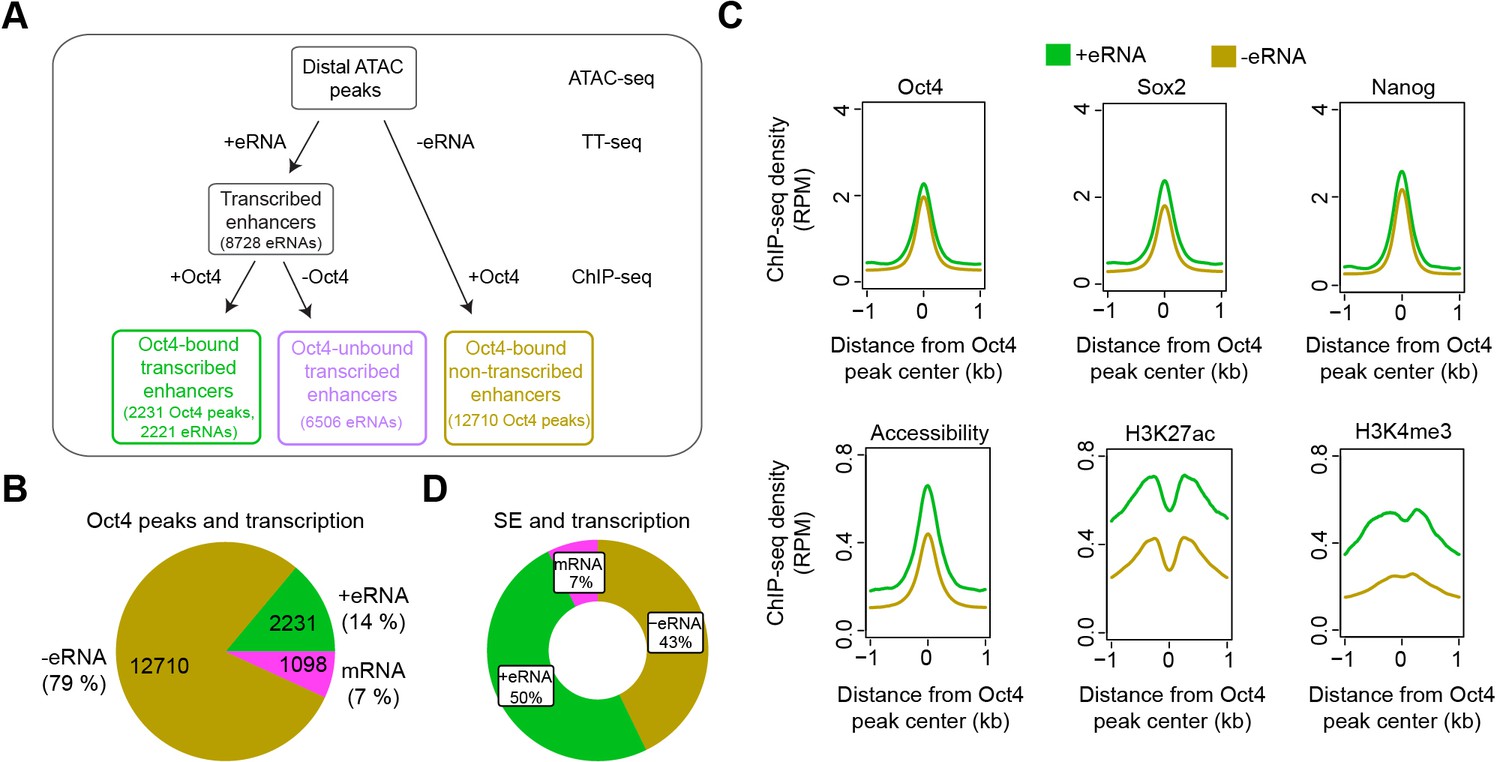
Annotation of putative Oct4-bound/regulated enhancer classes in mouse embryonic stem cells (mESCs).
(A) Diagram illustrating classification of Oct4-binding sites by combing ATAC-seq, TT-seq annotated eRNAs, and Oct4 ChIP-seq peaks. Oct4 ChIP-seq data at 0 hr doxycycline (DOX) treatment were obtained from King and Klose, 2017. (B) Pie chart indicating the overlap of Oct4-binding sites with regions of active transcription (eRNA or mRNA) or no transcription annotated by TT-seq. (C) Metagene plot showing the occupancy for transcription factors Oct4, Sox2, Nanog, chromatin accessibility, and H3K27ac and H3K4me3 histone modifications at Oct4-bound transcribed enhancers (n = 2231) and Oct4-bound nontranscribed enhancers (n = 12,710). y-Axis depicts ChIP-seq coverage density in reads per million (RPM). ChIP-seq data of Oct4, Sox2, and Nanog were obtained from King and Klose, 2017, H3K27ac and H3K4me3 histone modifications data were obtained from Chronis et al., 2017. (D) Pie chart depicting the overlap of Oct4-bound sites (n = 514) at superenhancer (SE) that show eRNA transcription (n = 256, 50%), mRNA transcription (n = 38, 7%), or no transcription (n = 220, 43%) by TT-seq.
Figure 3—figure supplement 1
Annotation of eRNA and characterization of Oct4-bound transcribed enhancers in mouse embryonic stem cell (mESC), related to Figure 3.
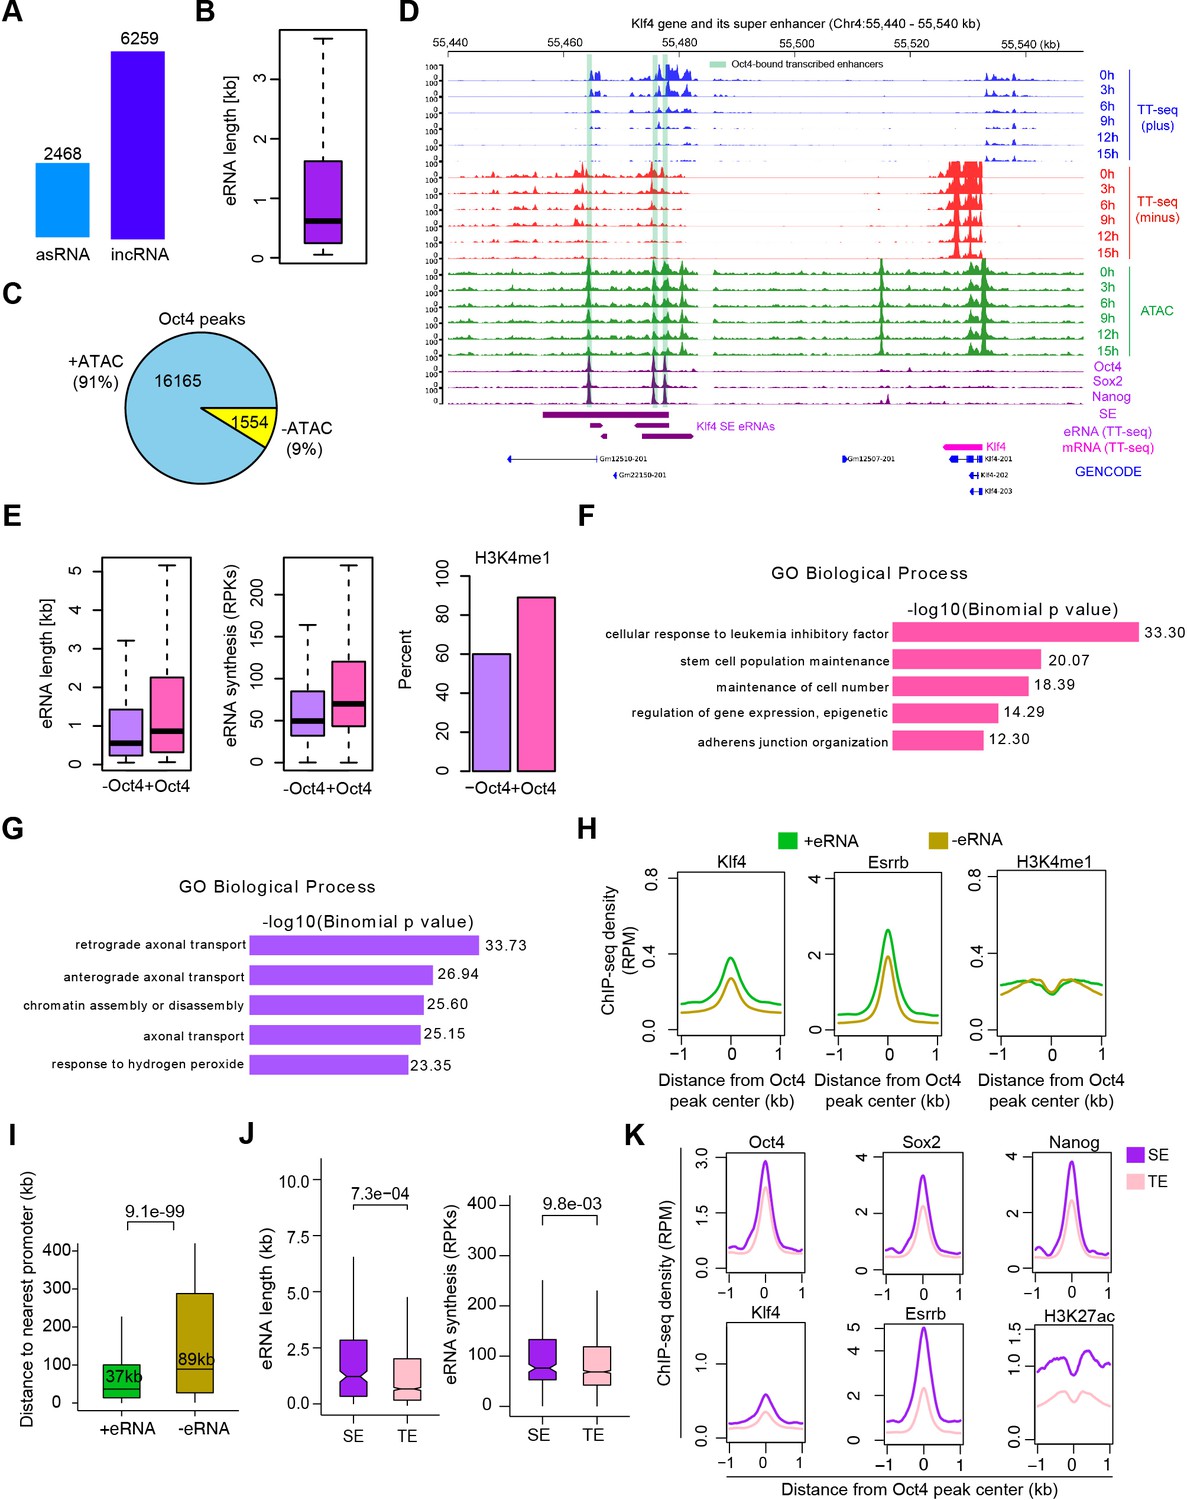
(A) Total number of asRNAs and incRNAs classified as putative eRNAs. (B) Length distribution of putative eRNAs. (C) Percentage of Oct4-binding sites overlapped with chromatin open regions detected by our ATAC-seq data. Oct4 ChIP-seq data were obtained from King and Klose, 2017. (D) Genome browser view of Oct4-bound transcribed enhancers at Kfl4 SE. Tracks from top to bottom: TT-seq coverages of plus strand (blue), minus strand (red), and ATAC-seq coverages (green) at 0, 3, 6, 9, 12, and 15 hr; ChIP-seq coverages of Oct4, Sox2, and Nanog (purple) from ZHBTc4 mouse ES cell at 0 hr (King and Klose, 2017); superenhancer (SE) annotation (Whyte et al., 2013); Klf4 SE eRNAs annotated by TT-seq (purple arrow); Klf4 gene (magenta arrow) annotated using TT-seq data; mouse GENCODE annotation for Klf4 gene (blue). Biological replicates were merged for visualization. (E) Length, synthesis, and H3K4me1 occupancy of Oct4-regulated eRNAs (n = 2221) versus other eRNAs (n = 6506). ChIP-seq data of H3K4me1 were obtained from Chronis et al., 2017. Gene ontology (GO) biological process enrichment of Oct4-regulated eRNAs (F) versus other eRNAs regions (G). (H) Metagene analysis of Klf4, Esrrb occupancy, or histone modification (H3K4me1) at Oct4-bound transcribed enhancers (n = 2231) and Oct4-bound nontranscribed enhancers (n = 12,710). ChIP-seq data were obtained from Chronis et al., 2017. y-Axis depicts ChIP-seq coverage density in reads per million (RPM). (I) Genomic distance distributions of Oct4-bound transcribed enhancers to their nearest gens versus Oct4-bound nontranscribed enhancers to their nearest genes. p values were calculated by Wilcoxon rank sum test. (J) Length and synthesis (reads per kilobases, RPKs) distributions of SE eRNAs (n = 243) versus typical enhancer (TE) eRNAs (n = 1978). p value were calculated by Wilcoxon rank sum test. (K) Metagene analysis of Oct4, Sox2, Nanog, Klf4, Esrrb occupancy, and H3K27ac histone modification at Oct4-occupied TE versus SE. ChIP-seq data of Oct4, Sox2, and Nanog were obtained from Chronis et al., 2017 and Klf4, Esrrb, and H3K27ac data from Chronis et al., 2017. y-Axis depicts ChIP-seq coverage density in reads per million (RPM).
Figure 4 with 3 supplements
Oct4 is required for enhancer and gene transcription.
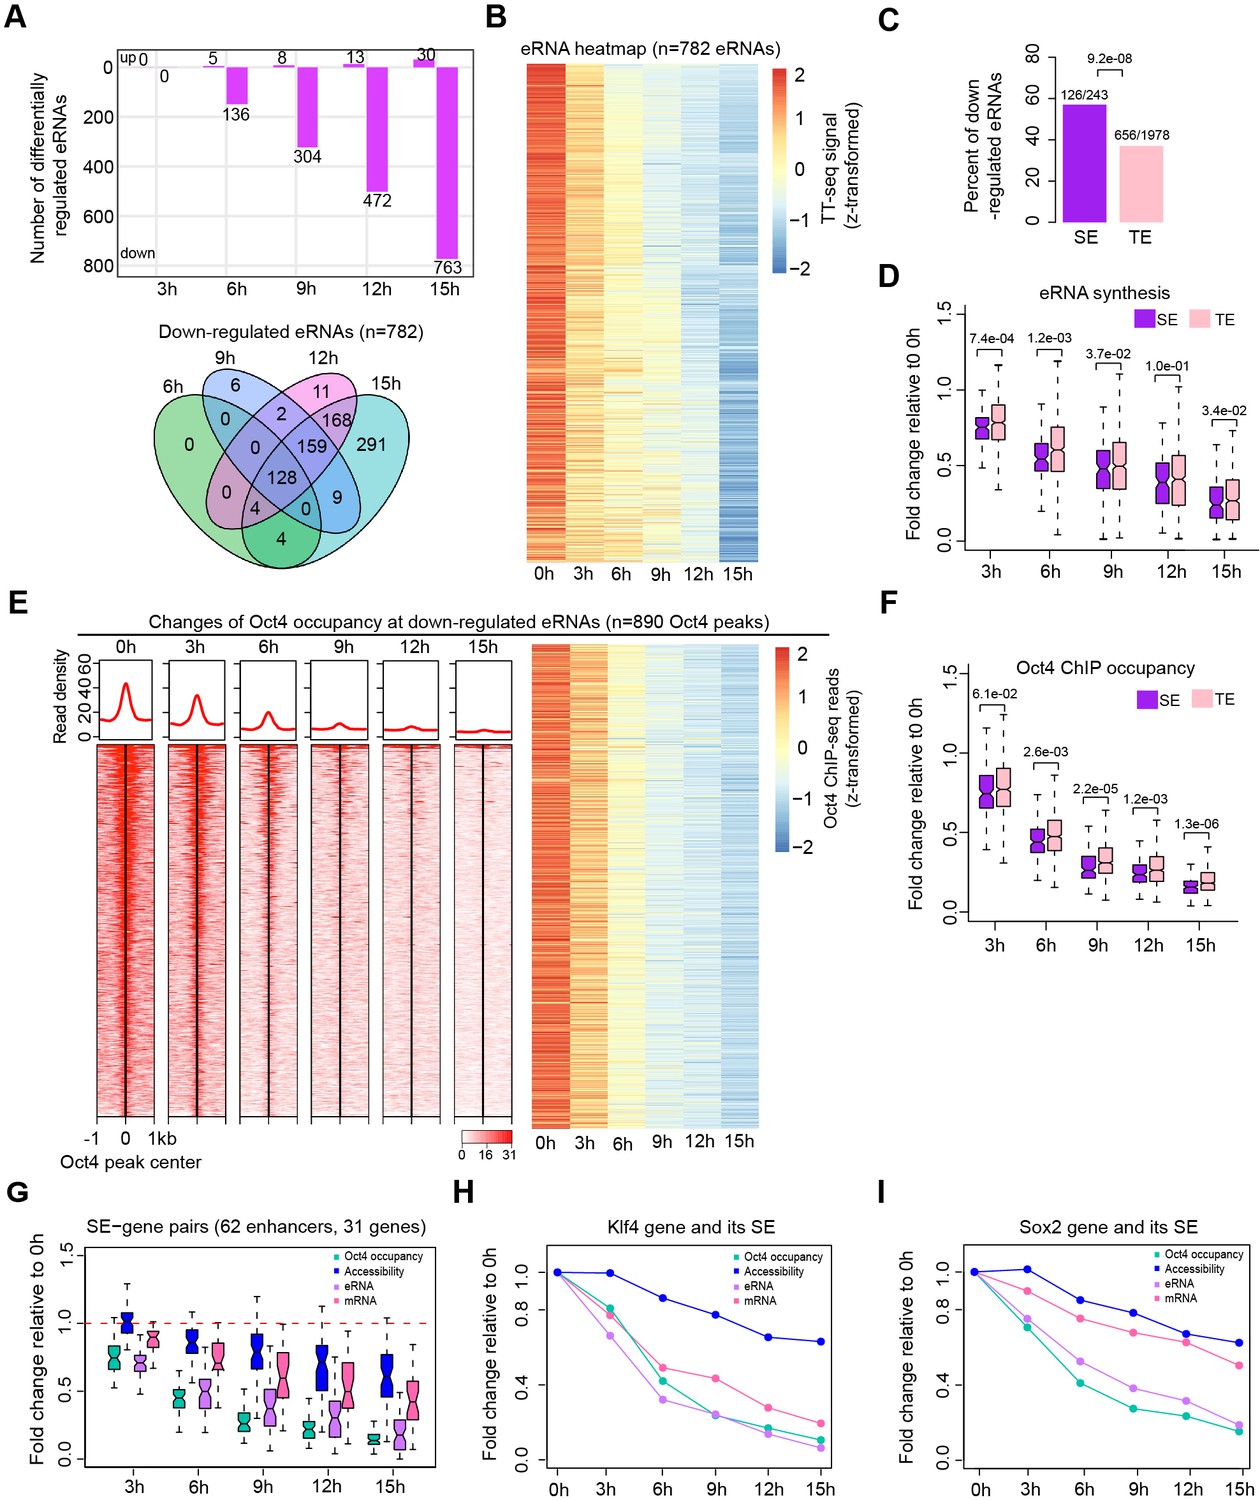
(A) The number of differentially expressed Oct4-regulated eRNAs detected by DESeq2 (top) and Venn diagram showing overlapping of differentially expressed Oct4-regulated eRNA (bottom) at each time point of doxycycline (DOX) treatment. (B) Heatmap visualizing the kinetics of Oct4-regulated downregulated eRNAs (n = 782). (C) Bar chart indicating the percentage of downregulated eRNAs at superenhancer (SE) and typical enhancer (TE). p value was calculated by Fisher’s exact test. (D) Boxplot indicating synthesis changes of downregulated eRNAs at SE (n = 126) versus TE (n = 656). y-Axis indicates fold change of eRNAs synthesis relative to 0 hr. p values were calculated by Wilcoxon rank sum test. Black bars represent the median values for each group. Lower and upper boxes are the first and third quartiles, respectively. The ends of the whiskers extend the box by 1.5 times the interquartile range. Outliers are not drawn. (E) Changes of Oct4 occupancy at downregulated eRNAs, illustrated by Oct4 ChIP-seq coverage (left) and count heatmaps (right). 782 downregulated eRNAs originated from 890 Oct4-bound transcribed enhancers (peaks). Normalized read densities are shown and peaks were ranked accordingly. (F) Boxplot indicating the corresponding Oct4 occupancy changes at downregulated SE versus TE eRNAs defined in (D). y-Axis indicates fold change of Oct4 occupancy relative to 0 hr. p values were calculated by Wilcoxon rank sum test. (G) Boxplot indicating changes of Oct4 occupancy, chromatin accessibility, eRNA and mRNA synthesis for 62 SE–gene pairs. y-Axis indicates fold change relative to 0 hr. Transcriptionally, downregulated SEs were paired with their nearest transcribed genes and pairs with downregulated genes were kept. Signal for individual Oct4-bound transcribed enhancers within SEs was plotted. (H) Fold changes of Oct4 occupancy, chromatin accessibility, eRNA and mRNA synthesis at the Klf4 gene and its associated SE. Fold changes of Oct4 occupancy, chromatin accessibility, and eRNA synthesis at the SE were represented by the average of the three individual enhancers within the SE (illustrated as IGV track in Figure 5F). (I) Fold changes of Oct4 occupancy, chromatin accessibility, eRNA and mRNA synthesis at the Sox2 gene and its associated SE. Fold changes of Oct4 occupancy and eRNA synthesis at the SE were represented by the average of the three individual enhancers within the SE (illustrated as IGV track in Figure 5G). Note that data from two biological replicates were generated for all assays and that the two replicates were merged for illustration.
Figure 4—figure supplement 1
eRNA synthesis changes at Oct4-bound transcribed enhancers, related to Figure 4.
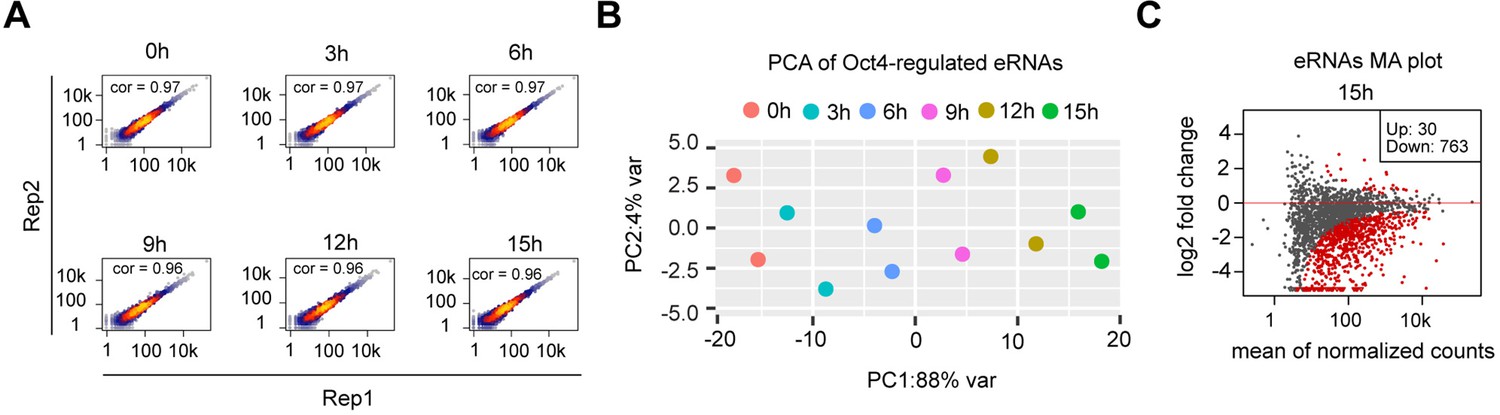
(A) Scatter plots showing correlation between two biological replicates of TT-seq data for Oct4-regulated eRNAs (n = 2221) for each time point of doxycycline (DOX) treatment. Spearman’s rank correlation coefficient was calculated and shown in each plot. (B) Principle component analysis of Oct4-regulated eRNA synthesis changes over time course of DOX treatment (0, 3, 6, 9, 12, and 15 hr) for two biological replicates. (C) MA plots showing differentially regulated Oct4-regulated eRNAs detected by DESeq2 after 15 hr of DOX treatment. Statistically significantly regulated eRNAs are depicted in red.
Figure 4—figure supplement 2
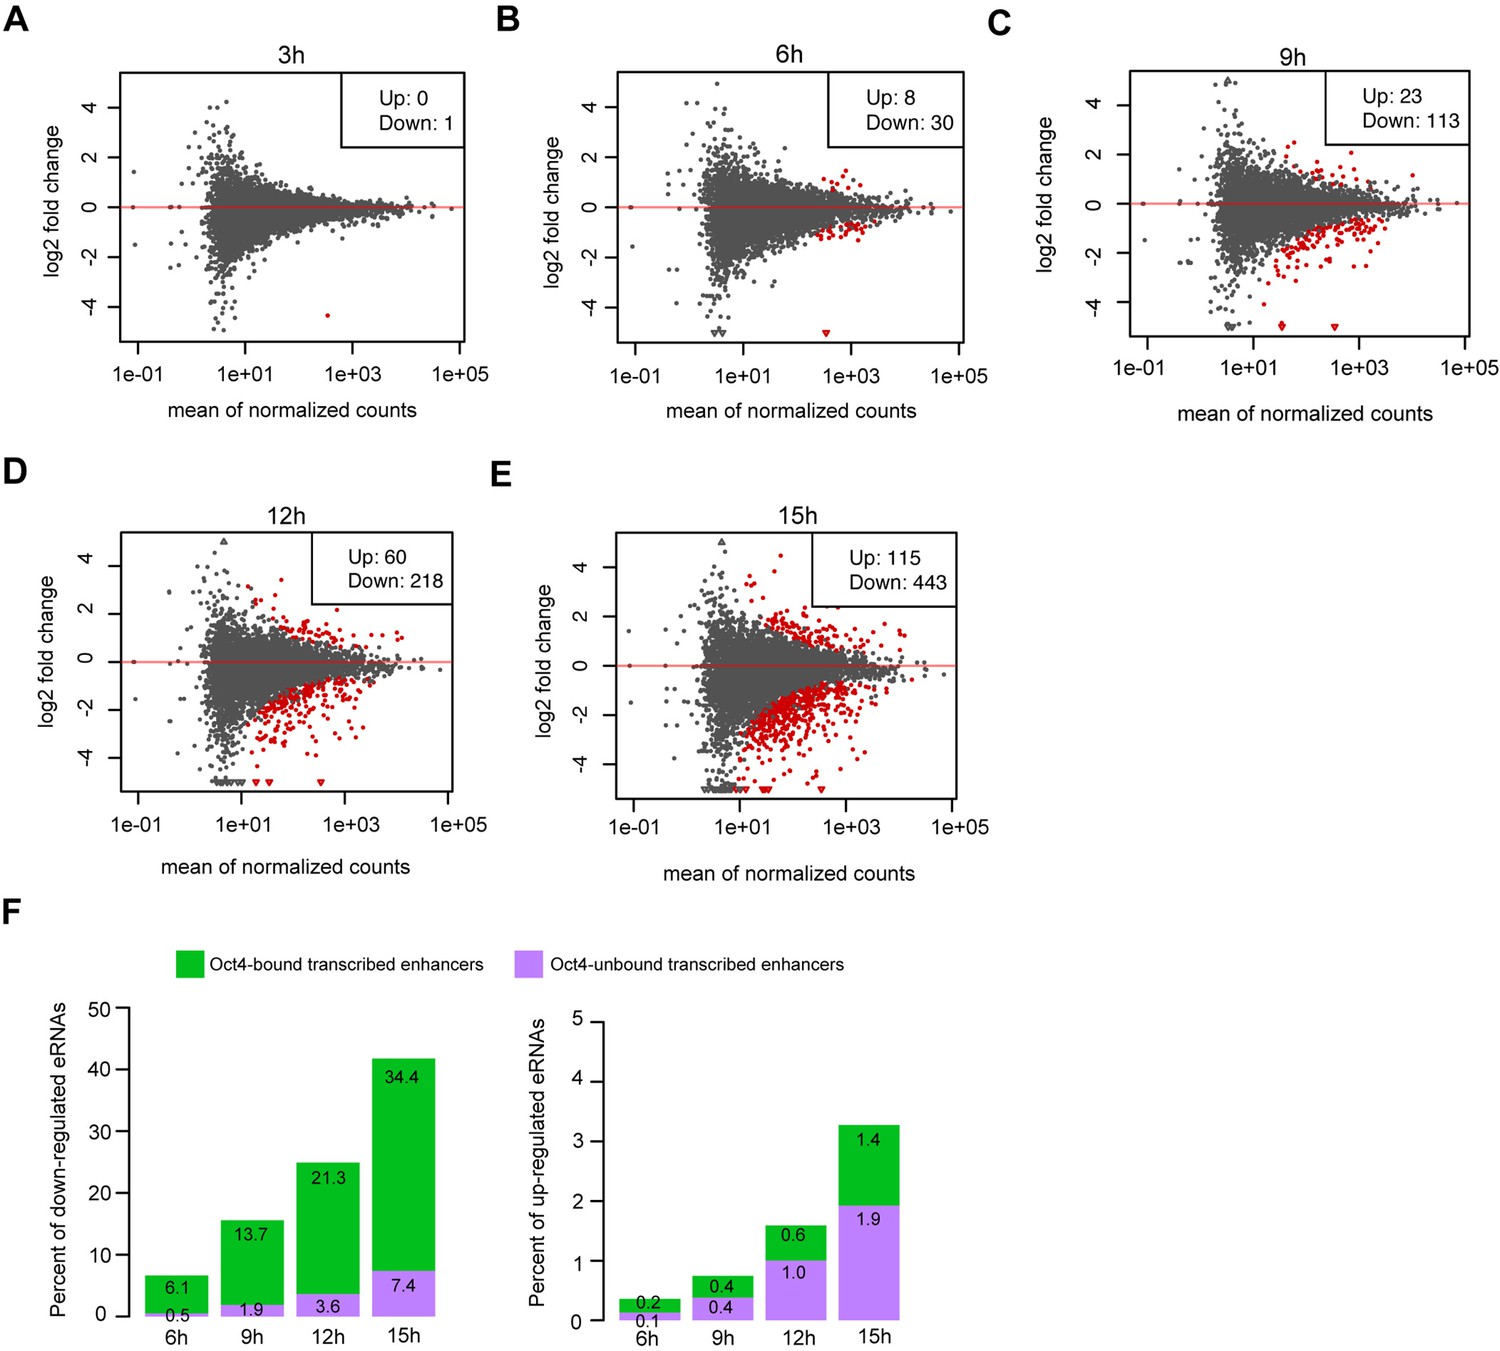
Differential expression analysis for eRNAs at Oct4-unbound transcribed enhancers, related to Figure 4.
(A–E) MA plots showing differentially regulated eRNAs at Oct4-bound transcribed enhancers detected by DESeq2 after 3, 6, 9, 12, and 15 hr of doxycycline (DOX) treatment. Statistically significant changes are depicted in red (adjusted p value <0.01). (F) Percent of significant downregulated eRNAs (left) and upregulated eRNAs (right) at Oct4-bound transcribed enhancers (green) and Oct4-unbound transcribed enhancers (purple) after 6, 9, 12, and 15 hr of DOX treatment.
Figure 4—figure supplement 3

Characterization of SE–gene pairs for which nearest gene transcription remained unchanged, related to Figure 4.
(A) Comparison of Oct4 occupancy (left) and (B) eRNA synthesis fold change (right) at decommissioned SEs for which nearest gene transcription was downregulated (purple) or remained unchanged (pink).
Figure 5 with 2 supplements
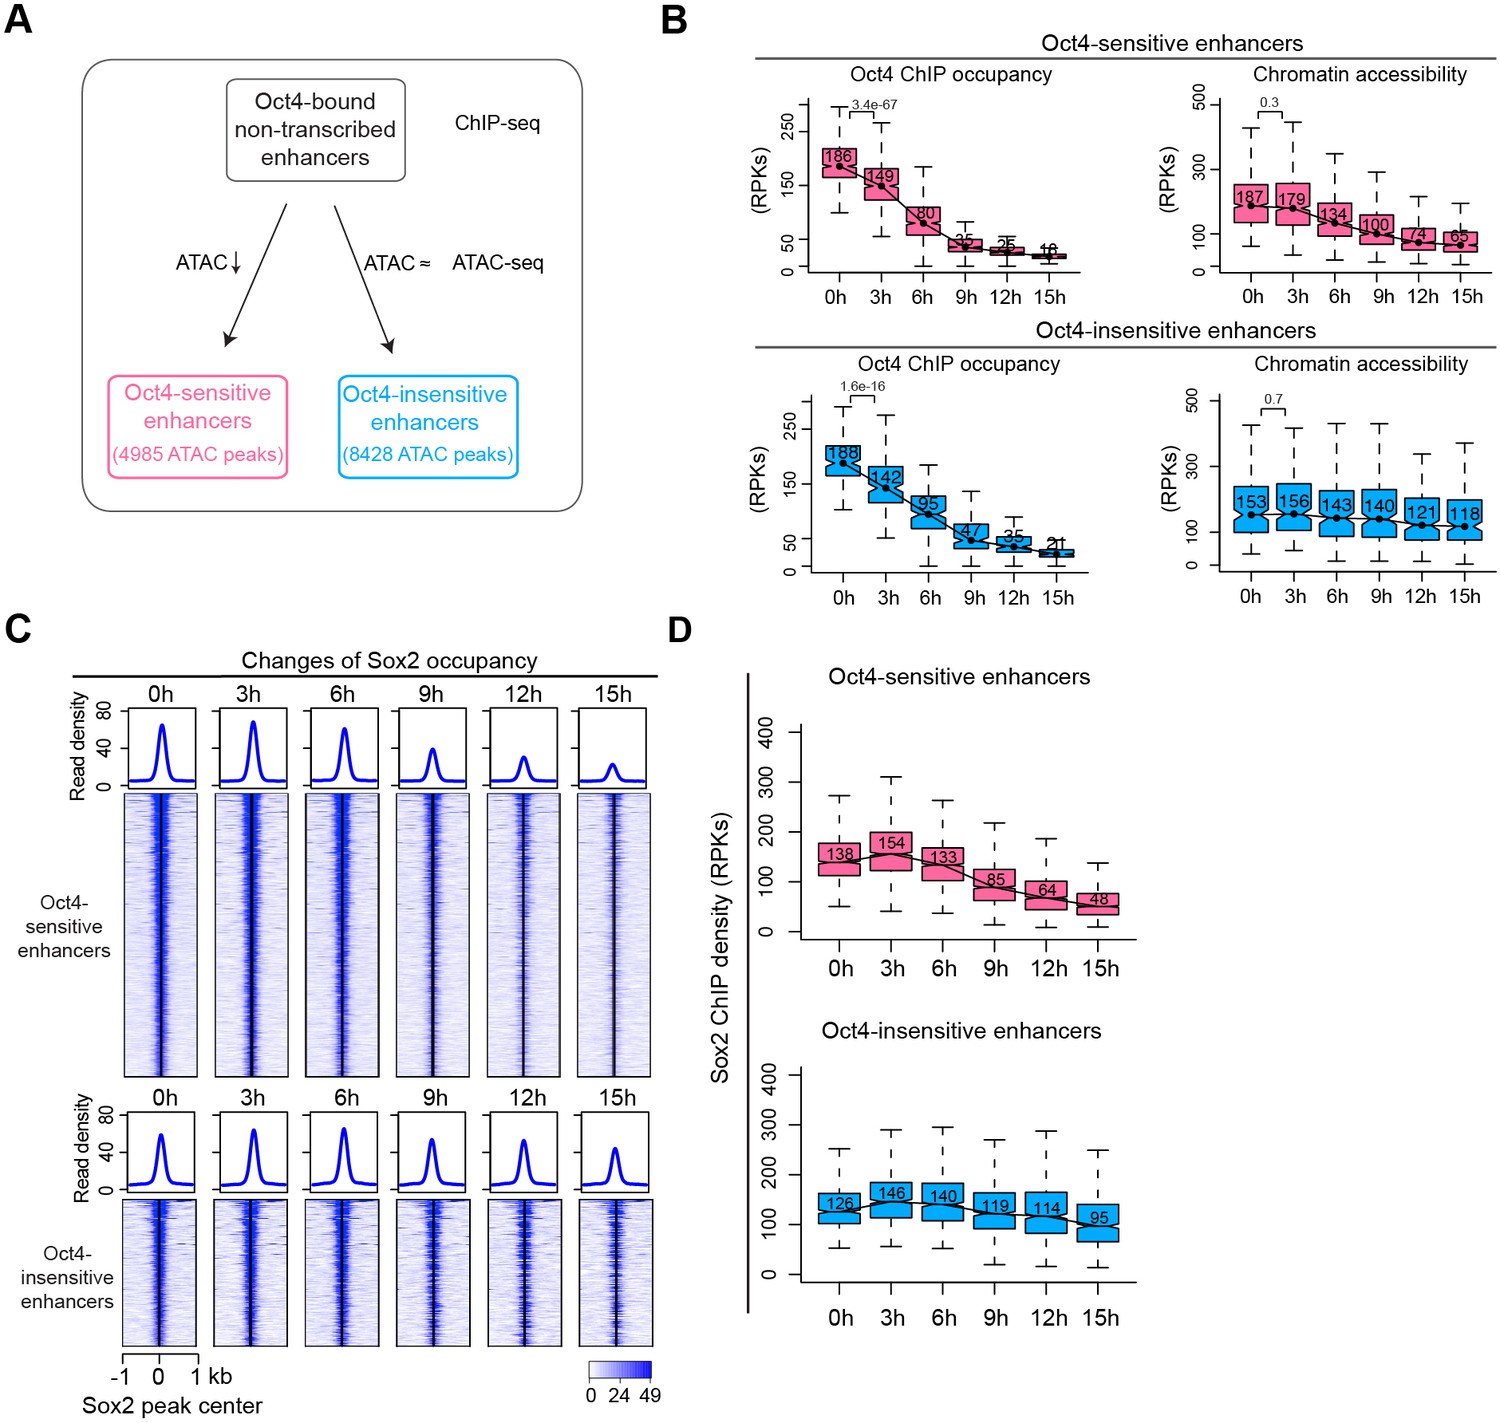
Reduced Oct4 binding does not immediately influence chromatin accessibility.
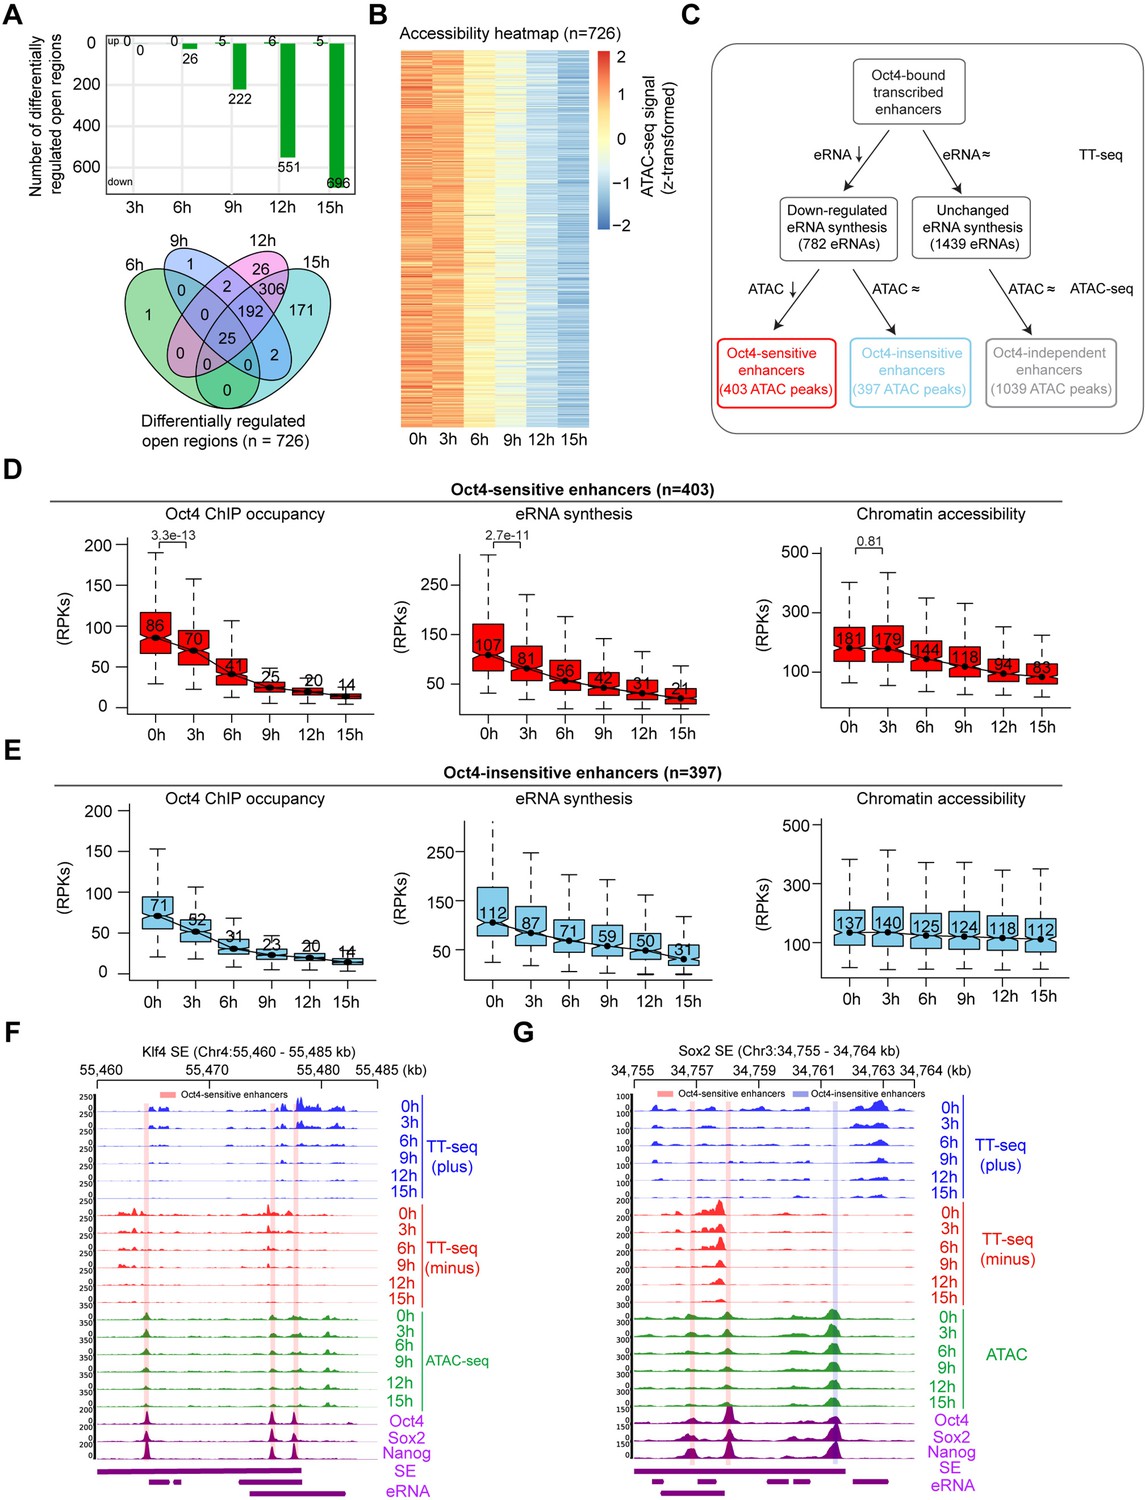
(A) The number of differentially regulated chromatin open regions detected by DESeq2 for Oct4-bound transcribed enhancers (top) and Venn diagram showing overlapping of detected differentially regulated open regions (bottom) for each time point of doxycycline (DOX) treatment. (B) Heatmap visualizing the kinetics of chromatin accessibility changes at Oct4-occupied accessibility decreased sites (n = 726). (C) Diagram indicating classification of Oct4-sensititive, -insensitive, and -independent enhancers defined by change of eRNA synthesis and chromatin accessibility at Oct4-bound transcribed enhancers. (D) Boxplots indicating the changes of Oct4 occupancy, eRNA synthesis, and chromatin accessibility at Oct4-sensitive enhancers (n = 403). p values were calculated by Wilcoxon rank sum test. y-Axis represents read counts per kilobase (RPKs). Black bars represent the median values for each group. Lower and upper boxes are the first and third quartiles, respectively. The ends of the whiskers extend the box by 1.5 times the interquartile range. Outliers are omitted. (E) Boxplots indicating the changes of Oct4 occupancy, eRNA synthesis, and chromatin accessibility at Oct4-insensitive enhancers (n = 397). (F) Genome browser view for changes of eRNA synthesis and chromatin accessibility at Klf4 superenhancer (SE) including three Oct4-sensitive enhancers. Tracks from top to bottom: TT-seq coverages of plus strand (blue), minus strand (red), and ATAC-seq coverages (green) at 0, 3, 6, 9, 12, and 15 hr; ChIP-seq coverages of Oct4, Sox2, and Nanog (purple) from ZHBTc4 mouse ES cell at 0 hr (King and Klose, 2017); SE annotation (Whyte et al., 2013); Klf4 SE eRNAs annotated by TT-seq (purple arrow). Two biological replicates were merged for visualization. (G) Genome browser view for changes of eRNA synthesis and chromatin accessibility at Sox2 SE including two Oct4-sensitive enhancers and one Oct4-insensitive enhancer. Tracks were ordered in the same way as in (F). Note that data from two biological replicates were generated for all assays and that the two replicates were merged for illustration.
Figure 5—figure supplement 1
Chromatin accessibility changes at Oct4-bound transcribed enhancers, related to Figure 5.
(A) Principle component analysis of chromatin accessibility changes at Oct4-bound transcribed enhancers (n = 2223) over time course of doxycycline (DOX) treatment (0, 3, 6, 9, 12, and 15 hr) for two biological replicates. (B) MA plots showing differentially regulated chromatin open regions detected by DESeq2 at 3, 6, and 15 hr DOX treatment for Oct4-bound transcribed enhancers. Statistically significant features are depicted in red. (C) Genome browser view for changes of eRNA synthesis and chromatin accessibility at Mir290 superenhancer (SE) including three Oct4-insensitive enhancers and one Oct4-sensitive enhancer. Tracks from top to bottom: TT-seq coverages of plus strand (blue), minus strand (red), and ATAC-seq coverages (green) at 0, 3, 6, 9, 12, and 15 hr; ChIP-seq coverages of Oct4, Sox2, and Nanog (purple) from ZHBTc4 mouse ES cell at 0 hr (King and Klose, 2017); SE annotation (Whyte et al., 2013); Mir290 SE eRNAs annotated by TT-seq (purple arrow). Biological replicates were merged for visualization. (D) Boxplots showing the changes of eRNA synthesis and chromatin accessibility at Oct4-independent enhancers (n = 1039).
Figure 5—figure supplement 2
Analysis of differential chromatin accessibility for Oct4-unbound transcribed enhancers, related to Figure 5.
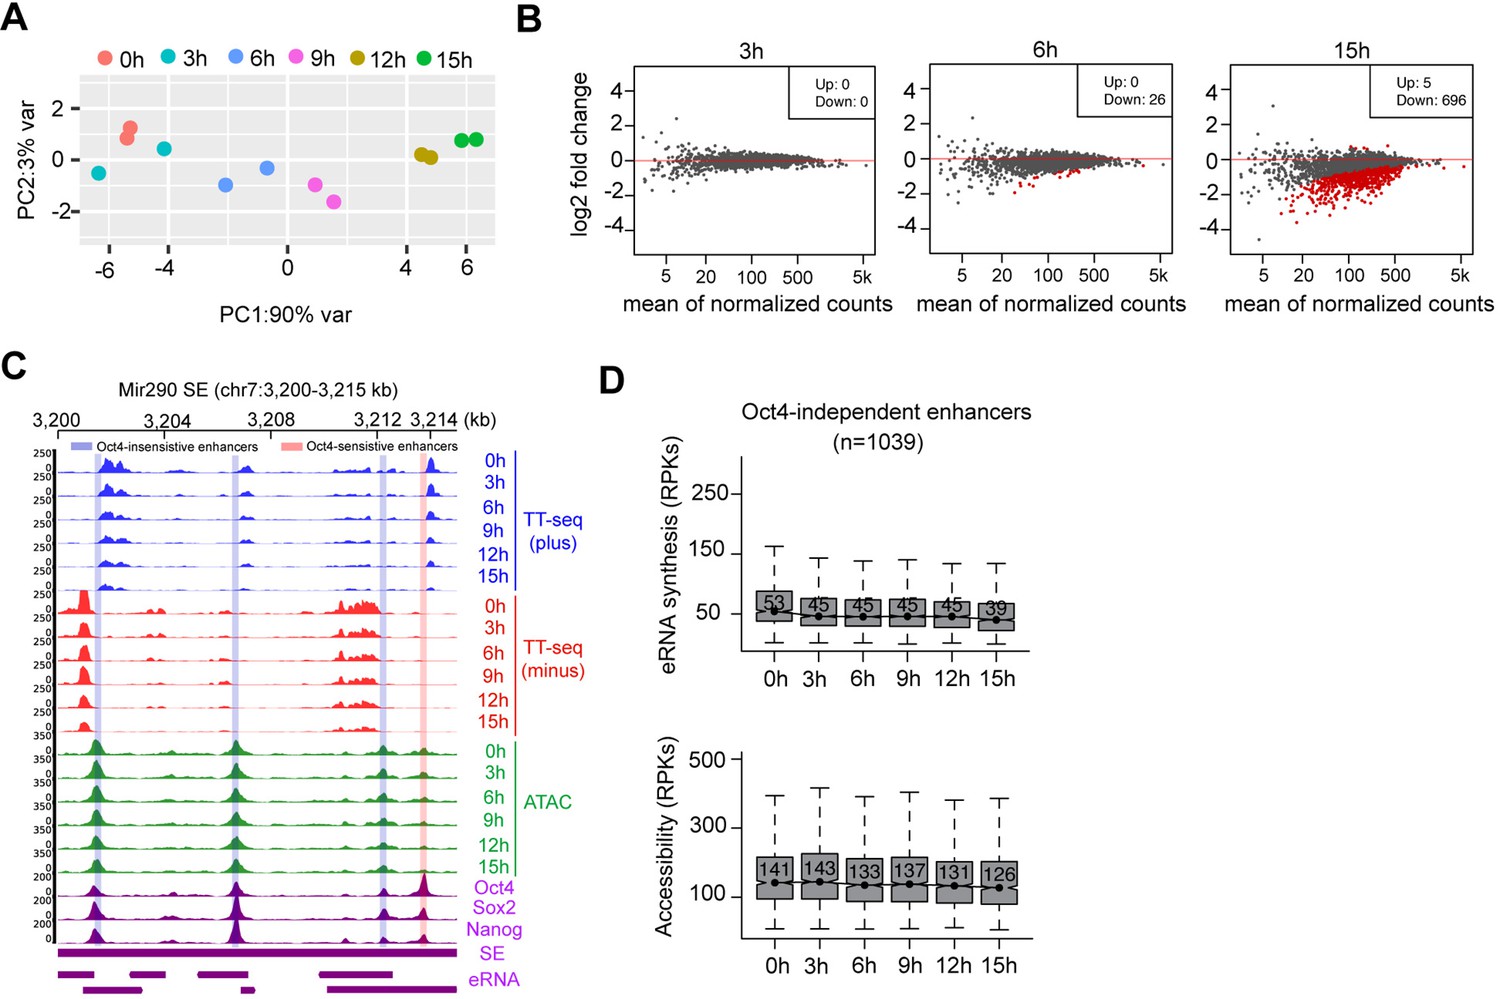
(A–E) MA plots showing differentially regulated chromatin accessible regions at Oct4-unbound transcribed enhancers detected by DESeq2 after 3, 6, 9, 12, and 15 hr of doxycycline (DOX) treatment. Statistically significant changes are depicted in red (adjusted p value <0.01). (F) Boxplots showing chromatin accessibility for Oct4-unbound transcribed enhancers. y-Axis indicates read counts per kilobase (RPKs).
Figure 6 with 3 supplements

Sox2 remains bound transiently at Oct4-sensitive enhancers upon Oct4 depletion.
(A) Metagenes analysis of Oct4 and Sox2 occupancy at Oct4-sensitive, -insensitive, and -independent enhancers at 0 hr, data were obtained from King and Klose, 2017. y-Axis depicts ChIP-seq coverage density in reads per million (RPM). (B) Percentage of motif occurrence at Oct4-sensitive, -insensitive, and -independent enhancers for SoxOct composite motif and Oct4, Sox2, Esrrb, and Klf4 motifs. (C) Heatmap showing changes of Sox2 occupancy at Oct4-sensitive and -insensitive enhancers over the entire time course of doxycycline (DOX) treatment. Normalized read densities are shown and peaks were ranked accordingly. (D) Same as (C), but using boxplots to depict quantification of Sox2 occupancy changes at Oct4-sensitive and -insensitive enhancers. y-Axis represents Sox2 ChIP-seq density in reads per kilobase (RPKs). Black bars represent the median values for each group. Lower and upper boxes are the first and third quartiles, respectively. The ends of the whiskers extend the box by 1.5 times the interquartile range. Outliers are omitted. (E) Genome browser view illustrating changes of chromatin accessibility, Sox2 and Oct4 occupancy at Klf4 SE. Tracks from top to bottom: ATAC-seq coverages (green), ChIP-seq coverages for Sox2 (blue), and Oct4 (red) at 0, 3, 6, 9, 12, and 15 hr; ChIP-seq coverages for Oct4, Sox2, and Nanog (purple) from ZHBTc4 mouse ES cell at 0 hr (King and Klose, 2017); superenhancer (SE) annotation (Whyte et al., 2013). (F) Genome browser view illustrating changes of chromatin accessibility, Sox2 and Oct4 occupancy at Sox2 SE. Tracks were visualized and ordered in the same way as in (E). Note that data from two biological replicates were generated for all assays and that the two replicates were merged for illustration.
Figure 6—figure supplement 1

Characterization of Oct4-sensitive, -insensitive, and -independent enhancers, related to Figure 6.
(A) Heatmap showing co-occupancy of Oct4 and Sox2 at Oct4-sensitive, -insensitive, and -independent enhancers at 0 hr. ChIP-seq data were obtained from King and Klose, 2017. (B) Metagenes analysis of Nanog, Klf4, Esrrb occupancy and H3K4me1, H3K27ac histone modifications at Oct4-sensistive, -insensitive, and -independent enhancers at 0 hr. Nanog ChIP-seq data were obtained from King and Klose, 2017, other ChIP-seq data were obtained from Chronis et al., 2017. (C) Gene ontology (GO) biological process enrichment of Oct4-sensitive enhancers. (D) GO biological process enrichment of Oct4-insensitive enhancers. (E) Overlap of nearest target genes of Oct4-sensitive and -insensitive enhancers.
Figure 6—figure supplement 2
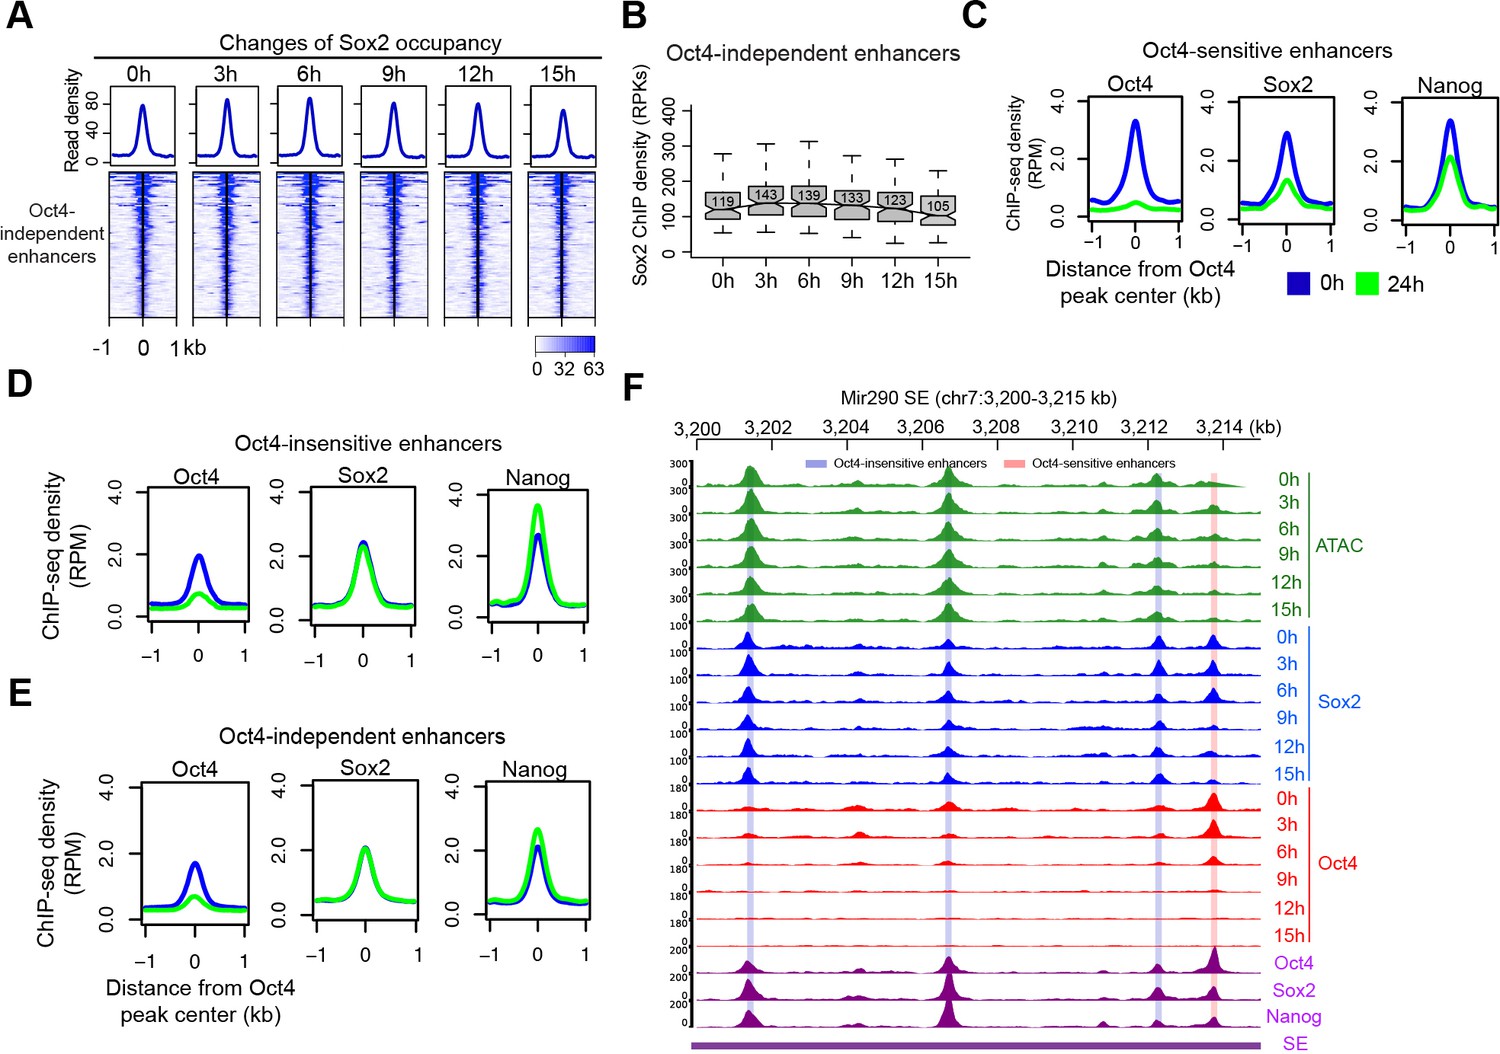
Change of Sox2 occupancy upon Oct4 depletion, related to Figure 6.
(A) Heatmap showing changes of Sox2 occupancy at Oct4-independent enhancers over the entire time course of doxycycline (DOX) treatment. Normalized read densities are shown and peaks were ranked accordingly. (B) Same as (A), but using boxplot to depict quantification of Sox2 occupancy changes at Oct4-independent enhancers. y-Axis represents Sox2 ChIP-seq density in reads per kilobase (RPKs). (C) Metagenes analysis of Oct4, Sox2, and Nanog occupancy after 0 and 24 hr of DOX treatment at Oct4-sensistive enhancers. ChIP-seq data were obtained from King and Klose, 2017. y-Axis depicts ChIP-seq coverage density in reads per million (RPM). (D) Metagenes analysis of Oct4, Sox2, and Nanog occupancy after 0 and 24 hr of DOX treatment at Oct4-insensistive enhancers. (E) Metagenes analysis of Oct4, Sox2, and Nanog occupancy after 0 and 24 hr of DOX treatment at Oct4-independent enhancers. (F) Genome browser view illustrating changes of chromatin accessibility, Sox2 and Oct4 occupancy at Mir290 SE. Tracks from top to bottom: ATAC-seq coverages (green), ChIP-seq coverages for Sox2 (blue) and Oct4 (red) at 0, 3, 6, 9, 12, and 15 hr; ChIP-seq coverages for Oct4, Sox2, and Nanog (purple) from ZHBTc4 mouse ES cell at 0 hr (King and Klose, 2017); superenhancer (SE annotation Whyte et al., 2013). Biological replicates were merged for visualization.
Figure 6—figure supplement 3

Sox2 occupancy at Oct4-unbound transcribed enhancers, related to Figure 6.
(A) Heatmap showing changes of Sox2 occupancy at Oct4-unbound transcribed enhancers targeted by Sox2 over the entire time course of doxycycline (DOX) treatment. Normalized read densities are shown and peaks were ranked accordingly (data from two biological replicates were merged). (B) Same as (A), but using boxplots to depict quantification of Sox2 occupancy changes. y-Axis represents normalized Sox2 ChIP-seq read density in reads per kilobase (RPKs). Oct4-unbound transcribed enhancers targeted by Sox2 are defined by overlapping them with Sox2 peaks (within a 1-kb window) called from our ChIP-seq data.
Figure 7 with 1 supplement
Sox2 remains bound transiently at Oct4-sensitive enhancers in the absence of eRNA synthesis.
(A) Diagram indicating classification of Oct4-sensititive and -insensitive enhancers by changes of chromatin accessibility at Oct4-bound nontranscribed enhancers. (B) Boxplots illustrating changes of Oct4 occupancy and chromatin accessibility at Oct4-sensitive and -insensitive enhancers. p values were calculated by Wilcoxon rank sum test. y-Axis represents read counts per kilobases (RPKs). Black bars represent the median values for each group. Lower and upper boxes are the first and third quartiles, respectively. The ends of the whiskers extend the box by 1.5 times the interquartile range. Outliers are omitted. (C) Heatmap showing changes of Sox2 occupancy at Oct4-sensitive and -insensitive enhancers over the entire time course of doxycycline (DOX) treatment. Normalized read densities are shown and peaks were ranked accordingly. (D) Same as (C), but using boxplots to depict quantification of Sox2 occupancy changes at Oct4-sensitive and -insensitive enhancers. y-Axis represents Sox2 ChIP-seq density in reads per kilobase (RPKs). Note that data from two biological replicates were generated for all assays and that the two replicates were merged for illustration.
Figure 7—figure supplement 1

Chromatin accessibility changes at Oct4-bound nontranscribed enhancers, related to Figure 7.
(A) Principle component analysis of chromatin accessibility changes at Oct4-bound nontranscribed enhancers (n = 12,710) over time course of doxycycline (DOX) treatment (0, 3, 6, 9, 12, and 15 hr) for two biological replicates. (B) The number of differentially regulated chromatin open regions detected by DESeq2 at each time point for Oct4-bound nontranscribed enhancers. (C) Venn diagram showing overlapping of differentially regulated chromatin open regions from (B) at each time point. (D) Heatmap visualizing the kinetics of chromatin accessibility changes at differentially regulated chromatin open regions (n = 4985). (E) Metagenes analysis of Oct4, Sox2, and Nanog occupancy after 0 and 24 hr of DOX treatment at Oct4-sensitive and -insensitive enhancers. ChIP-seq data of Oct4, Sox2, and Nanog were obtained from King and Klose, 2017. (F) Metagene analysis of Oct4, Sox2, Nanog, Esrrb, and Klf4 occupancy and H3K4me1, K3K27ac histone modifications at Oct4-sensitive and -insensitive enhancers. ChIP-seq data of Oct4, Sox2, and Nanog were obtained from King and Klose, 2017, other ChIP-seq data were obtained from Chronis et al., 2017. y-Axis depicts ChIP-seq coverage density in reads per million (RPM). (G) Percentage of motif occurrence at Oct4-sensitive and -insensitive enhancers for Sox2–Oct4 composite motif and Oct4, Sox2, Esrrb, and Klf4 motifs.
Figure 8 with 1 supplement
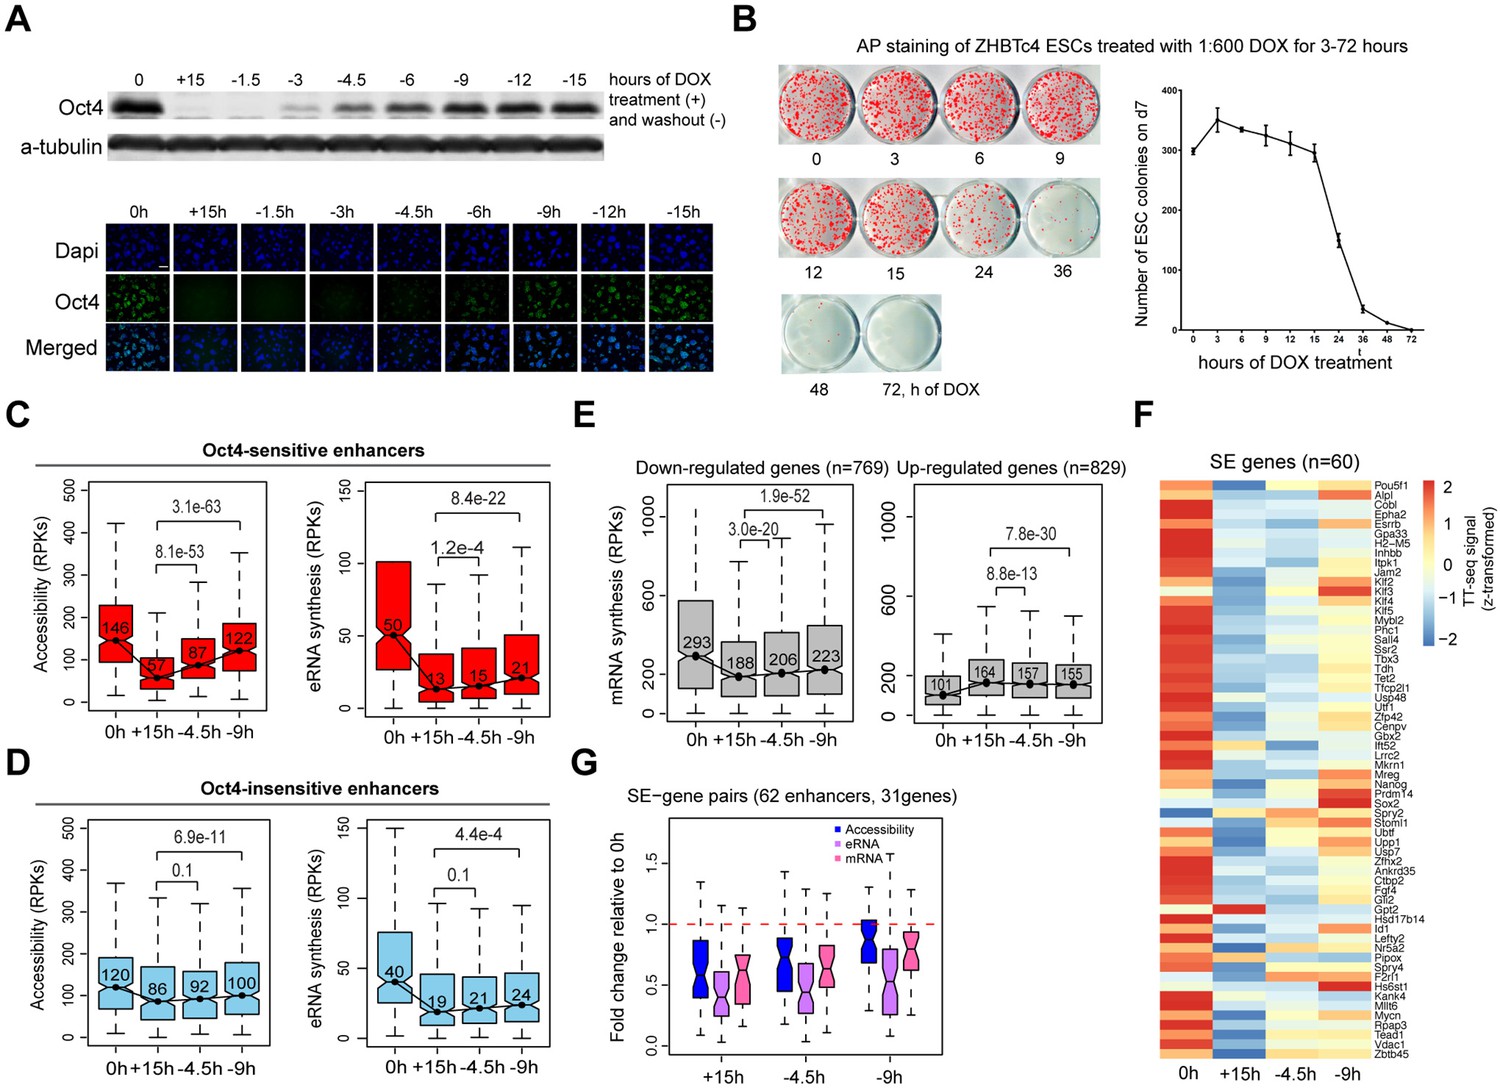
Partial recovery of Oct4 increases chromatin accessibility and enhancer transcription.
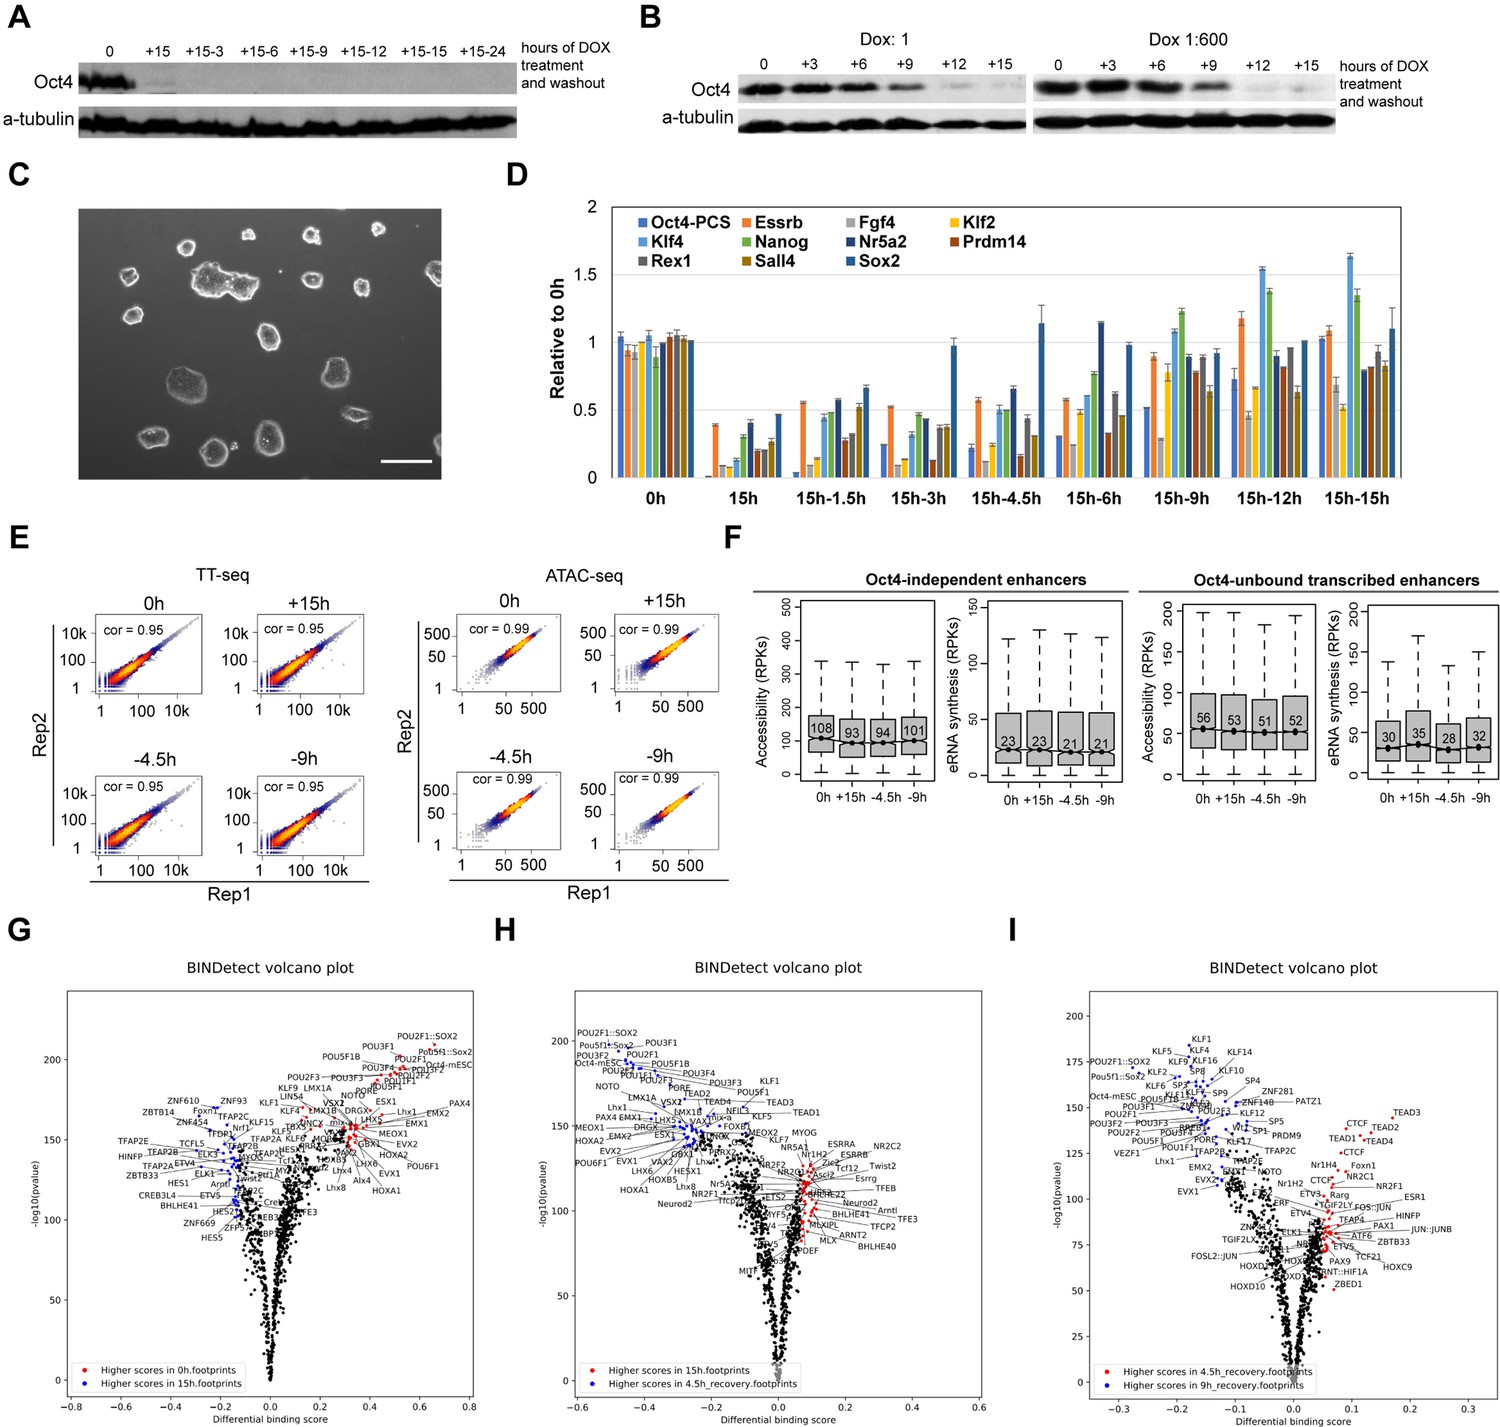
(A) Western blot analysis of whole cell lysate samples after 0 and 15 hr of 1:600 diluted doxycycline (DOX) treatment and 1.5, 3, 4.5, 6, 9, 12, and 15 hr Oct4 recovery by DOX washout using Oct4 and a-tubulin antibodies (top). Oct4 protein levels decreased to 0.6% (+15 hr) and increased to 0.1% (−1.5 hr), 2.3% (−3 hr), 8.7% (−4.5 hr), 17.2% (−6 hr), 27.6% (−9 hr), 35.0% (−12 hr), and 37.0% (−15 hr) compared to 0 hr. Immunofluorescence of ZHBTc4 cells after 0 and 15 hr of 1:600 diluted DOX treatment and 1.5, 3, 4.5, 6, 9, 12, and 15 hr Oct4 recovery by DOX washout (bottom). Blue: DAPI, green: Oct4; scale = 200 μm. (B) AP staining of ZHBTc4 embryonic stem cells (ESCs) treated with 1:600 dox for 3–72 hr, 7 days after plating 1k cells on 12-well plate. (C) Boxplots indicating the changes in chromatin accessibility and eRNA synthesis at Oct4-sensitive enhancers during the time course of Oct4 depletion and recovery. p values were calculated by paired Wilcoxon rank sum test. y-Axis represents read counts per kilobase (RPKs). Black bars represent the median values for each group. Lower and upper boxes are the first and third quartiles, respectively. The ends of the whiskers extend the box by 1.5 times the interquartile range. Outliers are omitted. (D) As in (C), but for Oct4-insensitive enhancers. (E) Boxplots showing the changes of mRNA synthesis for previously identified downregulated genes (n = 769) and upregulated genes (n = 829) (Figure 2B) during Oct4 depletion and recovery. (F) Heatmap showing changes in mRNA synthesis for previously identified SE-controlled downregulated genes (n = 60, Figure 2H) during Oct4 depletion and recovery. (G) Boxplot showing fold changes in chromatin accessibility, eRNA and mRNA synthesis for previously identified SE–gene pairs (Figure 4G) during Oct4 recovery.
-
Figure 8—source data 1
Source data for Figure 8A.
The original files of the raw unedited western blots of the whole cell lysate samples and their quantification.
- https://cdn.elifesciences.org/articles/71533/elife-71533-fig8-data1-v1.zip
Figure 8—figure supplement 1
Oct4 recovery rapidly restores pluripotency in ZHBTc4 mouse embryonic stem cells (ESCs), related to Figure 8.
(A) Western blot analysis of whole cell lysates after 15 hr of doxycycline (DOX)-induced depletion and subsequent recovery over a 24-hr time course after DOX washout using Oct4 and β-Tubulin (control) antibodies. (B) Western blot analysis of whole cell lysates over the time course of 1× DOX or 1:600× DOX-induced depletion using Oct4 and β-Tubulin (control) antibodies. (C) Phase-contrast microscopy images of ESCs depleted for Oct4 by treatment of 1× DOX for 48 hr than washed to reintroduce Oct4. The recovered ESCs were expanded for three passages. Scale = 200 μm. (D) qPCR analysis of pluripotency-related gene expression in ESCs depleted for Oct4 by treatment with 1:600× DOX for 15 hr and for time course Oct4 recovery samples. Error bars represent standard deviation (SD); n = 3. (E) Scatter plots showing correlation between two biological replicates of TT-seq and ATAC-seq data at 0, 15 hr depletion and 4.5, 9 hr of Oct4 recovery. For TT-seq data, normalized counts of annotated eRNAs (n = 8728) were plotted. For ATAC-seq data, normalized ATAC-seq counts for Oct4-bound transcribed enhancers (n = 2223) were plotted. Spearman’s rank correlation coefficient was calculated and shown in each plot. (F) Boxplots showing the changes of eRNA synthesis and chromatin accessibility at Oct4-independent enhancers and -unbound transcribed enhancers during Oct4 recovery time courses. (G–I) Differential transcription factor (TF) footprinting analysis for the whole MEME motif database of ATAC-seq data for Oct4-depleted and recovered ESCs using BINDetect function of TOBIAS.
-
Figure 8—figure supplement 1—source data 1
Source data for Figure 8—figure supplement 1A, B.
The original files of the raw unedited western blots.
- https://cdn.elifesciences.org/articles/71533/elife-71533-fig8-figsupp1-data1-v1.zip
Author response image 1
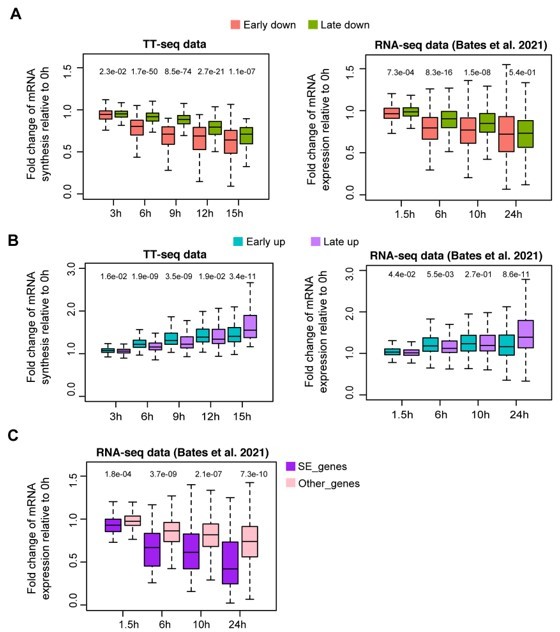
Response kinetics of different types of differentially regulated gene groups in our TT-seq data and RNA-seq data from Bates et al.
, 2021. (A) Response kinetics of early/late down-regulated genes. (B) Response kinetics of early/late up-regulated genes. (C) Responses kinetics of SE nearest down-regulated genes and other down-regulated genes using RNA-seq data from Bates et al., 2021, in comparison to Figure 2G.
Author response image 2
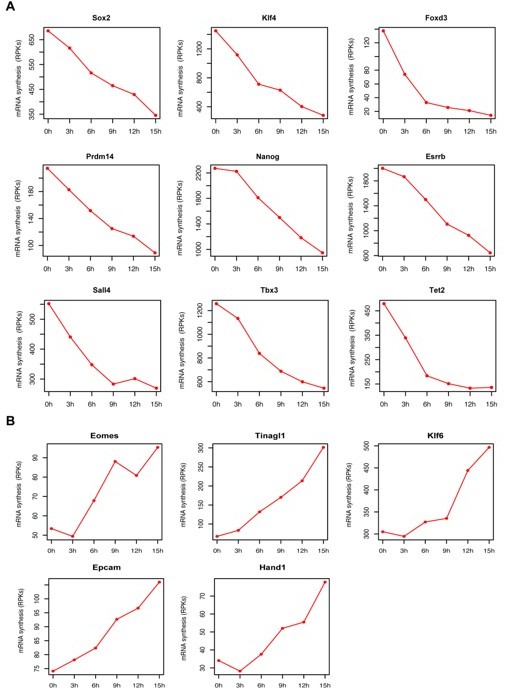
mRNA synthesis changes for pluripotency factors and genes associated with trophectoderm differentiation over time.
(A) Genes coding for pluripotency factors (B) Genes associated with trophectoderm differentiation. Y axis represents TT-seq read counts in reads per kilobase (RPKs).
Author response image 3
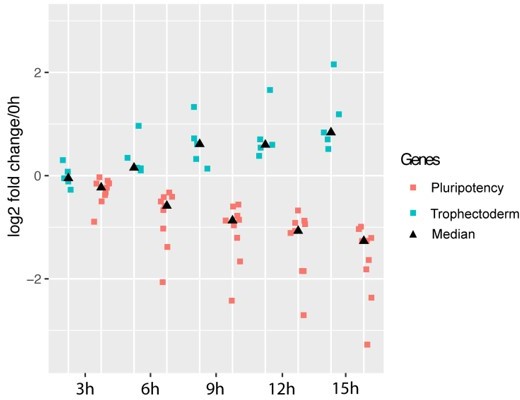
Exit of pluripotency precedes trophectoderm differentiation.
Pluripotency genes (red) correspond to genes plotted in Author response image 2A, trophectoderm genes (green) correspond to genes plotted in Author response image 2B. Medians for each gene group at each time point are represented by black triangle. Y axis indicates log2 fold change relative to 0h.
Author response image 4
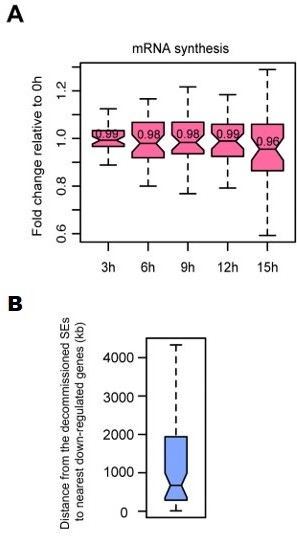
Characterization of SE-gene pairs for which nearest gene transcription remained unchanged.
(A) Boxplots showing mRNA synthesis fold change for unchanged nearest genes of decommissioned SEs. (B) Boxplot showing genomic distances from the decommissioned SEs for which nearest gene transcription remained unchanged to the nearest down-regulated genes detected in TT-seq.
Tables
Key resources table
| Reagent type (species) or resource | Designation | Source or reference | Identifiers | Additional information |
|---|---|---|---|---|
| Cell line (Mus musculus) | ESC_ZHBTc4: Pou5f1BSD/Zeo; Tg(CAG-tTA); Tg(TetO-Pou5f1) | Niwa et al., 2000 | RRID:CVCL_C715 | Oct4 depletion cell line |
| Antibody | Mouse monoclonal against Oct-3/4 | Santa Cruz | Cat# sc-5279, RRID:AB_628051 | Western (1:2500) |
| Antibody | Goat polyclonal against Sox2 | Santa Cruz | Cat# sc17320, RRID:AB_2286684 | Western (1:1000) |
| Antibody | Rabbit polyclonal against Nanog | Bethyl Laboratories | Cat# A300-397A, RRID:AB_386108 | Western (1:5000) |
| Antibody | Rabbit polyclonal against Histone 3 | Abcam | Cat# ab1791, RRID:AB_302613 | Western (1:20000) |
| Antibody | Mouse monoclonal against anti-alpha-Tubulin | Sigma-Aldrich | Cat# T6199, RRID:AB_477583 | Western (1:5000) |
| Antibody | Mouse monoclonal against Oct-3/4 | Santa Cruz | Cat# sc-5279, RRID:AB_628051 | IF (1:1000) |
| Antibody | Goat polyclonal against Sox2 | Santa Cruz | Cat# sc17320, RRID:AB_2286684 | IF (1:500) |
| Antibody | Goat polyclonal against Sox2 | Neuromics | Cat# GT15098, RRID:AB_2195800 | ChIP (1.5 ug/25 ug chromatin) |
| Antibody | Goat polyclonal against Oct-3/4 | R&D | Cat# AF1759, RRID:AB_354975 | ChIP (4 ug/25 ug chromatin) |
| Commercial assay or kit | Ovation Universal RNA-seq System | NuGEN | Cat# 0343-32 | |
| Commercial assay or kit | NEBNext Ultra II DNA Library Prep Kit | NEB | Cat# E7370L | |
| Commercial assay or kit | Illumina Tagment DNA Enzyme and Buffer large kit | Illumina | Cat# 20034198 | |
| Commercial assay or kit | Nextera Tn5 enzyme | Illumina | Cat# 20034198 | |
| Chemical compound, drug | CHIR99021 | Cayman Chemicals | 13,122 | |
| Chemical compound, drug | PD0325901 | Biomol | 103034-25 | |
| Chemical compound, drug | Doxycycline | Sigma-Aldrich | Cat# D9891-1G | |
| Chemical compound, drug | 4-Thiouridine | Carbosynth | Cat# NT06186 | |
| Chemical compound, drug | Formaldehyde 16% concentrate stock methanol-free | Thermo Fisher Scientific | Cat# 28,908 | |
| Software, algorithm | STAR (2.5.3) | Dobin et al., 2013 | RRID:SCR_015899 | |
| Software, algorithm | Samtools (1.6) | Li et al., 2009 | RRID: SCR_002105 | |
| Software, algorithm | HTSeq (0.9.1) | Anders et al., 2015 | RRID:SCR_005514 | |
| Software, algorithm | GenoSTAN (2.18.0) | Zacher et al., 2017 | https://www.bioconductor.org/packages/release/bioc/html/STAN.html | |
| Software, algorithm | tilingArray (1.68.0) | Huber et al., 2006 | https://www.bioconductor.org/packages/release/bioc/html/tilingArray.html | |
| Software, algorithm | pyGenomeTracks (3.5.1) | Lopez-Delisle et al., 2021 | RRID:SCR_016366 | |
| Software, algorithm | Cutadapt (1.16) | Martin, 2011 | RRID:SCR_011841 | |
| Software, algorithm | MACS2 (2.1.1.20160309) | Zhang et al., 2008 | RRID:SCR_013291 | |
| Software, algorithm | Bowtie 2 (2.3.4.1) | Langmead and Salzberg, 2012 | RRID:SCR_005476 | |
| Software, algorithm | DESeq2 (1.26.0) | Love et al., 2014 | RRID:SCR_015687 | |
| Software, algorithm | DAVID Bioinformatcis Resources (6.8) | Huang et al., 2009 | RRID:SCR_001881 | |
| Software, algorithm | GREAT (4.04) | McLean et al., 2010 | RRID:SCR_005807 | |
| Software, algorithm | FIMO (5.0.4) | Grant et al., 2011 | RRID:SCR_001783 | |
| Software, algorithm | UCSD LiftOver | Hinrichs et al., 2006 | RRID:SCR_018160 | |
| Software, algorithm | TOBIAS | Bentsen et al., 2020 | https://github.com/loosolab/TOBIAS |
Additional files
-
Supplementary file 1
Sequencing statistics of TT-seq samples generated in this study, related to Figure 1.
- https://cdn.elifesciences.org/articles/71533/elife-71533-supp1-v1.docx
-
Supplementary file 2
Sequencing statistics of ATAC-seq samples generated in this study, related to Figure 1.
- https://cdn.elifesciences.org/articles/71533/elife-71533-supp2-v1.docx
-
Supplementary file 3
Early and late up- and downregulated gene list, related to Figure 2.
- https://cdn.elifesciences.org/articles/71533/elife-71533-supp3-v1.xlsx
-
Supplementary file 4
List of previously published ChIP-seq datasets used in this study, related to Figure 3.
- https://cdn.elifesciences.org/articles/71533/elife-71533-supp4-v1.docx
-
Supplementary file 5
Sequencing statistics of Oct4 ChIP-seq samples generated in this study, related to Figures 4 and 7.
- https://cdn.elifesciences.org/articles/71533/elife-71533-supp5-v1.docx
-
Supplementary file 6
Sequencing statistics of Sox2 ChIP-seq samples generated in this study, related to Figures 6 and 7.
- https://cdn.elifesciences.org/articles/71533/elife-71533-supp6-v1.docx
-
Supplementary file 7
Sequencing statistics of TT-seq samples generated in Oct4 recovery experiments, related to Figure 8.
- https://cdn.elifesciences.org/articles/71533/elife-71533-supp7-v1.docx
-
Supplementary file 8
Sequencing statistics of ATAC-seq samples generated in Oct4 recovery experiments, related to Figure 8.
- https://cdn.elifesciences.org/articles/71533/elife-71533-supp8-v1.docx
-
Transparent reporting form
- https://cdn.elifesciences.org/articles/71533/elife-71533-transrepform1-v1.pdf
Download links
A two-part list of links to download the article, or parts of the article, in various formats.
Downloads (link to download the article as PDF)
Open citations (links to open the citations from this article in various online reference manager services)
Cite this article (links to download the citations from this article in formats compatible with various reference manager tools)
Oct4 differentially regulates chromatin opening and enhancer transcription in pluripotent stem cells
eLife 11:e71533.
https://doi.org/10.7554/eLife.71533


