A model of preferential pairing between epithelial and dendritic cells in thymic antigen transfer
- Laboratory of Immunobiology, Institute of Molecular Genetics of the Czech Academy of Sciences, Czech Republic
- Department of Cell Biology, Charles University, Faculty of Science, Charles University, Czech Republic
- Division of Gastroenterology, Hepatology, and Endoscopy, Department of Medicine, Brigham and Women’s Hospital, Harvard Medical School, United States
Figures
Figure 1 with 1 supplement

The phenotype and frequency of thymic epithelial cell (TEC) subsets in Cre-based mouse models of cooperative antigen transfer (CAT).
(a) Mouse models of CAT with confined expression of TdTOM to distinct TEC subsets. (b) Representative flow cytometry plots showing the frequency of TdTOM+ cells among MACS-enriched CD45–EpCAM+ cells isolated from Foxn1CreRosa26TdTOM (Foxn1Cre), CsnbCreRosa26TdTOM (CsnbCre), and Defa6iCreRosa26TdTOM (Defa6iCre) mice. (c) Quantification of TdTOM+ cells from Figure 1b (mean ± SEM, n = 7–12 mice from three independent experiments). (d) Microscopy images of thymic sections from Foxn1Cre, CsnbCre, Defa6iCre, and Cre– control mice depicting the levels of TdTOM expression and its restriction to keratin 14+ areas demarcating thymic medulla. Yellow dashed lines denote the zones that are shown in higher magnification. Scale bars and color code are provided. (e) Quantification of the absolute numbers of CD45–EpCAM+TdTOM+ cells isolated from Foxn1Cre, CsnbCre, and Defa6iCre thymi counted by flow cytometry. (f) Representative flow cytometry plots of different TEC subsets in Foxn1Cre, CsnbCre, and Defa6iCre mice. (g) Quantification of the ratios of the frequencies of TEC subsets within CD45–EpCAM+TdTOM+ cells to the frequencies of TEC subsets within CD45–EpCAM+ cells in Foxn1Cre, CsnbCre, and Defa6iCre mice (mean ± SEM, n = 7–8 mice from three independent experiments). The ratios were calculated using percentages in Figure 1—figure supplement 1c. Statistical analysis in (g) was performed using one-way ANOVA with Bonferroni´s multiple comparison test, *p≤0.05, **p≤0.01, ***p≤0.001, ****p<0.0001, ns, not significant.
-
Figure 1—source data 1
The phenotype and frequency of thymic epithelial cell (TEC) subsets in Cre-based mouse models of cooperative antigen transfer (CAT).
- https://cdn.elifesciences.org/articles/71578/elife-71578-fig1-data1-v1.xlsx
Figure 1—figure supplement 1
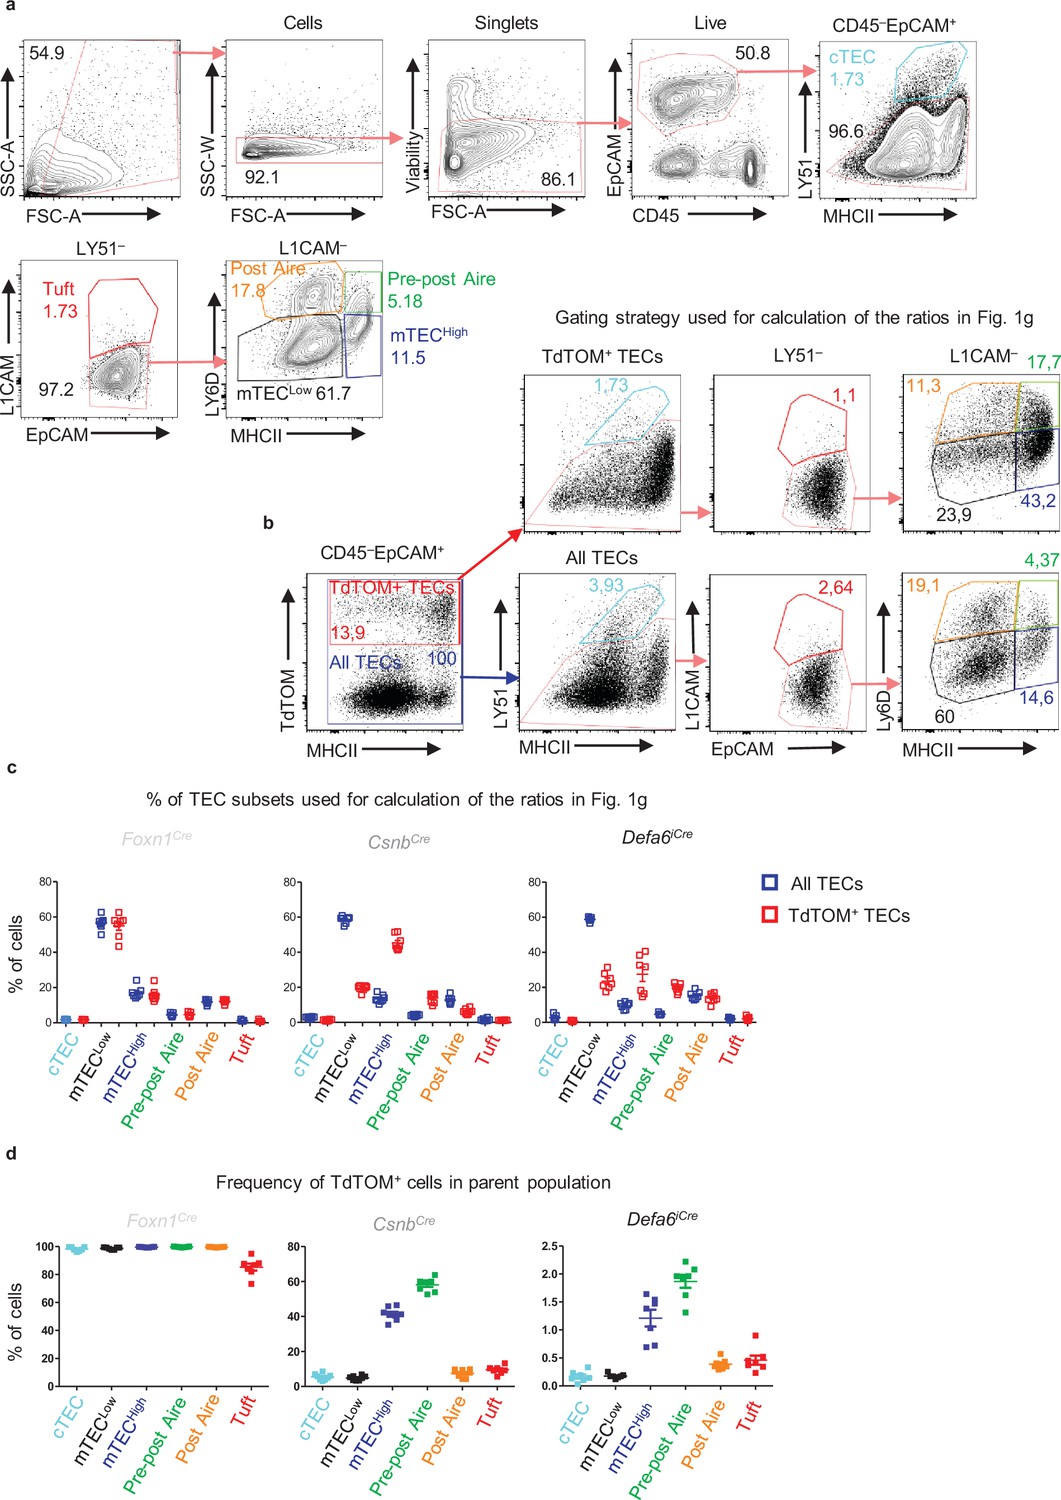
Thymic epithelial cell (TEC) populations.
(a) Complete gating strategy for the distinction of TEC populations. The thymic cell fraction was MACS-enriched for CD45– cells and sequentially gated as singlets, live, and CD45–EpCAM+ cells. The fraction of isolated TECs was then gated as cortical thymic epithelial cells (cTECs) (LY51+), Tuft medullary thymic epithelial cells (mTECs) (LY51–L1CAM+), and mTECs (LY51–L1CAM–). mTECs consists of four major populations: mTECLow (MHCIILowLY6D–), mTECHigh (MHCIIHighLY6D–), pre-post Aire mTECs (MHCIIHighLY6D+), and post-Aire mTECs (MHCIIHighLy6dHigh). (b) The gating strategy used for calculation of the ratios in Figure 1g. CD45–EpCAM+ cells were gated either as TdTOM+ (TdTOM+ TECs; red gate) or 100% of TECs was gated regardless of TdTOM expression (all TECs; blue gate) and further distinguished according to (a) (the CsnbCre model was used for representative gating panel). (c) Graphs depicting the comparison of the percentage of TEC subsets within all TECs (blue squares) and TdTOM+ TECs (red squares) (mean ± SEM, n = 7–8 mice from three independent experiments) used for the calculation of the ratios in Figure 1g. (d) Quantification of the frequencies of TdTOM+ cells among the indicated TEC subsets (mean ± SEM, n = 7–8 mice from three independent experiments).
-
Figure 1—figure supplement 1—source data 1
Thymic epithelial cell (TEC) populations.
- https://cdn.elifesciences.org/articles/71578/elife-71578-fig1-figsupp1-data1-v1.xlsx
Figure 2 with 2 supplements
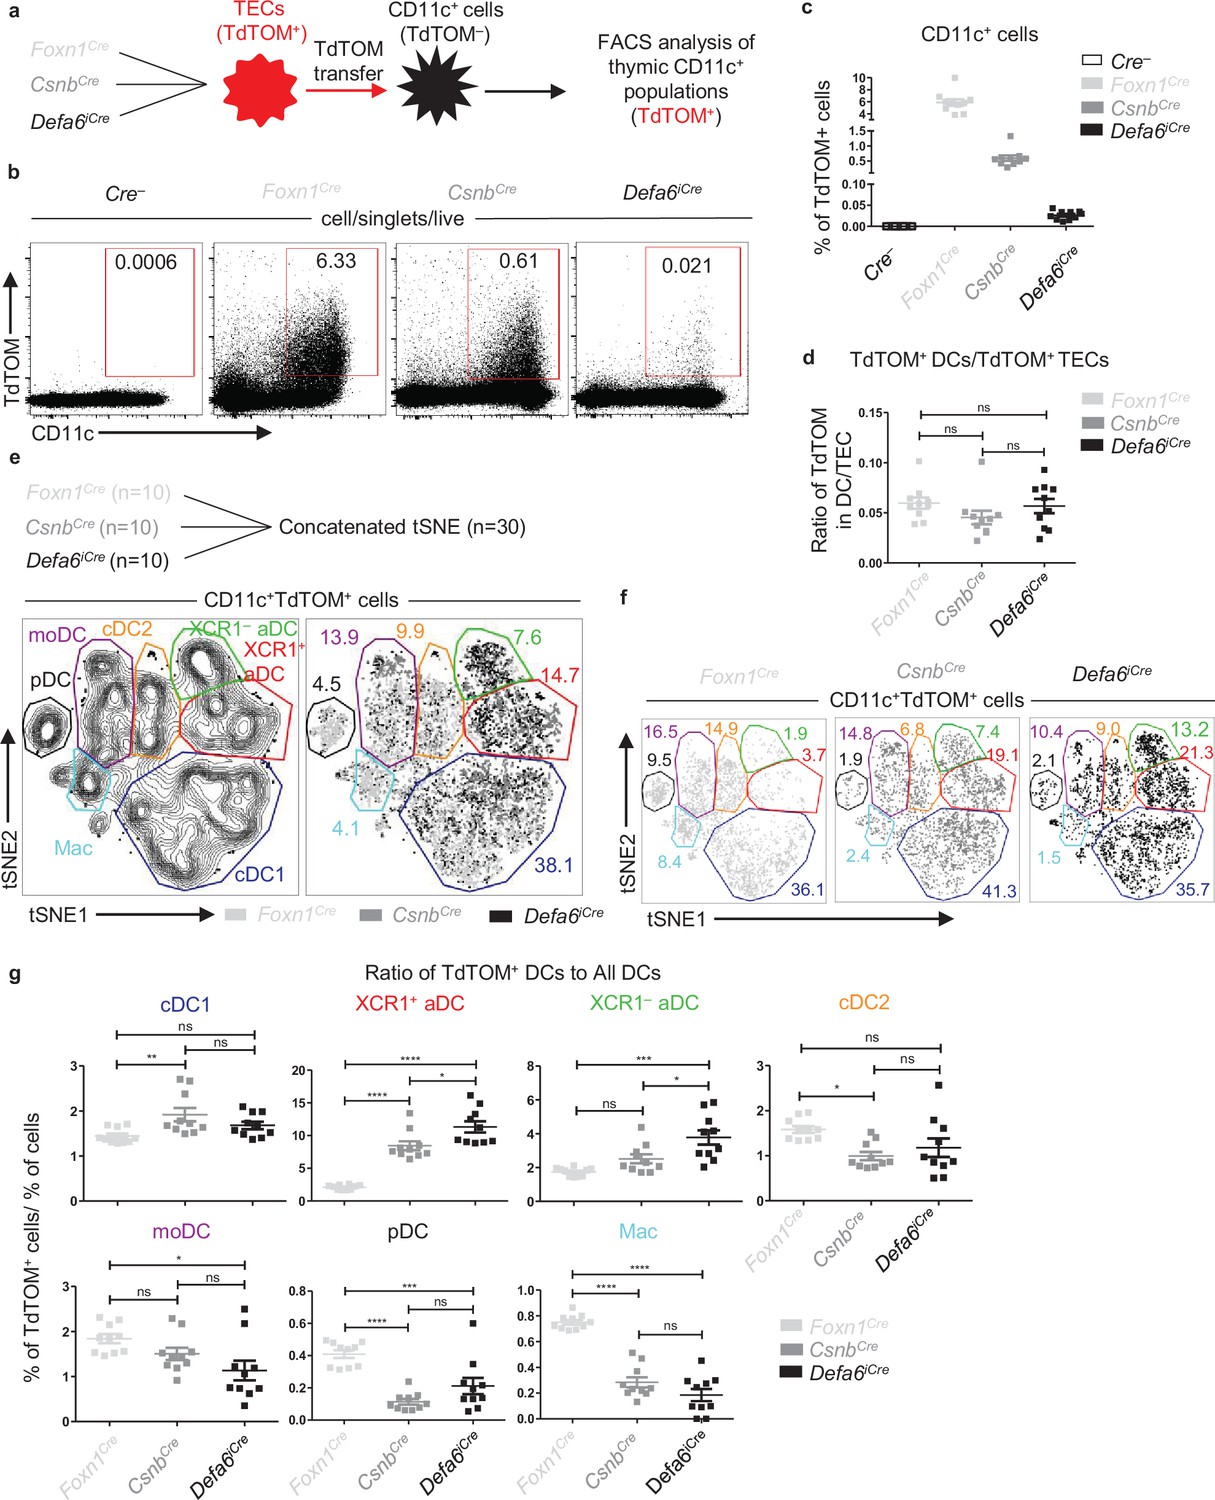
Antigen transfer of TdTOM to thymic dendritic cells (DCs).
(a) Experimental design. (b) Representative flow cytometry plots comparing the frequency of TdTOM+CD11c+ cells among MACS-enriched CD11c+ thymic cells from mouse models described in (a). (c) Quantification of TdTOM+CD11c+ cells from (b) (mean ± SEM, n = 10 mice from a minimum of three independent experiments). (d) Comparison of the ratio between the frequency of TdTOM+CD11c+ (quantified in c) to TdTOM+ thymic epithelial cell (TEC) (quantified in Figure 1c) subsets in mouse models described in (a) (mean ± SEM, n = 10 mice from a minimum of three independent experiments). (e) Concatenated (n = 30 mice) and (f) separate (n = 10 mice) flow cytometry tSNE analysis of TdTOM+CD11c+ cells from the three mouse models described in (a). (g) Quantification of the ratios of the frequencies of DC subsets within CD11c+TdTOM+ cells to the frequencies of DC subsets within CD11c+ cells in Foxn1Cre, CsnbCre, and Defa6iCre mice (mean ± SEM, n = 10 mice from a minimum of three independent experiments). The ratios were calculated using percentages in Figure 2—figure supplement 2c. CD11c+ cell subsets were distinguished as in Figure 2—figure supplement 1a. Statistical analysis in (d) and (g) was performed using one-way ANOVA with Bonferroni´s multiple comparison test, *p≤0.05, **p≤0.01, ***p≤0.001, ****p<0.0001, ns, not significant.
-
Figure 2—source data 1
Antigen transfer of TdTOM to thymic dendritic cells (DCs).
- https://cdn.elifesciences.org/articles/71578/elife-71578-fig2-data1-v1.xlsx
Figure 2—figure supplement 1
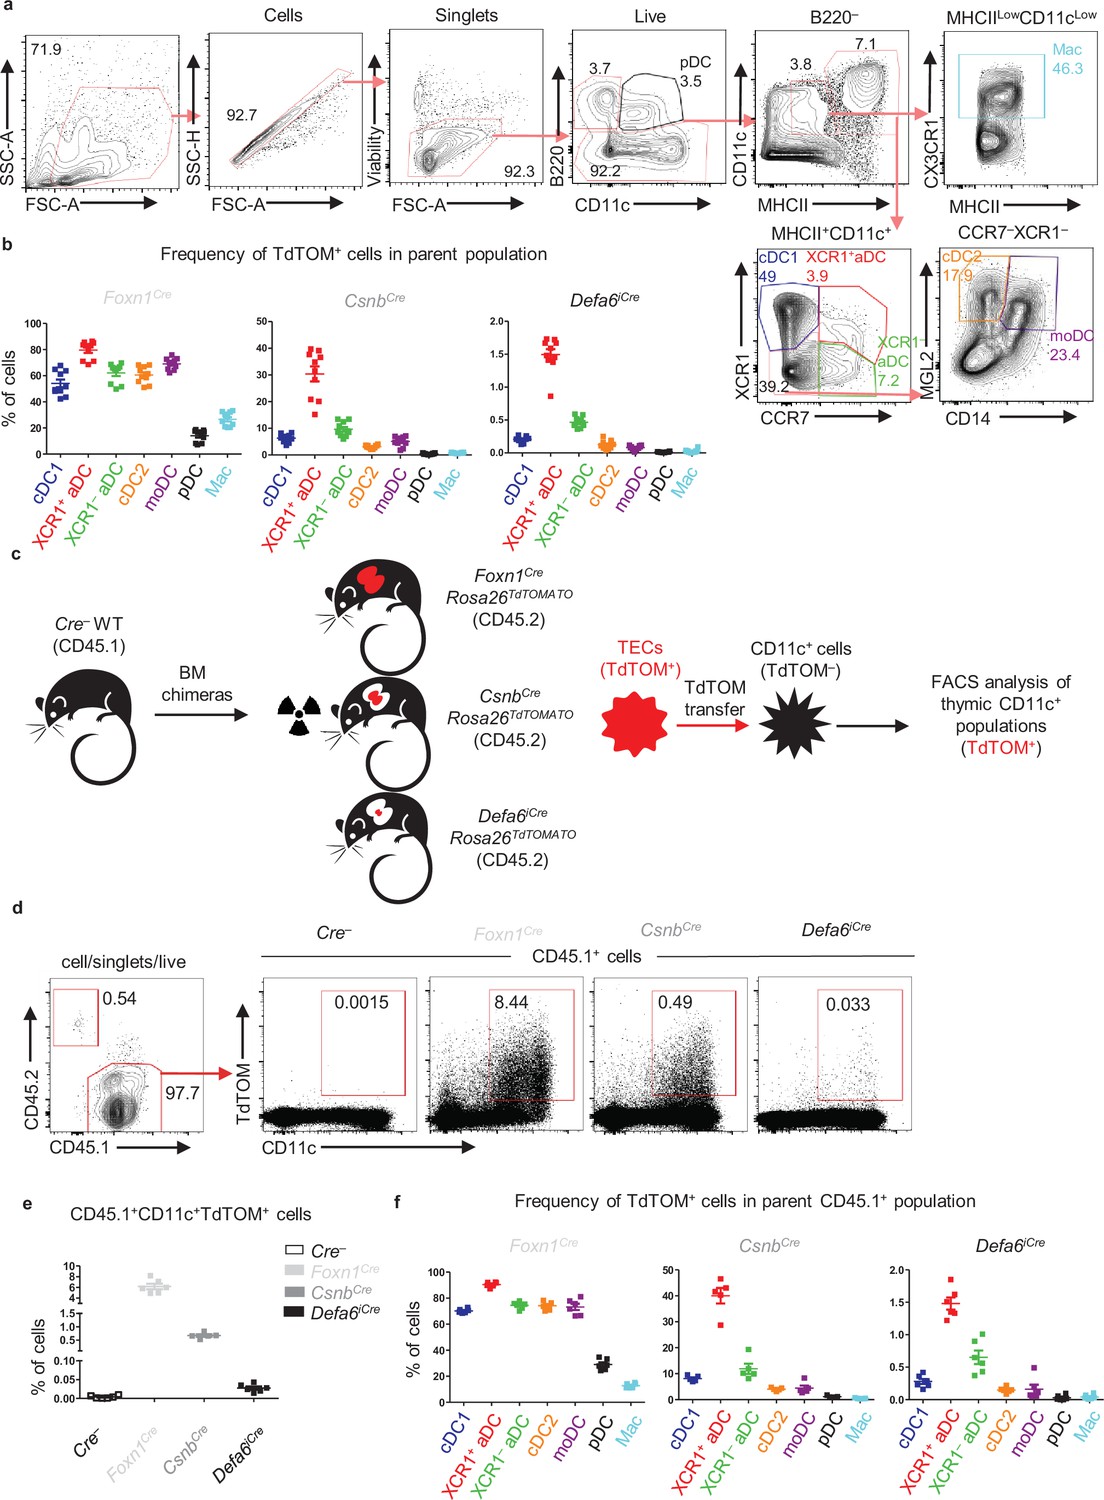
Antigen transfer of TdTOMATO to thymic dendritic cells (DCs).
(a) Complete gating strategy for the distinction of thymic DC populations. The thymic cell fraction was MACS-enriched for CD11c+ cells and sequentially gated as singlets and live cells. This cell fraction was then depleted of plasmacytoid dendritic cells (pDCs) (B220+CD11cLow) and divided into CD11c+MHCII+ and CD11cLowMHCIILow populations. CD11c+MHCII+ cells represent the major thymic DC populations: cDC1 (XCR1+CCR7–), XCR1+ aDC (XCR1+CCR7+), XCR1– aDC (XCR1–CCR7+), cDC2 (XCR1–CCR7–MGL2+CD14–), and moDC (XCR1–CCR7–MGL2+CD14+). CD11cLowMHCIILow cells contain CX3CR1+ macrophage-like population (Mac). Historically, SIRPα gating was used to distinguish cDC1 from cDC2 subsets. Since XCR1 and CCR7 gating enabled us to distinguish several subsets of thymic DCs, we omitted SIRPα from our gating strategy. (b) Quantification of the frequencies of TdTOM+ cells among the indicated DC subsets (mean ± SEM, n = 10 from a minimum of three independent experiments). (c) Experimental design. (d) Representative flow cytometry plots comparing the frequency of CD45.1+TdTOM+CD11c+ cells among MACS-enriched CD11c+ thymic cells from the mouse models described in (c). (e) Quantification of CD45.1+TdTOM+CD11c+ cells from (d) (mean ± SEM, n = 5–6 mice from two independent experiments). (f) Quantification of the frequency of TdTOM+ cells among the indicated DC subsets from mice described in (c) (mean ± SEM, n = 5–6 mice from two independent experiments).
-
Figure 2—figure supplement 1—source data 1
Antigen transfer of TdTOMATO to thymic dendritic cells (DCs).
- https://cdn.elifesciences.org/articles/71578/elife-71578-fig2-figsupp1-data1-v1.xlsx
Figure 2—figure supplement 2

Thymic dendritic cell gating strategy defined by flow cytometry tSNE analysis.
(a) Heat map generated from flow cytometry tSNE analysis of TdTOM+CD11c+ cell populations from Figure 2e. tSNE analysis was performed using FlowJo software, based on FSC-A, SSC-A, TdTOMATO, CD11c, MHCII, B220, XCR1, CCR7, CX3CR1, MGL2, and CD14. (b) Back-gating of TdTOM+CD11c+ populations defined in (a), onto the CD11c+ gating strategy described in Figure 2—figure supplement 1a. (c) Comparison of the percentage of DC subsets within all DCs (blue squares) and TdTOM+ DCs (red squares) (mean ± SEM, n = 10 mice from a minimum of three independent experiments) calculated analogically as in Figure 1—figure supplement 1c. DC subsets were gated as in Figure 2—figure supplement 1a. The data were used for calculation of the ratios in Figure 2g.
-
Figure 2—figure supplement 2—source data 1
Thymic dendritic cell gating strategy defined by flow cytometry tSNE analysis.
- https://cdn.elifesciences.org/articles/71578/elife-71578-fig2-figsupp2-data1-v1.xlsx
Figure 3
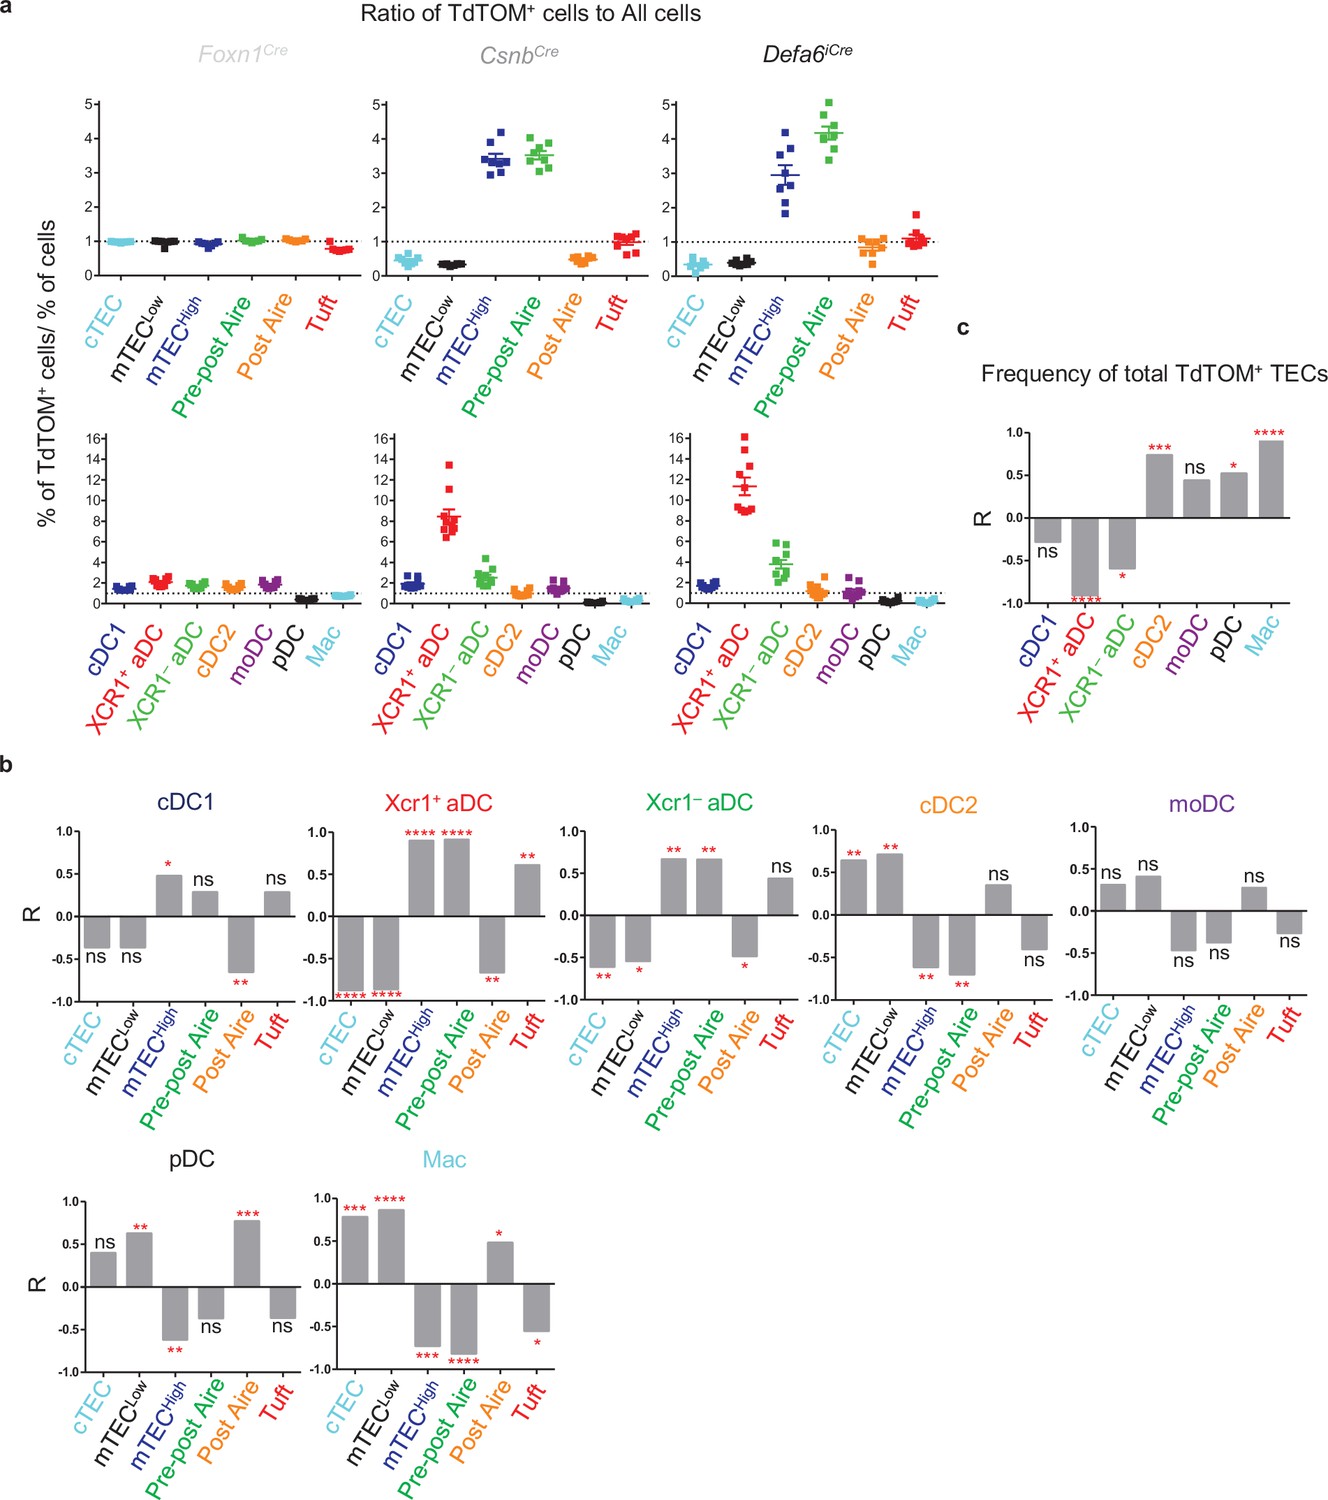
TdTOM antigen transfer to distinct thymic dendritic cell (DC) subsets correlates with its confined expression in phenotypically defined subsets of thymic epithelial cells (TECs).
(a) Visualization of the ratios of TEC and DC subsets from Figure 1g (top) and Figure 2g (bottom), respectively, compared within Foxn1Cre, CsnbCre, and Defa6iCre models. Ratio = 1 is indicated by dotted line. (b) Bar graphs showing linear regression (R) between the ratios of TdTOM+ TECs and the indicated subset of TdTOM+ DCs from Figures 1g and 2g (n = 5–8 mice, from a minimum of three independent experiments). (c) Bar graph showing the R values between the ratio of TdTOM+ DCs from Figure 2g and the ratio of the frequency of TdTOM+ TECs (Figure 1c) to the frequency of all TECs (n = 8–10 mice from a minimum of three independent experiments). Statistical analysis in (b) and (c) was performed using a Pearson’s product-moment correlation, *p≤0.05, **p≤0.01, ***p≤0.001, ****p<0.0001, ns, not significant.
-
Figure 3—source data 1
TdTOM antigen transfer to distinct thymic dendritic cell (DC) subsets correlates with its confined expression in phenotypically defined subsets of thymic epithelial cells (TECs).
- https://cdn.elifesciences.org/articles/71578/elife-71578-fig3-data1-v1.xlsx
Figure 4 with 1 supplement
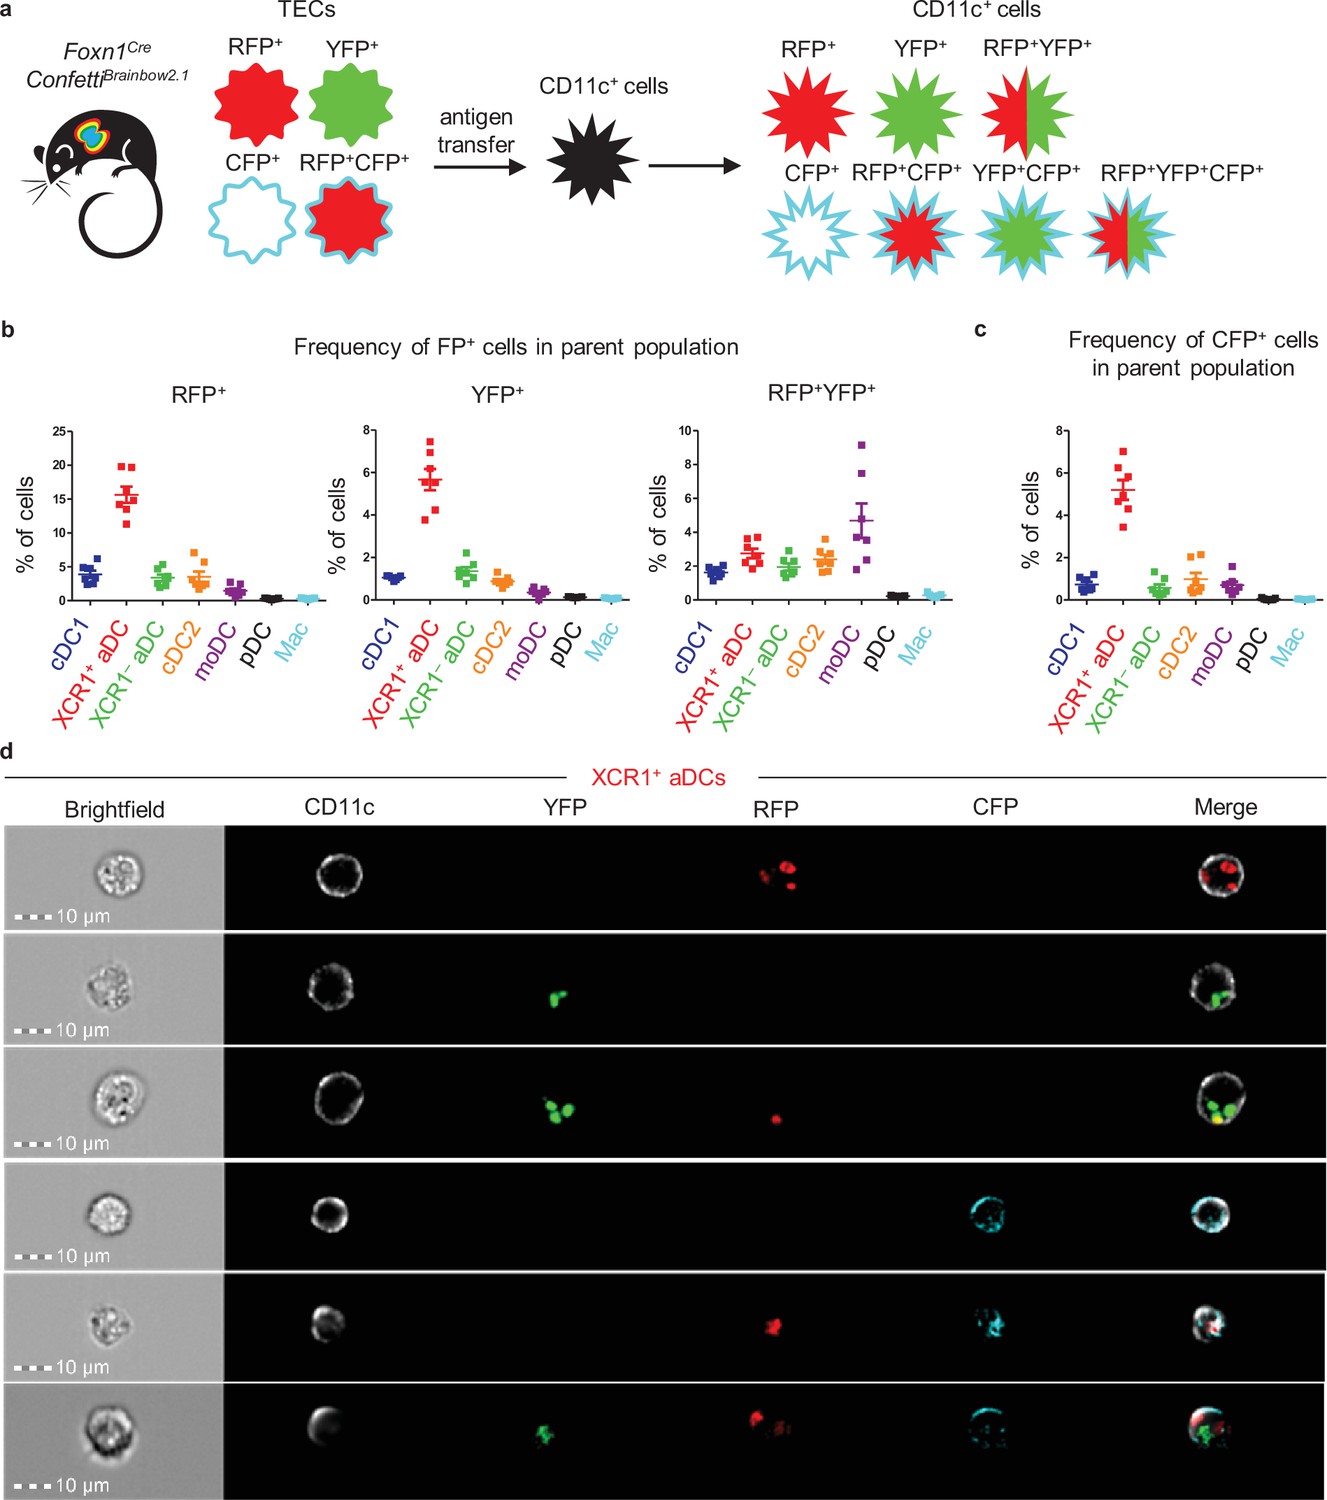
Thymic monocyte-derived dendritic cells (moDCs) efficiently acquire antigens from two or more thymic epithelial cell (TECs) in the Foxn1CreConfettiBrainbow2.1 mouse model.
(a) Experimental design. (b) Quantification of the frequency of fluorescent protein+ (FP+) cells among the indicated dendritic cell (DC) subsets (mean ± SEM, n = 7 mice from three independent experiments). (c) Quantification of the frequency of CFP+ cells among the indicated DC subsets (mean ± SEM, n = 7 mice from three independent experiments). (d) Representative images from ImageStream analysis showing the localization of transferred FP in XCR1+ activated dendritic cell (aDC) from the thymus of Foxn1CreConfettiBrainbow2.1 (n = 2 independent experiments).
-
Figure 4—source data 1
Thymic monocyte-derived dendritic cells (moDCs) efficiently acquire antigens from two or more thymic epithelial cell (TECs) cells in the Foxn1CreConfettiBrainbow2.1 mouse model.
- https://cdn.elifesciences.org/articles/71578/elife-71578-fig4-data1-v1.xlsx
Figure 4—figure supplement 1
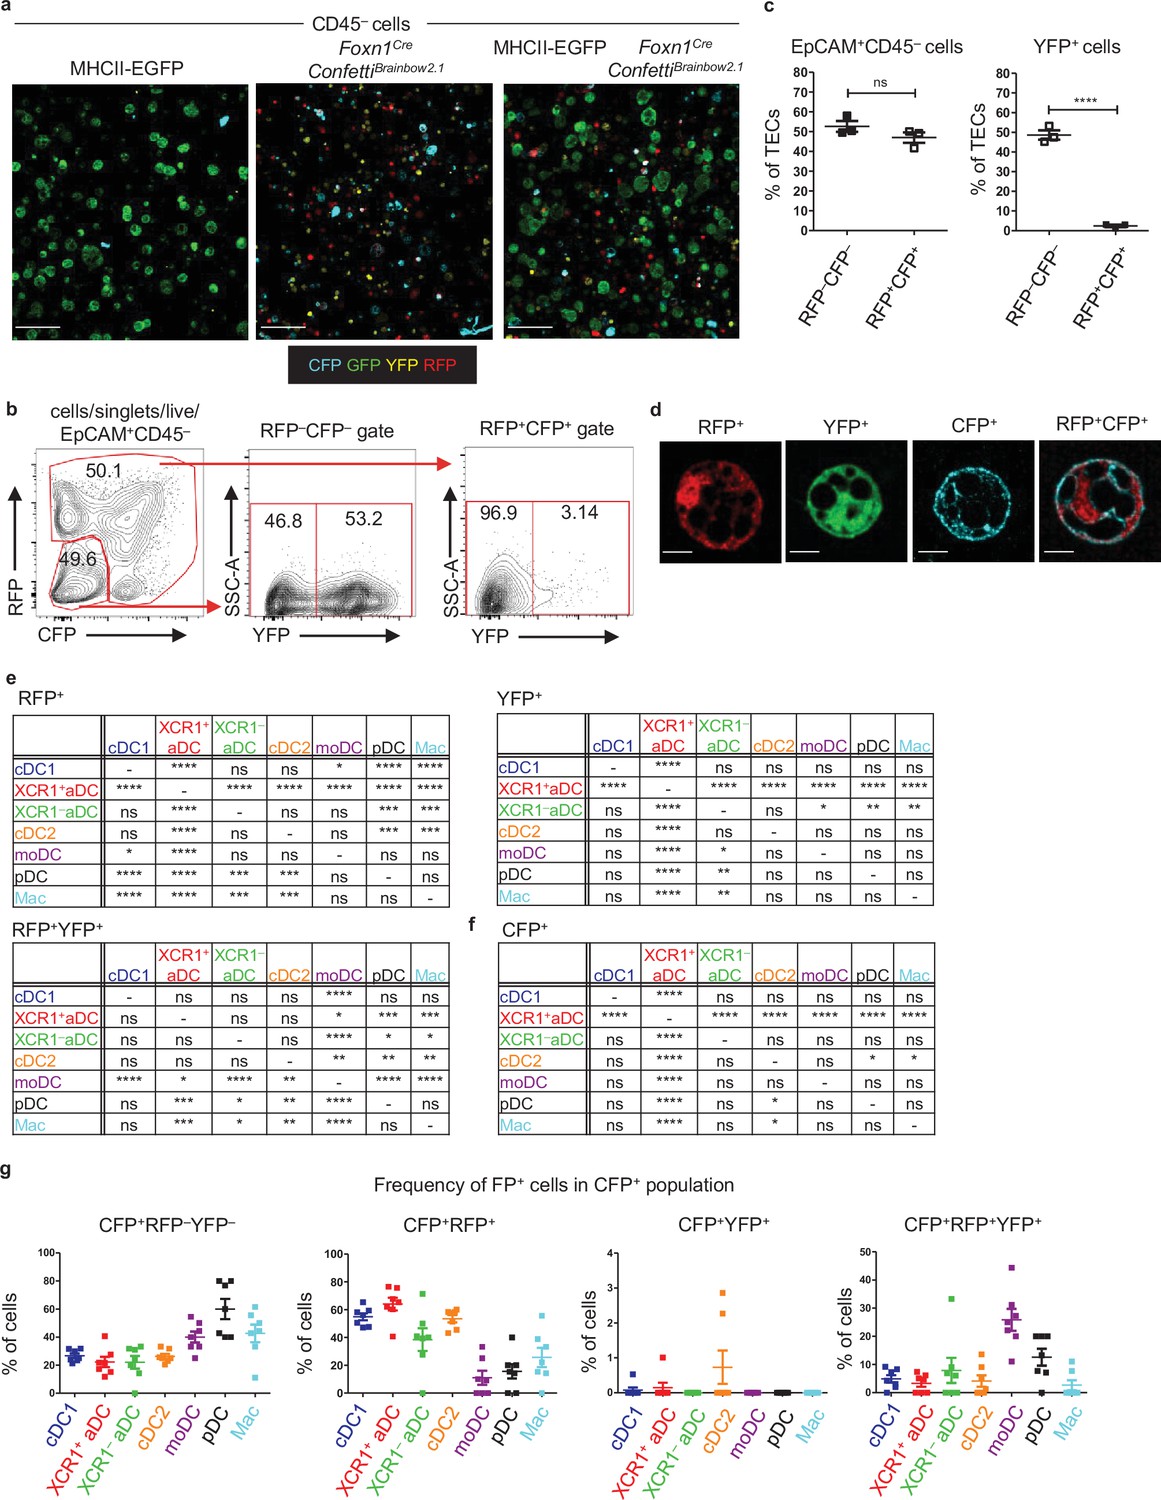
Foxn1CreConfettiBrainbow2.1 as a model of thymic cooperative antigen transfer.
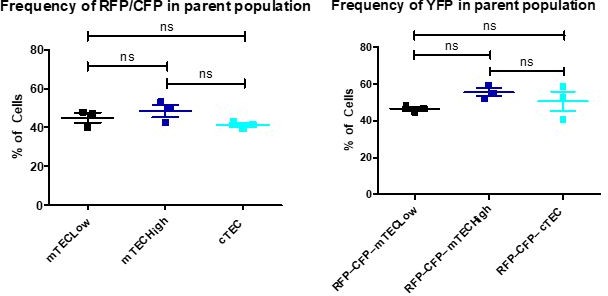
(a) Representative microscopic images of sorted thymic epithelial cells (TECs) from MHCII-EGFP (left panel), Foxn1CreConfettiBrainbow2.1 (middle panel), and a mixed population of TECs isolated from both MHCII-EGFP and Foxn1CreConfettiBrainbow2.1 (right panels) mouse models. (b) Representative flow cytometry plots showing the frequency of YFP, RFP, and CFP+ CD45–EpCAM+ TECs. (c) Quantification of FP+ cells from (b) (mean ± SEM, n = 3 mice from two independent experiments). (d) Representative microscopic images of all TEC variants from the model described in Figure 5a. (e), (f) Statistical analysis of the frequency of FP+ cells among the indicated dendritic cell (DC) subsets from Figure 4b and c (n = 7 mice from three independent experiments). Analysis was performed using repeated-measures ANOVA with Bonferroni´s multiple comparison test, *p≤0.05, **p≤0.01, ***p≤0.001, ****p<0.0001, ns, not significant. (g) Quantification of the frequency of FP+ cells among the CFP+ DC subsets (mean ± SEM, n = 7 from three independent experiments).
-
Figure 4—figure supplement 1—source data 1
Foxn1CreConfettiBrainbow2.1 as a model of thymic cooperative antigen transfer.
- https://cdn.elifesciences.org/articles/71578/elife-71578-fig4-figsupp1-data1-v1.xlsx
Figure 5 with 1 supplement

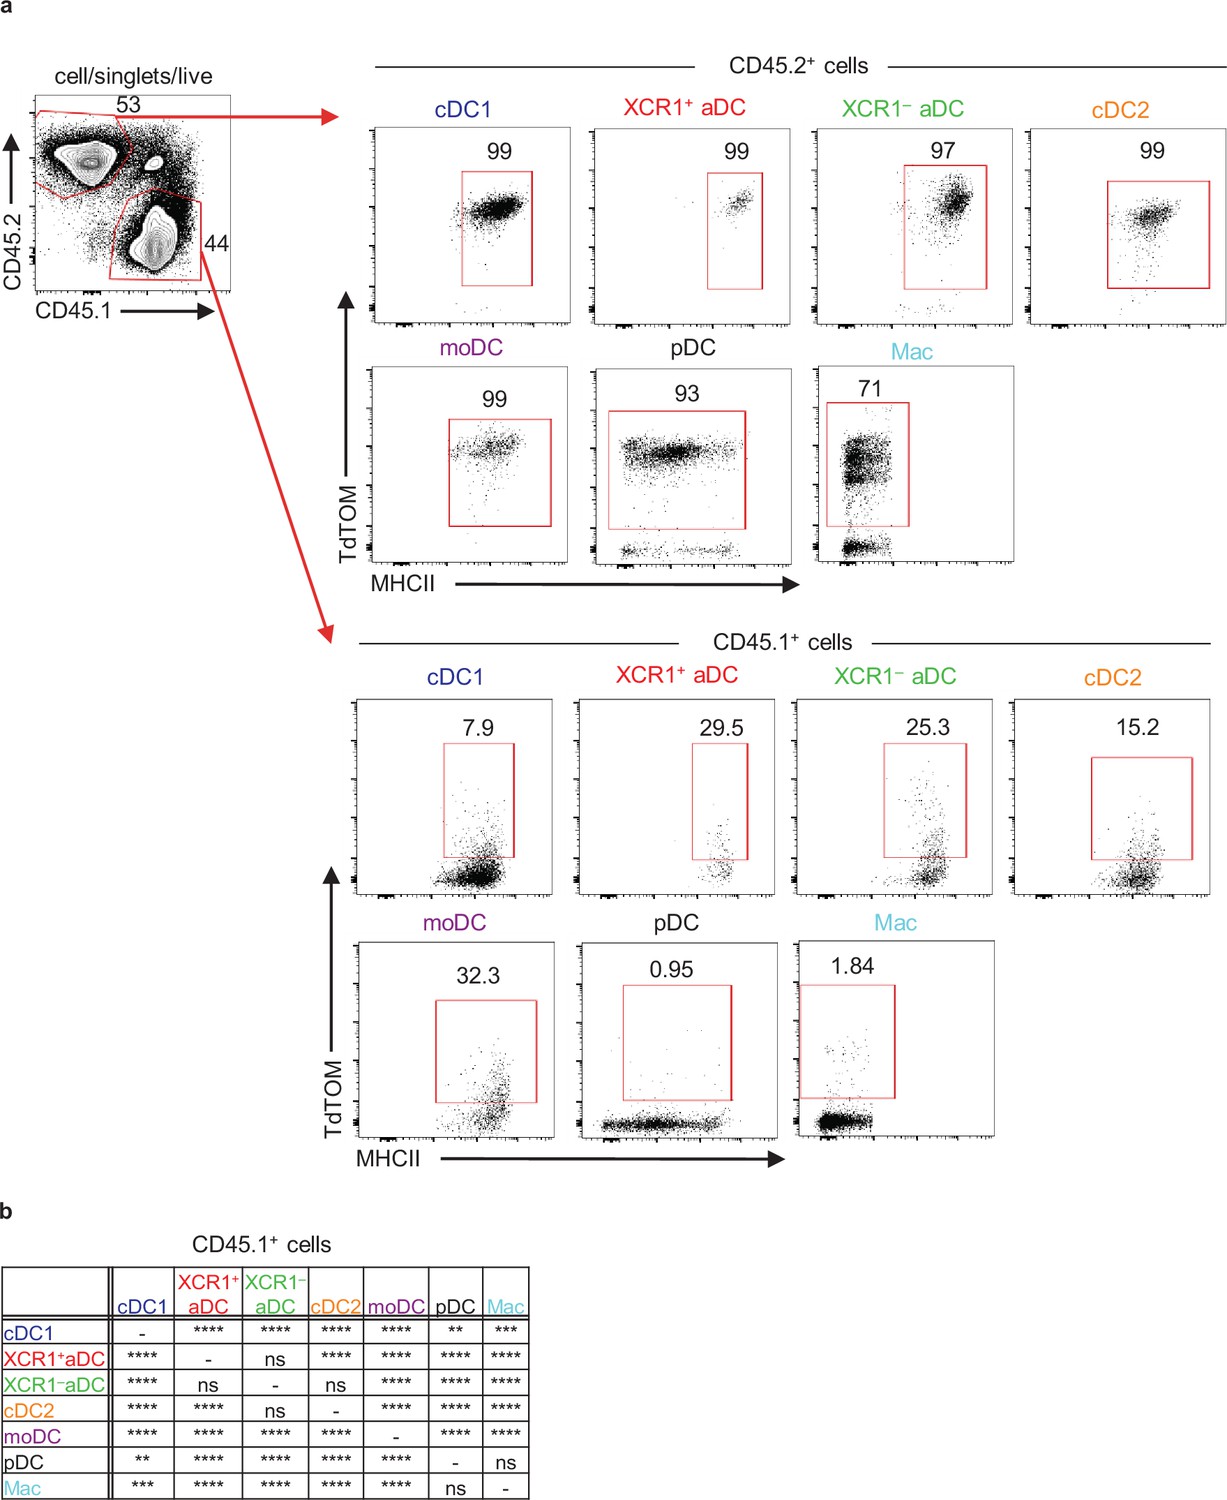
Thymic CD11c+ cells can share their antigens between each other.
(a) Experimental design. (b) Representative flow cytometry plots showing the frequency of the transfer of TdTOM into CD45.1+CD11c+ cells among MACS-enriched CD11c+ thymic cells from mixed bone marrow chimeras (50:50) of WT (CD45.1+) and Cd11cCreRosa26TdTOMATO (CD45.2+) mice. Mixed bone marrow chimeras (50:50) of WT (CD45.1+) and Rosa26TdTOMATO (negative control; CD45.2+) mice were used as a negative control to TdTOM acquisition. (c) Quantification of CD45.1+TdTOM+CD11c+ cells from (b) (mean ± SEM, n = 11 mice from two independent experiments). Statistical analysis was performed using unpaired, two-tailed Student’s t-test, ***p≤0.001. (d) Quantification of the frequency of TdTOM+ cells among the indicated dendritic cell (DC) subsets from reconstituted mice described in (a) (mean ± SEM, n = 11 mice from two independent experiments).
-
Figure 5—source data 1
Thymic CD11c+ cells can share their antigens between each other.
- https://cdn.elifesciences.org/articles/71578/elife-71578-fig5-data1-v1.xlsx
Figure 5—figure supplement 1
Thymic CD11c+ cells can share their antigens between each other.
(a) Representative flow cytometry plots showing gating and frequency of CD11c+TdTOM+ cells from mixed bone marrow chimera of WT (CD45.1+, lower panel) and Cd11cCreRosa26TdTOMATO (CD45.2+, upper panel) mice. (b) Statistical analysis of the frequency of TdTOM+ cells among the indicated dendritic cell (DC) subsets from Figure 5d (n = 11 mice from two independent experiments). Analysis was performed using repeated-measures ANOVA with Bonferroni’s multiple comparison test, *p≤0.05, **p≤0.01, ***p≤0.001, ****p<0.0001, ns, not significant.
Figure 6

Proposed model of preferential pairing in cooperative antigen transfer (CAT).
(a) Based on the data presented in this study, we postulate that phenotypically defined subsets of thymic CD11c+ cells preferentially and predictably acquire antigens from distinct subsets of developmentally related thymic epithelial cells (TECs) (left panel). Our data also suggests that thymic monocyte-derived dendritic cell (moDC), which represented the only CD11c+ subset that does not specifically prefer any particular subset of TECs (Figure 3b), excels in the acquisition of antigens from multiple TECs or other CD11c+ cells compared to both subsets of activated dendritic cell (aDC), cDC2, and cDC1, which also perform such modes of CAT, however, to a significantly lesser extent (right panel). Note that the size of the antigen acceptor’s images reflects the strength of their correlation with particular TEC subset (left panel) or their potency in defined modes of CAT (right panel).
Author response image 1

Author response image 2
Additional files
-
Supplementary file 1
List of antibodies.
- https://cdn.elifesciences.org/articles/71578/elife-71578-supp1-v1.xlsx
-
Transparent reporting form
- https://cdn.elifesciences.org/articles/71578/elife-71578-transrepform1-v1.pdf
Download links
A two-part list of links to download the article, or parts of the article, in various formats.
Downloads (link to download the article as PDF)
Open citations (links to open the citations from this article in various online reference manager services)
Cite this article (links to download the citations from this article in formats compatible with various reference manager tools)
A model of preferential pairing between epithelial and dendritic cells in thymic antigen transfer
eLife 11:e71578.
https://doi.org/10.7554/eLife.71578


