SLC1A5 provides glutamine and asparagine necessary for bone development in mice
- Department of Orthopaedic Surgery, Duke University School of Medicine, United States
- Department of Internal Medicine, University of Texas Southwestern Medical Center, United States
- Sarah W. Stedman Nutrition and Metabolism Center & Duke Molecular Physiology Institute, Duke University Medical Center, United States
- Department of Medicine, Duke University School of Medicine, United States
- Charles and Jane Pak Center for Mineral Metabolism and Clinical Research. University of Texas Southwestern Medical Center at Dallas, United States
Figures
Figure 1 with 2 supplements
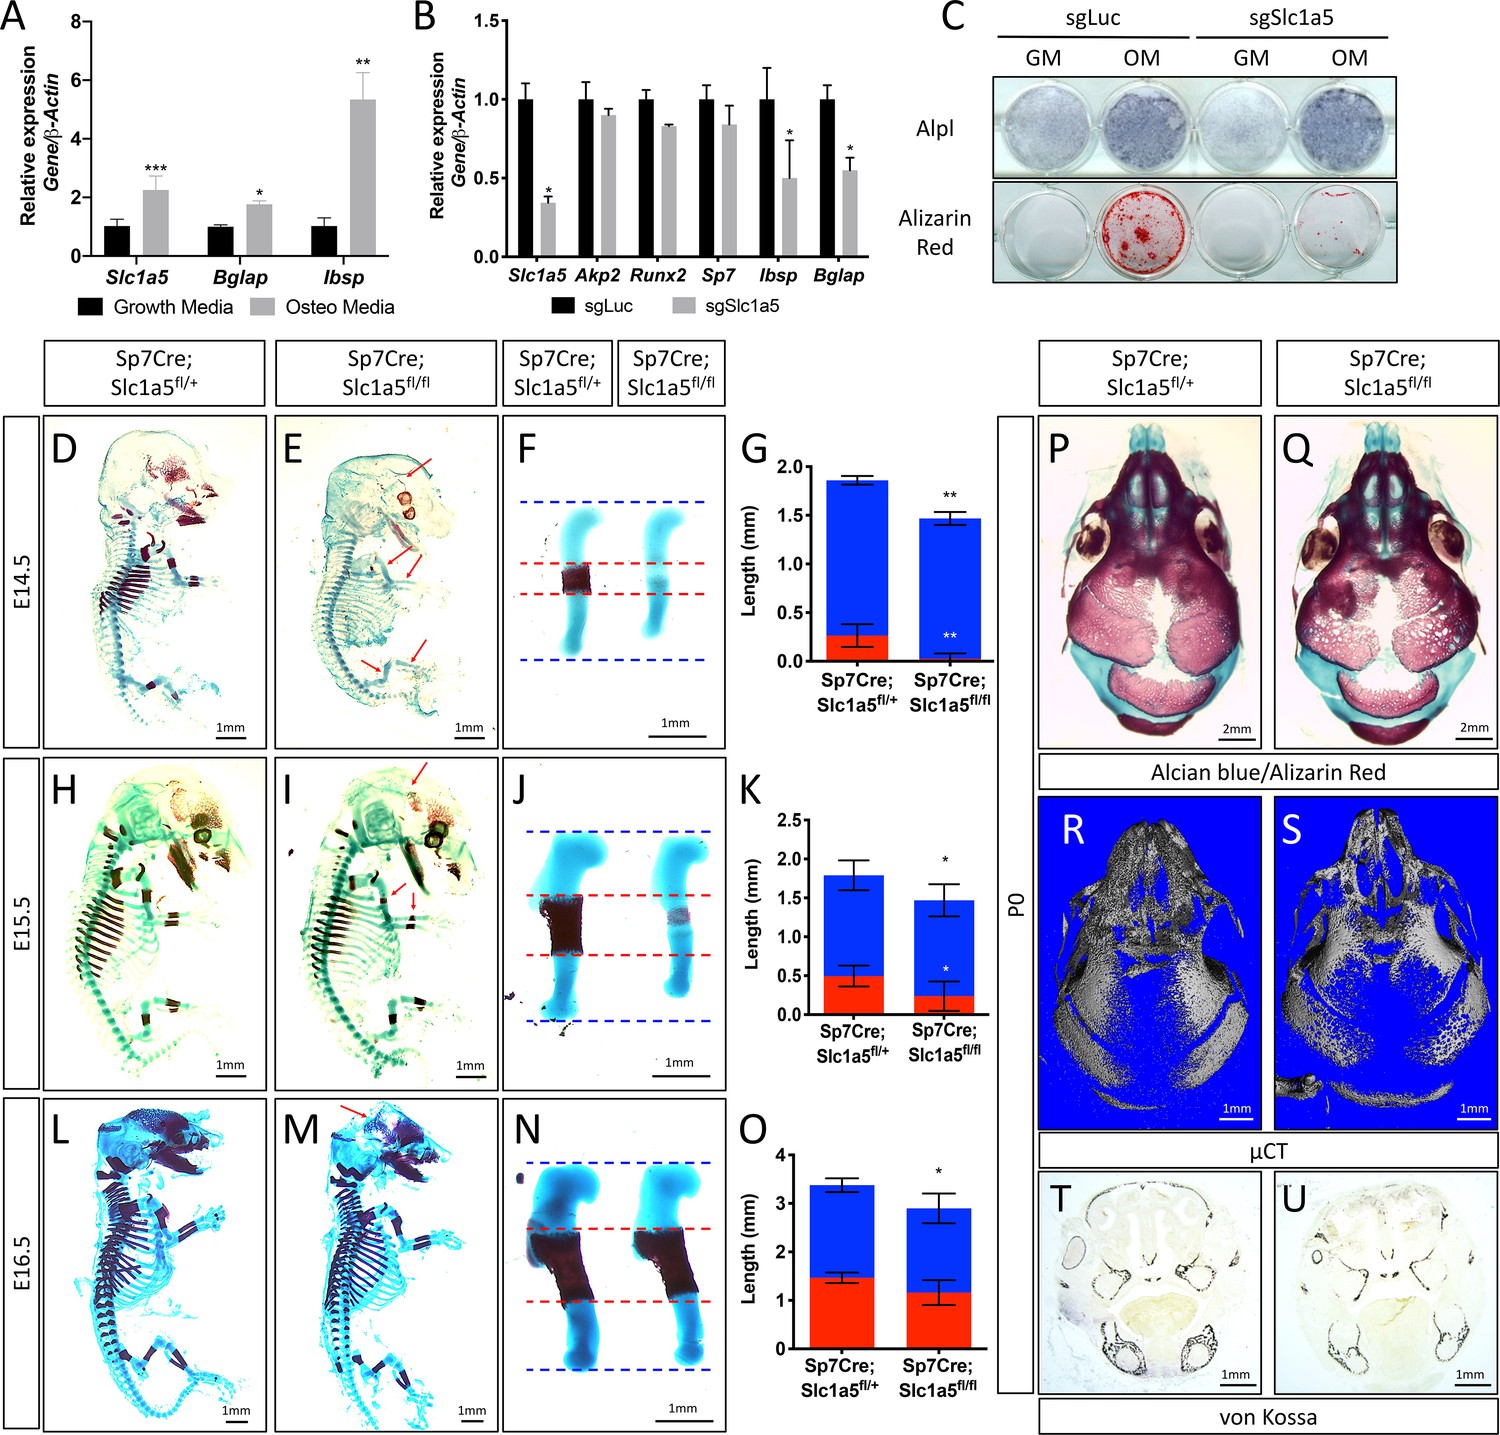
Slc1a5 is required for bone development in mice.
(A) qRT-PCR analyses of gene expression in calvarial osteoblasts (cOB) cultured for 7 days in growth or osteogenic media. (B–C) qRT-PCR analyses (B) or functional assays (C) of the effect of Slc1a5 deletion on osteoblast differentiation in cOB cultured for 7 days in osteogenic media. (D–O) Skeletal preparations of Sp7Cre;Slc1a5fl/+ and Sp7Cre;Slc1a5fl/fl mice at E14.5 (n = 5), E15.5 (N = 8) and E16.5 (N = 5). Arrows denote reduced mineralization. Isolated humeri shown in (F), (J) and (N). Blue dotted lines denotes the control overall humerus length. Red dotted lines denote control mineralized area. Images quantified in (G, K and O). (P–S) A representative skeletal preparation (P–Q) or (R–S) Representative Micro-computed tomography (μCT) (N = 6) used to quantify BV/TV(%) and (T–U) von Kossa staining on Sp7Cre;Slc1a5fl/+ and Sp7Cre;Slc1a5fl/fl (N = 4) knockout mice at P0. Error bars depict SD. * p ≤ 0.05, ** p ≤ 0.005, *** p ≤ 0.0005, **** p ≤ 0.00005, by an unpaired two-tailed Student’s t-test.
-
Figure 1—source data 1
Contains numerical source data for Figure 1.
- https://cdn.elifesciences.org/articles/71595/elife-71595-fig1-data1-v2.zip
Figure 1—figure supplement 1
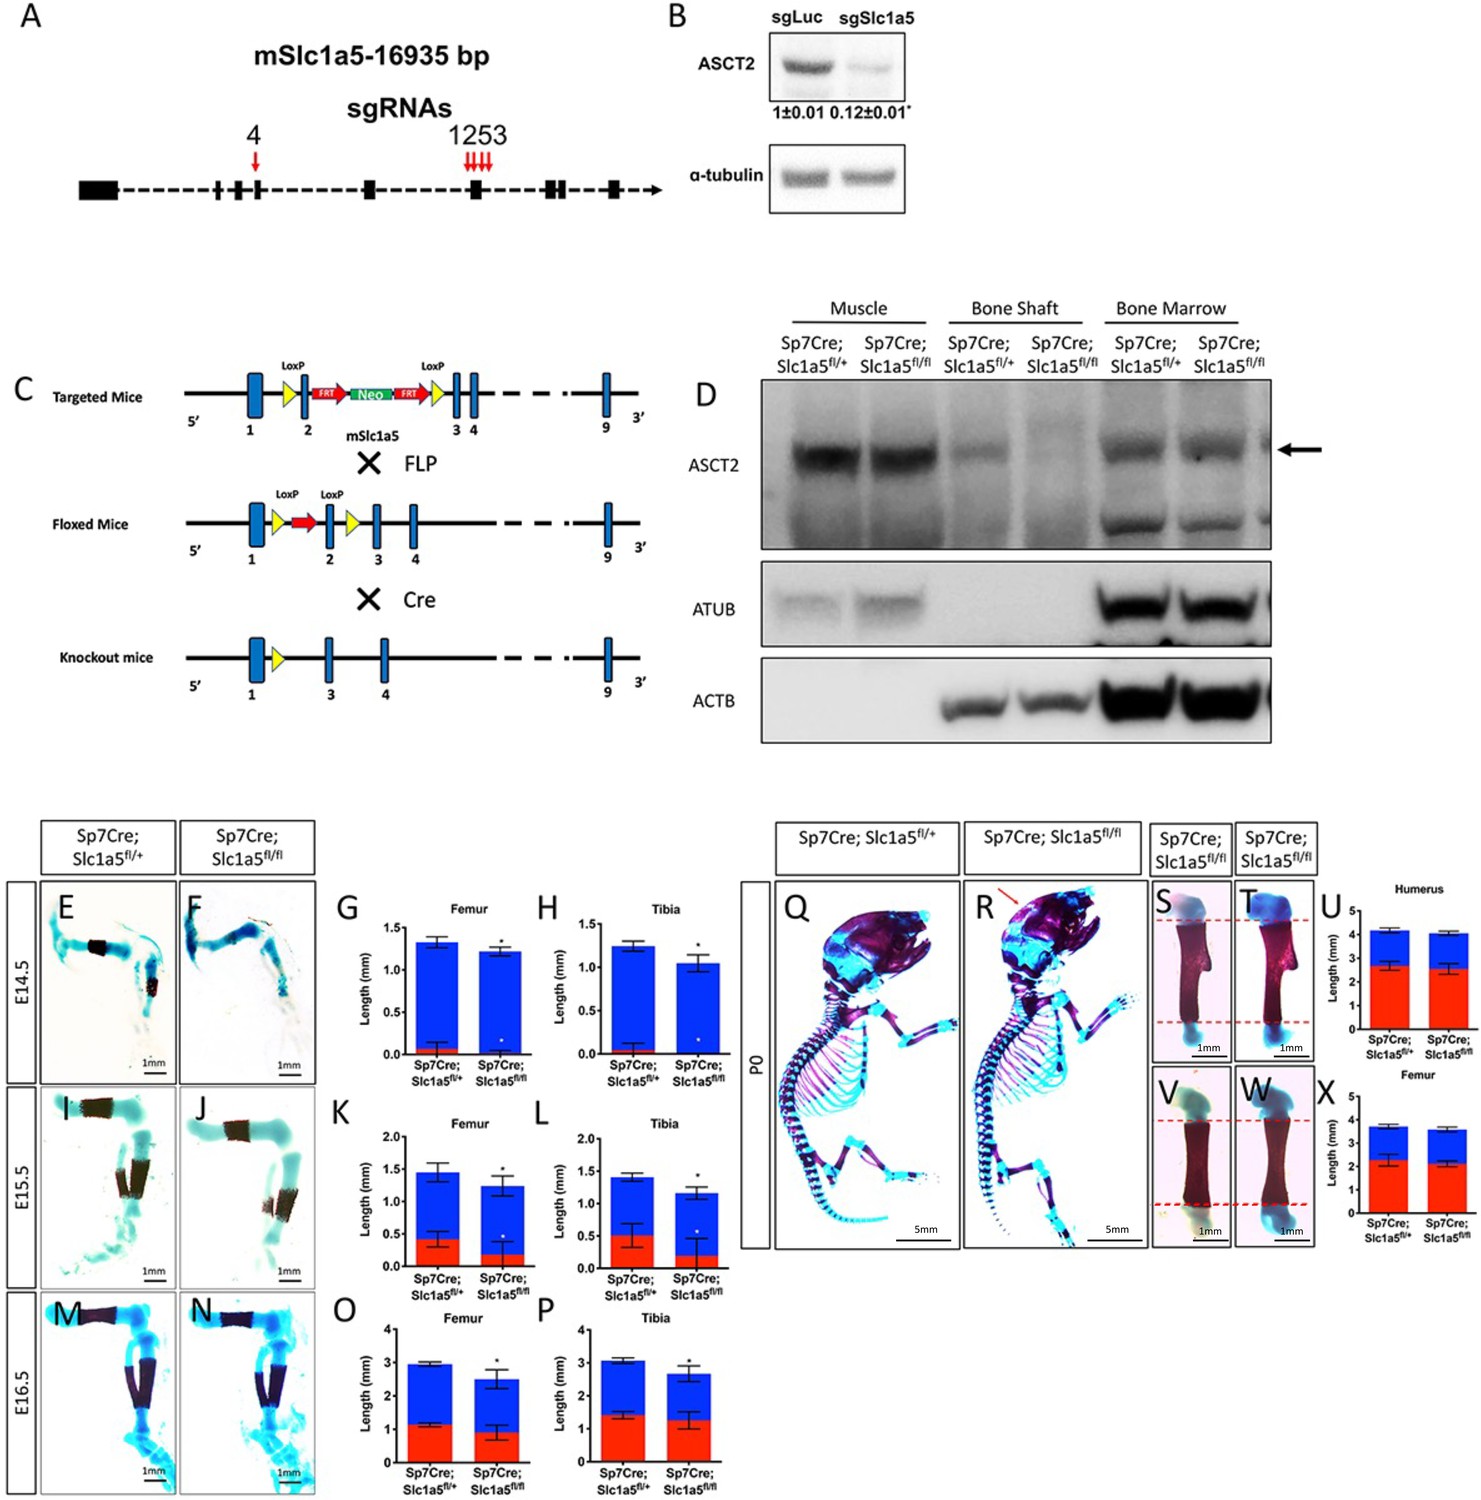
Slc1a5 ablation decreases bone development.
(A) Slc1a5 Crispr targeting strategy(B) Western Blot analyses of the effect of Slc1a5 targeting ASCT2 normalized to α-tubulin. sgRNAs targeting luciferase and mCherry were used as a negative control. Fold change± SD for sgSlc1a5 over sgLuc in three independent experiments. * p ≤ 0.05 by an unpaired two-tailed Student’s t-test. (C) Slc1a5fl targeting strategy. (D) Western Blot analyses of SLC1A5 (ASCT2) expression in protein isolated from Muscle, Bone and Bone marrow from Sp7Cre;Slc1a5fl/+ and Sp7Cre;Slc1a5fl/fl mice. (E–X) Skeletal preparations of Sp7Cre;Slc1a5fl/+ and Sp7Cre;Slc1a5fl/fl hindlimbs at E14.5 (n = 5), E15.5 (N = 8), E16.5 (N = 5) and (p0). Images quantified in (G, H, K,L,O, P,U and X).
-
Figure 1—figure supplement 1—source data 1
Contains numerical and uncropped western blot source data for Figure 1—figure supplement 1.
- https://cdn.elifesciences.org/articles/71595/elife-71595-fig1-figsupp1-data1-v2.zip
Figure 1—figure supplement 2
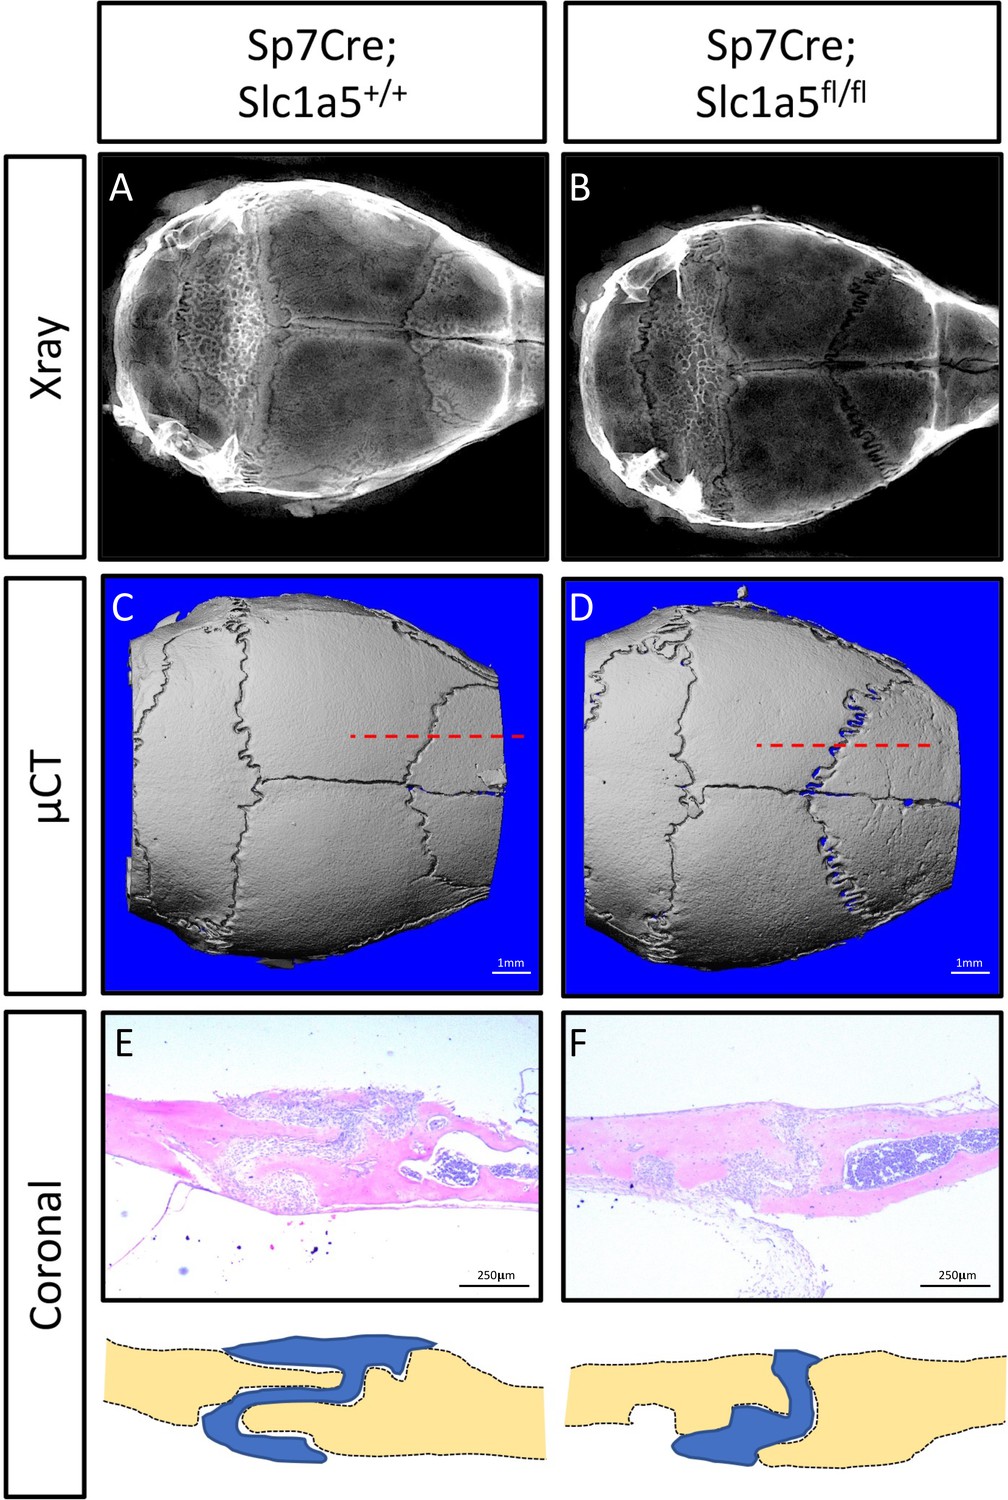
Skull phenotype at 2 months of age in Sp7Cre;Slc1a5fl/fl mice.
(A–B) Representative X-Ray, (C–D) µCT image of a whole calvarium from 2-month-old Sp7Cre;Slc1a5fl/+ or Sp7Cre;Slc1a5fl/fl littermates.
(E–F) H&E staining and cartoon depiction of section through the coronal suture (level of section indicated by the dotted red line in (C,D)) showing altered suture morphology.
Figure 2 with 2 supplements
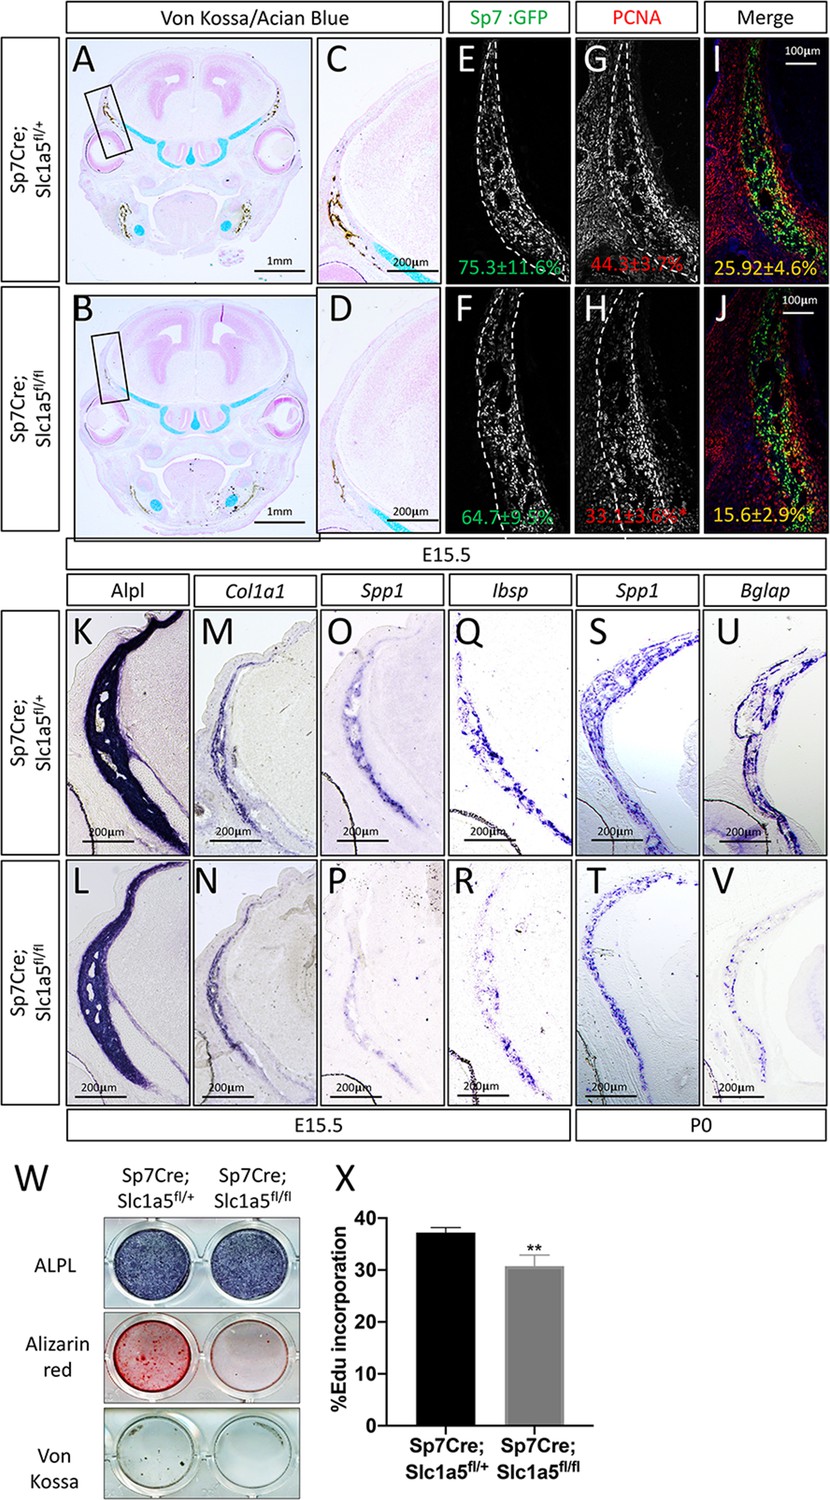
Slc1a5 is necessary for osteoblast proliferation and differentiation.
(A–D) von Kossa/Alcian blue staining on Sp7Cre;Slc1a5fl/+ (A,C) and Sp7Cre;Slc1a5fl/fl (B,D) (N = 4) at E15.5. (E–J) Representative immunofluorescent staining for Proliferating Cell Nuclear Antigen (PCNA) used to quantify proliferation. Endogenous GFP from Sp7GFP shown in (G–H) used to quantify PCNA/GFP double positive cells. The numbers in each panel represent the percent GFP, PCNA or double positive cells per GFP positive bone area (dotted line). (K–V) Representative alkaline phosphatase (ALPL) staining (K–L) or In situ hybridization (M–V) for Col1a1, Spp1, Ibsp at E15.5 (N = 4) and Spp1, Bglap at P0 (N = 3). (W) Functional assays of osteoblast differentiation in cOB isolated from Sp7Cre;Slc1a5fl/+ and Sp7Cre;Slc1a5fl/fl mice. cultured for 14 days in osteogenic media. (X) Graphical depiction of EdU incorporation in cOB cells isolated from Sp7Cre;Slc1a5fl/+ and Sp7Cre;Slc1a5fl/fl mice. Error bars depict SD. * p ≤ 0.05, ** p ≤ 0.005. by an unpaired two-tailed Student’s t-test.
-
Figure 2—source data 1
Contains numerical source data for Figure 2.
- https://cdn.elifesciences.org/articles/71595/elife-71595-fig2-data1-v2.zip
Figure 2—figure supplement 1
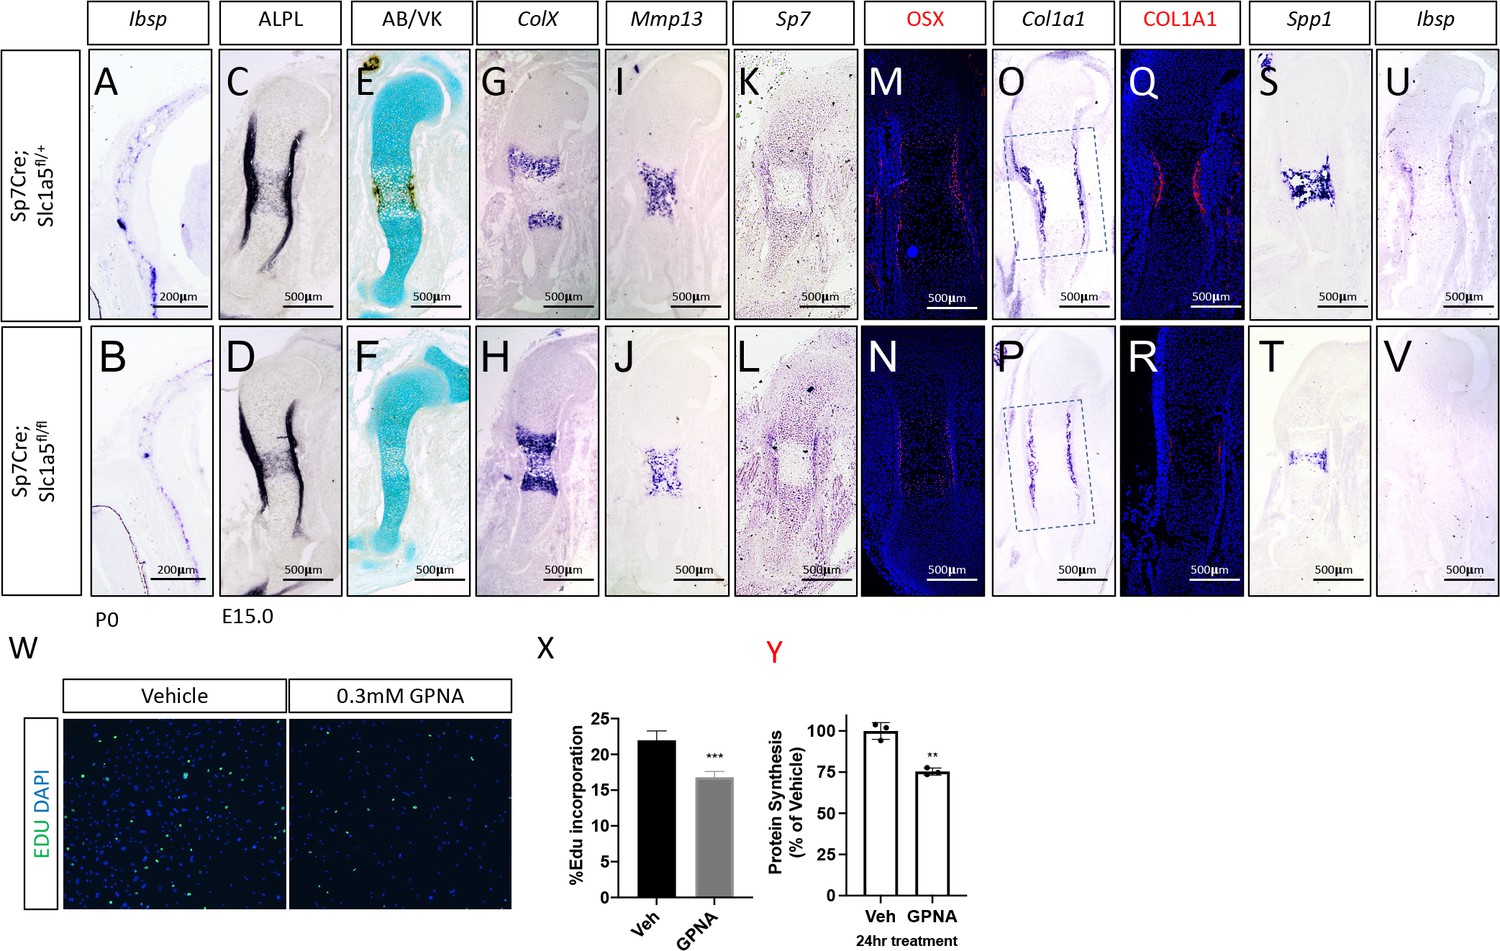
SLC1A5 is necessary for proliferation and endochondral ossification.
(A–V) In situ hybridization for Ibsp on p0 skull (A–B), representative alkaline phosphatase (ALPL) staining (C–D) von Kossa/Alcian blue staining (E–F), In situ hybridization (G–L, O–P, S–V) for ColX, MMP13, SP7, Col1a1, Spp1, Ibsp at E15.5 (N = 4).
Representative immunofluorescent staining for OSX (M–N) or Collagen Type 1 (COL1A1) (Q–R) at E15.5 in Sp7Cre;Slc1a5fl/+ and Sp7Cre;Slc1a5fl/fl mice. (W–Y) Effect of GPNA (0.3 mM) treatment on EdU incorporation (W–X) or protein synthesis as determined by 35S incorporation assay (Y). Error bars depict SD. * p ≤ 0.05, ** p ≤ 0.005. by an unpaired two-tailed Student’s t-test.
-
Figure 2—figure supplement 1—source data 1
Contains numerical source data for Figure 2—figure supplement 1.
- https://cdn.elifesciences.org/articles/71595/elife-71595-fig2-figsupp1-data1-v2.zip
Figure 2—figure supplement 2
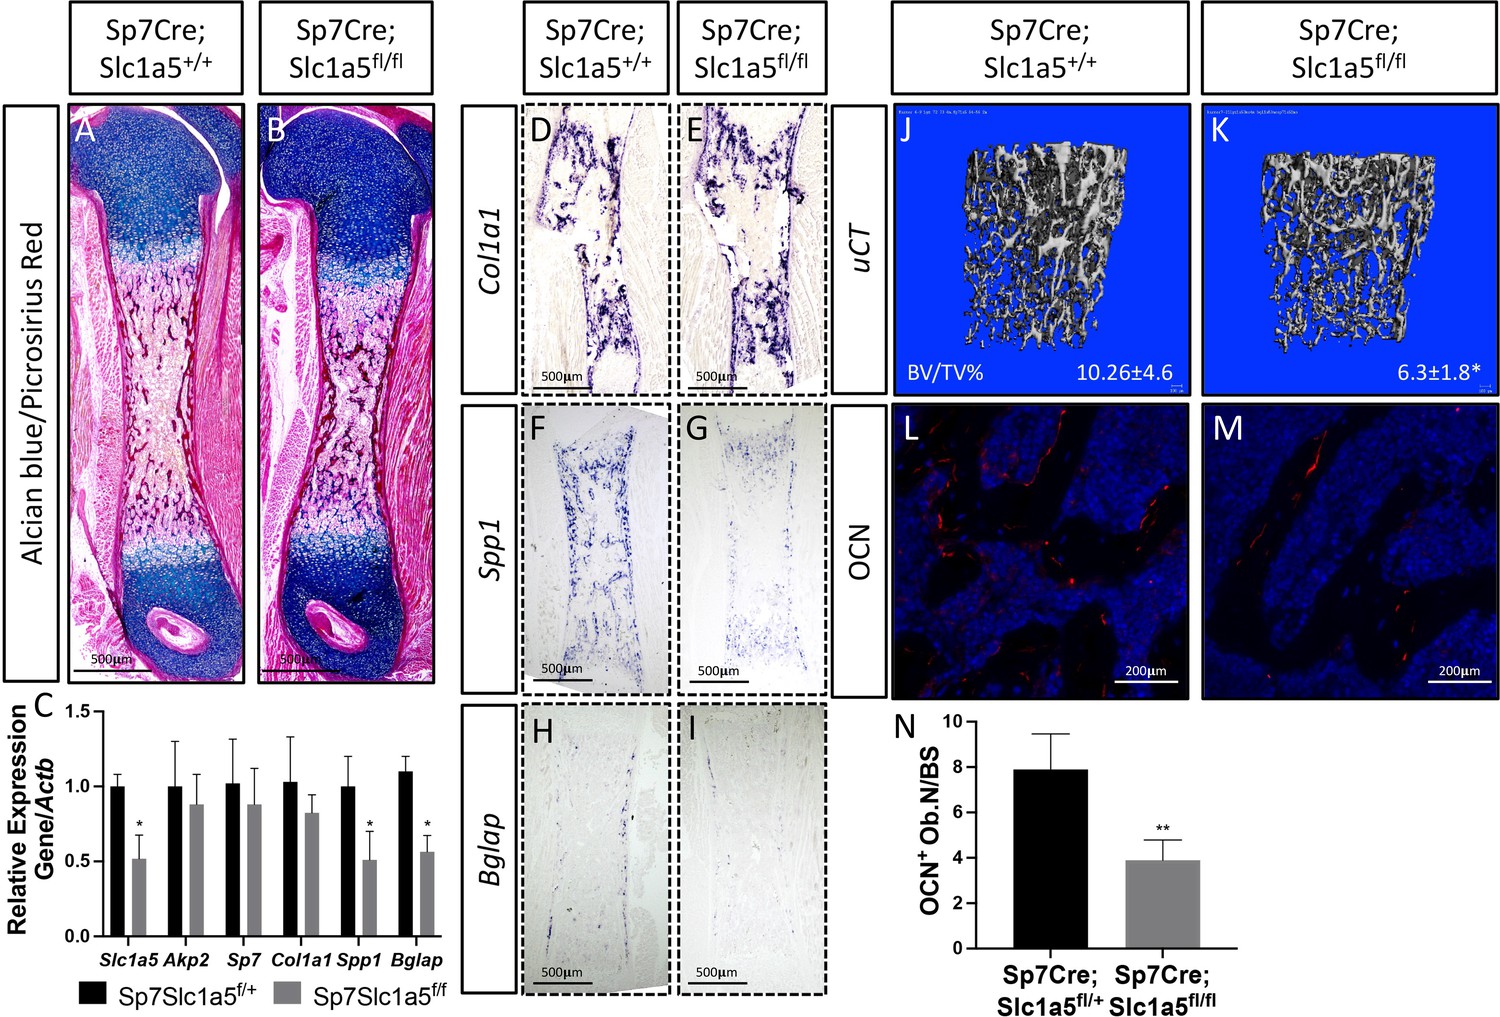
Limb phenotypes at birth and 2 months in Sp7Cre;Slc1a5fl/fl mice.
(A–B) Alcian blue/Picrosirius red staining, (C) qRT-PCR analyses or in situ hybridization (D–I) on Sp7Cre;Slc1a5fl/+ and Sp7Cre;Slc1a5fl/fl femora (N = 5) at P0.
(J–K) Representative μCT (N = 6) used to quantify BV/TV(%) and (L–N) OCN immunofluorescent staining and quantification on Sp7Cre;Slc1a5fl/+ and Sp7Cre;Slc1a5fl/fl (N = 4) knockout mice at 2 months of age. Error bars depict SD. * p ≤ 0.05, ** p ≤ 0.005, by an unpaired two-tailed Student’s t-test.
-
Figure 2—figure supplement 2—source data 1
Contains numerical source data for Figure 2—figure supplement 2.
- https://cdn.elifesciences.org/articles/71595/elife-71595-fig2-figsupp2-data1-v2.zip
Figure 3 with 1 supplement

Slc1a5 is required for robust protein and matrix synthesis in osteoblasts.
(A–B) Radiolabeled 3H-proline incorporation into total protein (A) or collagen (B) in cOB cells isolated from Sp7Cre;Slc1a5fl/+ and Sp7Cre;Slc1a5fl/fl mice. (C–N) Representative immunofluorescent staining for Collagen Type 1 (COL1A1) (C–H) or OSX (I–N) at E15.5 in Sp7Cre;Slc1a5fl/+(C,D,E,I,J,K) and Sp7Cre;Slc1a5fl/fl (F,G,H,L,M,N) mice. Endogenous GFP from Sp7GFP shown in (C,F,I,L). Col1a1 intensity was quantified in the GFP-positive region. Endogenous GFP from Sp7GFP shown in (I, L) was used to quantify OSX/GFP double positive cells. The numbers in each panel represent the percent GFP, OSX or double positive cells per GFP-positive bone area (dotted line). Inset images show 60 x magnification of the indicated region. * p ≤ 0.05, by an unpaired two-tailed Student’s t-test.
-
Figure 3—source data 1
Contains numerical source data for Figure 3.
- https://cdn.elifesciences.org/articles/71595/elife-71595-fig3-data1-v2.zip
Figure 3—figure supplement 1
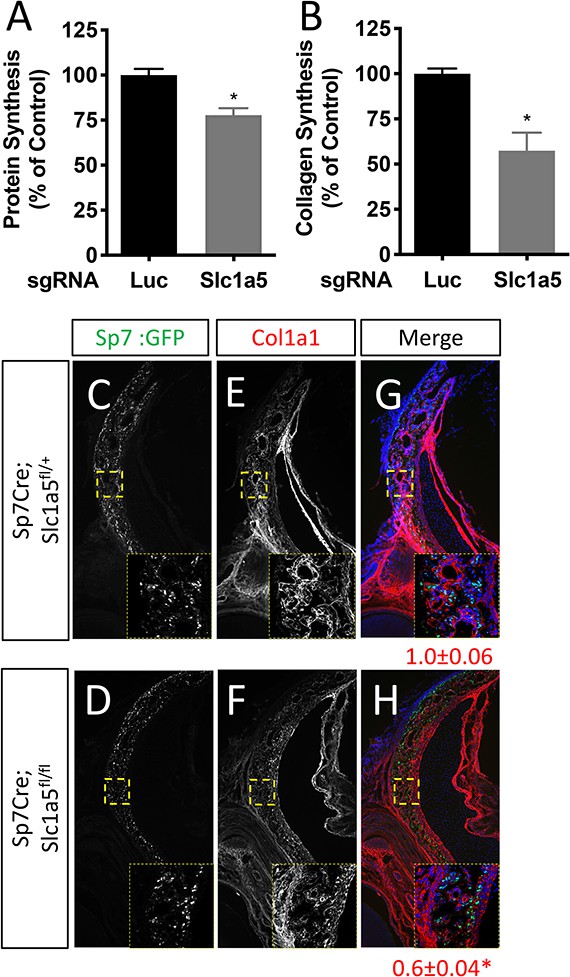
SLC1A5 is necessary for protein synthesis.
(A–B) Radiolabeled 3H-proline incorporation into total protein (A) or collagen (B) in cOB cells.
(C–H) Representative immunofluorescent staining for Collagen Type 1 (COL1A1) at P0 in Sp7Cre;Slc1a5fl/+(C,E,G) and Sp7Cre;Slc1a5fl/fl (D,F,H) mice. Endogenous GFP from Sp7GFP shown in (C–D). The value below the merged image is the quantification of Col1a1 intensity in the GFP positive area measured from 4 mice. Inset images are ×60 magnification of the indicated region. * p ≤ 0.05, by an unpaired two-tailed Student’s t-test.
-
Figure 3—figure supplement 1—source data 1
Contains numerical source data for Figure 3—figure supplement 1.
- https://cdn.elifesciences.org/articles/71595/elife-71595-fig3-figsupp1-data1-v2.zip
Figure 4 with 1 supplement

Slc1a5 provides glutamine and asparagine to maintain amino acid homeostasis.
(A) Effect of Slc1a5 targeting on intracellular amino acid concentration measured by mass spectrometry.(B) Effect of Slc1a5 targeting on the uptake of indicated radiolabeled amino acids. (C) Western Blot analyses of the effect of Slc1a5 targeting on mTORC1 signaling and Eif2a phosphorylation. Phospho-proteins normalized to respective total protein. ASCT2 normalized to α-tubulin. sgRNAs targeting luciferase were used as a negative control. Fold change± SD for sgSlc1a5 over sgLuc in three independent experiments. * p ≤ 0.05 by an unpaired two-tailed Student’s t-test.
-
Figure 4—source data 1
Contains numerical and uncropped western blot source data for Figure 4.
- https://cdn.elifesciences.org/articles/71595/elife-71595-fig4-data1-v2.zip
Figure 4—figure supplement 1
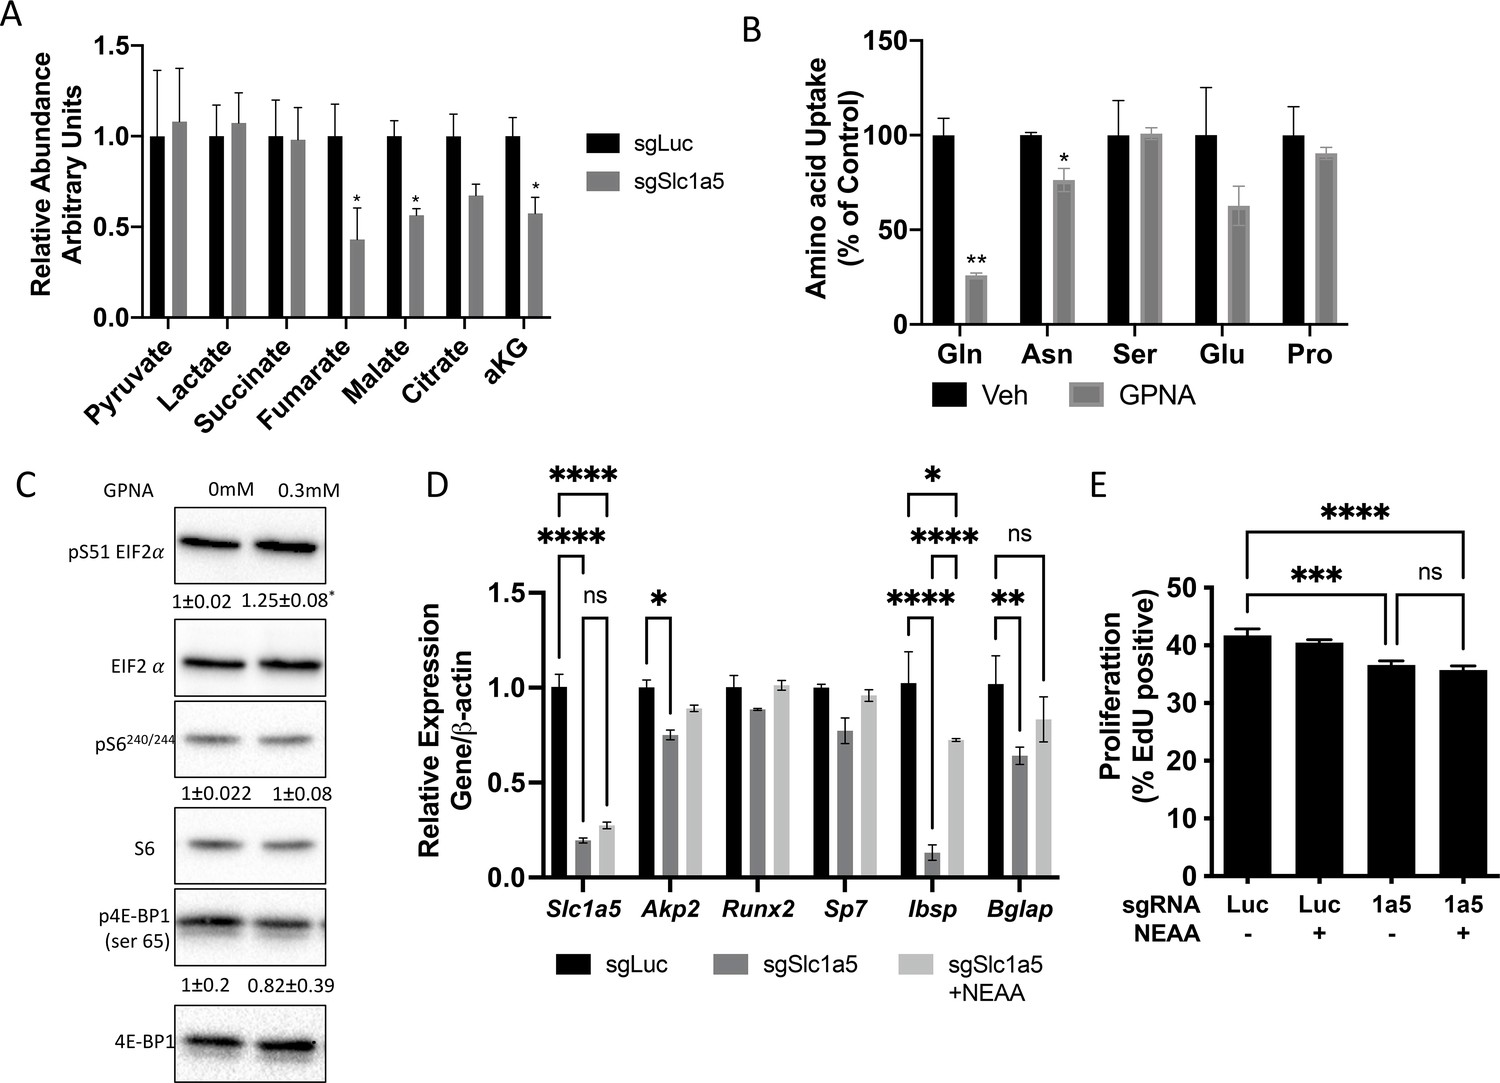
NEAA can partially rescue differentiation but not proliferation.
(A) Effect of Slc1a5 targeting on intracellular concentration of Pyruvate, Lactate, Succinate, Malate, citrate, and α ketoglutarate (αKG).
(B) Effect of GPNA treatment on the uptake of indicated radiolabeled amino acids. (C) Western blot analyses of the effect of GPNA treatment on Eif2a phosphorylation and mTORC1 signaling. Phospho-proteins normalized to respective total protein. HCL treated cells were used as negative control. Fold change± SD for HCL over GPNA treated in three independent experiments. (D–E) Effect of NEAA supplementation on osteoblast marker gene induction as measured by qRT-PCR (D) or EDU incorporation (E) in sgSlc1a5 cells. * p ≤ 0.05, ** p ≤ 0.005, ** p ≤ 0.0005, by multiple unpaired t-tests (A–B) or ordinary one-way ANOVA with Tukey’s multiple comparisons (D–E). Error bars depict SD.
-
Figure 4—figure supplement 1—source data 1
Contains numerical and uncropped western blot source data for Figure 4—figure supplement 1.
- https://cdn.elifesciences.org/articles/71595/elife-71595-fig4-figsupp1-data1-v2.zip
Figure 5
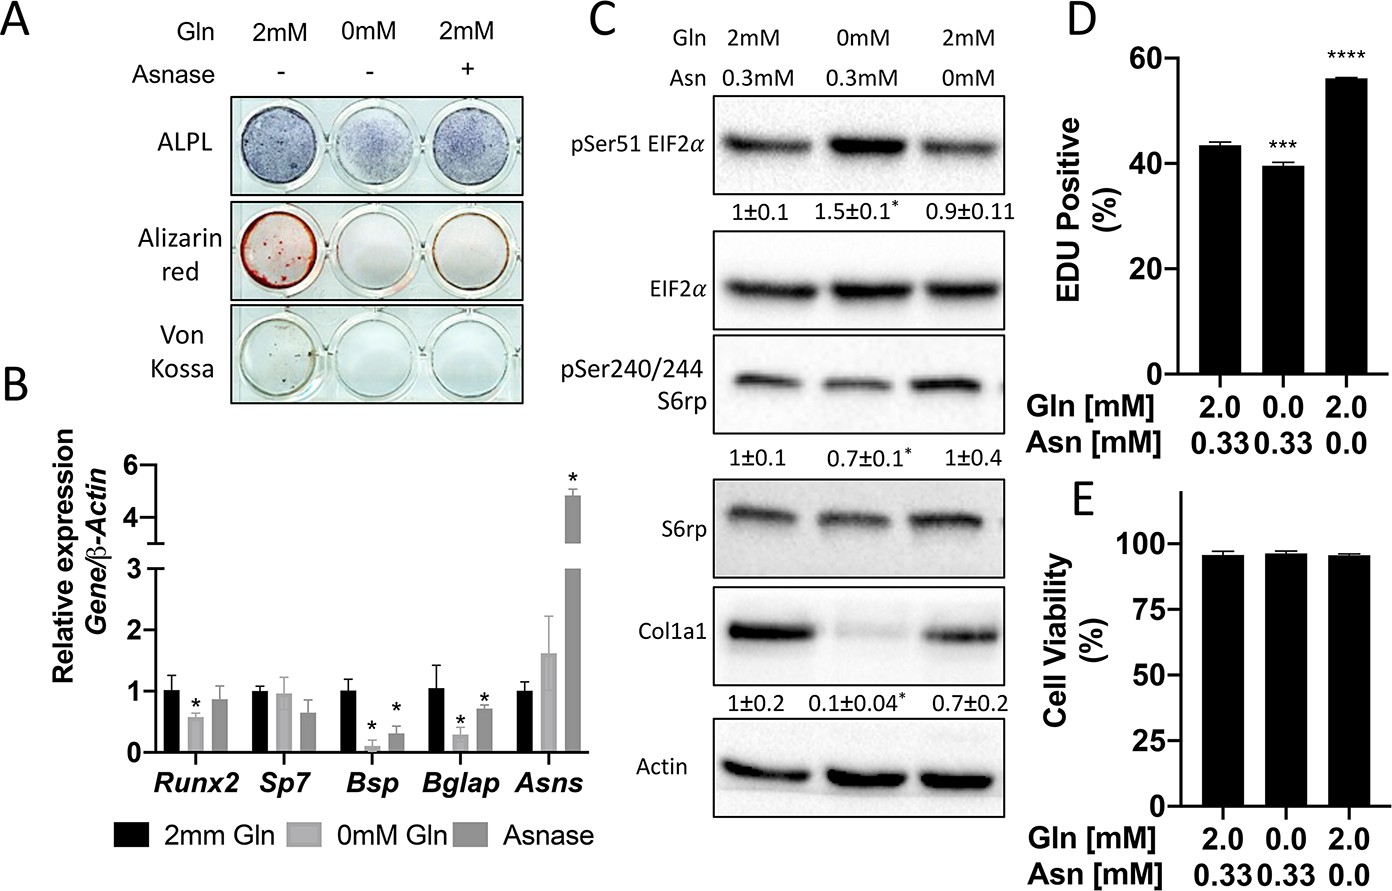
Glutamine and asparagine are required for osteoblast differentiation.
(A–B) Functional assays (A) or qRT-PCR analyses (B) of the effect of glutamine withdrawal or asparaginase treatment on cOB cultured in osteogenic media for 14 days. (C) Western blot analyses of the effect of glutamine or asparagine withdrawal on mTORC1 signaling, Eif2a phosphorylation or COL1A1 expression. Phospho-proteins normalized to respective total protein. COL1A1 normalized to beta-actin. Fold change± SD for three independent experiments. * p ≤ 0.05 by an unpaired 2-tailed Student’s t-test. (D–E) Effect of glutamine or asparagine withdrawal on EdU incorporation (D) or cell viability (E) as determined by Annexin V staining.
-
Figure 5—source data 1
Contains numerical and uncropped western blot source data for Figure 5.
- https://cdn.elifesciences.org/articles/71595/elife-71595-fig5-data1-v2.zip
Figure 6 with 1 supplement

Glutamine and asparagine are utilized for de novo amino acid biosynthesis.
(A–B) Fractional contribution of [U-13C]glutamine or [U-13C]asparagine (A) or [α−15N]glutamine or [α–15N]asparagine (B) to asparagine, aspartate, glutamate, proline, serine, and alanine. (C–D) Fractional contribution of [U-13C]glutamine or [U-13C]asparagine (C) or [α–15N]glutamine or [α–15N]asparagine (D) to asparagine, aspartate, glutamate, proline, serine, and alanine in total protein. (E–F) Effect of BPTES treatment on the fractional contribution of [U-13C]glutamine (E) or [α–15N]glutamine (F) to amino acids. * p ≤ 0.05, ** p ≤ 0.005, *** p ≤ 0.0005, **** p ≤ 0.00005 by ordinary one-way ANOVA with Tukey’s multiple comparisons. (G) Effect of GLS inhibition on intracellular amino acid concentration measured by mass spectrometry. * p ≤ 0.05, multiple unpaired t-tests. Error bars depict SD.(H) Western blot analyses of the effects of BPTES treatment on mTORC1 signaling, Eif2a phosphorylation and COL1A1 expression. Phospho-proteins normalized to respective total protein. COL1A1 normalized to beta-actin. Fold change± SD for three independent experiments. * p ≤ 0.05 by an unpaired two-tailed Student’s t-test. (I) Effect of GLS inhibition on protein synthesis as determined by the rate of 3H Proline incorporation into total protein. * p ≤ 0.05 by an unpaired two-tailed Student’s t-test. Error bars depict SD.
-
Figure 6—source data 1
Contains numerical and uncropped western blot source data for Figure 6.
- https://cdn.elifesciences.org/articles/71595/elife-71595-fig6-data1-v2.zip
Figure 6—figure supplement 1
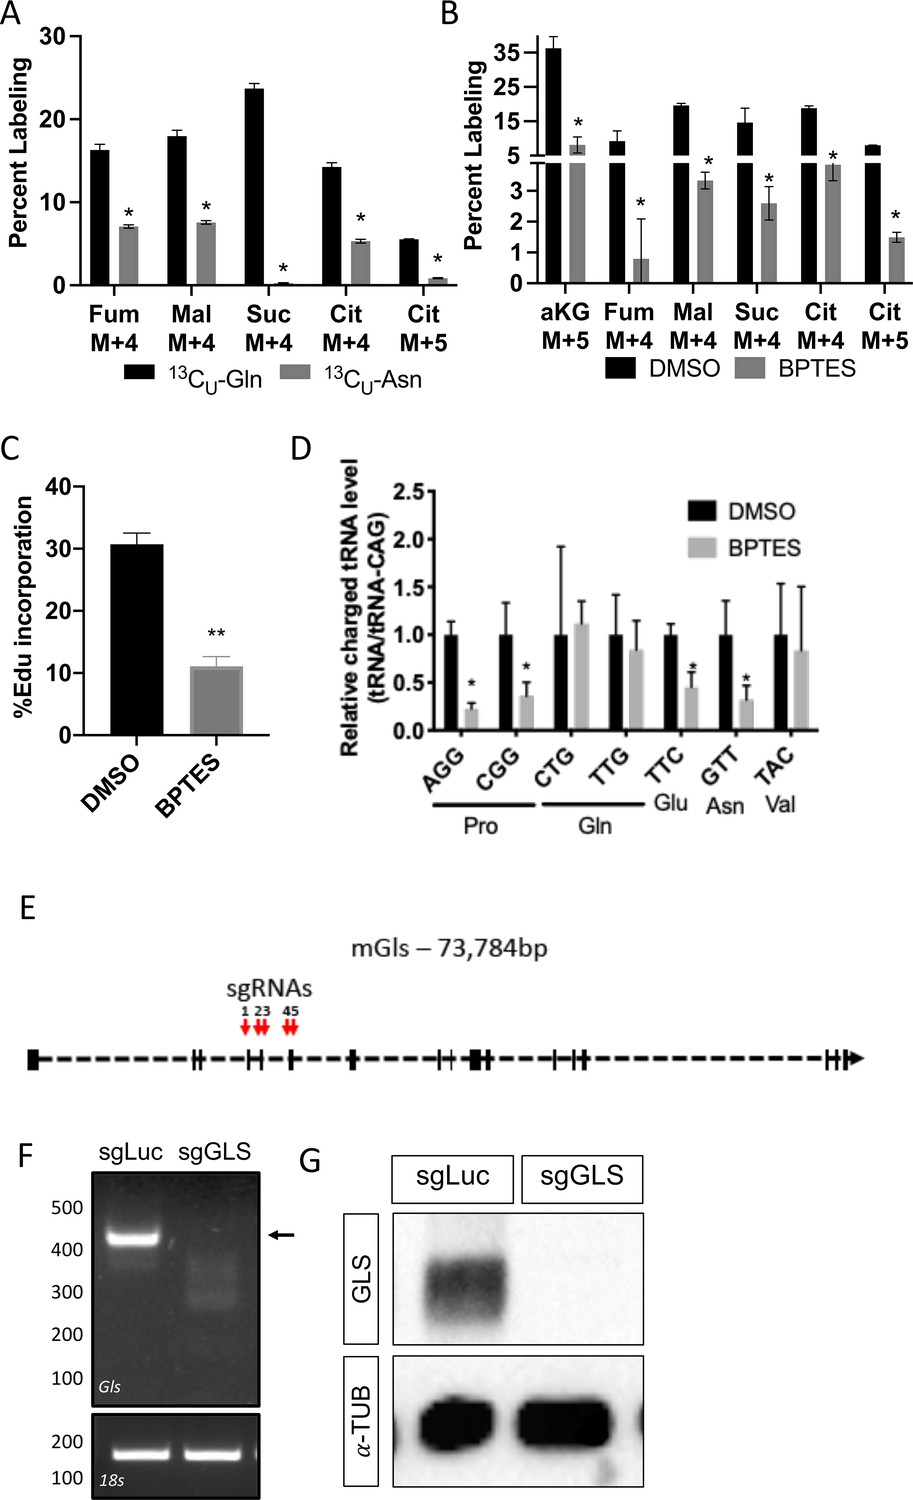
Inhibiting glutamine metabolism recapitulates molecular effects of SLC1A5 ablation.
(A) Fractional contribution of [U-13C]glutamine or [U-13C]asparagine to fumarate, malate, succinate, and Citrate.
(B) Effect of BPTES treatment on the fractional contribution of [U-13C]glutamine to fumarate, malate, succinate, and Citrate. (C) Effect of BPTES on EdU incorporation. (D) Effect of GLS inhibition on tRNA charging. Error bars depict SD. (E) Gls Crispr targeting strategy. (F) PCR analysis of targeted region. Arrow denotes untargeted Gls band. (G) Western blot analyses of the effect of Gls targeting. sgRNAs targeting luciferase and mCherry (denoted sgLuc) were used as a negative control. * p ≤ 0.05, by an multiple unpaired t-tests. Error bars depict SD.
-
Figure 6—figure supplement 1—source data 1
Contains numerical and uncropped western blot source data for Figure 6—figure supplement 1.
- https://cdn.elifesciences.org/articles/71595/elife-71595-fig6-figsupp1-data1-v2.zip
Tables
Key resources table
| Reagent type (species) or resource | Designation | Source or reference | Identifiers | Additional information |
|---|---|---|---|---|
| Genetic Reagent (M. musculus) | C57Bl/6 J | Jackson Laboratory | RRID:IMSR_JAX:000664 | |
| Genetic Reagent (M. musculus) | Rosa26Cas9 | Jackson Laboratory | RRID:IMSR_JAX:024858 | |
| Genetic Reagent (M. musculus) | Rosa26Flpe | Jackson Laboratory | RRID:IMSR_JAX:003946 | |
| Genetic Reagent (M. musculus) | Sp7tTA;tetOeGFP/Cre | PMID:16854976 | RRID:IMSR_JAX:006361 | |
| Genetic Reagent (M. musculus) | Slc1a5flox | This paper | See Methods – Mouse strains for more information. | |
| Chemical compound, drug | Ascorbic acid | Sigma | Cat#A4544 | |
| Chemical compound, drug | β-glycerophosphate | Sigma | Cat#G9422 | |
| Chemical compound, drug | one-step NBT/BCIP solution | Thermofisher | Cat#PI34042 | |
| Chemical compound, drug | L-(2,3,4-3H)Glutamine | Perkin Elmer | Cat#NET551250UC | |
| Chemical compound, drug | L-(14C)Alanine | Perkin Elmer | Cat#EC266E250UC | |
| Chemical compound, drug | L-(2,3,-3H)Proline | Perkin Elmer | Cat#NET483250UC | |
| Chemical compound, drug | L-(2,3,-3H)Aspartic acid | Perkin Elmer | Cat#NET390V001MC | |
| Chemical compound, drug | L-(4,5-3H(N))Lysine | Perkin Elmer | Cat#NEC280E050UC | |
| Chemical compound, drug | L-(2,3,3 H)Asparagine | American Radiolabeled Chemicals | Cat#ART-0500–250 | |
| Chemical compound, drug | [U-13C]glutamine, | Sigma | Cat#605,166 | Used at 2 mM final concentration |
| Chemical compound, drug | [α-15 N]glutamine | Sigma | Cat#486,809 | Used at 2 mM final concentration |
| Chemical compound, drug | [U-13C]Asparagine | Sigma | Cat#579,866 | Used at 0.33 mM final concentration |
| Chemical compound, drug | [α-15 N] Asparagine | Sigma | Cat#485,896 | Used at 0.33 mM final concentration |
| Chemical compound, drug | AP substrate BM purple | Roche | Cat#11442074001 | |
| Chemical compound, drug | ECL substrate | Biorad | Cat#1705060 | |
| Chemical compound, drug | super signal West Femto ECL. | Thermofisher | Cat#1705060 | |
| Antibody | Eif2α (Rabbit monoclonal) | Cell Signaling | RRID:AB_10692650 | (1:1000) |
| Antibody | pSer51 Eif2α (Rabbit monoclonal) | Cell Signaling | RRID:AB_2096481 | (1:1000) |
| Antibody | pSer240/244 S6rp(rabbit polyclonal) | Cell Signaling | RRID:AB_331682 | (1:1000) |
| Antibody | S6rp (rabbit monoclonal) | Cell Signaling | RRID:AB_331355 | (1:1000) |
| Antibody | α-tubulin (rabbit monoclonal) | Cell Signaling | RRID:AB_2619646 | (1:1000) |
| Antibody | α-actin (rabbit polyclonal) | Cell Signaling | RRID:AB_330288 | (1:2000) |
| Antibody | HRP goat anti-rabbit (goat polyclonal) | Cell Signaling | RRID:AB_2099233 | (1:2000) |
| Antibody | HRP anti-mouse (horse polyclonal) | Cell Signaling | RRID:AB_330924 | (1:2000) |
| Antibody | COL1A1 (mouse monoclonal) | Santa Cruz | RRID:AB_2797597 | (1:2000) WB (1:1000) IF |
| Antibody | OSX (rabbit polyclonal) | Abcam | RRID:AB_2194492 | (1:1000) |
| Antibody | PCNA (mouse monoclonal) | Cell Signaling | RRID:AB_2160343 | (1:500) |
| Antibody | goat anti mouse 568 (goat unknown clonality) | Thermofisher | RRID:AB_141359 | (1:1000) |
| Antibody | goat anti Rabbit 568 (goat polyclonal) | Thermofisher | RRID:AB_143157 | (1:1000) |
| Commercial assay or kit | Iscript Reverse transcription kit | Biorad | Cat#1708841 | |
| Commercial assay or kit | SYBR green | Biorad | Cat#1725275 | |
| Commercial assay or kit | Click-iT EdU Cell Proliferation Imaging Kit | Invitrogen, | Cat#C10337 | |
| Commercial assay or kit | Click-iT EdU Alexa Fluor 488 Flow Cytometry Assay Kit | Invitrogen | Cat#C10420 | |
| Commercial assay or kit | Apoptosis Assay Kit (Cat# 22837). | AAT BIO | Cat# 22,837 | |
| Chemical compound, drug | AP substrate BM purple | Roche | Cat#11442074001 | |
| Software Algorithm | Graphpad 6 | https://www.graphpad.com/ |
Table 1
sgRNA sequences.
| Slc1a5.g4 | ATTGATCTCCCGCTGGATACNGG |
|---|---|
| Slc1a5.g1 | ACCCGTTGGAATCCTGTTCCNGG |
| Slc1a5.g10 | AAAATCCCTATCGATTCCTGNGG |
| Slc1a5.g17 | AGAAGAGGTCCCGAAAGCAGNGG |
| Slc1a5.g31 | CCAGGAGCCCGTGGATGGCGNGG |
| MS344.Gls.g5 | ATATAACTCATCGATGTGTGNGG |
| MS344.Gls.g3 | GTGCTAAAAAGCAGTCTGGANGG |
| MS345.Gls.g3 | CAAATTCAGTCCTGATTTGTNGG |
| MS346.Gls.g14 | ATATTTCAGGGGTTTTACACNGG |
| MS346.Gls.g1 | TGCAATTGCTGTTAATGACCNGG |
| SP498.mCherry.g17 | CAAGTAGTCGGGGATGTCGGNGG |
| SP498.mCherry.g19 | AGTAGTCGGGGATGTCGGCGNGG |
| SP499.Luc.g3 | CAATTCTTTATGCCGGTGTTNGG |
| SP399.Luc.g4 | GTGTTGGGCGCGTTATTTATNGG |
Table 2
RT-PCR primer sequences.
| Gene symbol | Forward | Reverse |
|---|---|---|
| Slc1a5 | TGGAGATGAAAGACGTCCGC | CAGGCAGGCTGACACTGGAT |
| β-actin | AGATGTGGATCAGCAAGCAG | GCGCAAGTTAGGTTTTGTCA |
| Akp2 | CCAACTCTTTTGTGCCAGAGA | GGCTACATTGGTGTTGAGCTTTT |
| Ibsp | CAGAGGAGGCAAGCGTCACT | GCTGTCTGGGTGCCAACACT |
| Sp7 | CCTTCTCAAGCACCAATGG | AAGGGTGGGTAGTCATTTGCATA |
| Runx2 | CCAACCGAGTCATTTAAGGCT | GCTCACGTCGCTCATCTTG |
| Bglap | CAGCGGCCCTGAGTCTGA | GCCGGAGTCTGTTCACTACCTTA |
| Asns | CAAGGAGCCCAAGTTCAGTAT | GGCTGTCCTCCAGCCAAT |
Additional files
Download links
A two-part list of links to download the article, or parts of the article, in various formats.
Downloads (link to download the article as PDF)
Open citations (links to open the citations from this article in various online reference manager services)
Cite this article (links to download the citations from this article in formats compatible with various reference manager tools)
SLC1A5 provides glutamine and asparagine necessary for bone development in mice
eLife 10:e71595.
https://doi.org/10.7554/eLife.71595


