Investigating the replicability of preclinical cancer biology
- Center for Open Science, United States
- Quantitative Sciences Unit, Stanford University, United States
- Science Exchange, United States
- University of Virginia, United States
Figures
Figure 1 with 1 supplement
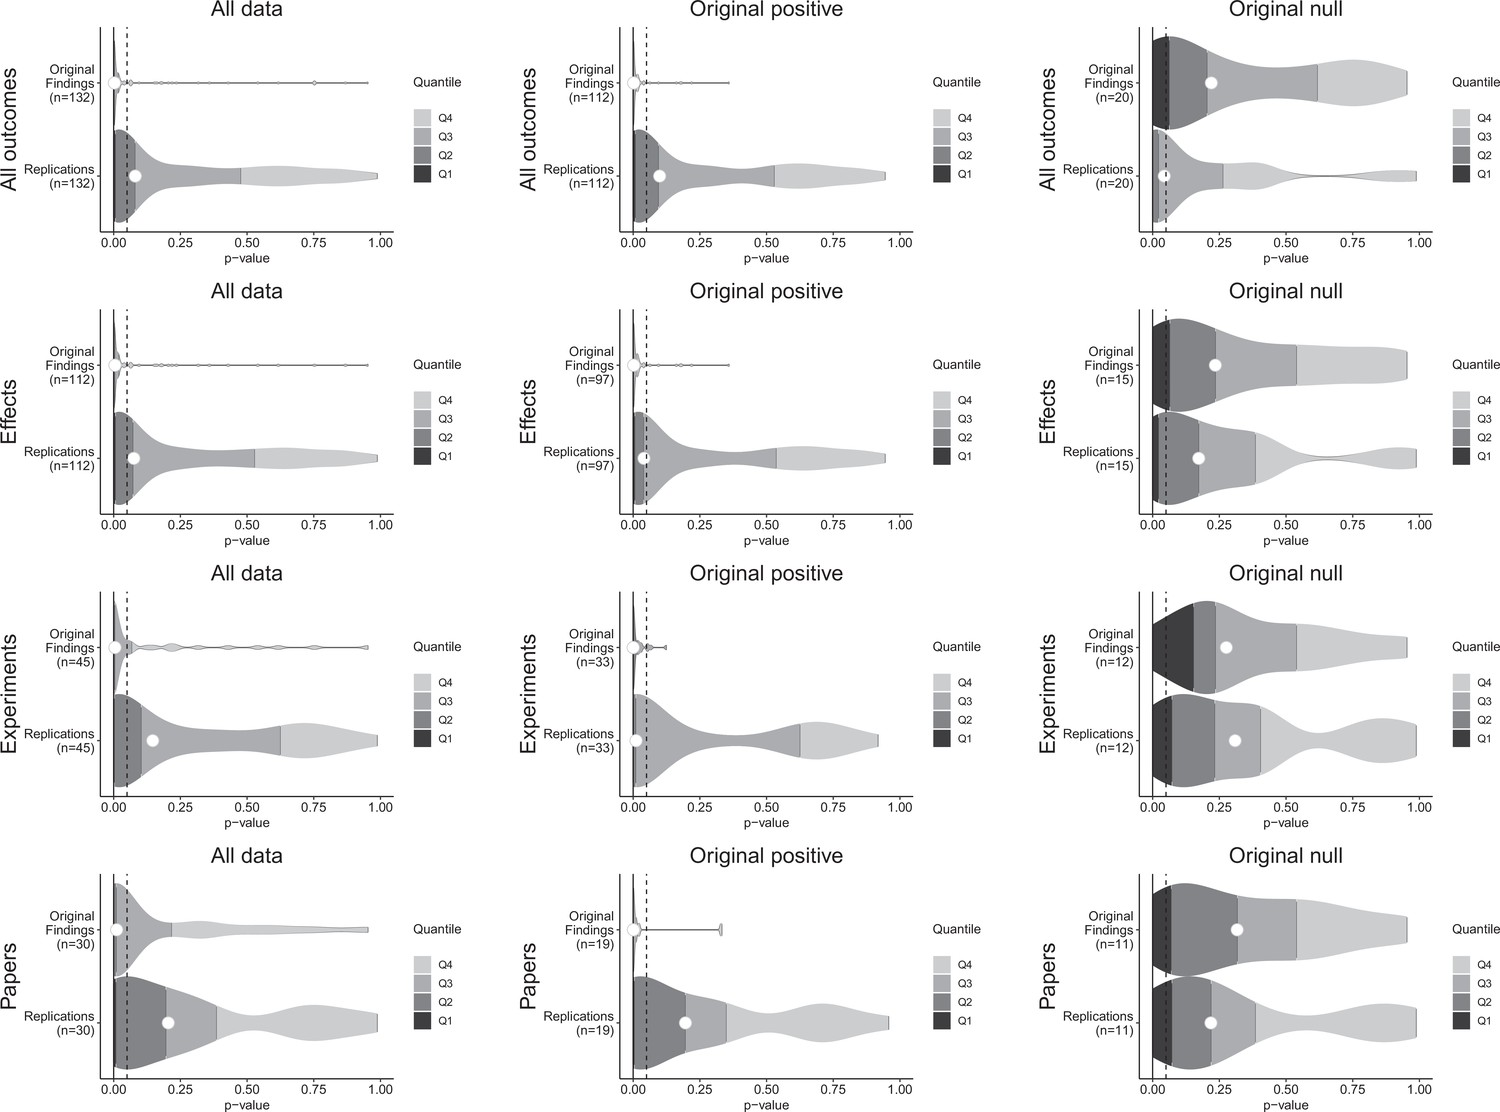
p-value density plots for original and replication results.
p-alue density plots for original and replication results treating internal replications individually (top row), and aggregated by effects (second row), experiments (third row), and papers (fourth row). Left column presents all data for which p-values could be calculated for both original and replication results; the other two columns present data for when the original result was interpreted as positive (middle column) or as a null result (right column). Some original effects (n = 7) were interpreted as positive results with p-values > 0.05, and some original effects (n = 2) were interpreted as null results with p-values < 0.05. Replication p-values ignore whether the result was in the same or opposite direction as the original result (n = 7 effects had p-values < 0.05 in the opposite direction as the original effect).
Figure 1—figure supplement 1
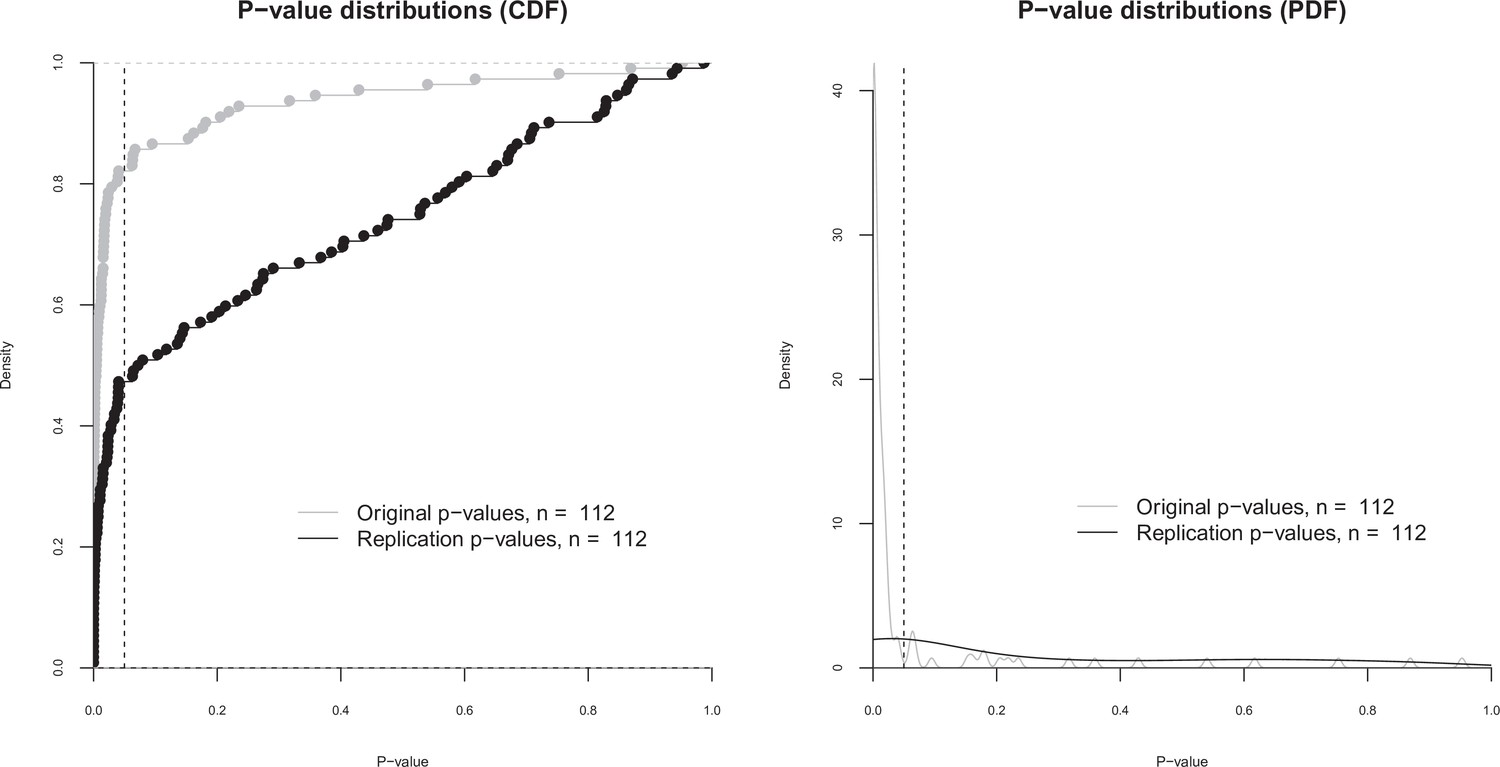
p-value distributions for original and replication effects.
Cumulative distribution functions (CDF; left) and probability distribution functions (PDF; right) for p-values for the 112 effects for which the original and replications had an associated statistical significance test. The vertical dashed line indicates p = 0.05. The difference between the means of the two p-value distributions (0.064 for the original effects; 0.259 for the replications) was significant: paired t-test: t(111) = –6.14, p = 1.33 × 10⁻⁸; Wilcoxon rank sum test: W = 3358, p = 1.88 × 10⁻⁹. Quantities are 0.00034, 0.0048, 0.0198 for the original effects, and 0.0075, 0.0757, 0.528 for the replications.
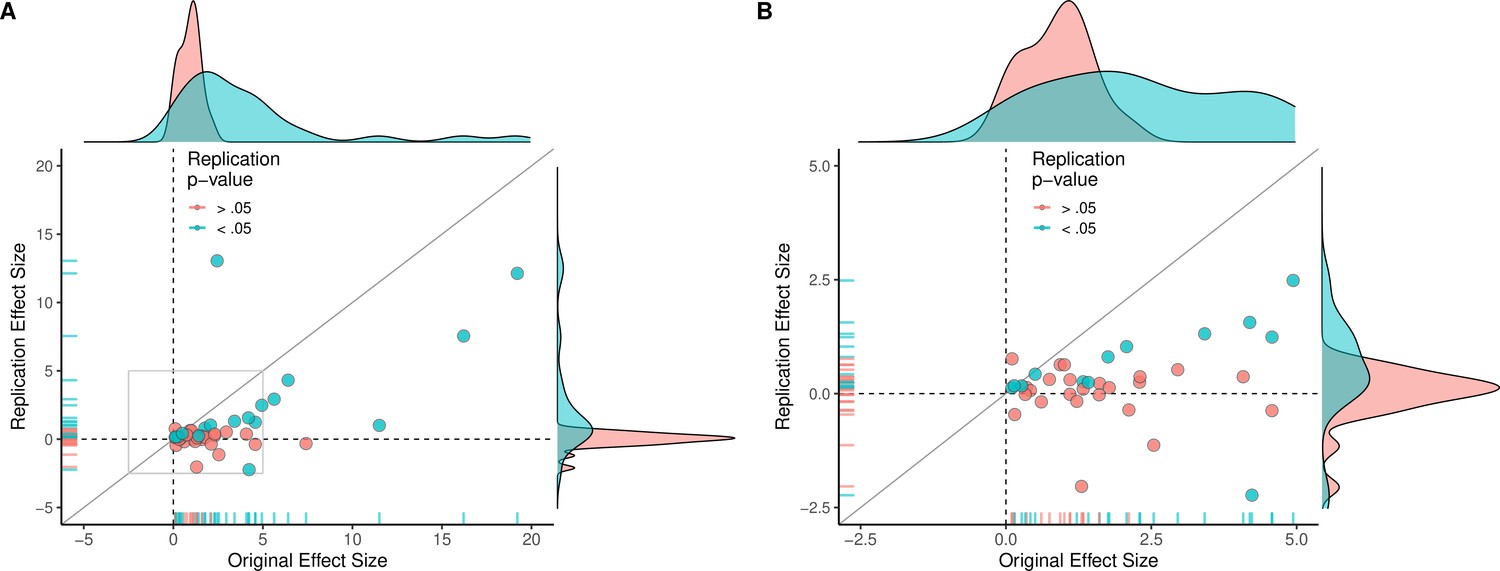
Figure 2 with 3 supplements
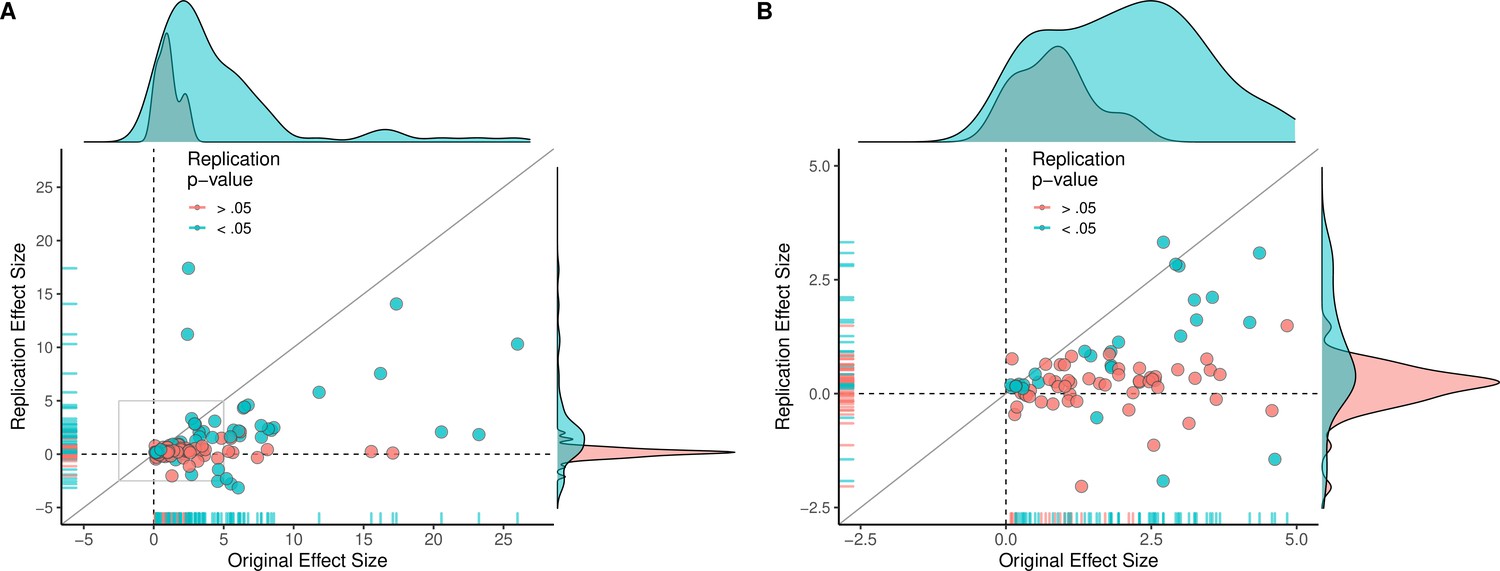
Replication effect sizes compared with original effect sizes.
(A) Graph in which each circle represents an effect for which an SMD effect size could be computed for both the original effect and the replication (n = 110). Blue circles indicate effects for which p < 0.05 in the replication, and red circles indicate p > 0.05. Two effects for which the original effects size was >80 are not shown. The median effect size in the replications was 85% smaller than the median effect size in the original experiments, and 97% of replication effect sizes were smaller than original effect sizes (below the gray diagonal line). (B) An expanded view of panel A for effect sizes < 5 (gray outline in panel A). SMD: standardized mean difference.
Figure 2—figure supplement 1
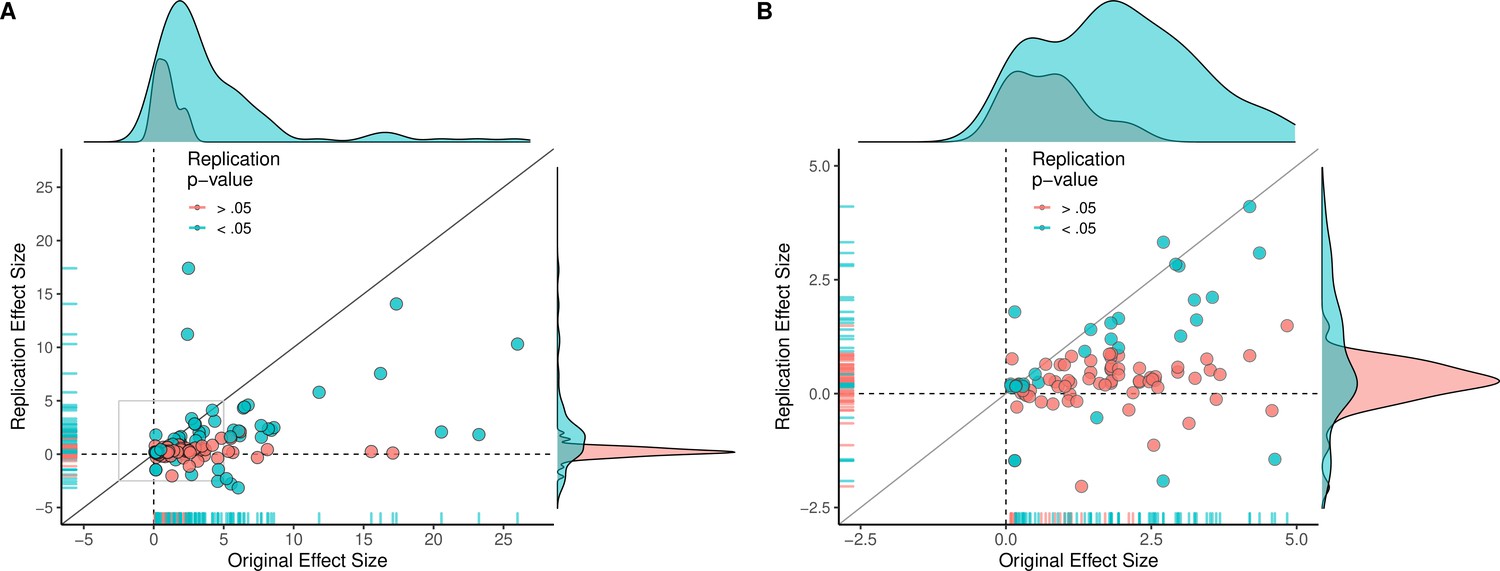
Replication effect sizes compared with original effect sizes for all effects (treating internal replications individually).
(A) Graph in which each circle represents an effect for which an SMD effect size could be computed for both the original effect and the replication: all effects, including internal replications, are shown (n = 130). Blue circles indicate effects for which p < 0.05 in the replication, and red circles indicate p > 0.05. Two effects for which the original effects size was >80 are not shown. (B) An expanded view of panel A for effect sizes < 5 (gray outline in panel A). SMD: standardized mean difference.
Figure 2—figure supplement 2
Replication effect sizes compared with original effect sizes for experiments (combining effects).
(A) Graph in which each circle represents an experiment (n = 44). The SMD effect size for each experiment was determined by meta-analytically combining positive or null effects from each unique experiment with random-effect models. Blue circles indicate experiments for which p < 0.05 in the replication, and red circles indicate p > 0.05. One experiment for which two original effect sizes were >80 are not shown. (B) An expanded view of panel A for effect sizes < 5 (gray outline in panel A). SMD: standardized mean difference.
Figure 2—figure supplement 3
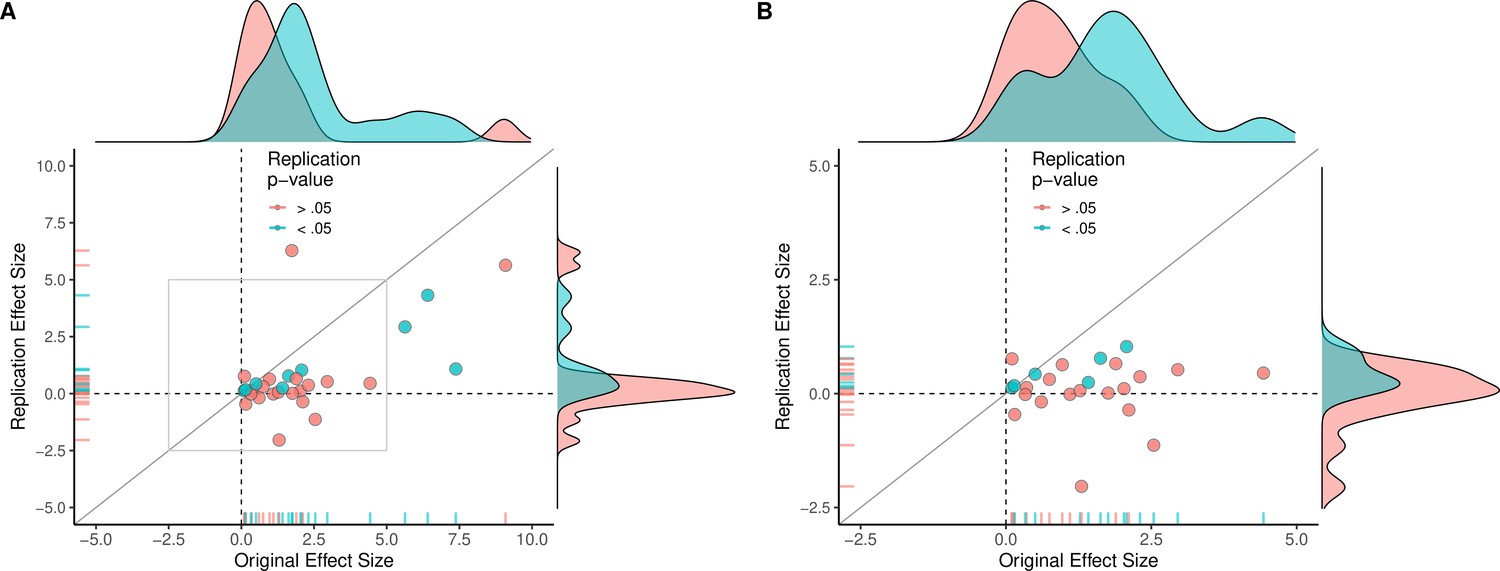
Replication effect sizes compared with original effect sizes for papers (combining experiments).
(A) Graph in which each circle represents a paper (n = 29). The SMD effect size for each paper was determined by meta-analytically combining positive or null results from each unique experiment with random-effect models. Blue circles indicate experiments for which p < 0.05 in the replication, and red circles indicate p > 0.05. One paper for which two original effect sizes were >80 are not shown. (B) An expanded view of panel A for effect sizes < 5 (gray outline in panel A). SMD: standardized mean difference.
Figure 3 with 1 supplement
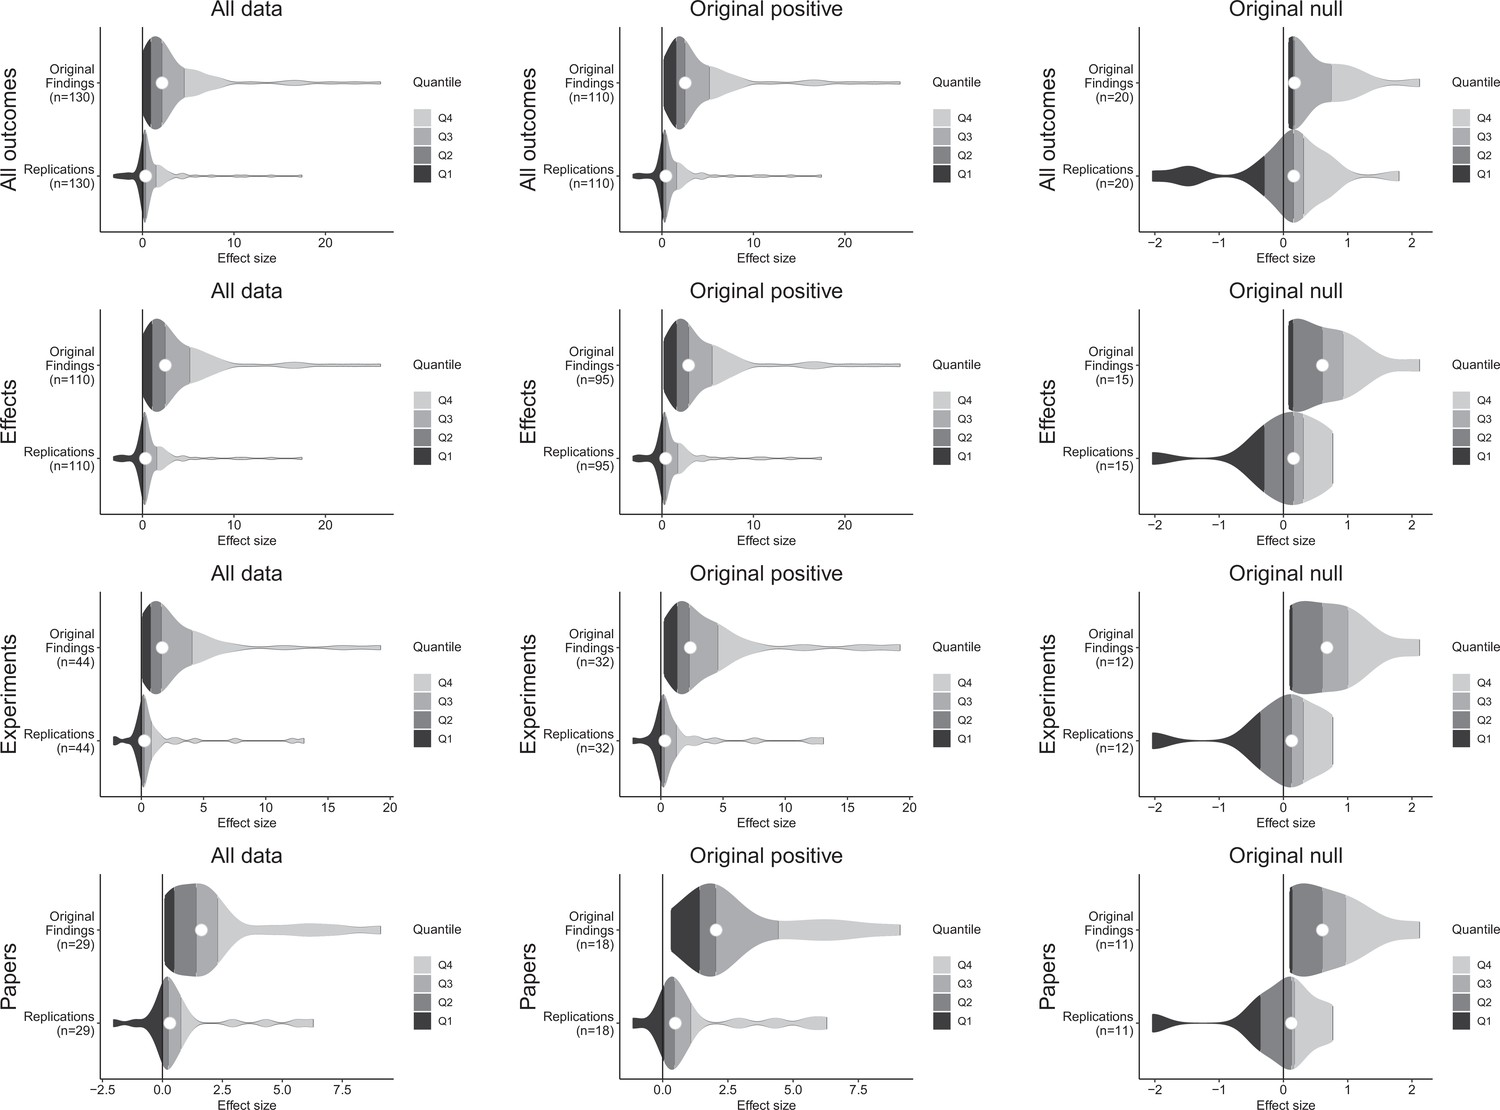
Effect size density plots for original and replication results.
Effect size density plots for original and replication findings for all results treating internal replications individually (top row) and aggregated by effects (second row), experiments (third row), and papers (fourth row). Left column presents all data for which SMD effect sizes could be calculated for both original and replication results; the other two columns present data for when the original result was interpreted as positive (middle column) or as a null result (right column). Effect sizes > 80 (two for all outcomes and effects, and one for experiments and papers) are not shown.
Figure 3—figure supplement 1
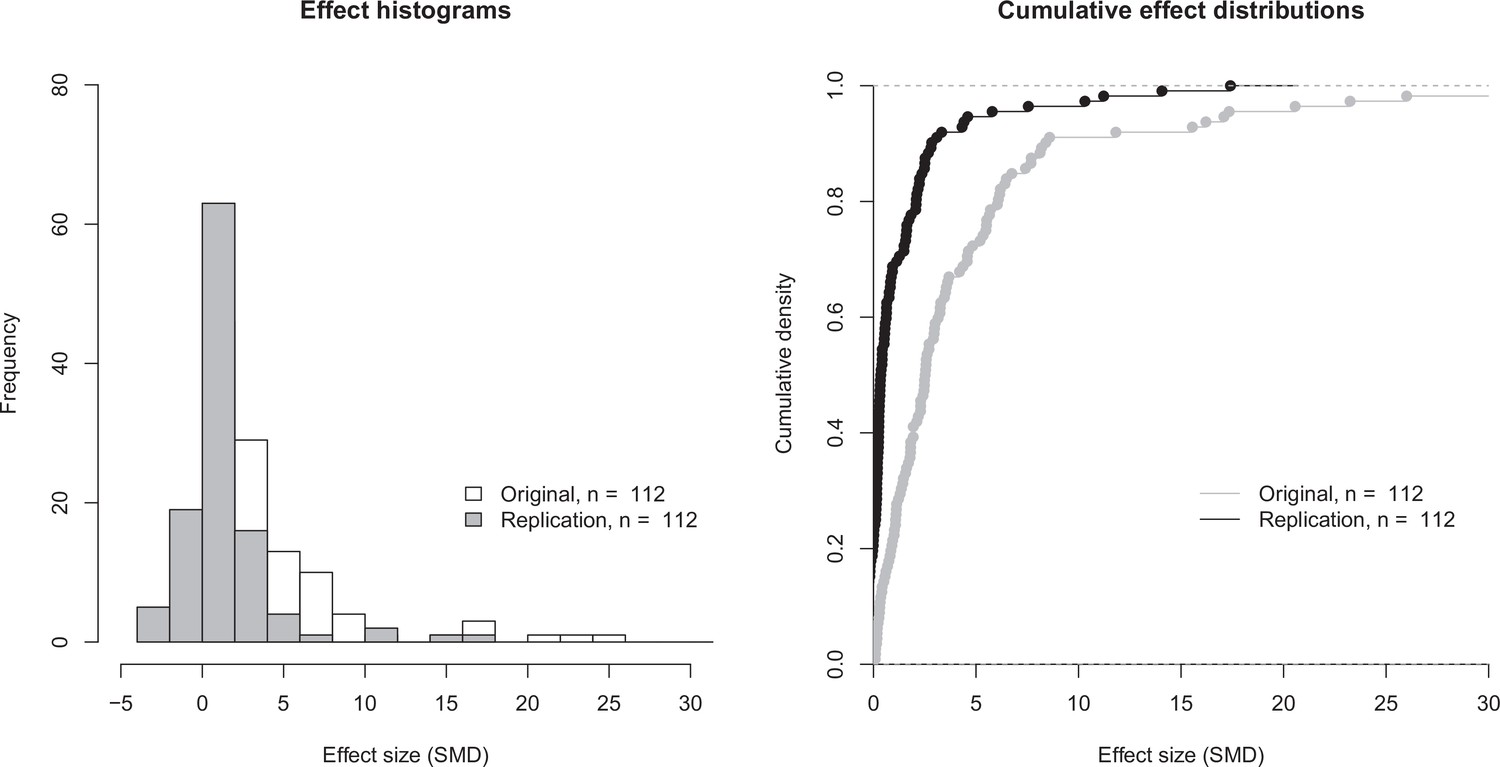
Effect size distributions for original and replication effects.
Histogram (left) and cumulative distribution function (right) for SMD effect sizes for the 112 effects for which the original and replications had an associated statistical significance test. The difference between the means of the two effect size distributions (5.41 [SD = 11.7] for the original effects; 1.19 [SD = 2.85] for the replications) was significant: paired t-test: t(111) = 3.93, p = 1.48 × 10⁻⁴; Wilcoxon rank sum test: W = 9898, p = 7.68 × 10⁻¹⁴. Two effects for which the original effects size was >80 are not shown. SMD: standardized mean difference.
Figure 4
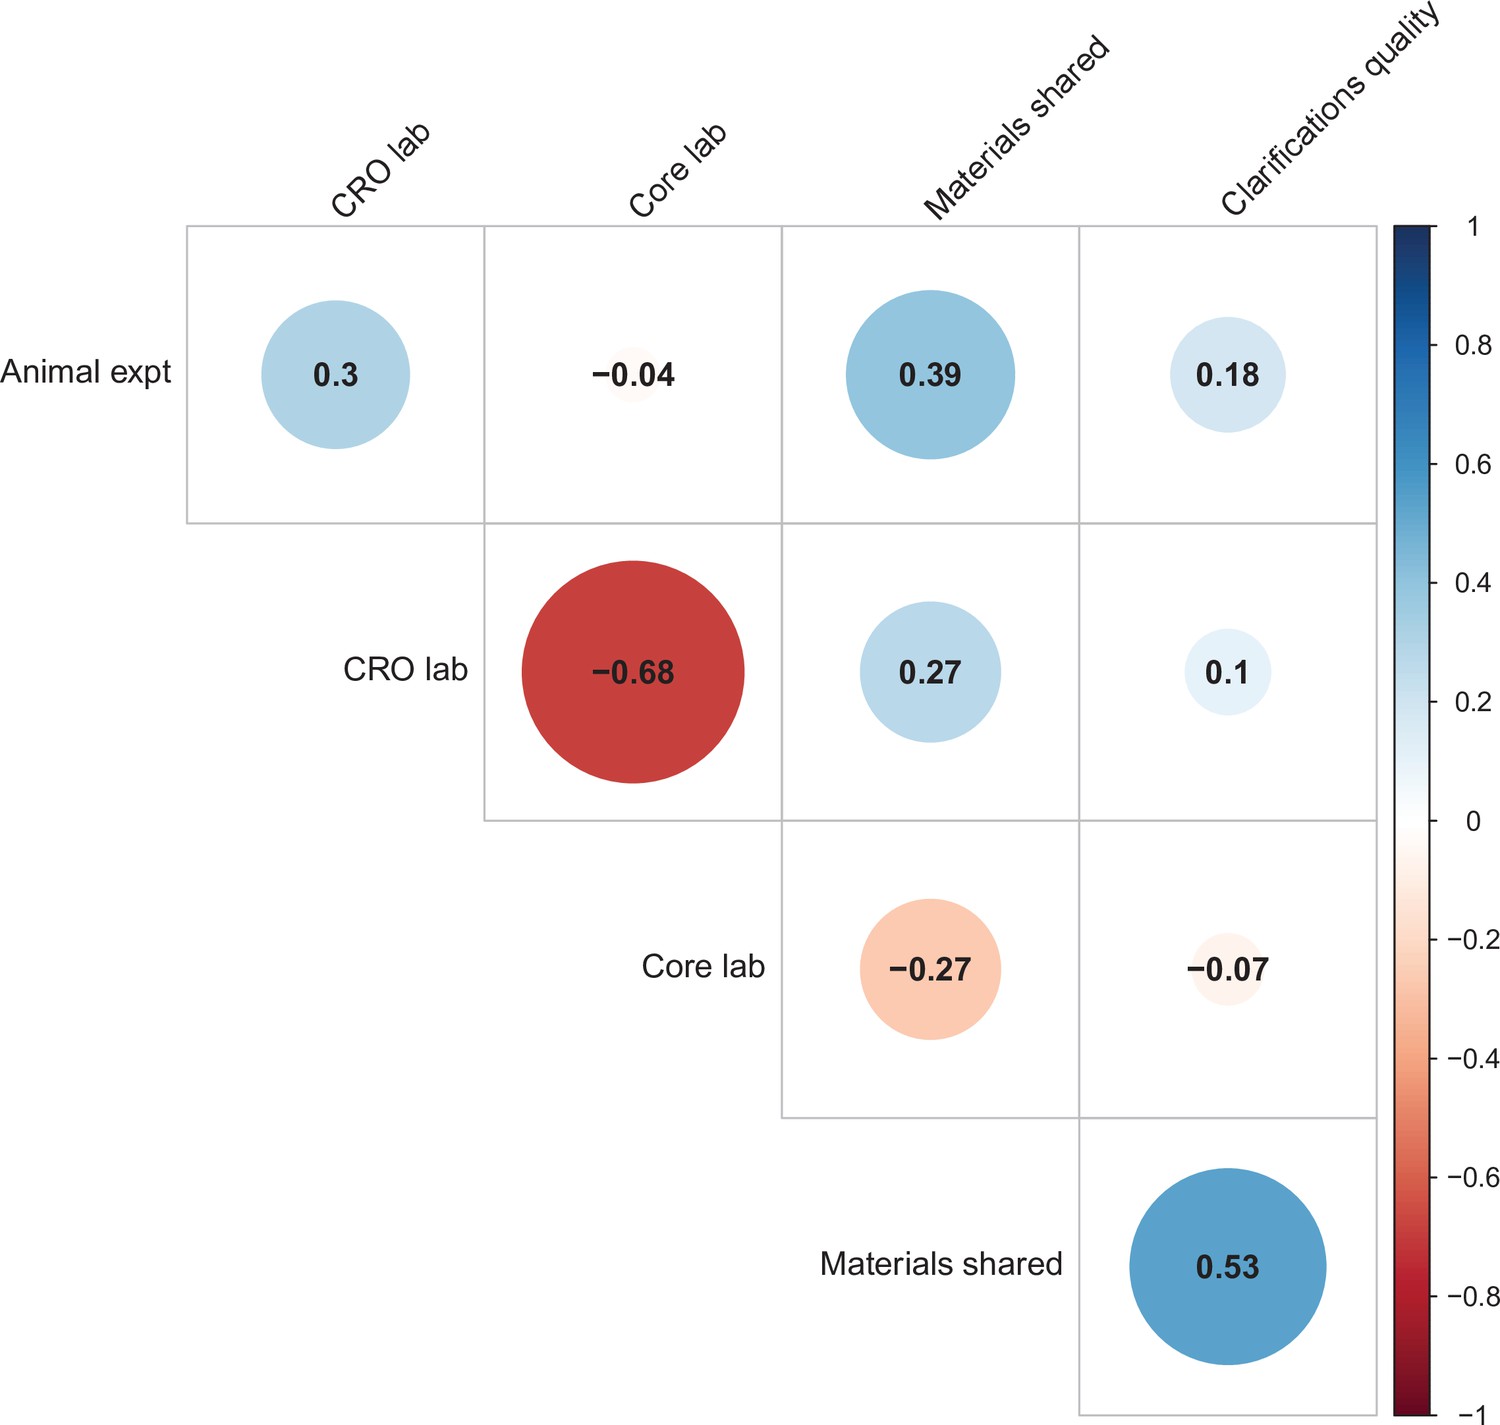
Correlations between five candidate moderators.
Point-biserial correlations among five candidate moderators for predicting replication success for the 97 original positive effects with replication pairs. The five moderators were: (i) animal experiments vs. non-animal (i.e., in vitro) experiments (animal expt); (ii) the use of contract research organizations to conduct replications (CRO lab); (iii) the use of academic research core facilities to conduct replications (core lab); (iv) whether the original authors shared materials with the replicating labs (materials shared); (v) the quality of methodological clarifications made by the original authors (clarifications quality); see Materials and methods for more details. Correlations are color-coded (blue = positive; red = negative; see color bar), with the size of the circle being proportional to the magnitude of the correlation. None of the five moderators showed a consistent, significant association with replication rate (see Table S7 in Supplementary file 1).
Figure 5
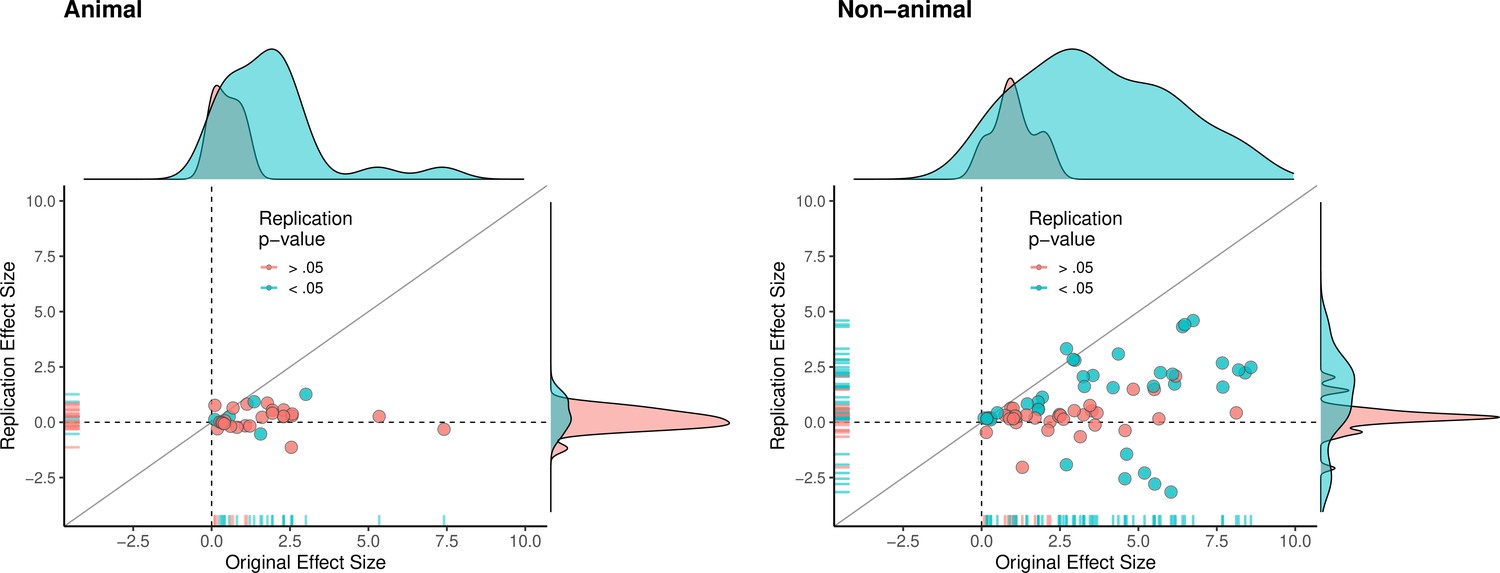
Replication effect sizes compared with original effect sizes for animal and non-animal experiments.
Graphs for animal experiments (n = 30 effects; left) and non-animal experiments (n = 70 effects; right) in which each circle represents an effect for which an SMD effect size could be computed for both the original effects and the replication. Blue circles indicate effects for which p < 0.05 in the replication, and red circles indicate p > 0.05. Animal experiments were less likely to replicate than non-animal experiments and this may be a consequence of animal experiments eliciting smaller effect sizes on average than non-animal experiments (see main text for further discussion). Twelve effects in the non-animal experiments for which the original effects size was >10 are not shown. SMD: standardized mean difference.
Figure 6
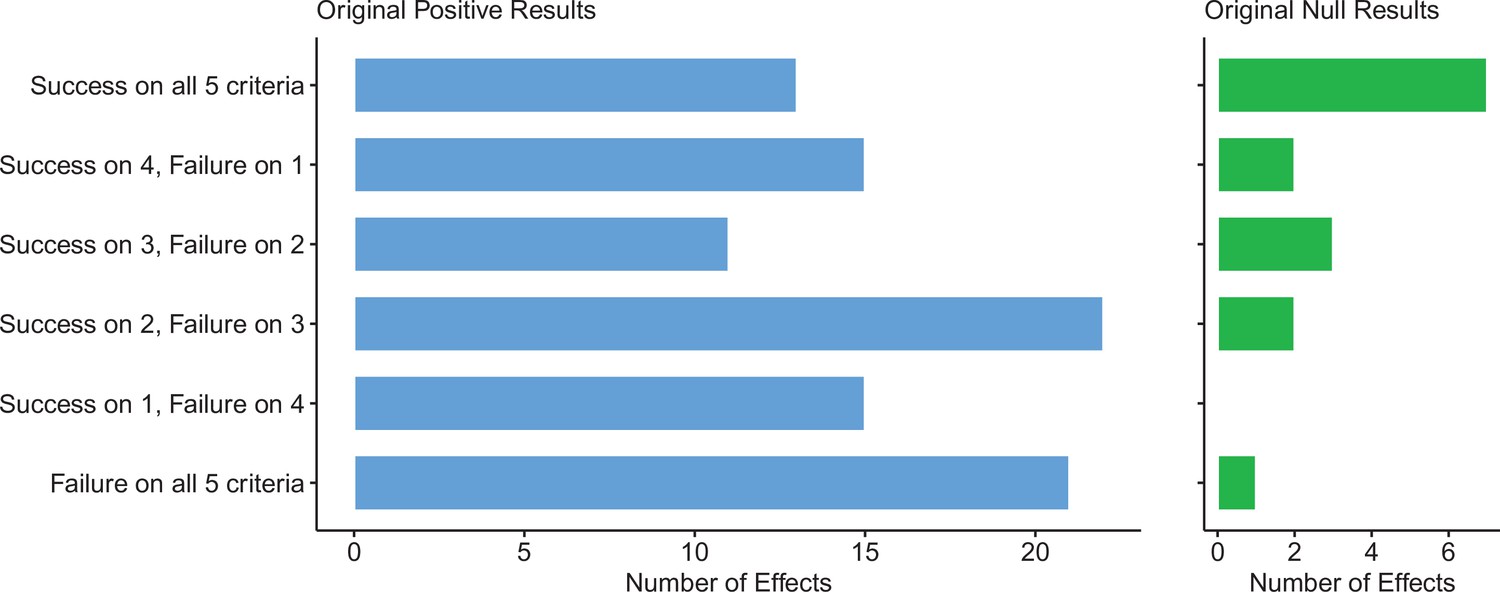
Assessing replications of positive and null effects across five criteria.
Five of the criteria we used to assess replications could be used for both positive (n = 97) and null effects (n = 15). The number of effects where the replication was successful on all five criteria is shown by the top bar of each panel, with the second bar showing the number of effects where the replications were successful on four criteria, and so on: positive effects are shown in the left panel (blue bars), and null effects are shown in the right panel (green bars). The five criteria were: (i) direction and statistical significance (p < 0.05); (ii) original effect size in replication 95% confidence interval; (iii) replication effect size in original 95% confidence interval; (iv) replication effect size in original 95% prediction interval; (v) meta-analysis combining original and replication effect sizes is statistically significant (p < 0.05). Standardized mean difference (SMD) effect sizes are reported.
Figure 7
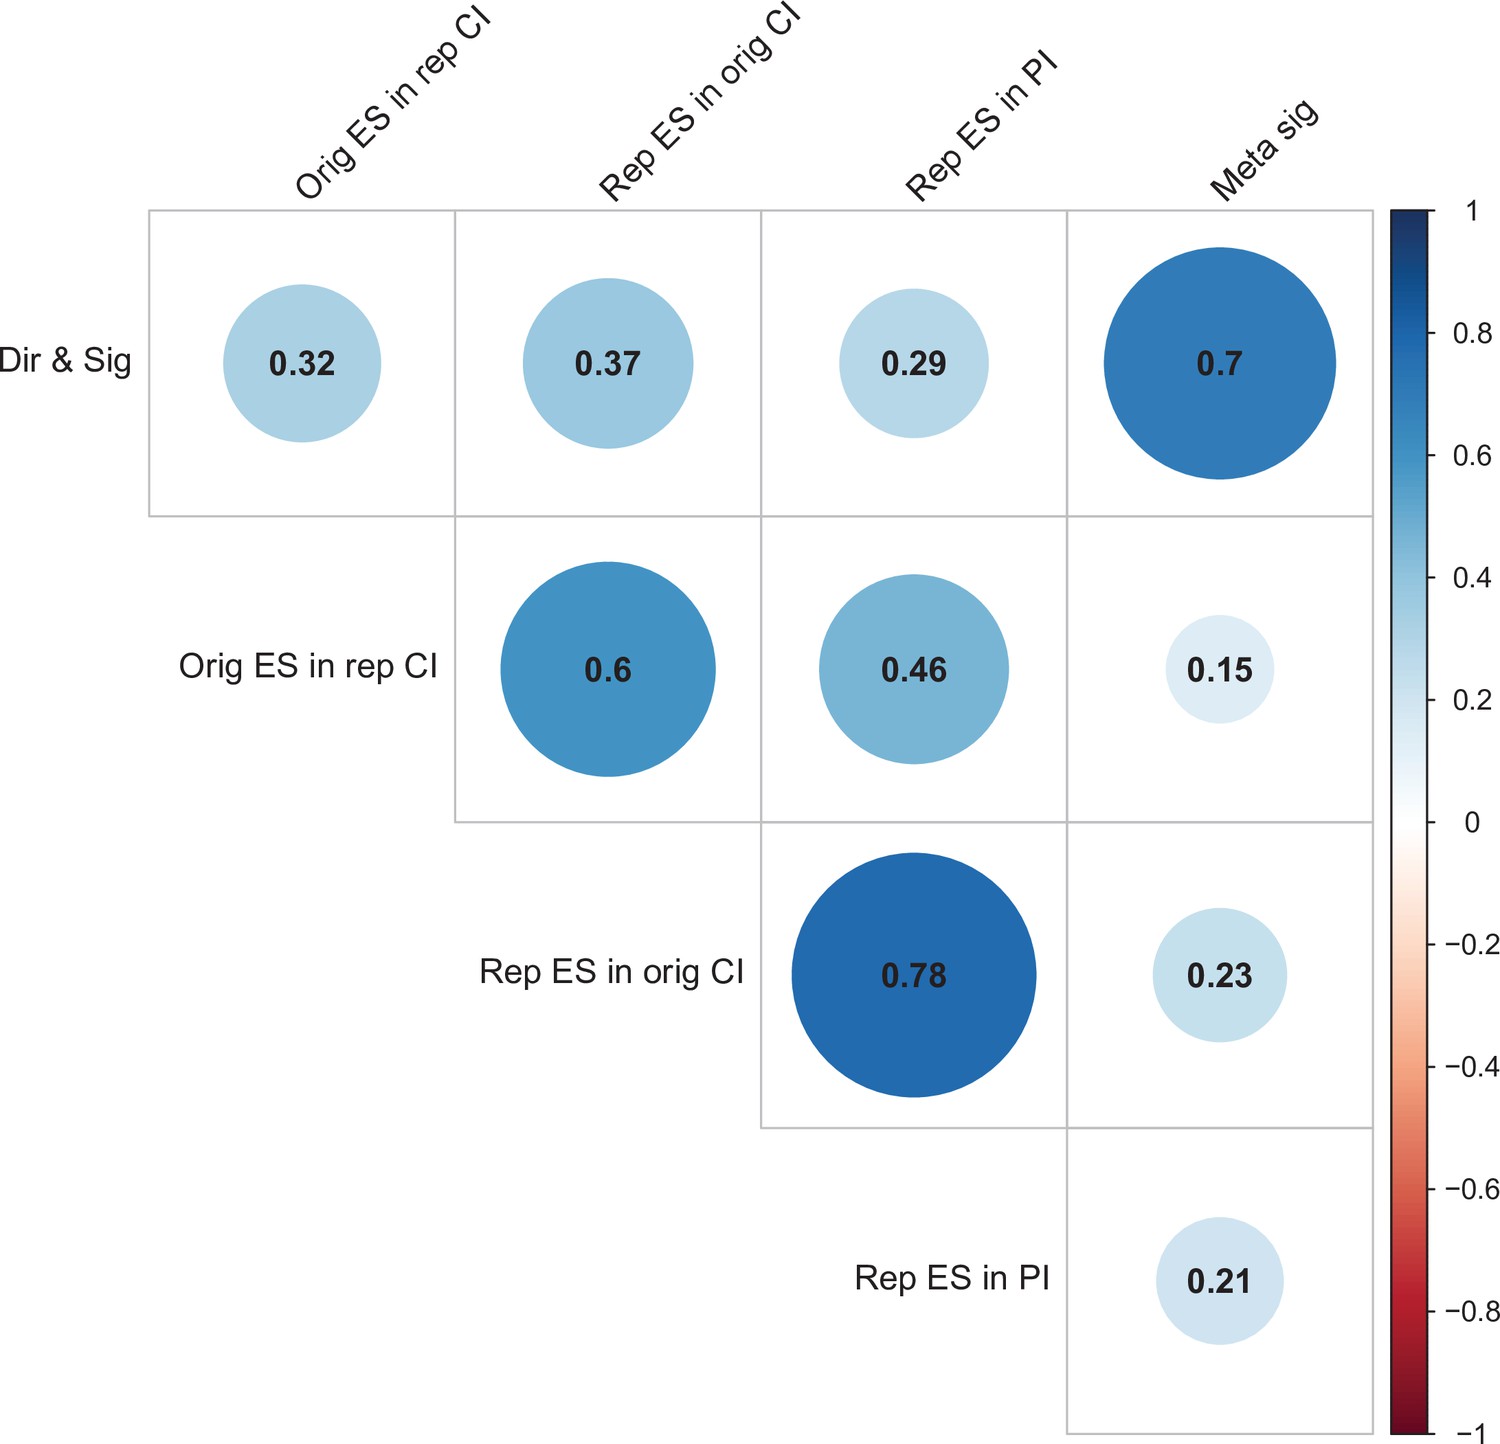
Correlations between five criteria for replication success.
Point-biserial correlations among five criteria for evaluating replication success for the 112 original-replication pairs that could be evaluated on all five criteria: (i) same direction and statistical significance (Dir & Sig); (ii) original effect size in replication 95% confidence interval (Orig ES in rep CI); (iii) replication effect size in original 95% confidence interval (Rep ES in orig CI); (iv) replication effect size in 95% prediction interval (Rep ES in PI); (v) meta-analysis combining original and replication effect sizes gives significant effect (p < 0.05) (Meta sig). Correlations are color-coded (blue = positive; red = negative; see color bar), with the size of the circle being proportional to the magnitude of the correlation. The five criteria were all positively correlated with one another.
Tables
Table 1
Replication rates according to seven criteria.
| Papers | Experiments | Effects | All outcomes | |
|---|---|---|---|---|
| Total number | 23 | 50 | 158 | 188 |
| ORIGINAL POSITIVE RESULTS | ||||
| Numerical results | ||||
| Same direction | 17 of 19 (89%) | 26 of 35 (74%) | 80 of 101 (79%) | 95 of 116 (82%) |
| Direction and statistical significance | 8 of 19 (42%) | 17 of 33 (52%) | 42 of 97 (43%) | 44 of 112 (39%) |
| Original ES in replication CI | 5 of 19 (26%) | 3 of 33 (9%) | 17 of 97 (18%) | 26 of 112 (23%) |
| Replication ES in original CI | 5 of 19 (26%) | 11 of 33 (33%) | 42 of 97 (43%) | 50 of 112 (45%) |
| Replication ES in PI (porig) | 6 of 19 (32%) | 13 of 33 (39%) | 56 of 97 (58%) | 67 of 112 (60%) |
| Replication ES≥ original ES | 1 of 19 (5%) | 1 of 33 (3%) | 3 of 97 (3%) | 3 of 112 (3%) |
| Meta-analysis (p < 0.05) | 15 of 19 (79%) | 26 of 33 (79%) | 60 of 97 (62%) | 75 of 112 (67%) |
| Representative images | ||||
| Same direction | 9 of 10 (90%) | 12 of 16 (75%) | 28 of 35 (80%) | 34 of 45 (76%) |
| Direction and statistical significance | 3 of 8 (40%) | 7 of 12 (58%) | 14 of 22 (64%) | 14 of 22 (64%) |
| Original image in replication CI | 5 of 7 (71%) | 3 of 11 (27%) | 10 of 21 (48%) | 10 of 21 (48%) |
| Replication effect ≥ original image | 3 of 7 (43%) | 5 of 11 (45%) | 7 of 21 (33%) | 7 of 21 (33%) |
| Sample sizes | ||||
| Median [IQR] of original | 46.0 [20.0–100] | 20.0 [8.5–48.0] | 8.0 [6.0–13.0] | 8.0 [6.0–18.0] |
| Median [IQR] of replication | 50.0 [28.0–128] | 24.0 [11.5–50.0] | 12.0 [8.0–22.2] | 12.0 [8.0–18.0] |
| ORIGINAL NULL RESULTS | ||||
| Numerical results | ||||
| Same direction | N/A | N/A | N/A | N/A |
| Direction and statistical significance | 9 of 11 (82%) | 10 of 12 (83%) | 11 of 15 (73%) | 10 of 20 (50%) |
| Original ES in replication CI | 8 of 11 (73%) | 9 of 12 (75%) | 11 of 15 (73%) | 12 of 20 (60%) |
| Replication ES in original CI | 9 of 11 (82%) | 10 of 12 (83%) | 12 of 15 (80%) | 13 of 20 (65%) |
| Replication ES in PI (porig) | 9 of 11 (82%) | 10 of 12 (83%) | 12 of 15 (80%) | 14 of 20 (70%) |
| Replication ES ≤ original ES | N/A | N/A | N/A | N/A |
| Meta-analysis (p > 0.05) | 8 of 11 (73%) | 10 of 12 (83%) | 10 of 15 (67%) | 11 of 20 (55%) |
| Representative images | ||||
| Same direction | N/A | N/A | N/A | N/A |
| Direction and statistical significance | 3 of 3 (100%) | 3 of 3 (100%) | 4 of 5 (80%) | 4 of 5 (80%) |
| Original image in replication CI | 1 of 3 (33%) | 1 of 3 (33%) | 3 of 5 (60%) | 3 of 5 (60%) |
| Replication effect ≤ original image | N/A | N/A | N/A | N/A |
| Sample sizes | ||||
| Median [IQR] of original | 16.0 [8.0–25.0] | 12.0 [6.0–20.0] | 15.0 [7.5–31.0] | 18.0 [8.0–514] |
| Median [IQR] of replication | 24.0 [16.0–69.0] | 21.0 [8.0–54.0] | 27.0 [8.0–66.8] | 24.0 [16.0–573] |
-
Summary of consistency between original and replication findings for original positive results (top) and null results (bottom), and by treating internal replications individually (all outcomes; column 5) and aggregated by effects (column 4), experiments (column 3), and papers (column 2). All findings coded in terms of consistency with original findings. If original results were null, then a positive result is counted as inconsistent with the original finding. For statistical significance, if original results were interpreted as a positive result but were not statistically significant at p < 0.05, then they were treated as a positive result (seven effects); likewise, if they were interpreted as a null result but were statistically significant at p < 0.05, they were treated as a null result (two effects). For original positive results, replications were deemed successful if they were statistically significant and in the same direction as the original finding; for original null results, replications were deemed successful if they were not statistically significant, regardless of direction. The ‘same direction’ criterion is not applicable for original null results because ‘null’ is an interpretation in null hypothesis significance testing and most null results still have a direction (as the effect size is almost always non-zero). Likewise, comparing direction of effect sizes is not meaningful for original null results if their variation was interpreted as noise. Mean differences were estimated from the image for original effects based on representative images. Original positive and null effects were kept separate when aggregating into experiments and papers. That is, if a single experiment had both positive and null effects, then the positive effects are summarized in ‘original positive results’ and the null outcomes are summarized in ‘original null results’. Very similar results are obtained when alternative strategies are used to aggregate the data (see Tables S1–S3 in Supplementary file 1). Standardized mean difference (SMD) effect sizes are reported. CI = 95% confidence interval; PI = 95% prediction interval; ES = effect size; IQR = interquartile range.
Table 2
Replication rates according to three criteria involving null hypothesis significance testing.
| Papers | Experiments | Effects | All outcomes | |||||
|---|---|---|---|---|---|---|---|---|
| Total number | 23 | 50 | 158 | 188 | ||||
| ORIGINAL POSITIVE RESULTS | ||||||||
| Succeeded on all three criteria | 2 | 11% | 2 | 6% | 13 | 13% | 20 | 18% |
| [1]Failed only on significance and direction | 2 | 11% | 1 | 3% | 4 | 4% | 6 | 5% |
| [2]Failed only on original in replication confidence interval | 1 | 5% | 5 | 15% | 14 | 14% | 10 | 9% |
| [3]Failed only on replication in original confidence interval | 0 | 0% | 0 | 0% | 0 | 0% | 0 | 0% |
| Failed only on [1] and [2] | 0 | 0% | 3 | 9% | 11 | 11% | 14 | 13% |
| Failed only on [2] and [3] | 5 | 26% | 10 | 30% | 15 | 15% | 14 | 13% |
| Failed only on [1] and [3] | 1 | 5% | 0 | 0% | 0 | 0% | 0 | 0% |
| Failed on all three criteria [1], [2], and [3] | 8 | 42% | 12 | 36% | 40 | 41% | 48 | 43% |
| Total | 19 | 33 | 97 | 112 | ||||
| ORIGINAL NULL RESULTS | ||||||||
| Succeeded on all three criteria | 6 | 55% | 7 | 58% | 8 | 53% | 7 | 35% |
| [1]Failed only on significance and direction | 2 | 18% | 2 | 17% | 3 | 20% | 5 | 25% |
| [2]Failed only on original in replication confidence interval | 1 | 9% | 1 | 8% | 1 | 7% | 1 | 5% |
| [3]Failed only on replication in original confidence interval | 0 | 0% | 0 | 0% | 0 | 0% | 0 | 0% |
| Failed only on [1] and [2] | 0 | 0% | 0 | 0% | 0 | 0% | 0 | 0% |
| Failed only on [2] and [3] | 2 | 18% | 2 | 17% | 2 | 13% | 2 | 10% |
| Failed only on [1] and [3] | 0 | 0% | 0 | 0% | 0 | 0% | 0 | 0% |
| Failed on all three criteria [1], [2], and [3] | 0 | 0% | 0 | 0% | 1 | 7% | 5 | 25% |
| Total | 11 | 12 | 15 | 20 | ||||
-
Number of replications that succeeded or failed to replicate results in original experiments according to three criteria within the null hypothesis significance testing framework: statistical significance (p < 0.05) and same direction; original effect size inside 95% confidence interval of replication effect size using standardized mean difference (SMD) effect sizes; replication effect size inside 95% confidence interval of original effect size using SMD effect sizes. Data for original positive results and original null results are shown separately, as are data for all outcomes and aggregated by effect, experiment, and paper. Very similar results are obtained when alternative strategies are used to aggregate the data (see Tables S4–S6 in Supplementary file 1).
Table 3
Comparing effect sizes in the original results and the replications.
| Papers | Experiments | Effects | All outcomes | |
|---|---|---|---|---|
| ORIGINAL POSITIVE RESULTS | ||||
| Number of outcomes | 19 | 33 | 97 | 112 |
| Mean (SD) original experiment effect size | 7.35 (18.77) | 6.36 (14.62) | 6.15 (12.39) | 5.56 (11.63) |
| Median [IQR] original experiment effect size | 2.07 [1.68–5.03] | 2.45 [1.42–4.58] | 2.96 [1.71–5.70] | 2.57 [1.60–5.49] |
| Mean (SD) replication experiment effect size | 1.38 (2.02) | 1.55 (3.31) | 1.37 (3.01) | 1.30 (2.83) |
| Median [IQR] replication experiment effect size | 0.53 [0.18–1.80] | 0.37 [0.10–1.31] | 0.43 [0.15–2.06] | 0.47 [0.17–1.67] |
| Meta-analytic mean (SD) estimate | 1.68 (1.81) | 1.79 (2.90) | 1.66 (2.47) | 1.61 (2.32) |
| Meta-analytic median [IQR] estimate | 0.98 [0.57–2.20] | 1.00 [0.28–2.03] | 0.92 [0.36–2.43] | 1.05 [0.36–2.11] |
| Sample sizes | ||||
| Median [IQR] of original | 46.0 [20.0–100] | 24.0 [9.0–48.0] | 8.0 [6.0–13.0] | 8.5 [6.0–18.0] |
| Median [IQR] of replication | 50.0 [28.0–128] | 32.0 [12.0–50.0] | 12.0 [8.0–23.0] | 12.0 [8.0–18.0] |
| ORIGINAL NULL RESULTS | ||||
| Number of outcomes | 11 | 12 | 15 | 20 |
| Mean (SD) original experiment effect size | 0.70 (0.64) | 0.72 (0.61) | 0.63 (0.59) | 0.51 (0.55) |
| Median [IQR] original experiment effect size | 0.61 [0.15–1.03] | 0.68 [0.15–1.03] | 0.61 [0.16–0.97] | 0.18 [0.15–0.79] |
| Mean (SD) replication experiment effect size | –0.08 (0.75) | –0.02 (0.74) | 0.02 (0.69) | 0.01 (0.86) |
| Median [IQR] replication experiment effect size | 0.13 [-0.27–0.24] | 0.13 [-0.23–0.39] | 0.16 [-0.24–0.47] | 0.16 [-0.21–0.39] |
| Meta-analytic mean (SD) estimate | 0.20 (0.31) | 0.25 (0.34) | 0.24 (0.34) | 0.20 (0.39) |
| Meta-analytic median [IQR] estimate | 0.17 [0.06–0.40] | 0.23 [0.07–0.43] | 0.16 [0.06–0.44] | 0.16 [0.07–0.43] |
| Sample sizes | ||||
| Median [IQR] of original | 16.0 [8.0–25.0] | 12.0 [7.0–22.5] | 18.0 [8.0–32.0] | 19.0 [11.0–514] |
| Median [IQR] of replication | 24.0 [16.0–69.0] | 22.5 [8.0–61.5] | 30.0 [12.0–72.5] | 27.0 [17.5–573] |
-
Comparing original effect sizes and effect sizes in the replications for original positive results (top) and null results (bottom) when treating internal replications individually (all outcomes; column 5) and aggregated by effects (column 4), experiments (column 3), and papers (column 2). The mean and median of the effect sizes in the original results were considerably larger than those for the replications. SD = standard deviation; IQR = interquartile range.
Table 4
Replication rates for animal and non-animal experiments.
| Animal | Non-animal | Total | |
|---|---|---|---|
| Total number of effects | 36 | 122 | 158 |
| ORIGINAL POSITIVE EFFECTS | |||
| Numerical results | |||
| Same direction | 17 of 27 (63%) | 63 of 74 (85%) | 80 of 101 (79%) |
| Direction and statistical significance | 3 of 25 (12%) | 39 of 72 (54%) | 42 of 97 (43%) |
| Original ES in replication CI | 4 of 25 (16%) | 13 of 72 (18%) | 17 of 97 (18%) |
| Replication ES in original CI | 9 of 25 (36%) | 33 of 72 (46%) | 42 of 97 (43%) |
| Replication ES in PI (porig) | 11 of 25 (44%) | 45 of 72 (63%) | 56 of 97 (58%) |
| Replication ES≥ original ES | 0 of 25 (0%) | 3 of 72 (4%) | 3 of 97 (3%) |
| Meta-analysis (p < 0.05) | 13 of 25 (52%) | 47 of 72 (65%) | 60 of 97 (62%) |
| Representative images | |||
| Same direction | 1 of 4 (25%) | 27 of 31 (87%) | 28 of 35 (80%) |
| Direction and statistical significance | 0 of 2 (0%) | 14 of 20 (70%) | 14 of 22 (64%) |
| Original image in replication CI | 0 of 1 (0%) | 10 of 20 (50%) | 10 of 21 (48%) |
| Replication effect ≥ original image | 0 of 1 (0%) | 7 of 20 (35%) | 7 of 21 (33%) |
| Sample sizes | |||
| Median [IQR] of original | 14.0 [10.0–20.0] | 7.0 [6.0–11.2] | 8.0 [6.0–13.0] |
| Median [IQR] of replication | 15.0 [13.0–21.8] | 10.0 [8.0–22.0] | 12.0 [8.0–22.2] |
| ORIGINAL NULL EFFECTS | |||
| Numerical results | |||
| Same direction | N/A | N/A | N/A |
| Direction and statistical significance | 4 of 5 (80%) | 7 of 10 (70%) | 11 of 15 (73%) |
| Original ES in replication CI | 4 of 5 (80%) | 7 of 10 (70%) | 11 of 15 (73%) |
| Replication ES in original CI | 5 of 5 (100%) | 7 of 10 (70%) | 12 of 15 (80%) |
| Replication ES in PI (porig) | 5 of 5 (100%) | 7 of 10 (70%) | 12 of 15 (80%) |
| Replication ES≤ original ES | N/A | N/A | N/A |
| Meta-analysis (p > 0.05) | 3 of 5 (60%) | 7 of 10 (70%) | 10 of 15 (67%) |
| Representative images | |||
| Same direction | N/A | N/A | N/A |
| Direction and statistical significance | N/A | 7 of 5 (80%) | 4 of 5 (80%) |
| Original image in replication CI | N/A | 3 of 5 (60%) | 3 of 5 (60%) |
| Replication effect ≤ original image | N/A | N/A | N/A |
| Sample sizes | |||
| Median [IQR] of original | 21.0 [20.0–30.0] | 8.0 [5.0–266] | 15.0 [7.5–31.0] |
| Median [IQR] of replication | 35.0 [30.0–61.0] | 16.0 [7.0–604] | 27.0 [8.0–66.8] |
-
Comparing replication rates for animal experiments (column 2) and non-animal experiments (column 3) according to the seven criteria used in Table 1. For statistical significance, if original effects were interpreted as a positive effect but were not significant at p < 0.05, then they were treated as a positive effect (7 cases), and likewise if they were interpreted as a null effect but were significant at p < 0.05 they were treated as a null effect (3 cases). Standardized mean difference (SMD) effect sizes are reported. CI = 95% confidence interval; PI = 95% prediction interval; ES = effect size; IQR = interquartile range.
Table 5
Effect sizes for animal and non-animal experiments.
| Animal | Non-animal | Total | |
|---|---|---|---|
| ORIGINAL POSITIVE EFFECTS | |||
| Number of outcomes | 25 | 72 | 97 |
| Mean (SD) original experiment effect size | 1.88 (1.61) | 7.63 (14.07) | 6.15 (12.39) |
| Median [IQR] original experiment effect size | 1.61 [0.81–2.30] | 3.65 [2.45–6.43] | 2.96 [1.71–5.70] |
| Mean (SD) replication experiment effect size | 0.19 (0.50) | 1.78 (3.39) | 1.37 (3.01) |
| Median [IQR] replication experiment effect size | 0.25 [−0.06–0.41] | 0.79 [0.20–2.27] | 0.43 [0.15–2.06] |
| Meta-analytic mean (SD) estimate | 0.65 (0.54) | 2.02 (2.77) | 1.66 (2.47) |
| Meta-analytic median [IQR] estimate | 0.83 [0.11–1.05] | 1.06 [0.46–2.79] | 0.92 [0.36–2.43] |
| ORIGINAL NULL EFFECTS | |||
| Number of outcomes | 5 | 10 | 15 |
| Mean (SD) original experiment effect size | 0.34 (0.29) | 0.78 (0.65) | 0.63 (0.59) |
| Median [IQR] original experiment effect size | 0.19 [0.10–0.61] | 0.84 [0.17–1.08] | 0.61 [0.16–0.97] |
| Mean (SD) replication experiment effect size | 0.21 (0.48) | –0.08 (0.78) | 0.02 (0.69) |
| Median [IQR] replication experiment effect size | 0.13 [−0.18–0.65] | 0.16 [−0.27–0.28] | 0.16 [−0.24–0.47] |
| Meta-analytic mean (SD) estimate | 0.21 (0.31) | 0.25 (0.37) | 0.24 (0.34) |
| Meta-analytic median [IQR] estimate | 0.12 [0.04–0.37] | 0.17 [0.10–0.45] | 0.16 [0.06–0.44] |
-
Comparing original and replication effect sizes (means and medians) for animal experiments (column 2) and non-animal experiments (column 3), along with meta-analytic means and medians for the effect size obtained by combining data from the original effects and the replications. SD = standard deviation; IQR = interquartile range.
Table 6
Assessing replications of positive and null results across five criteria.
| Papers | Experiments | Effects | All outcomes | |||||
|---|---|---|---|---|---|---|---|---|
| ORIGINAL POSITIVE RESULTS | ||||||||
| Successful replication on all five criteria | 2 | 11% | 2 | 6% | 13 | 13% | 20 | 18% |
| Success on 4; failure on 1 | 1 | 5% | 5 | 15% | 15 | 15% | 13 | 12% |
| Success on 3; failure on 2 | 3 | 16% | 1 | 3% | 11 | 11% | 13 | 12% |
| Success on 2; failure on 3 | 5 | 26% | 15 | 45% | 22 | 23% | 26 | 23% |
| Success on 1, failure on 4 | 6 | 32% | 6 | 18% | 15 | 15% | 19 | 17% |
| Success on 0, failure on 5 | 2 | 11% | 4 | 12% | 21 | 22% | 21 | 19% |
| Total | 19 | 33 | 97 | 112 | ||||
| ORIGINAL NULL RESULTS | ||||||||
| Successful replication on all five criteria | 5 | 45% | 7 | 58% | 7 | 47% | 6 | 30% |
| Success on 4; failure on 1 | 2 | 18% | 1 | 8% | 2 | 13% | 2 | 10% |
| Success on 3; failure on 2 | 2 | 18% | 2 | 17% | 3 | 20% | 5 | 25% |
| Success on 2; failure on 3 | 2 | 18% | 2 | 17% | 2 | 13% | 2 | 10% |
| Success on 1; failure on 4 | 0 | 0% | 0 | 0% | 0 | 0% | 3 | 15% |
| Success on 0; failure on 5 | 0 | 0% | 0 | 0% | 1 | 7% | 2 | 10% |
| Total | 11 | 12 | 15 | 20 | ||||
-
Five of the criteria we used to assess replications could be used for both positive results and null results. The number of papers, experiments, effects, and outcomes where replications were successful on various numbers of these criteria are shown for positive results (top) and null results (bottom). The five criteria were: (i) direction and statistical significance (p < 0.05); (ii) original effect size in replication 95% confidence interval; (iii) replication effect size in original 95% confidence interval; (iv) replication effect size in original 95% prediction interval; (v) meta-analysis combining original and replication effect sizes is statistically significant (p < 0.05). The data in this table are based on standardized mean difference (SMD) effect sizes. Very similar results are obtained when alternative strategies are used to aggregate the data (see Tables S8–S10 in Supplementary file 1).
Additional files
-
Supplementary file 1
Tables S1–S11.
- https://cdn.elifesciences.org/articles/71601/elife-71601-supp1-v2.docx
-
Transparent reporting form
- https://cdn.elifesciences.org/articles/71601/elife-71601-transrepform1-v2.docx
Download links
A two-part list of links to download the article, or parts of the article, in various formats.
Downloads (link to download the article as PDF)
Open citations (links to open the citations from this article in various online reference manager services)
Cite this article (links to download the citations from this article in formats compatible with various reference manager tools)
Investigating the replicability of preclinical cancer biology
eLife 10:e71601.
https://doi.org/10.7554/eLife.71601


