Endoplasmic reticulum tubules limit the size of misfolded protein condensates
- Department of Cellular and Molecular Medicine, University of California at San Diego, United States
- Division of Biological Sciences, University of California at San Diego, United States
- Nikon Imaging Center, University of California at San Diego, United States
- Department of Neurosciences, University of California at San Diego, United States
- Department of Pediatrics, Pediatric Diabetes Research Center, University of California at San Diego, United States
- Division of Biological Sciences and Center for Structural & Functional Neuroscience, University of Montana, United States
Figures
Figure 1 with 1 supplement
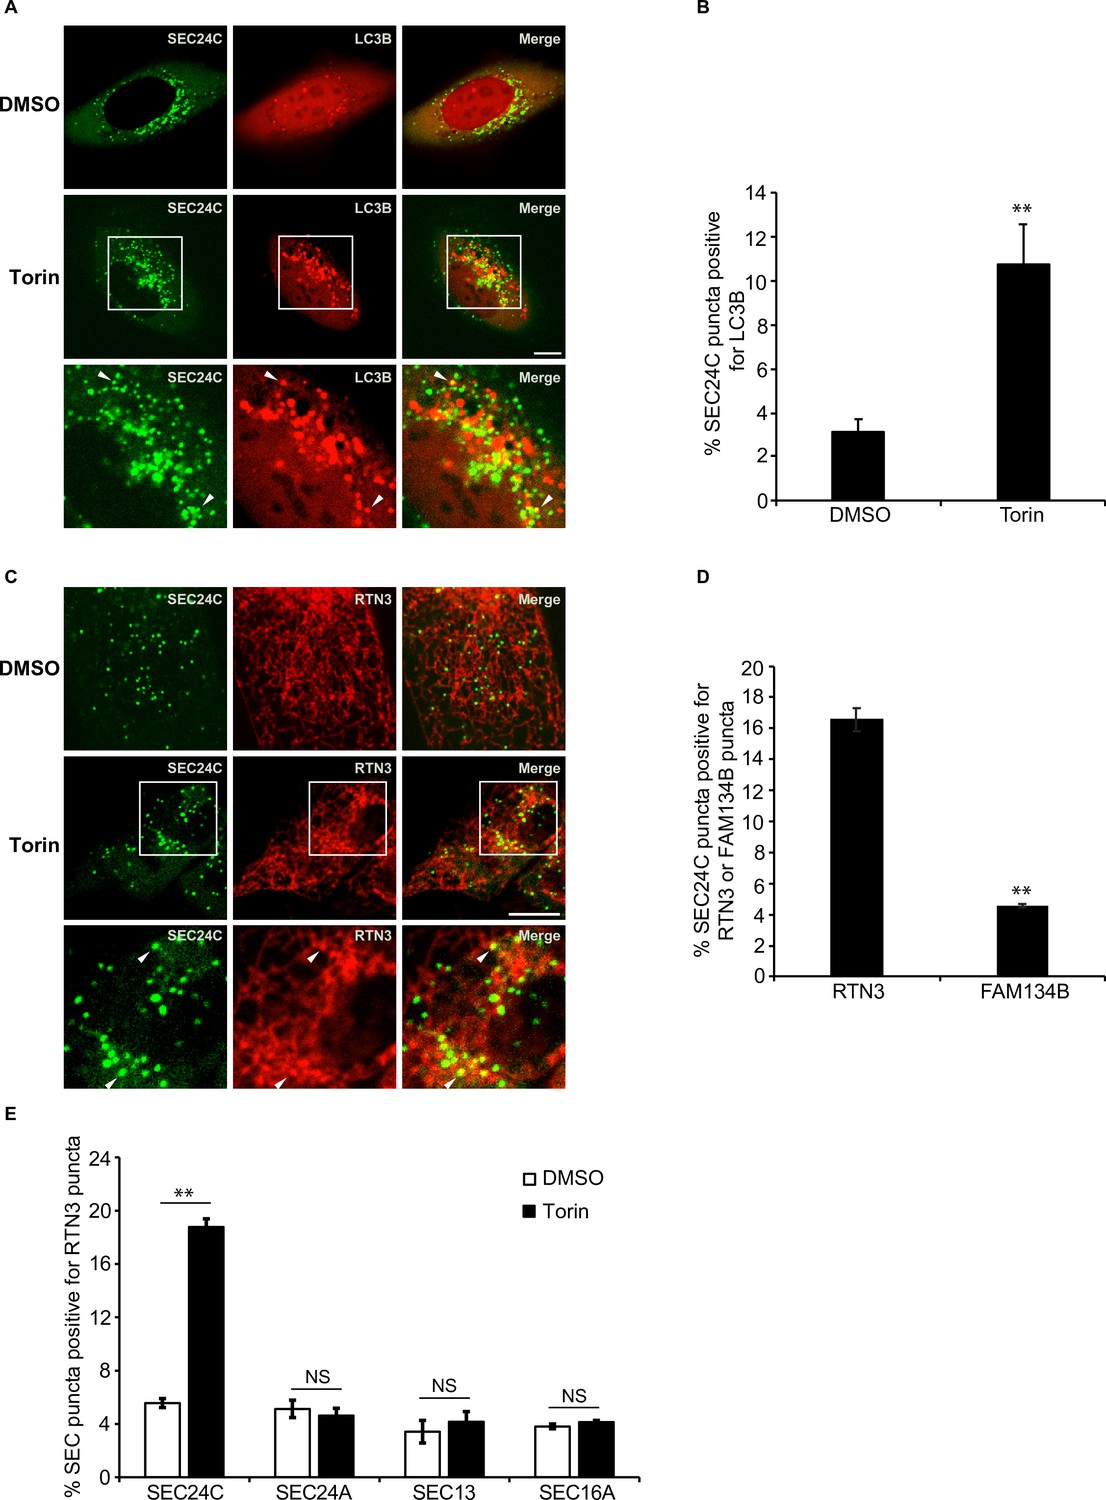
Torin induces the colocalization of SEC24C with LC3B and RTN3, but not FAM134B.
(A) U2OS cells expressing EYFP-SEC24C and mCherry-LC3B were treated with Torin 2 for 3.5 hr and examined by confocal microscopy. Arrowheads in the inset indicate SEC24C puncta colocalizing with LC3B. (B) Bar graph showing the % of EYFP-SEC24C puncta colocalizing with mCherry-LC3B puncta for the data shown in (A). (C) Cells expressing mCherry-RTN3 and EYFP-SEC24C were treated with Torin 2 for 3.5 hr. Representative confocal images are shown. Arrowheads in the inset indicate EYFP-SEC24C puncta colocalizing with mCherry-RTN3. (D) Bar graph showing the % of EYFP-SEC24C puncta colocalizing with mCherry-RTN3 or FAM134B-mTurquoise puncta in transiently transfected cells. (E) Cells stably expressing mCherry-RTN3 were transfected with EYFP-SEC24C, mAaus0.5-SEC24A, SEC13-GFP, or EGFP-SEC16A and treated with Torin 2 for 3.5 hr. The % of SEC puncta that colocalized with mCherry-RTN3 puncta was quantified. Scale bars in (A) and (C), 10 µm. Error bars in (B), (D), and (E) represent SEM; n = 3 independent experiments. Approximately 20–30 cells/experiment were analyzed. NS: not significant (p≥0.05); **p<0.01, Student’s unpaired t-test.
Figure 1—figure supplement 1

SEC24C is delivered to lysosomes in the presence of Torin 2.
(A) U2OS cells expressing EYFP-SEC24C and LAMP1-mCherry were treated with Torin 2 or Torin 2 plus MRT68921 for 6 hr. Bafilomycin A1 (Baf) was added during the last 90 min of treatment. Representative confocal images are shown. Arrowheads in the inset show SEC24C in the LAMP1 structures. (B) Quantitation of EYFP-SEC24C in LAMP1-mCherry structures for the data shown in (A). The DMSO control was set to 1.0. (C) SEC24C did not colocalize with FAM134B in Torin-treated cells. Cells transiently expressing FAM134B-mTurquoise and EYFP-SEC24C were treated with Torin 2 for 3.5 hr. Quantitation is shown in Figure 1D. (D) Neither SEC24A, SEC13, nor SEC16A colocalized with RTN3 in Torin 2-treated cells. Cells stably expressing mCherry-RTN3 were transfected with mAaus0.5-SEC24A, SEC13-GFP, or EGFP-SEC16A and treated with DMSO or Torin 2 for 3.5 hr before they were analyzed by confocal microscopy. Quantitation is shown in Figure 1E. Scale bars in (A), (C), and (D), 10 µm. Error bars in (B) represent SEM; n = 3 independent experiments. Approximately 20–30 cells were quantitated in each experiment. NS: not significant (p≥0.05); *p<0.05, Student’s unpaired t-test.
Figure 2 with 1 supplement
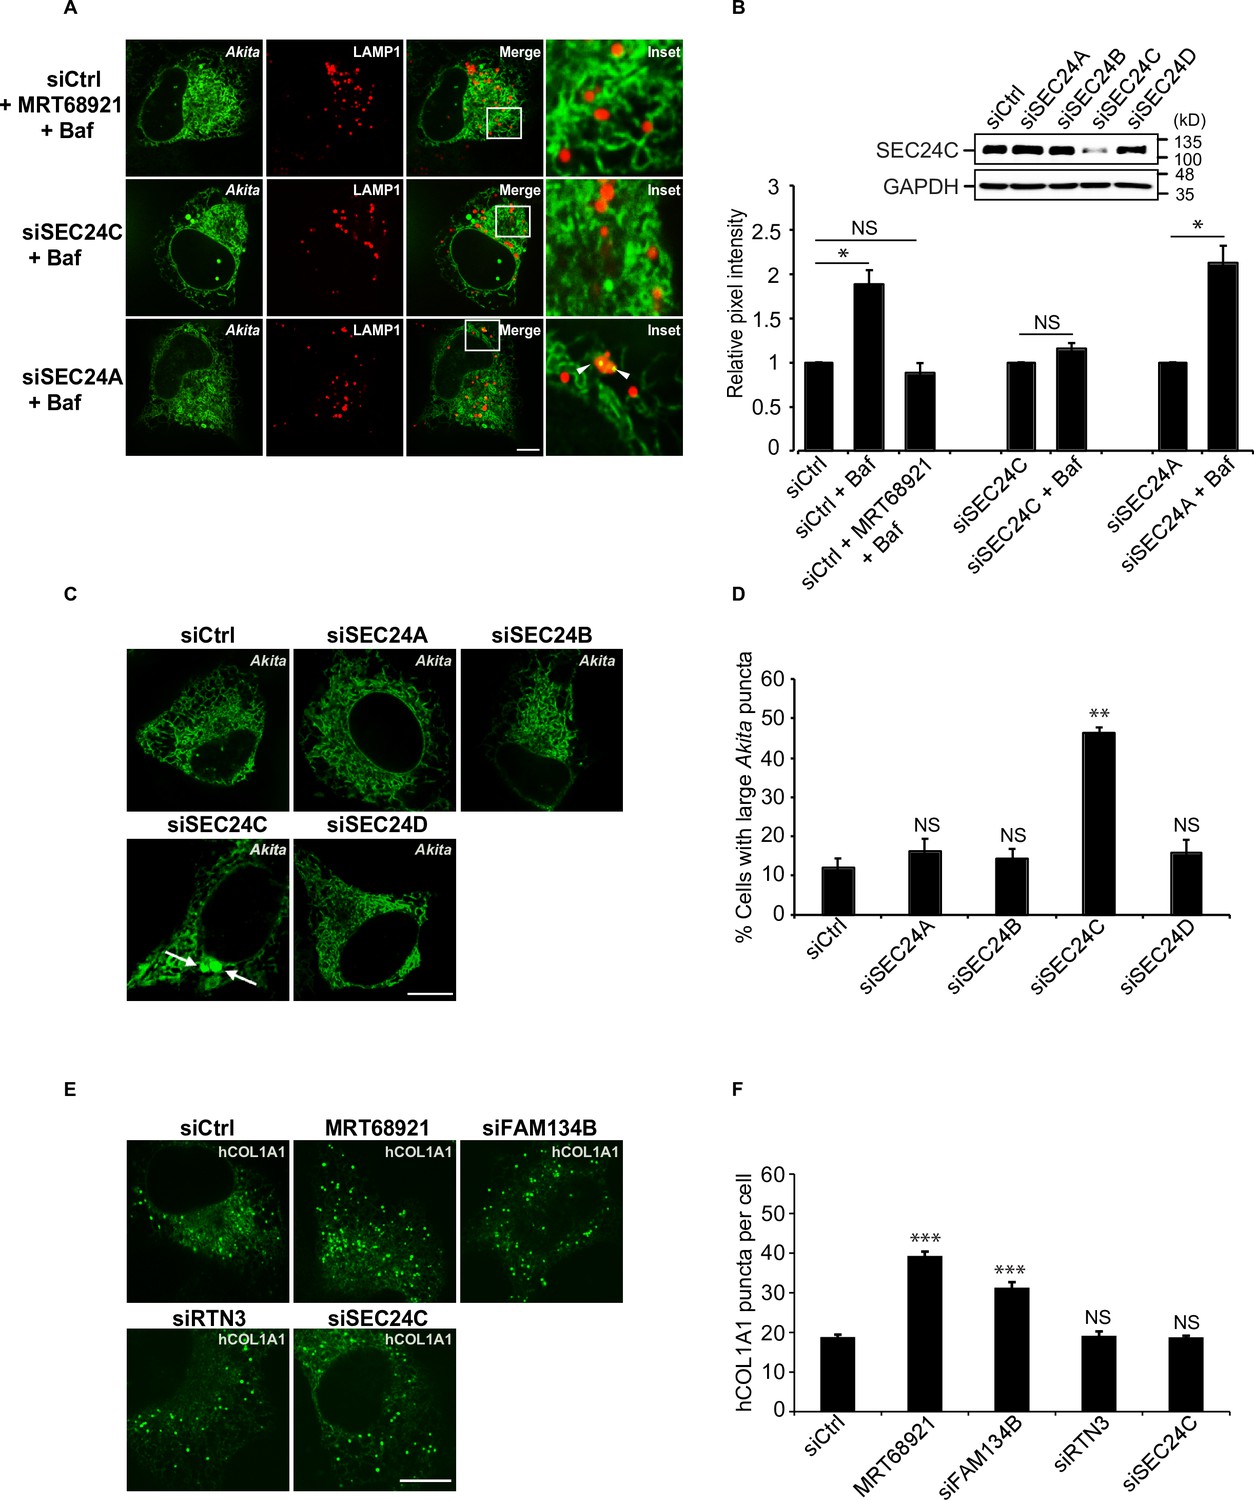
Akita, but not hCOL1A1, accumulates in the endoplasmic reticulum (ER) as large puncta in SEC24C-depleted cells.
A) U2OS cells expressing Akita-sfGFP and LAMP1-mCherry were depleted of SEC24C or SEC24A by siRNA, and treated with bafilomycin A1 (Baf) before imaging. Arrowheads in the inset indicate Akita in the LAMP1 structures. (B) Quantitation of Akita-sfGFP in LAMP1-mCherry structures for the data shown in (A). The DMSO control for each condition was set to 1.0. The relative pixel intensity for each condition is the mean intensity of Akita-sfGFP in the pixels that overlap with LAMP1. In the top-right corner, the specificity of the SEC24C knockdown is shown. Cells were depleted of the different SEC24 isoforms by siRNA and immunoblotted for SEC24C. (C) Cells were depleted of the different SEC24 isoforms and analyzed for the accumulation of large Akita puncta (≥0.5 µm2). Arrows point to large Akita puncta. (D) Bar graph showing the % of cells with large Akita puncta for the data shown in (C). Large Akita puncta only accumulated in siSEC24C cells; however, the % siSEC24C cells with puncta of all sizes (51.7 ± 3.3%) appeared to be roughly the same as the siCtrl (55.3 ± 1.1%). (E) Cells expressing EGFP-hCOL1A1 were treated for 3.5 hr with MRT68921 or depleted of FAM134B, RTN3, or SEC24C by siRNA and analyzed for the accumulation of EGFP-hCOL1A1 puncta. (F) Bar graph showing EGFP-hCOL1A1 puncta per cell for the data shown in (E). Puncta of all sizes were quantitated. Scale bars in (A), (C), and (E), 10 µm. Error bars in (B), (D), and (F) represent SEM; n = 3–4 independent experiments, n = 20–40 cells/experiment. NS: not significant (p≥0.05); *p<0.05, **p<0.01; ***p<0.001, Student’s unpaired t-test.
-
Figure 2—source data 1
Uncropped blots for Figure 2B.
- https://cdn.elifesciences.org/articles/71642/elife-71642-fig2-data1-v2.zip
Figure 2—figure supplement 1

The delivery of Akita to lysosomes requires SEC24C.
(A) Cells expressing Akita-sfGFP and LAMP1-mCherry were treated with DMSO or Baf and examined by confocal microscopy. Arrowheads in the inset indicate Akita in the LAMP1 structures. Quantitation is shown in Figure 2B. (B) Cells were depleted of the different SEC24 isoforms by siRNA, and the specificity of the knockdowns was analyzed by immunoblotting. (C) RTN3 and SEC24C act on the same pathway. Cells expressing Akita-sfGFP were depleted of either RTN3, SEC24C, or RTN3 and SEC24C by siRNA and analyzed for the accumulation of large Akita puncta by confocal microscopy (top). Arrows point to large Akita puncta. Bar graph (bottom) showing the % of cells with large Akita-sfGFP puncta (≥0.5 µm2) for the data shown above. (D) Immunoblot to confirm the knockdown of RTN3 and SEC24C in siRNA-treated cells. (E) A representative control cell showing a large EGFP-hCOL1A1 punctum. The arrow points to a punctum that is ≥0.5 µm2 in size. (F) Large EGFP-hCOL1A1 puncta did not accumulate in MRT68921 treated cells or cells depleted of FAM134B, RTN3, or SEC24C by siRNA. Bar graph shows the % of cells with large EGFP-hCOL1A1 puncta (≥0.5 µm2) in the indicated samples (bottom). An immunoblot to confirm the knockdown of FAM134B is shown (top). Scale bars in (A), (C), and (E), 10 µm. Error bars in (C, F) represent SEM; n = 3 independent experiments. Approximately 20–30 cells were analyzed in each experiment. NS: not significant (p≥0.05); *p<0.05, Student’s unpaired t-test.
-
Figure 2—figure supplement 1—source data 1
Uncropped blots for Figure 2—figure supplement 1B.
- https://cdn.elifesciences.org/articles/71642/elife-71642-fig2-figsupp1-data1-v2.zip
-
Figure 2—figure supplement 1—source data 2
Uncropped blots for Figure 2—figure supplement 1D.
- https://cdn.elifesciences.org/articles/71642/elife-71642-fig2-figsupp1-data2-v2.zip
-
Figure 2—figure supplement 1—source data 3
Uncropped blots for Figure 2—figure supplement 1F.
- https://cdn.elifesciences.org/articles/71642/elife-71642-fig2-figsupp1-data3-v2.zip
Figure 3 with 2 supplements
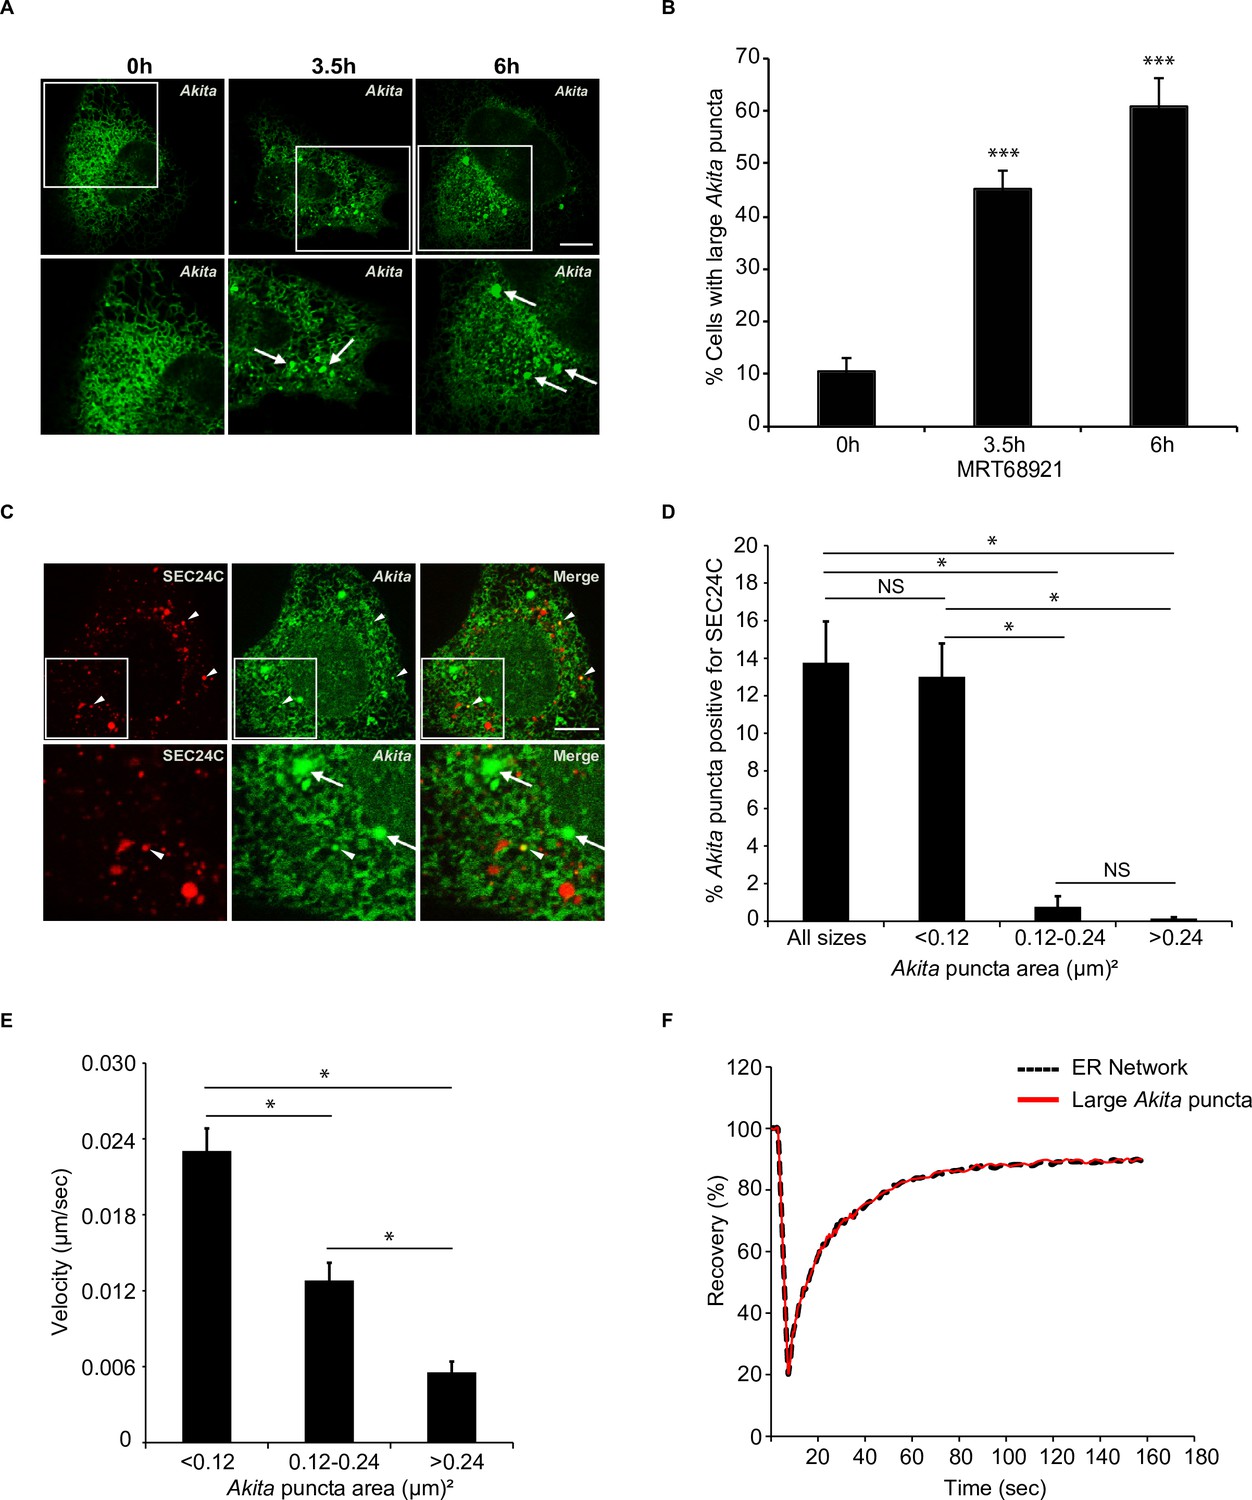
Highly mobile small Akita puncta colocalize with SEC24C.
A) U2OS cells expressing Akita-sfGFP were treated with MRT68921 for the indicated times and examined for the accumulation of large puncta (≥0.5 µm2). Arrows mark large Akita puncta. (B) Bar graph showing the % of cells with large Akita puncta for the data shown in (A). (C) Cells expressing Akita-sfGFP and mCherry-SEC24C were treated with MRT68921 for 3.5 hr and imaged. Arrowheads show Akita puncta colocalizing with SEC24C, arrows indicate Akita puncta that do not colocalize with SEC24C. (D) Bar graph for the data shown in (C) of % Akita-sfGFP puncta of different sizes that colocalize with mCherry-SEC24C puncta. (E) Cells expressing Akita-sfGFP were treated with MRT68921 for 3.5 hr, and the velocity of differently sized puncta was determined. (F) Cells expressing Akita-sfGFP were treated with MRT68921 for 3.5 hr followed by fluorescence recovery after photobleaching (FRAP) analysis of Akita puncta (average size; ≥ 0.32 µm2) and the endoplasmic reticulum network. Scale bars in (A) and (C), 10 µm. Error bars in (B), (D), and (E) represent SEM; n = 3 independent experiments. Approximately 30–40 cells were examined/experiment (B), 20–30 cells/experiment (D), 35–40 puncta/experiment (E), and 20 puncta/experiment (F). NS: not significant (p≥0.05); *p<0.05, ***p<0.001, Student’s unpaired t-test.
Figure 3—figure supplement 1
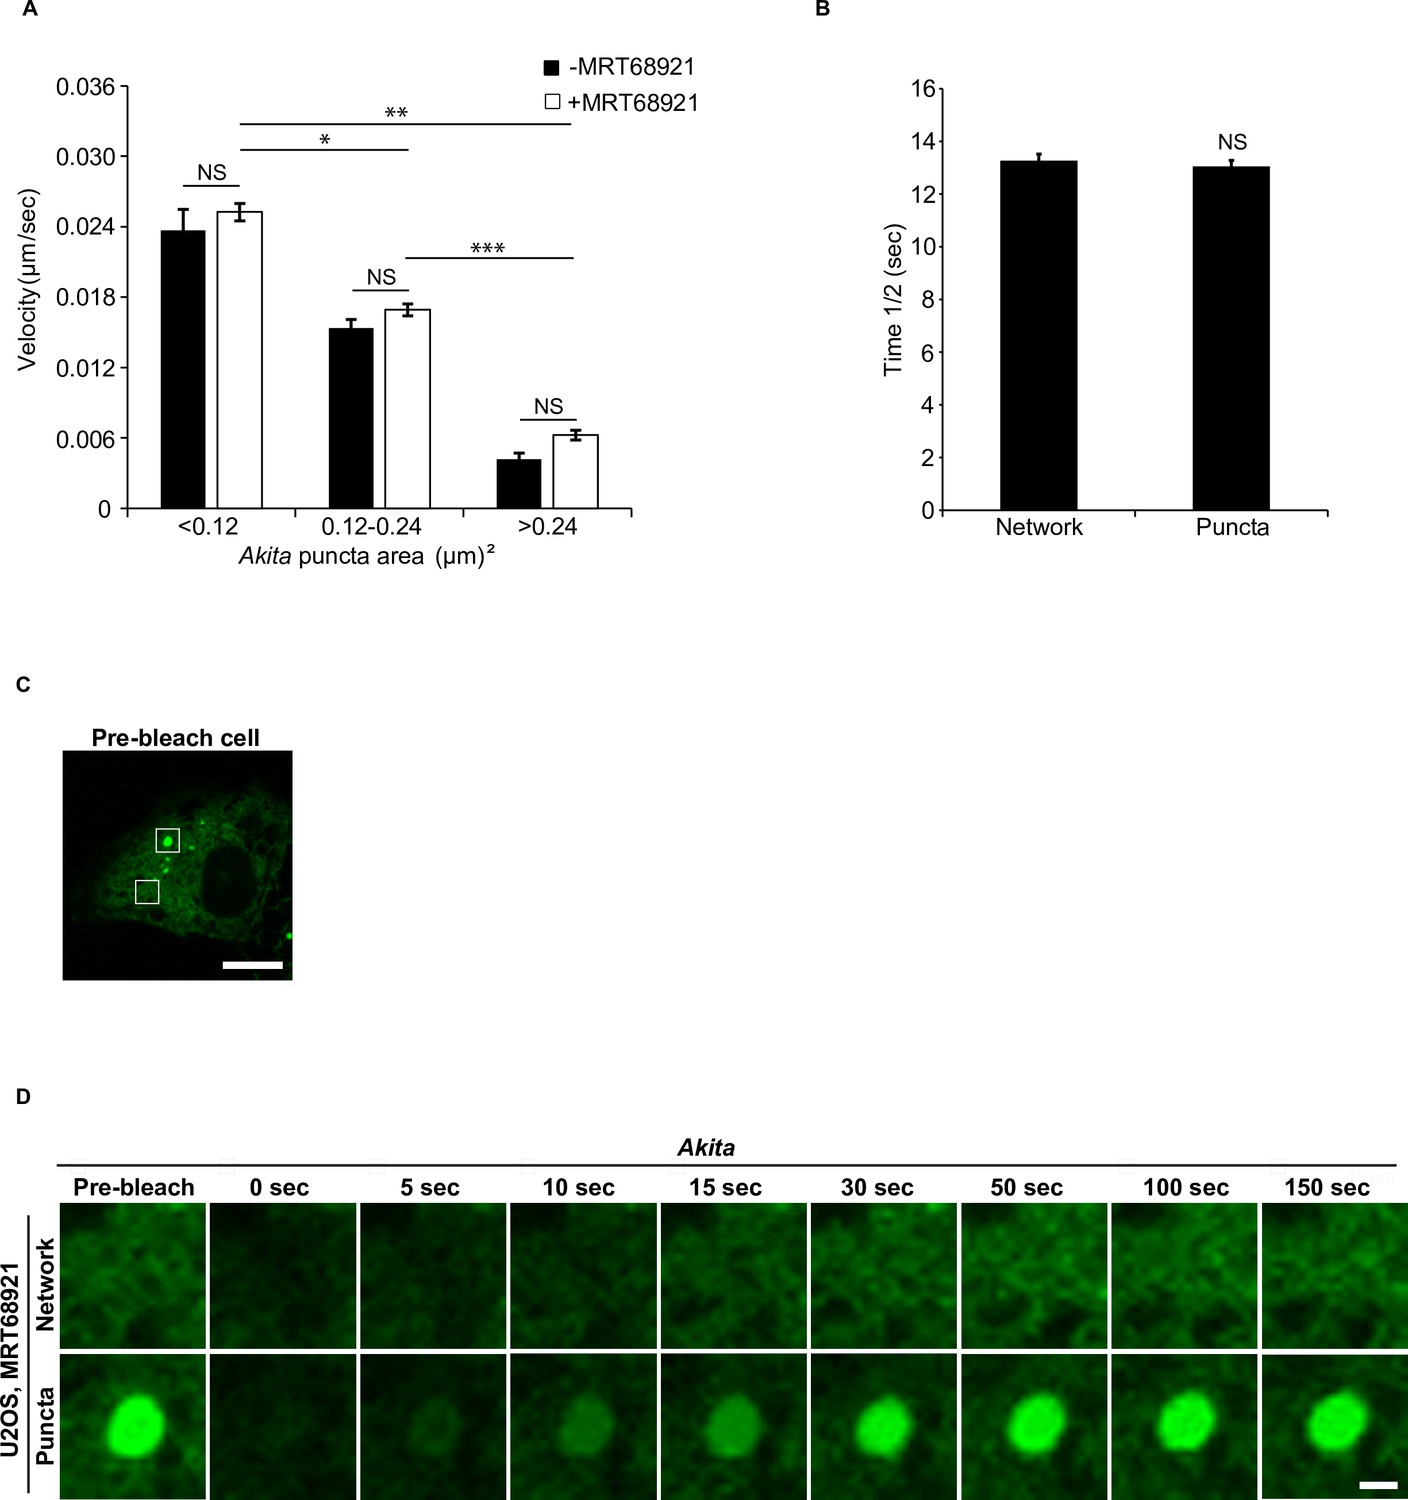
The small Akita puncta are highly mobile.
(A) Cells expressing Akita-sfGFP were treated with or without MRT68921 for 3.5 hr, and the velocity of the Akita puncta was analyzed by live-cell confocal imaging. (B) The half time of fluorescence recovery (time 1/2) after photobleaching for the data shown in Figure 3F. (C) A cell showing the Akita puncta (top box) and endoplasmic reticulum (ER) network (bottom box) that was photobleached in (D). (D) Representative confocal images of the region that was analyzed by fluorescence recovery after photobleaching (FRAP) for the data shown in Figure 3F. Scale bar in (C), 10 µm. Scale bar in (D), 1 µm. Error bars in (A) represent SEM and (B) represent SD, n = 3 independent experiments. Approximately 35–40 puncta were examined/experiment for (A) and 20 puncta/experiment for (B). NS: not significant (p≥0.05); *p<0.05, **p<0.01, ***p<0.001, Student’s unpaired t-test.
Figure 3—figure supplement 2
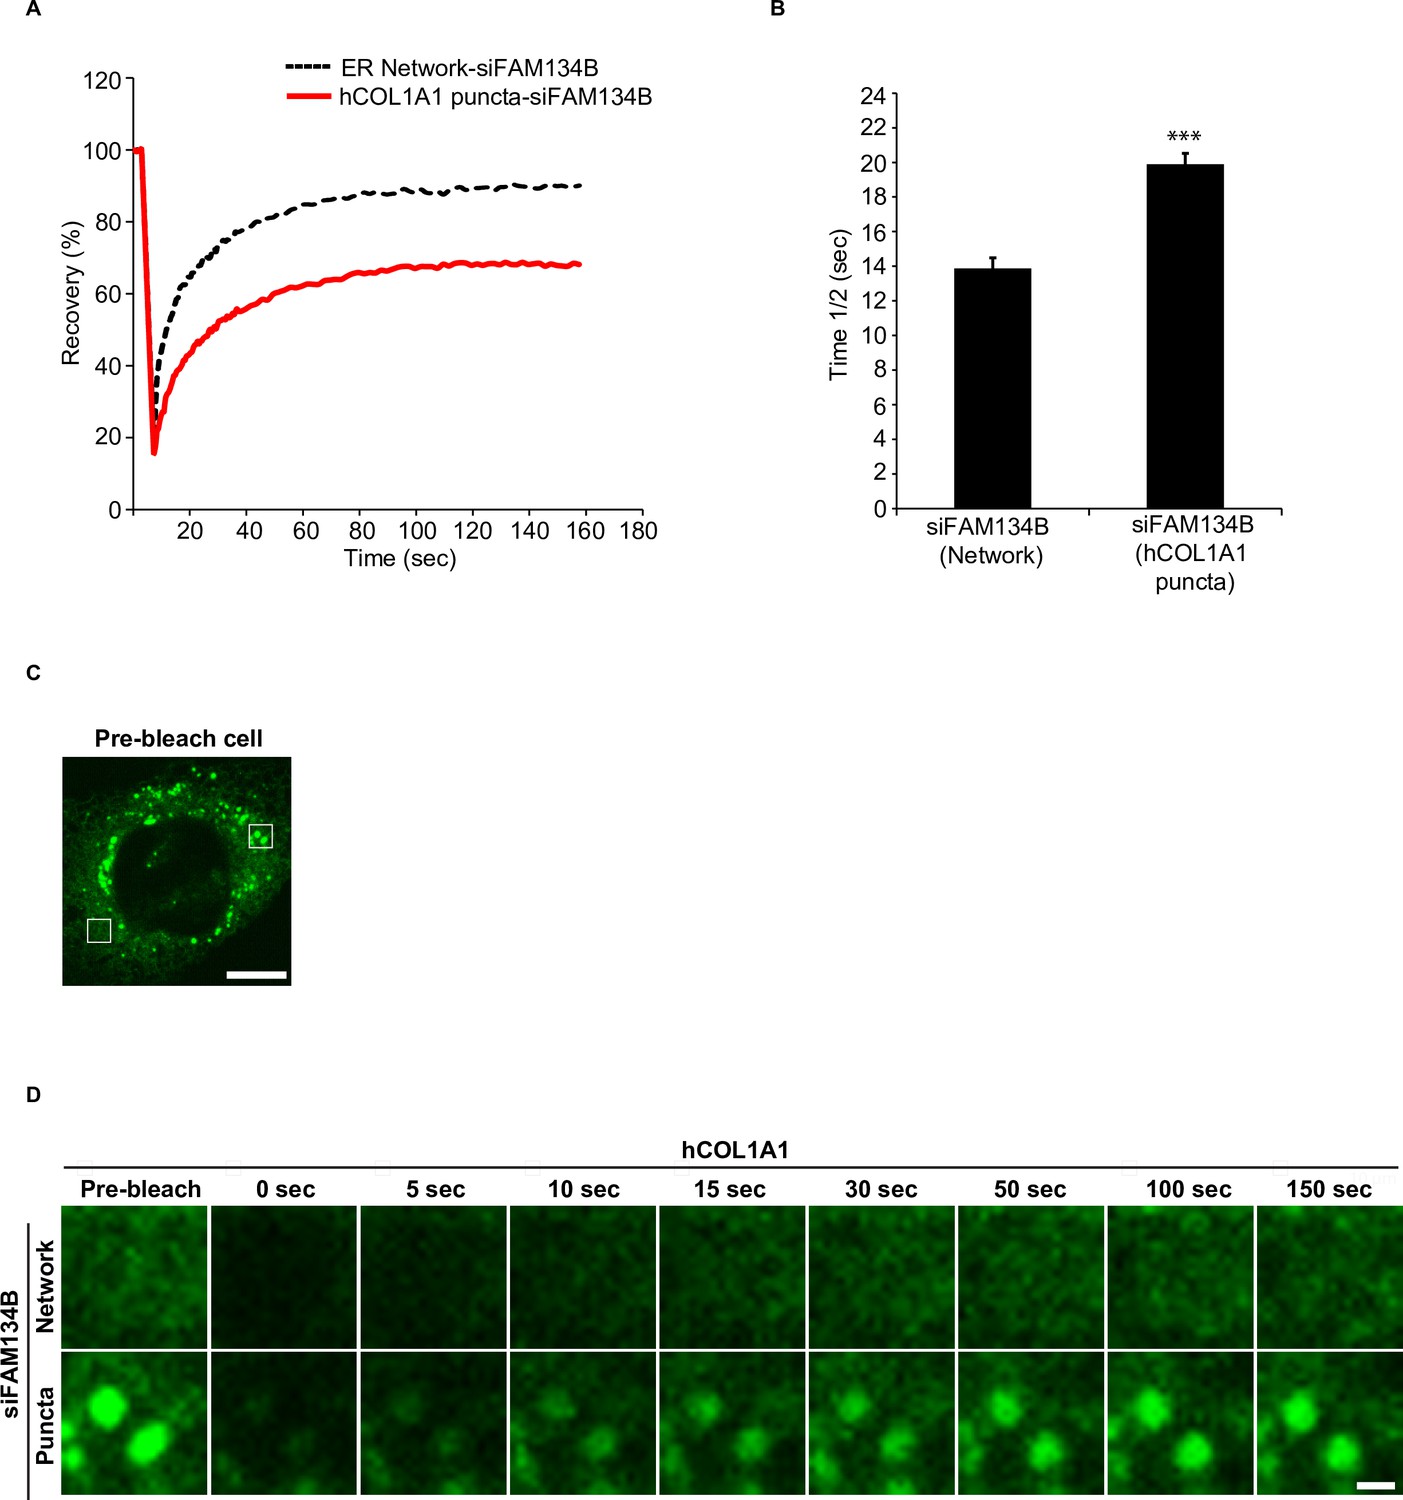
hCOL1A1 puncta do not rapidly recover after photobleaching.
(A) Fluorescence recovery after photobleaching (FRAP) analysis of the endoplasmic reticulum (ER) network and a region of the ER enriched in hCOL1A1 puncta in siFAM134B-depleted cells. (B) The half time of fluorescence recovery (time 1/2) after photobleaching for the data shown in (A). (C) A cell showing a region of the ER enriched in hCOL1A1 puncta (right box) and the ER network (left box) that was photobleached in (D). (D) Representative confocal images of the region that was analyzed by FRAP for the data shown in (A). Scale bar in (C), 10 µm. Scale bar in (D), 1 µm. Error bars in (B) represents SD, n = 3 independent experiments. Approximately 20–30 cells/experiment were analyzed. ***p<0.001, Student’s unpaired t-test.
Figure 4 with 3 supplements
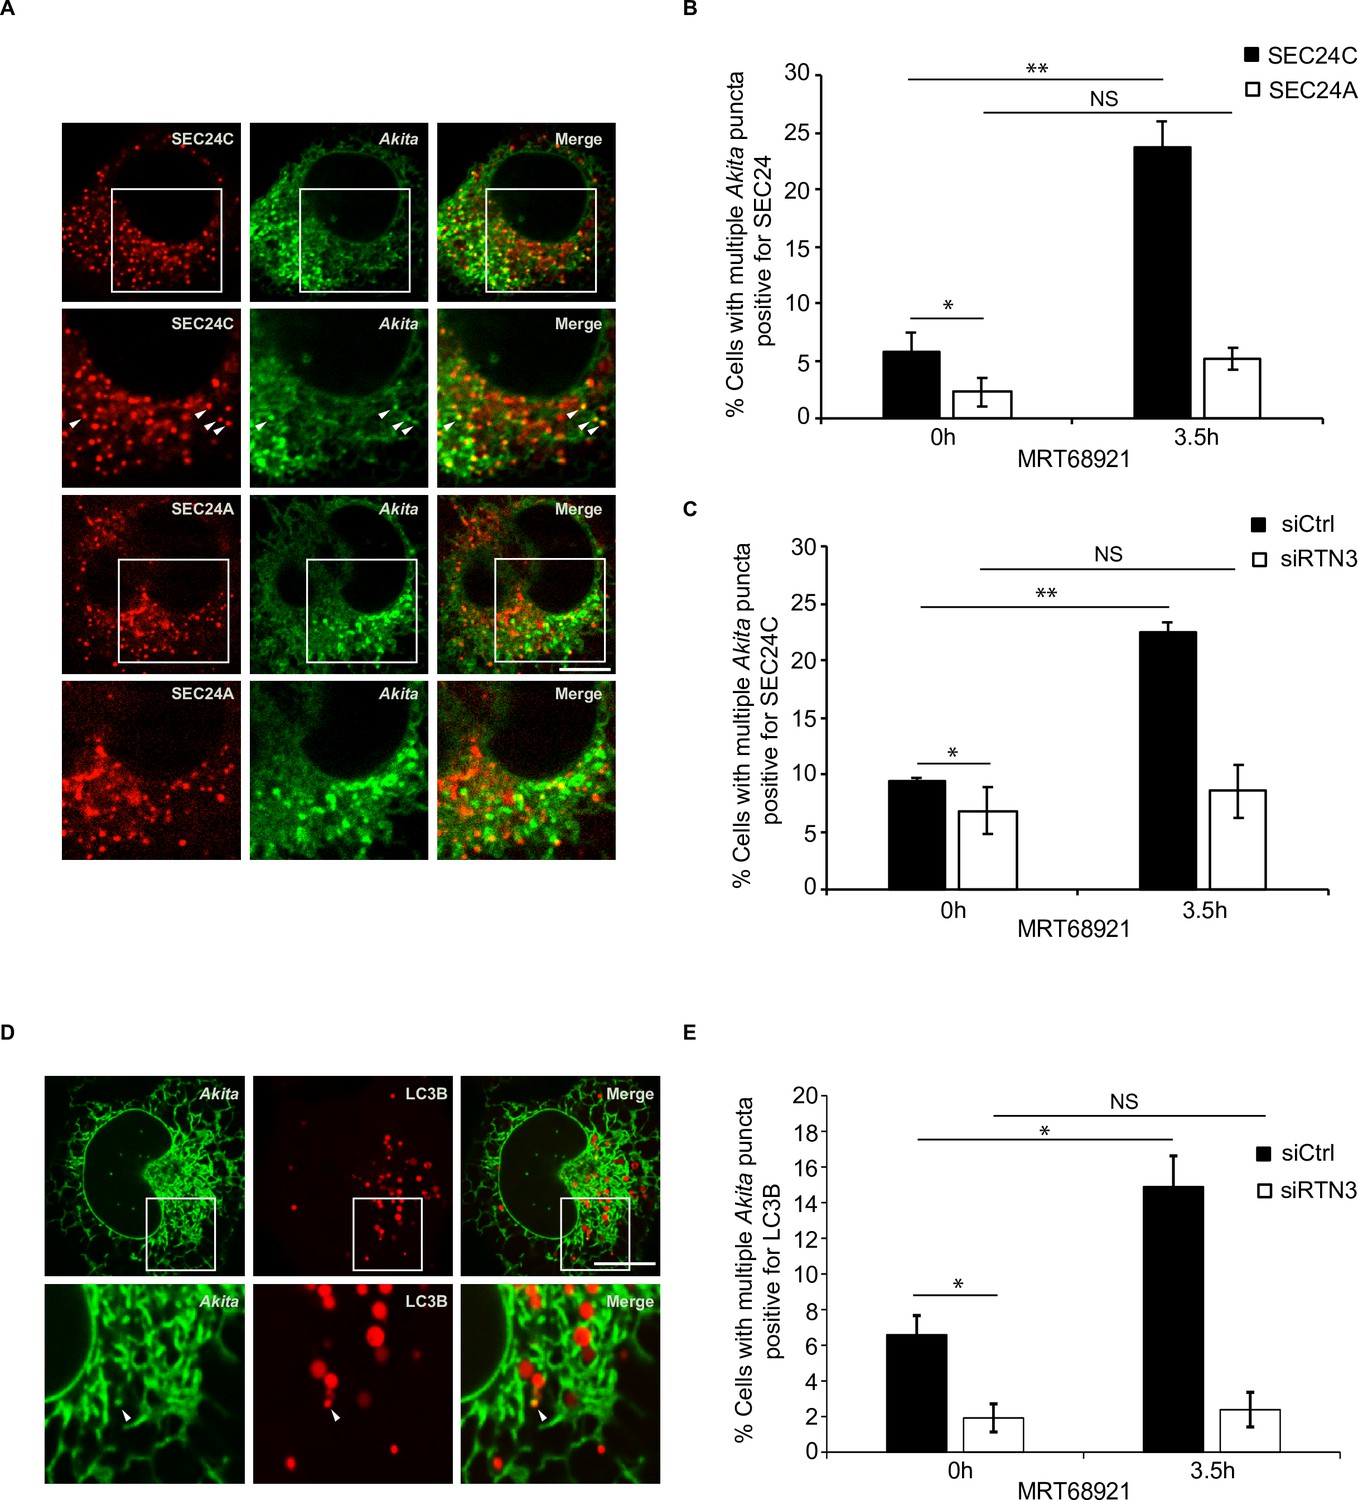
Disrupting autophagy leads to the accumulation of Akita puncta that colocalize with SEC24C, and LC3B, but not SEC24A.
(A) U2OS cells expressing Akita-sfGFP and mCherry-SEC24C or mCherry-SEC24A were treated with MRT68921 for 3.5 hr. Arrowheads in the inset indicate Akita puncta colocalizing with SEC24C. (B) Bar graph showing the % of cells with multiple Akita-sfGFP puncta colocalizing with mCherry-SEC24C or mCherry-SEC24A puncta 0 or 3.5 hr after treatment with MRT68921. (C) Cells expressing Akita-sfGFP and mCherry-SEC24C were depleted of RTN3 by RNAi and treated with MRT68921 for 0 or 3.5 hr. The % of cells showing multiple Akita-sfGFP puncta colocalizing with mCherry-SEC24C puncta was quantified at the indicated time points. (D) Cells expressing Akita-sfGFP and mCherry-LC3B were depleted of RTN3 and treated with MRT68921 for 0 or 3.5 hr. A representative image for control cells (3.5 hr) is shown. Arrowhead in the inset shows an Akita puncta colocalizing with LC3B. (E) Bar graph showing the % of cells with multiple Akita-sfGFP puncta colocalizing with mCherry-LC3B puncta for the data shown in (D). Scale bars in (A) and (D), 10 µm. Error bars in (B), (C), and (E) represent SEM; n = 3 independent experiments. Approximately 20–30 cells/experiment were examined. NS: not significant (p≥0.05); *p<0.05, **p<0.01, Student’s unpaired t-test.
Figure 4—figure supplement 1
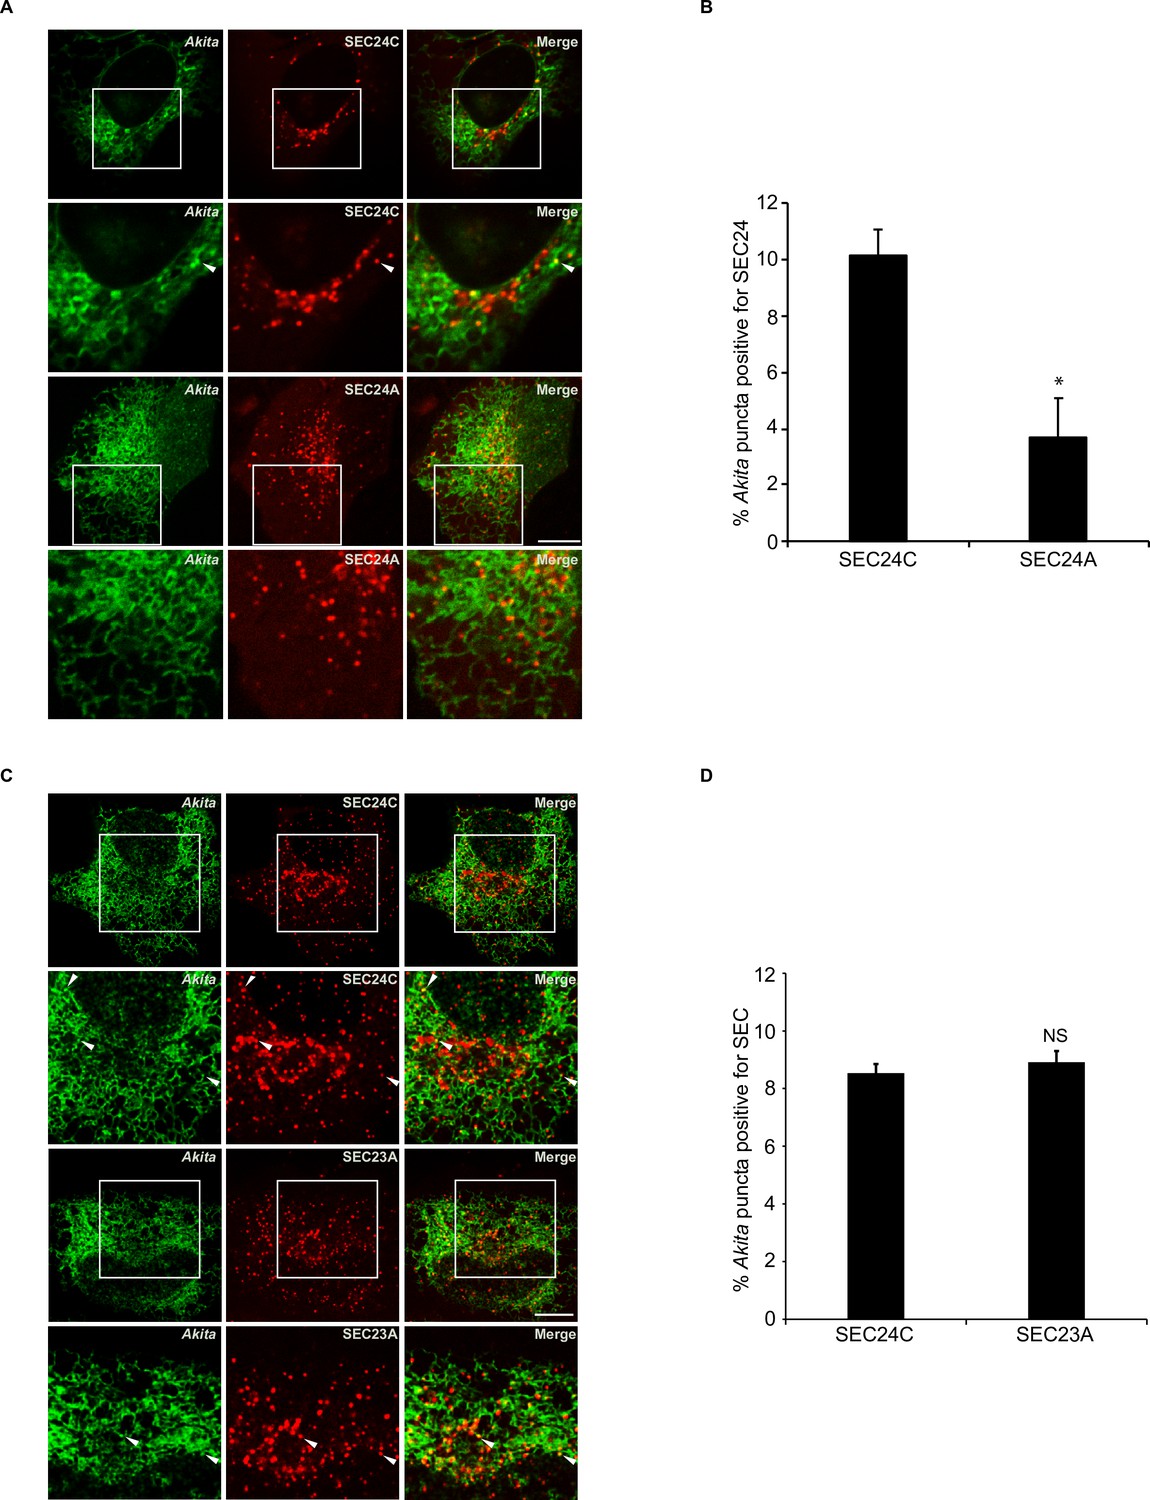
Akita also colocalizes with SEC23A.
(A) Representative confocal images for the data at 0 hr in Figure 4B. Arrowheads in the inset indicate Akita puncta colocalizing with SEC24C. (B) Bar graph showing the % of Akita-sfGFP puncta colocalizing with mCherry-SEC24C or mCherry-SEC24A puncta for the data in Figure 4B at 0 hr. (C) Akita colocalized with SEC24C and SEC23A. Cells expressing Akita-sfGFP and mCherry-SEC24C or mRuby-SEC23A were analyzed by confocal microscopy. Arrowheads in the inset indicate Akita puncta colocalizing with SEC24C (top) or SEC23A (bottom). (D) Bar graph showing the % of Akita-sfGFP puncta colocalizing with mCherry-SEC24C or mRuby-SEC23A puncta for the data shown in (C). Scale bars in (A) and (C), 10 µm. Error bars in (B) and (D) represent SEM; n = 3 independent experiments. Approximately 20–30 cells/experiment were analyzed. NS: not significant (p≥0.05); *p<0.05, Student’s unpaired t-test.
Figure 4—figure supplement 2
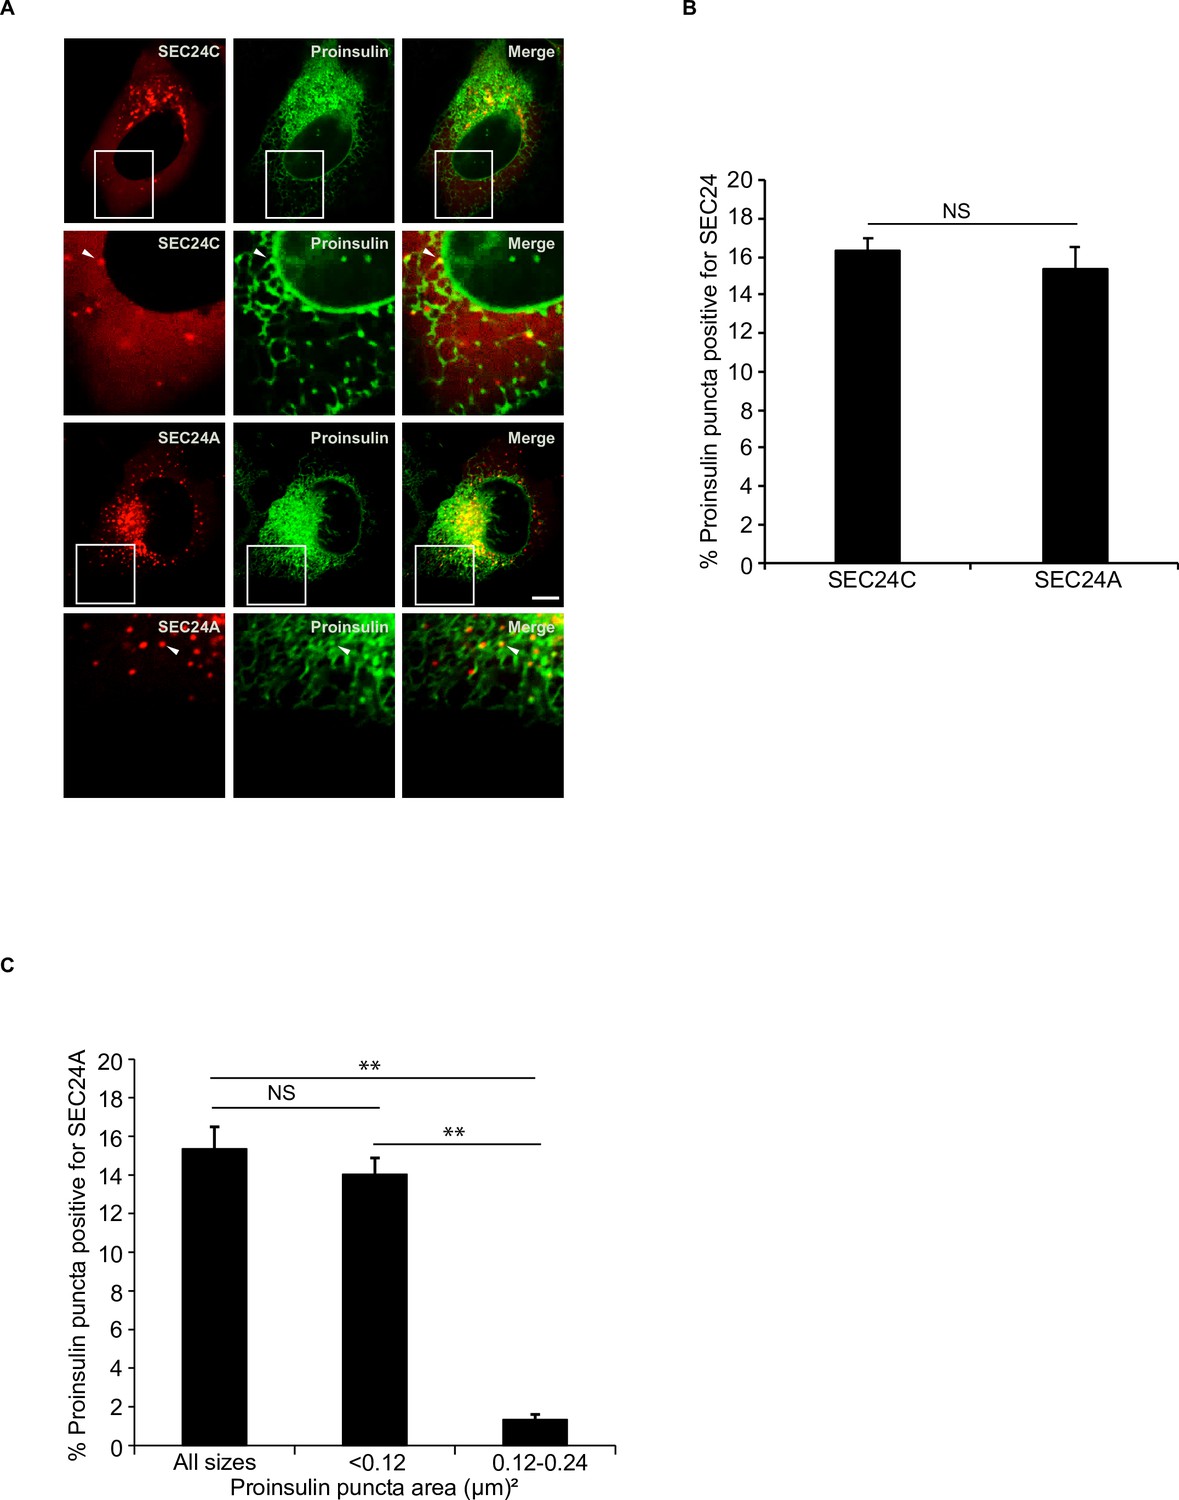
Proinsulin colocalizes with both SEC24C and SEC24A.
(A) Cells expressing proinsulin-sfGFP and mCherry-SEC24C or mCherry-SEC24A were examined by confocal microscopy. Arrowheads indicate proinsulin puncta colocalizing with SEC24C or SEC24A. (B) Bar graph showing the % of proinsulin-sfGFP puncta colocalizing with mCherry-SEC24C or mCherry-SEC24A puncta for the data shown in (A). (C) Bar graph showing the % of proinsulin-sfGFP puncta of different sizes that colocalize with mCherry-SEC24A puncta for the data shown in (A). Scale bar in (A), 10 µm. Error bars in (B) and (C) represent SEM; n = 3 independent experiments. Approximately 20–30 cells/experiment were examined. NS: not significant (p≥0.05); **p<0.01, Student’s unpaired t-test.
Figure 4—figure supplement 3
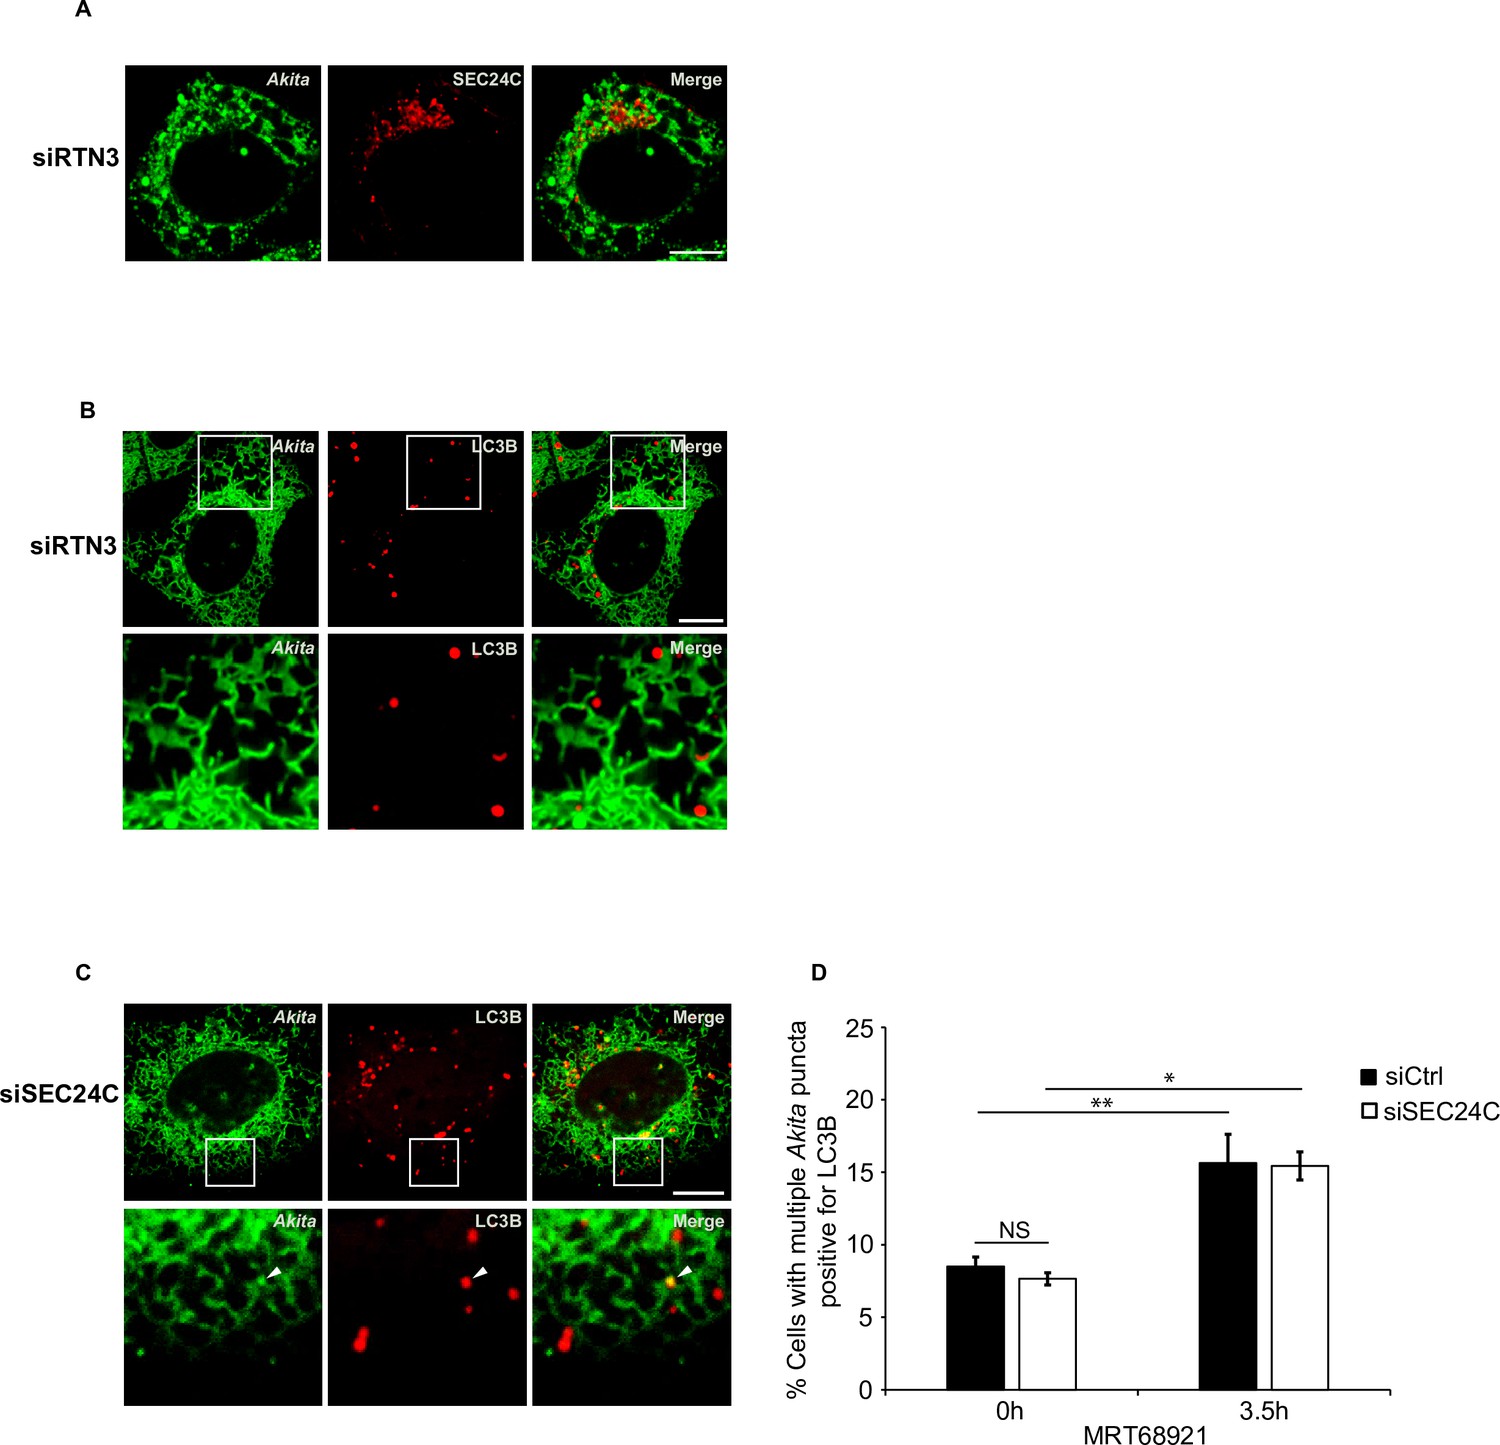
Akita fails to colocalize with SEC24C, and LC3B, in the absence of RTN3.
(A) Cells expressing Akita-sfGFP and mCherry-SEC24C were depleted of RTN3 by siRNA and treated with MRT68921 for 3.5 hr. A representative confocal image is shown. Quantitation is shown in Figure 4C. (B) Cells expressing Akita-sfGFP and mCherry-LC3B were depleted of RTN3 by siRNA and treated with MRT68921 for 3.5 hr. The quantitation of data is shown in Figure 4E. (C) SEC24C is not required for the colocalization of Akita with LC3B. Cells expressing Akita-sfGFP and mCherry-LC3B were depleted of SEC24C by siRNA and treated with MRT68921 for 3.5 hr. Arrowheads in the inset point to Akita puncta colocalizing with LC3B. (D) Bar graph representing the % of cells with multiple Akita-sfGFP puncta colocalizing with mCherry-LC3B puncta for the data shown in (C). Scale bars in (A–C), 10 µm. Error bars in (D) represent SEM; n = 3 independent experiments. Approximately 15–30 cells/experiment were quantitated. NS: not significant (p≥0.05); *p<0.05, **p<0.01, Student’s unpaired t-test.
Figure 5 with 9 supplements
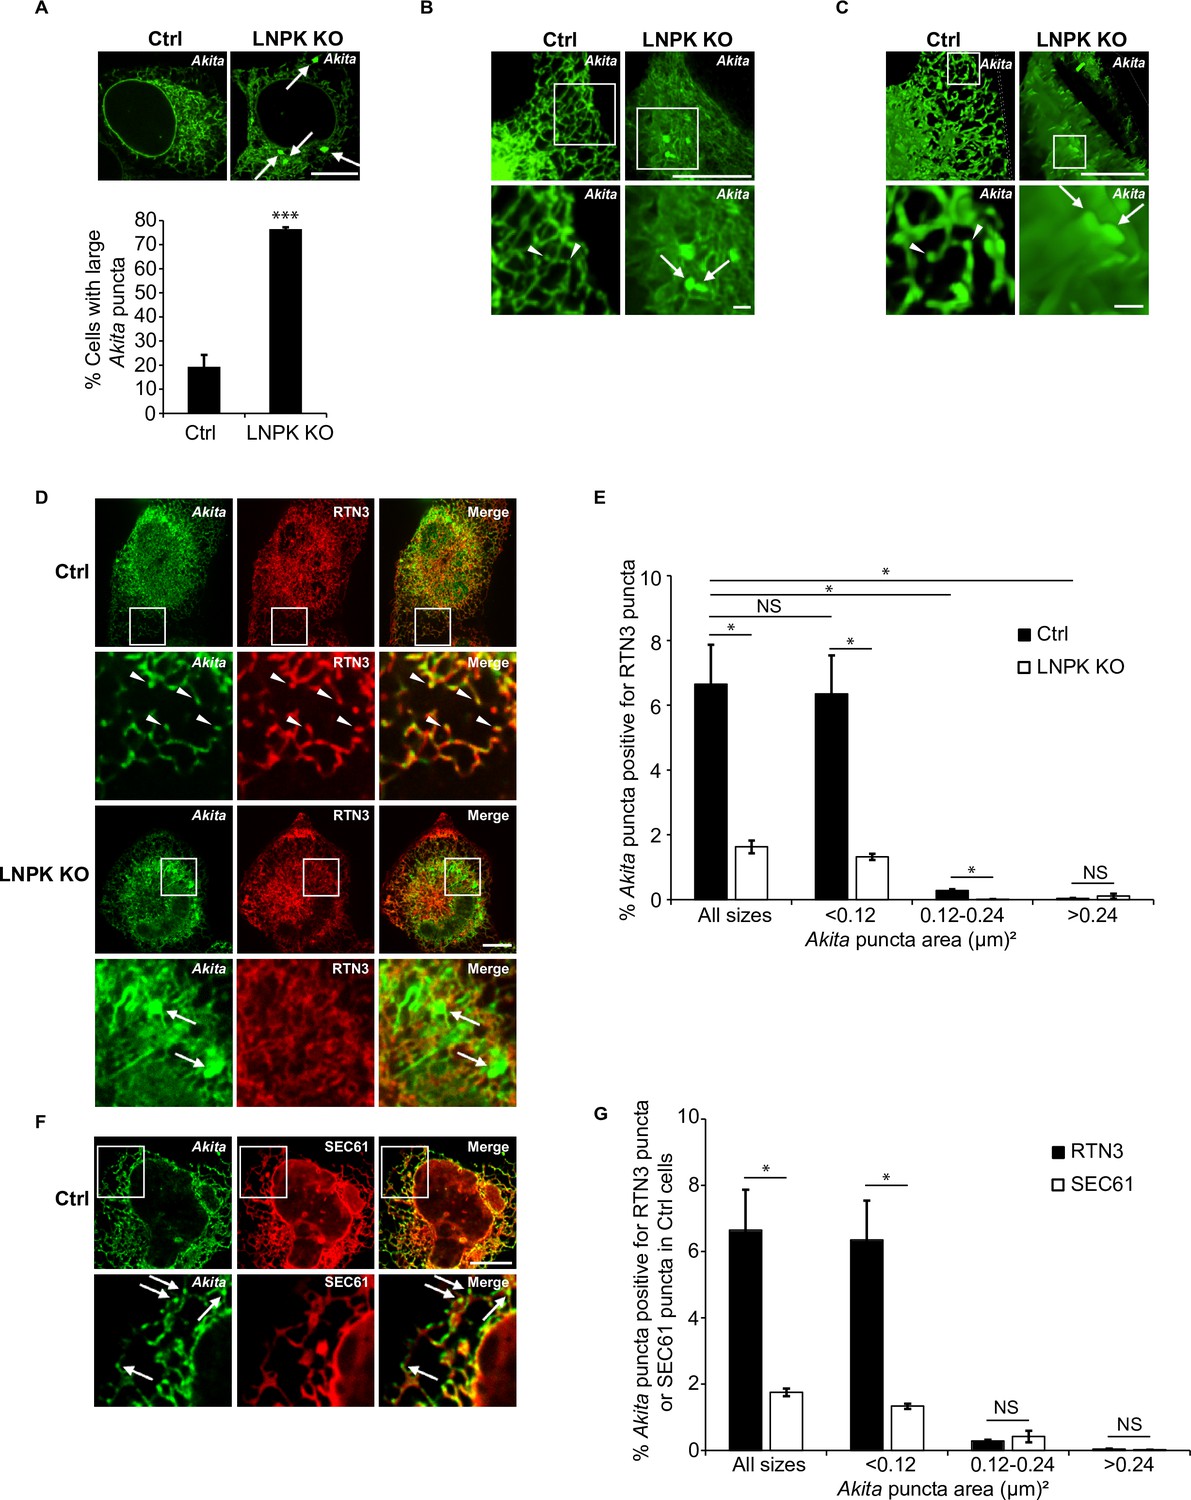
Large Akita puncta accumulate in LNPK KO cells.
(A) Control (Ctrl) and LNPK KO cells were analyzed for the accumulation of large Akita puncta (≥0.5 µm2) by confocal microscopy (top). Arrows point to large puncta. Bar graph shows the % of cells with large Akita-sfGFP puncta (bottom). (B) Maximum intensity projections showing Akita puncta in Ctrl and LNPK KO cells used for the 3D reconstructions shown in Videos 3 and 4. (C) Frames from representative 3D reconstructions of Z stacks of a Ctrl cell (left, 27.5 s in Video 3) and an LNPK KO cell (right, 39 s in Video 4) are shown. Arrowheads mark small Akita puncta, while arrows mark the large puncta. Scale bar for top images in (B) and (C), 10 µm. The insets that are enlarged at the bottom, 1 µm. (D) Ctrl or LNPK KO cells stably expressing mCherry-RTN3 were examined for colocalizing Akita-sfGFP puncta. Arrowheads in the inset indicate Akita puncta colocalizing with RTN3 puncta (top). Arrows show large Akita puncta (≥0.5 µm2) in LNPK KO cells that do not colocalize with RTN3 (bottom). (E) Bar graph for the data shown in (D) of % Akita-sfGFP puncta of different sizes that colocalize with mCherry-RTN3 puncta. (F) Control cells expressing Akita-sfGFP and mCherry-SEC61β were analyzed by confocal microscopy. Arrows mark Akita puncta. (G) Bar graph for the Ctrl data shown in (D) and (F) of % Akita-sfGFP puncta of different sizes that colocalize with either mCherry-RTN3 puncta or mCherry-SEC61β puncta. To identify Akita, RTN3, or SEC61 puncta, the Yen threshold algorithm, which identifies punctate accentuations on the network, was used. We then identified colocalized puncta (Akita-RTN3, Akita-SEC61) using the Boolean image calculator in ImageJ. Colocalizing puncta were calculated as follows: Akita puncta colocalized with RTN3 puncta/total Akita puncta × 100% or Akita puncta colocalized with SEC61 puncta/total Akita puncta × 100%. Scale bars in (A), (D), and (F), 10 µm. Error bars in (A), (E), and (G) represent SEM; n = 3 independent experiments. Approximately 30–40 cells were examined/experiment for (A), and 15–30 cells/experiment for (E) and (G). NS: not significant (p≥0.05); *p<0.05, ***p<0.001, Student’s unpaired t-test.
Figure 5—figure supplement 1
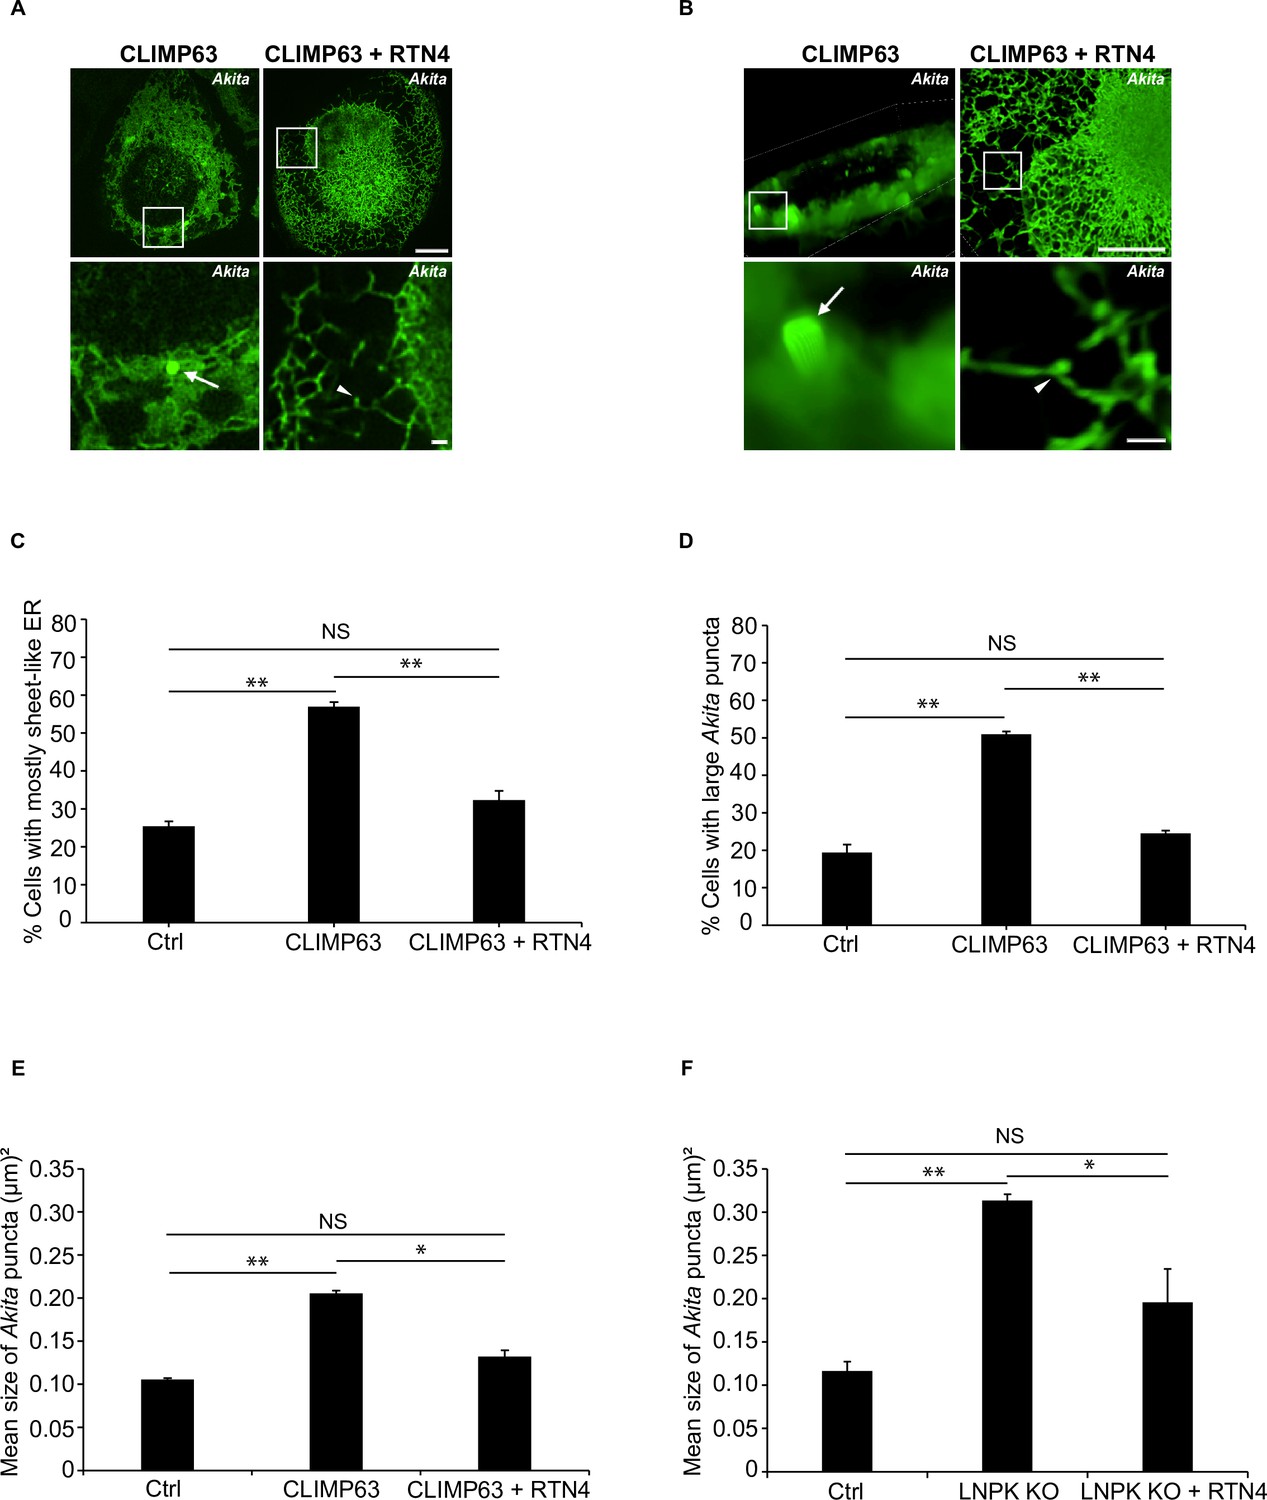
Large Akita puncta accumulate when CLIMP63 is overexpressed.
(A) Maximum intensity projections showing Akita puncta in Ctrl cells expressing mCherry-CLIMP63 (left) or Ctrl cells expressing mCherry-CLIMP63 and mTurquoise2-RTN4 (right). These images were used for the 3D reconstructions in Videos 5 and 6. (B) Frames from representative images of 3D reconstructions of Z stacks of cells showing Akita puncta in Ctrl cells expressing mCherry-CLIMP63 (left, 14 s frame in Video 5), or Ctrl cells expressing mCherry-CLIMP63 and mTurquoise2-RTN4 (right, 3.8 s frame in Video 6). Arrows mark large Akita puncta, while arrowheads mark small puncta. Scale bar for top images in (A) and (B), 10 µm. Insets that are enlarged at the bottom, 1 µm. (C) Endoplasmic reticulum (ER) sheets proliferate when mCherry-CLIMP63 is overexpressed. Bar graph showing the % of cells with mostly sheet-like ER for the data in (A). (D) Bar graph showing the % of cells with large Akita puncta (≥0.5 µm2) for the data in (A). (E) The mean Akita puncta size increases in cells when CLIMP63 is overexpressed. Bar graph showing the mean Akita puncta size per cell for the data in (A) and (B). (F) The mean Akita puncta size increases in LNPK KO cells. Bar graph showing the mean Akita puncta size per cell for the data shown in Figure 6B. Approximately 30–40 cells/experiment were quantitated for (A–D) and 15 cells/experiment were quantitated for (E) and (F). NS: not significant (p≥0.05); *p<0.05; **p<0.01, Student’s unpaired t-test.
Figure 5—figure supplement 2
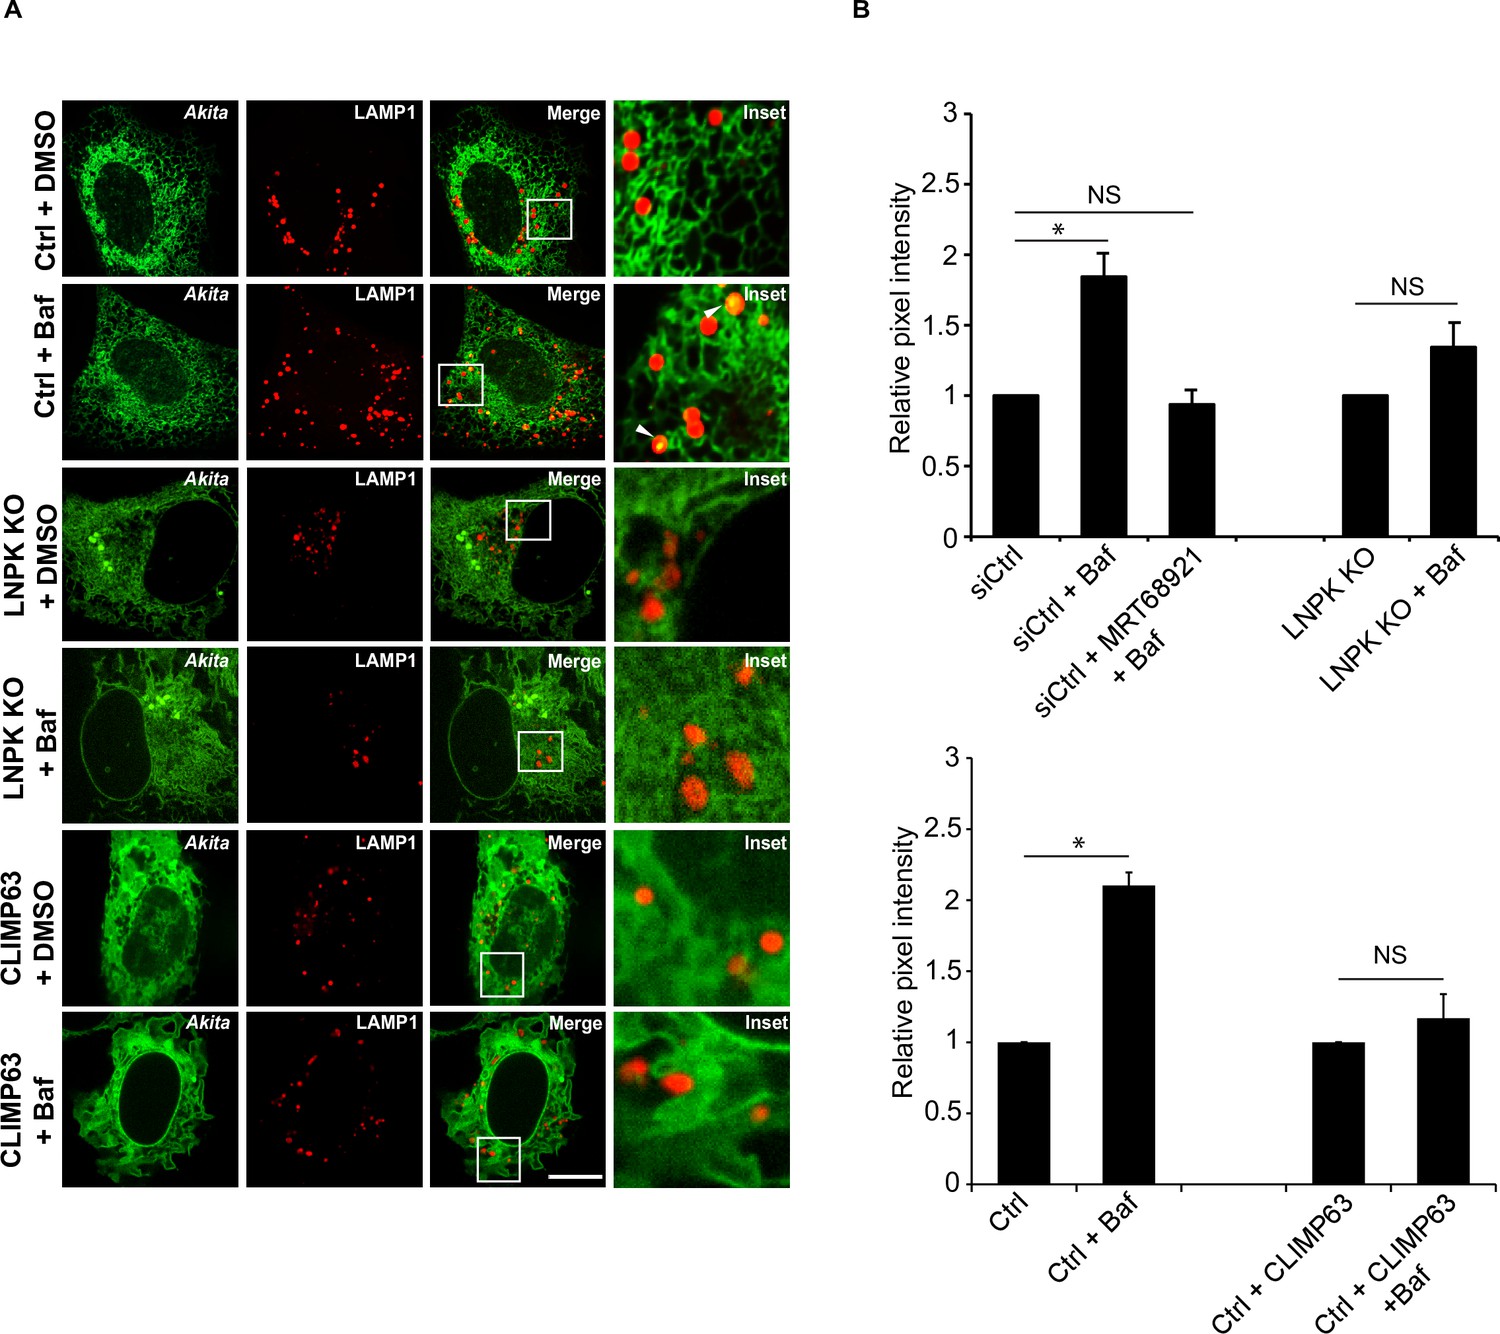
The delivery of Akita to lysosomes is reduced in LNPK KO cells or when CLIMP63 is overexpressed.
(A) Ctrl and LNPK KO cells expressing Akita-sfGFP and LAMP1-mCherry were treated with DMSO or Baf and examined by confocal microscopy (rows 1–4). Bottom two rows, control cells expressing Akita-sfGFP, mTurquoise2-CLIMP63 and LAMP1-mCherry were treated with DMSO or Baf. (B) Quantitation of Akita-sfGFP in LAMP1-mCherry structures for the data shown in (A). The DMSO control was set to 1.0. Scale bar in (A), 10 µm. Error bars in (B) represent SEM, n = 3 independent experiments. Approximately 20–30 cells/experiment were quantitated. NS: not significant (p≥0.05); *p<0.05, Student’s unpaired t-test.
Figure 5—figure supplement 3
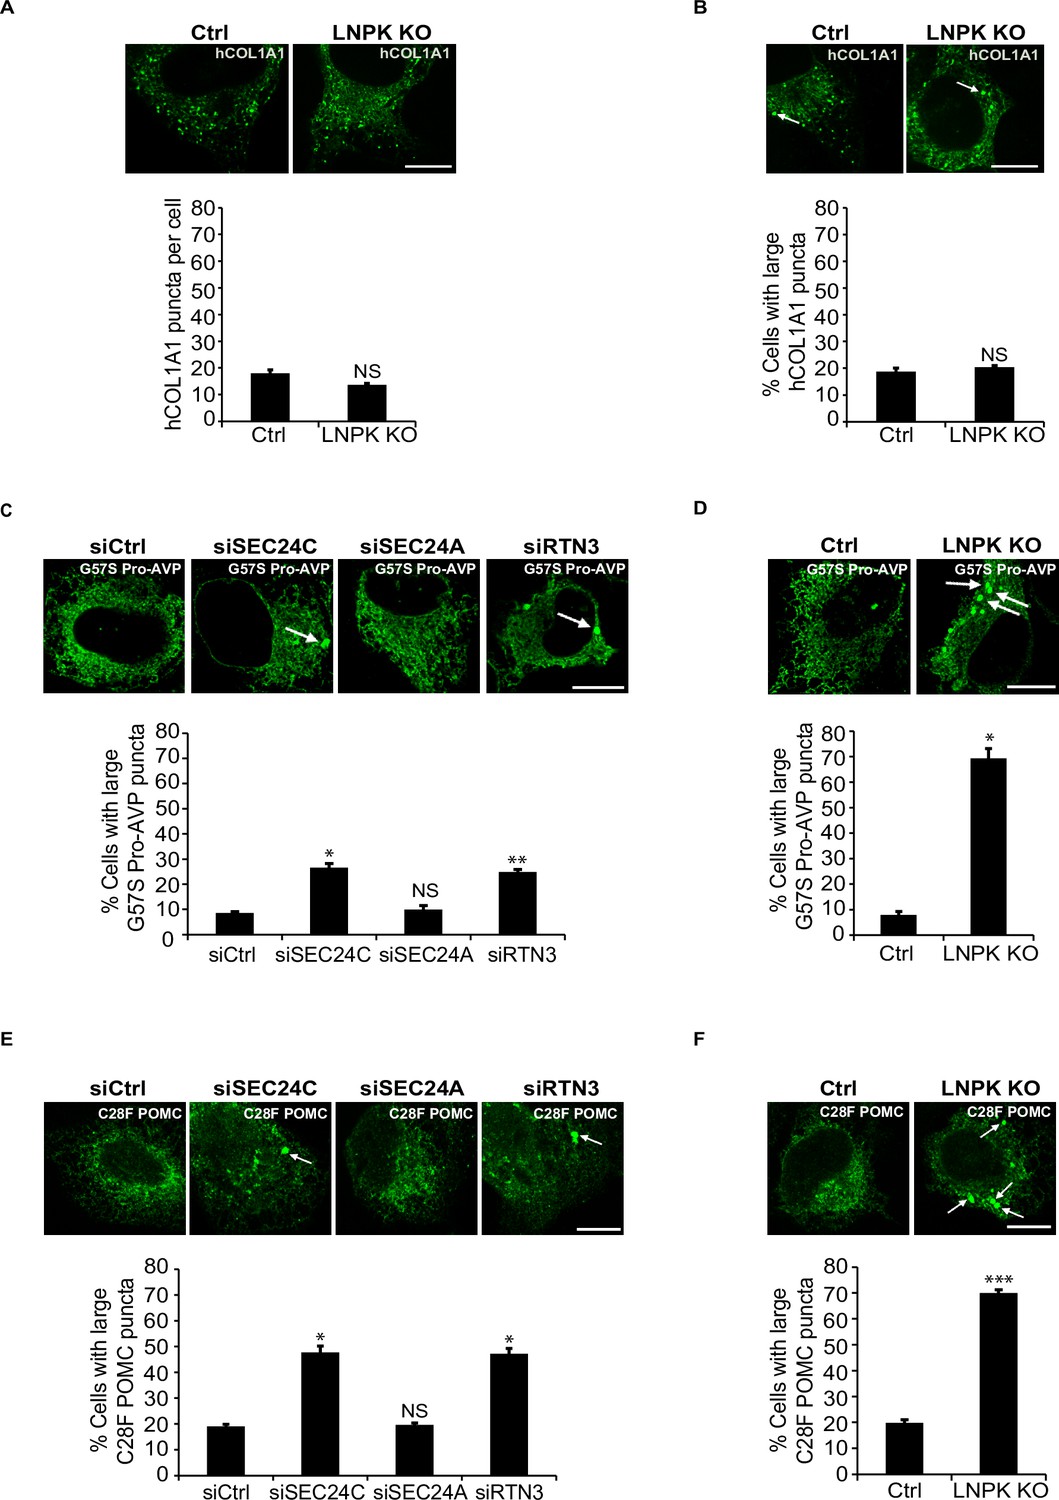
hCOL1A1 puncta do not accumulate in LNPK KO cells.
(A) Ctrl and LNPK KO cells expressing EGFP-hCOL1A1 were analyzed for the accumulation of hCOL1A1 puncta by confocal microscopy (top). Bar graph shows the number of EGFP-hCOL1A1 puncta per cell in the control and LNPK KO cells (bottom). Puncta of all sizes were measured. (B) Representative confocal images of WT and LNPK KO cells that contain large hCOL1A1 puncta (≥0.5 µm2) (top). Arrow marks a large punctum. Bar graph (bottom) shows the % of cells with large EGFP-hCOL1A1 puncta for the data shown above. (C, D) G57S Pro-AVP-FLAG accumulated in siSEC24C, but not siSEC24A cells. Cells expressing G57S Pro-AVP-FLAG were depleted of SEC24C, SEC24A, or RTN3 by siRNA (C), or knocked out for LNPK by CRISPR (D). Cells in (C) and (D) were analyzed for the accumulation of large G57S Pro-AVP puncta (≥0.5 µm2) (top). Bar graphs show the % of cells with large G57S Pro-AVP-FLAG puncta in the indicated samples (bottom). Arrows mark the large puncta. (E, F) C28F POMC accumulated in siSEC24C, but not siSEC24A cells. Cells expressing C28F POMC-FLAG were depleted of SEC24C, SEC24A, or RTN3 by siRNA (E), or knocked out for LNPK (F). Cells in (E) and (F) were analyzed for the accumulation of large C28F POMC puncta (≥0.5 µm2) by confocal microscopy (top). Arrows mark the large puncta. Bar graphs (bottom) show the % of cells with large C28F POMC-FLAG puncta (≥0.5 µm2). Scale bars in (A–F), 10 µm. Error bars in (A–F) represent SEM; n = 3 independent experiments. Approximately 20–30 cells were examined in each experiment. NS: not significant (p≥0.05); *p<0.05, **p<0.01,***p<0.001, Student’s unpaired t-test.
Figure 5—figure supplement 4

Proinsulin and Akita colocalize to the same large puncta.
(A) Ctrl and LNPK KO cells were co-transfected with Akita-sfGFP and proinsulin-FLAG and processed for immunofluorescence after 48 hr. A representative LNPK KO cell is shown. Large puncta (≥0.5 µm2) are marked with arrows. (B) Quantitation of control and LNPK KO cells with large puncta that contain Akita-sfGFP or Akita-sfGFP + proinsulin FLAG. (C, D) are the same as (A) and (B) except the cells were co-transfected with G57S Pro-AVP-FLAG and Pro-AVP-HA. (E, F) are the same as (A) and (B) except the cells were co-transfected with C28F POMC-FLAG and POMC-Myc. Scale bars in (A, C, E), 10 µm. Error bars in (B, D, F) represent SEM; n = 3 independent experiments. Approximately 20–25 cells were examined in each experiment. *p<0.05, **p<0.01, Student’s unpaired t-test.
Figure 5—figure supplement 5
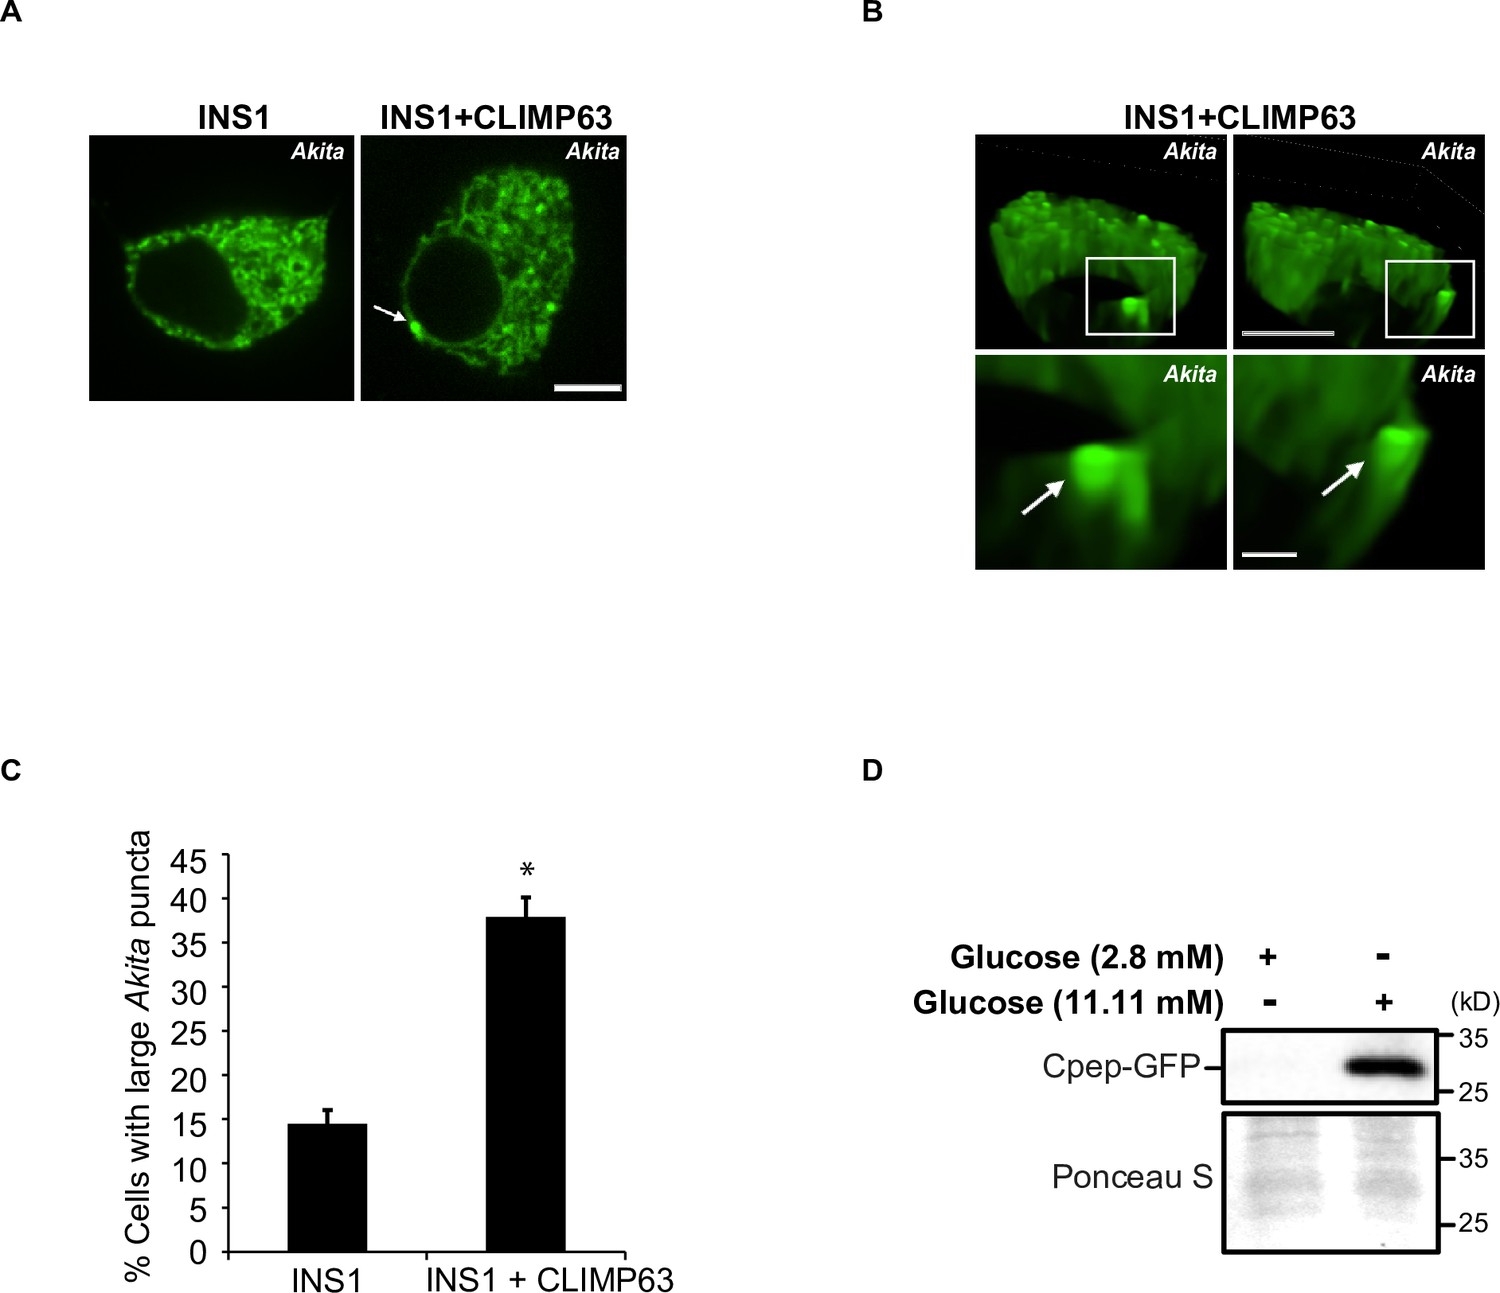
Large Akita puncta accumulate in INS1 cells in response to CLIMP63 overexpression.
(A) Insulin-secreting INS1 cells expressing Akita-sfGFP (left) or Akita-sfGFP and mCherry-CLIMP63 (right) were analyzed for the accumulation of large Akita puncta (≥0.5 µm2) by confocal microscopy. The arrow points to a large punctum. The punctum that is marked is shown in (B). Scale bar, 5 µm. (B) A representative image of a 3D reconstruction of a cell expressing Akita-sfGFP and mCherry-CLIMP63 shown in (A). The frames from Video 8 correspond to 9 s and 16 s. Scale bar for top images, 5 µm. Insets that are enlarged at the bottom, 1 µm. (C) Bar graph shows the % of cells with large Akita-sfGFP puncta for the data shown in (A). (D) Proinsulin-sfGFP is processed normally and secreted in a glucose-dependent manner in INS1 cells. To address if the culture conditions used for the experiment in (A) stimulate insulin secretion, INS1 cells were transfected with proinsulin-sfGFP and the culture medium was analyzed. Previous studies have shown that proinsulin-sfGFP is incorporated into secretory granules and processed by prohormone convertases to C-peptide-sfGFP that is co-secreted with insulin into the medium (Liu et al., 2007). The extracellular medium was collected 48 hr after transfection, precipitated with 10% trichloroacetic acid, and secreted C-peptide-sfGFP was detected by western blot analysis with anti-GFP antibody. The extracellular medium from cells cultured in low-glucose medium (2.8 mM glucose) was used as a negative control. Error bars in (C) represent SEM; n = 3 independent experiments. Approximately 15–30 cells/experiment were quantitated. *p<0.05, Student’s unpaired t-test.
-
Figure 5—figure supplement 5—source data 1
Uncropped blots for Figure 5—figure supplement 5D.
- https://cdn.elifesciences.org/articles/71642/elife-71642-fig5-figsupp5-data1-v2.zip
Figure 5—figure supplement 6
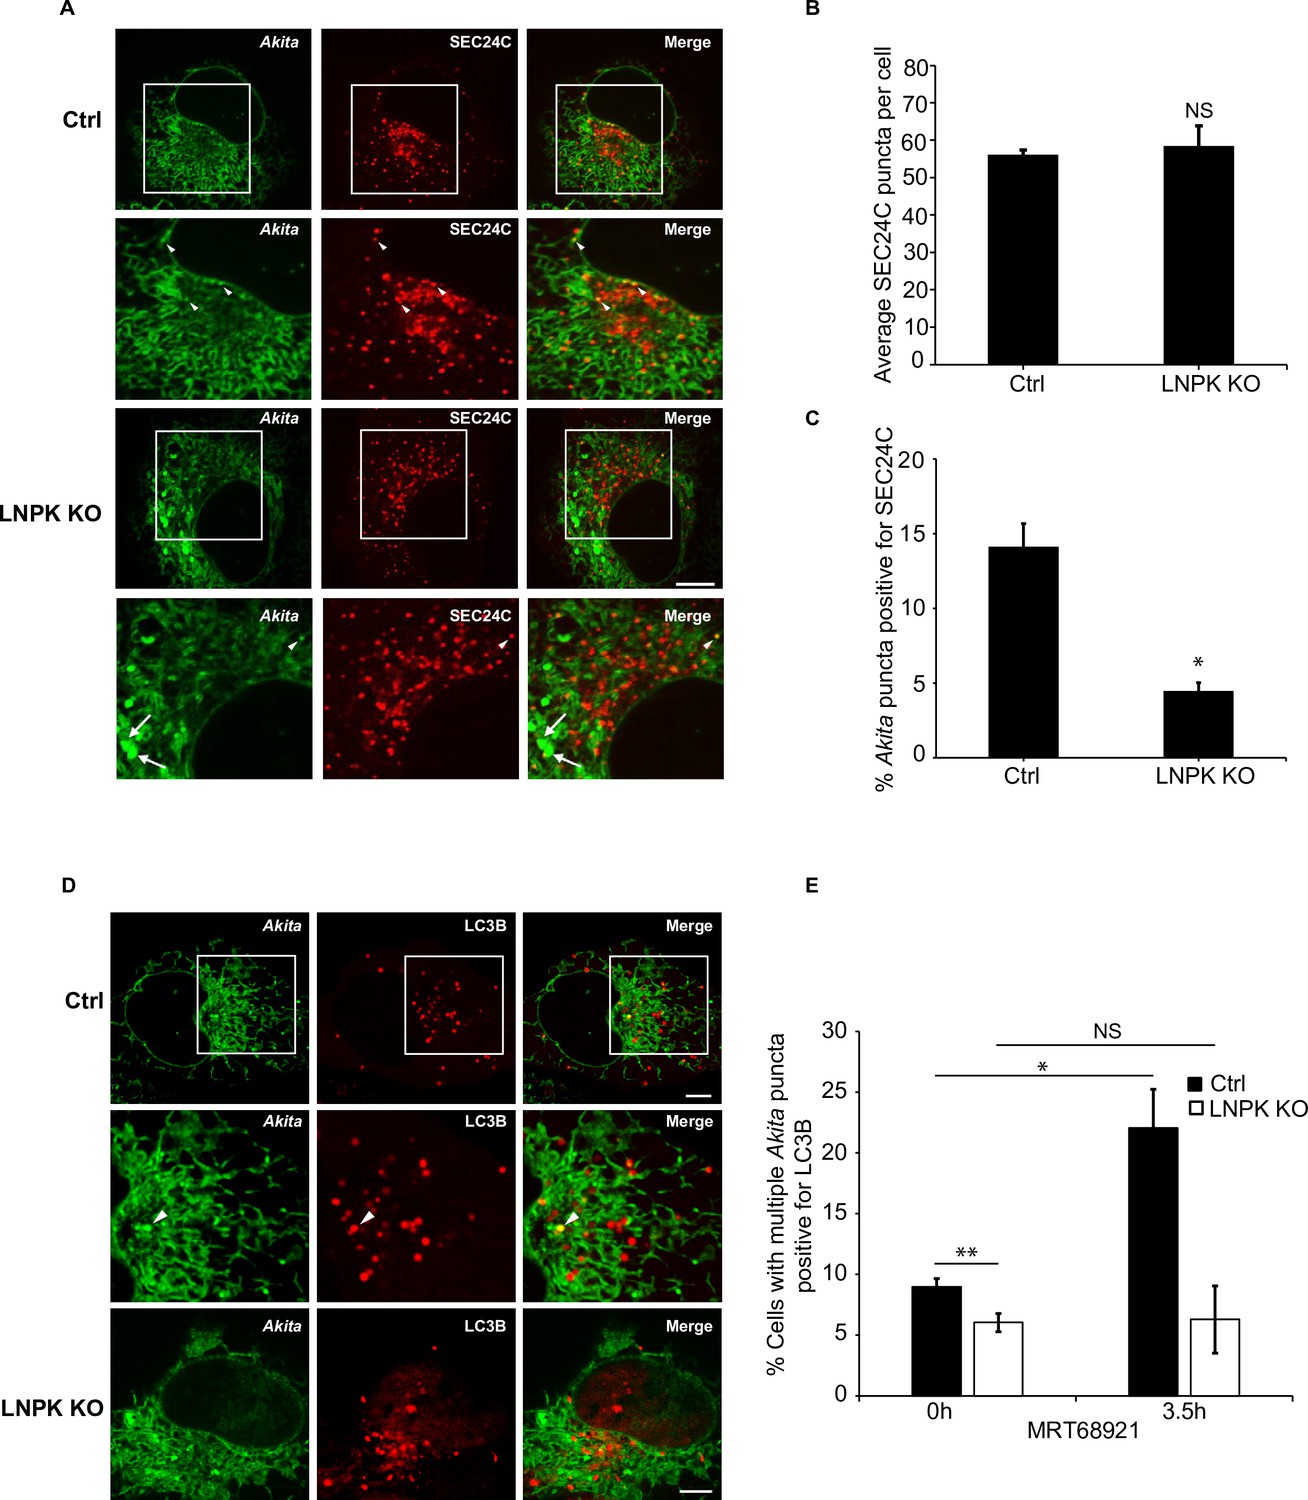
Akita does not colocalize with SEC24C and LC3B in LNPK KO cells.
(A) Ctrl and LNPK KO cells expressing Akita-sfGFP and mCherry-SEC24C were examined by confocal microscopy. Arrowheads in the inset indicate Akita puncta colocalizing with SEC24C. Arrows indicate large Akita puncta (≥0.5 µm2) that do not colocalize with SEC24C. (B) The loss of LNPK did not lead to a decrease in SEC24C puncta. The average number of SEC24C puncta per cell for the data shown in (A) and graphed in (C). (C) Bar graph showing the % Akita-sfGFP puncta colocalizing with mCherry-SEC24C puncta for the data shown in (A). (D) Akita failed to colocalize with LC3B in the absence of LNPK. Control and LNPK KO cells expressing Akita-sfGFP and mCherry-LC3B were treated with MRT68921 for 3.5 hr. Representative confocal images are shown for treatment with MRT68921 for 3.5 hr. (E) Bar graph showing the % of cells with multiple Akita-sfGFP puncta colocalizing with mCherry-LC3B puncta for the data shown in (D). Scale bars in (A) and (D), 10 µm. Error bars in (B, C, E) represent SEM; n = 3 independent experiments. Approximately 15–30 cells were examined in each experiment. NS: not significant (p≥0.05); *p<0.05, **p<0.01, Student’s unpaired t-test.
Figure 5—figure supplement 7
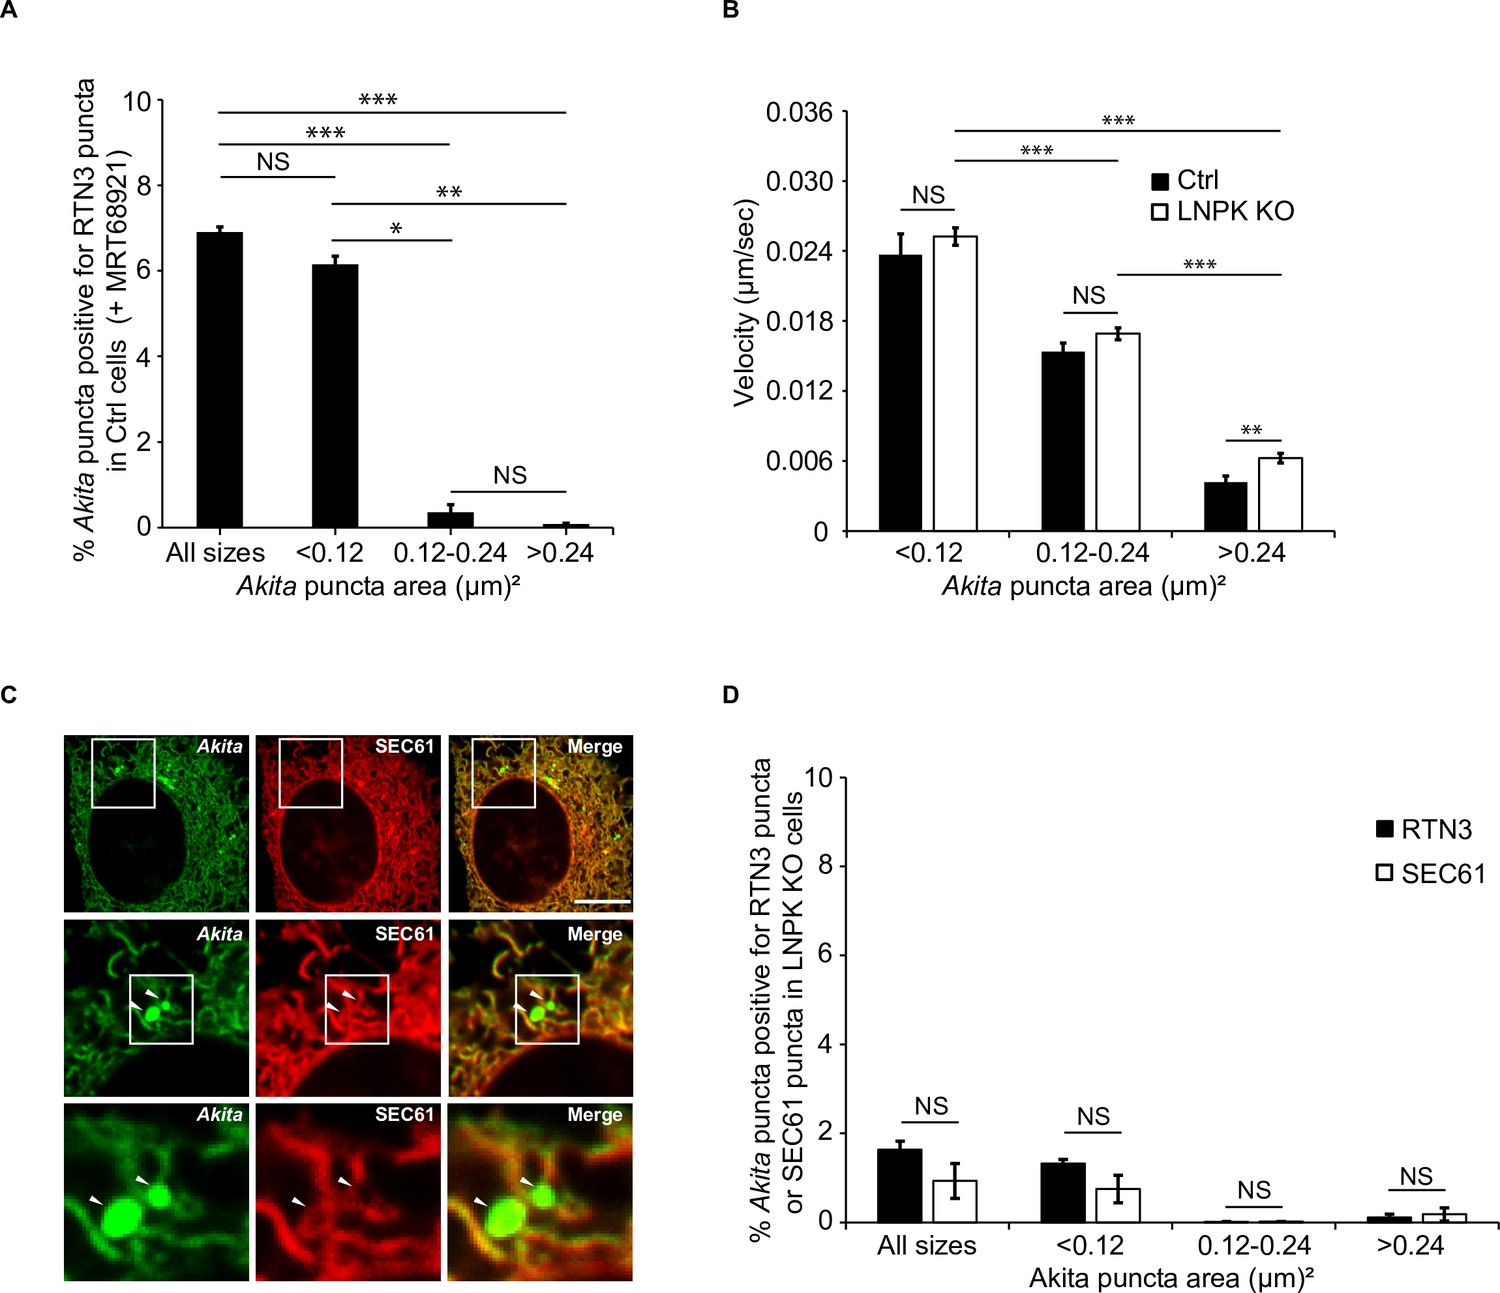
The velocity of small Akita puncta is unaltered in LNPK KO cells.
(A) Small, but not large, Akita puncta colocalized with RTN3 in MRT68921-treated cells. Ctrl cells expressing Akita-sfGFP and mCherry-RTN3 were treated with MRT68921 for 3.5 hr and the % of Akita puncta of different sizes that colocalized with RTN3 puncta were quantitated. (B) The velocity of Akita-sfGFP puncta of different sizes was analyzed in control and LNPK KO cells by live cell confocal microscopy. (C) LNPK KO cells expressing Akita-sfGFP and mCherry-SEC61β were analyzed by confocal microscopy. Arrowheads mark large Akita puncta that appear to reside in the lumen of the endoplasmic reticulum (ER). (D) Bar graph comparing the colocalization of the % of Akita-sfGFP puncta of different sizes with mCherry-RTN3 puncta (shown in Figure 5D) or mCherry-SEC61β puncta (shown in C) in LNPK KO cells. Scale bar in (C), 10 µm. Error bars in (A), (B), and (D) represent SEM; n = 3 independent experiments. Approximately 15–30 cells/experiment were examined. NS: not significant (p≥0.05); *p<0.05, **p<0.01, ***p<0.001, Student’s unpaired t-test.
Figure 5—figure supplement 8
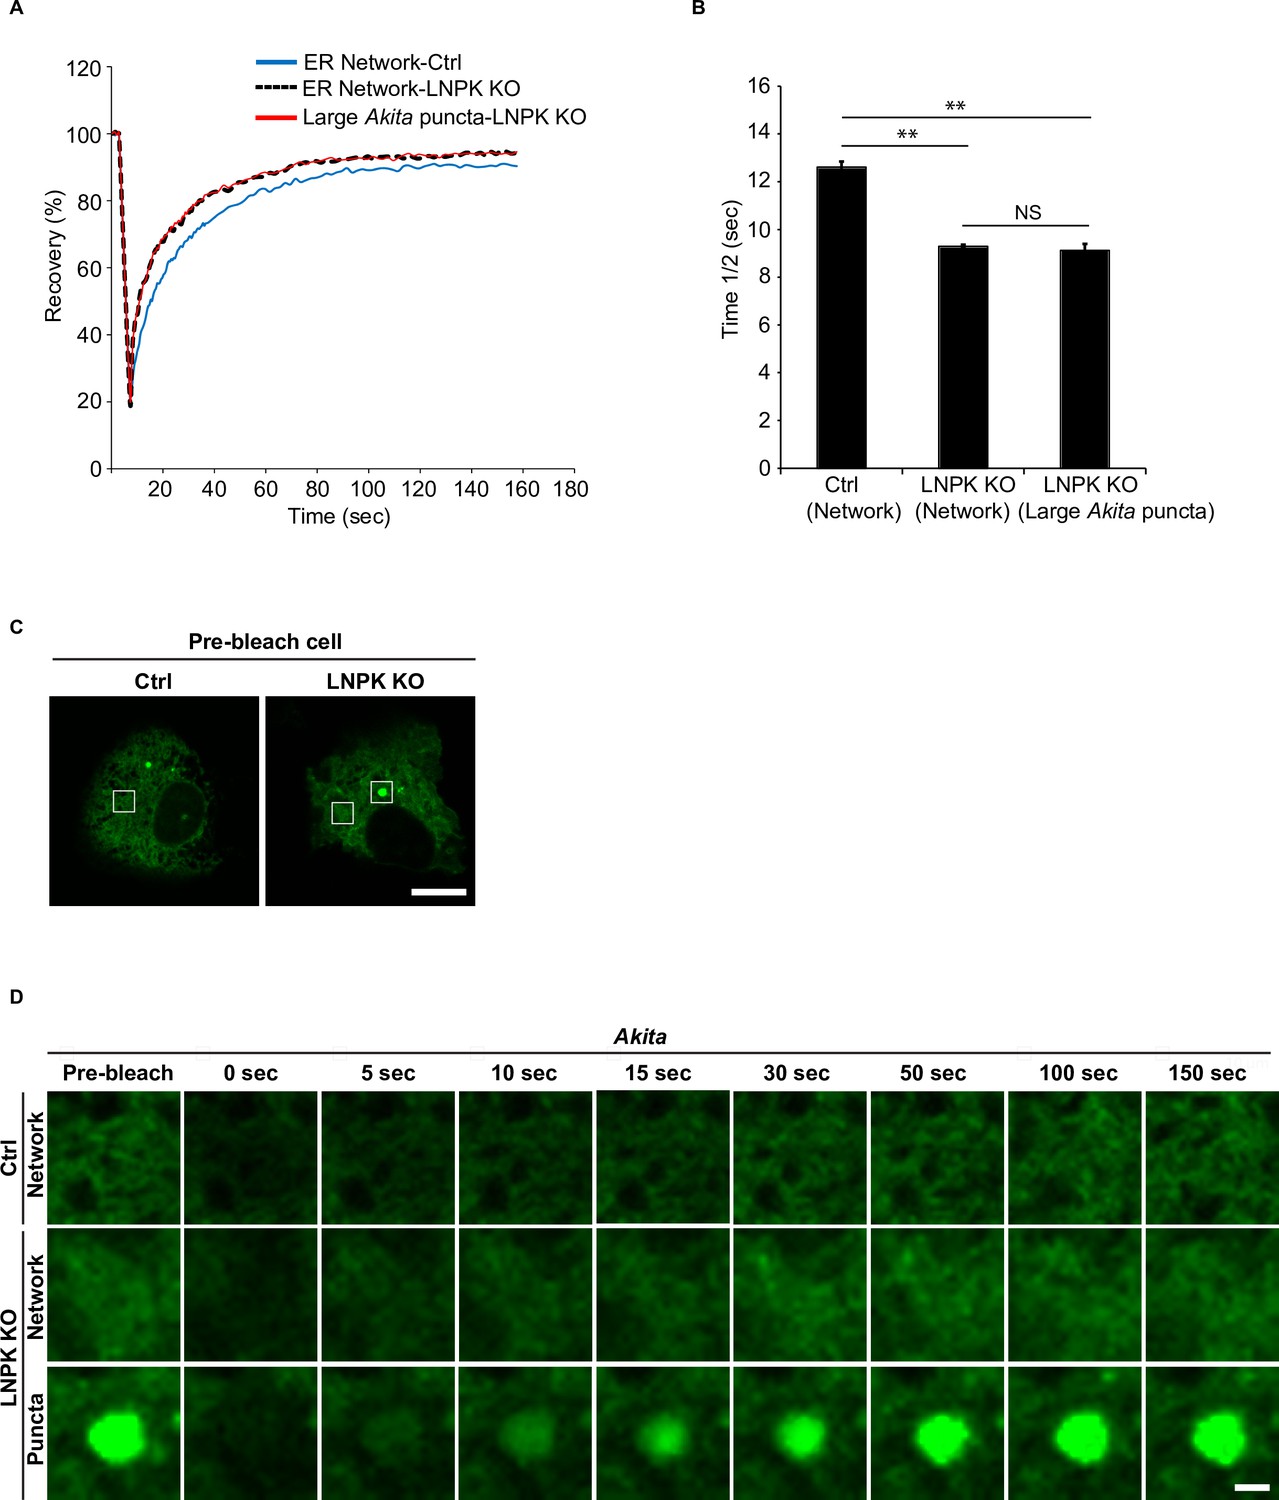
Large Akita puncta rapidly recover after photobleaching in LNPK KO cells.
(A) Fluorescence recovery after photobleaching (FRAP) analysis of the endoplasmic reticulum (ER) network in Ctrl cells, LNPK KO cells, and large Akita-sfGFP puncta (average size ≥0.35 µm2) in LNPK KO cells. (B) The half time of fluorescence recovery (time 1/2) after photobleaching for the data shown in (A). (C) Left: a control cell showing the region of the ER (see box) that was photobleached in (D). Right: an LNPK KO cell showing the region of the ER (left box) and Akita puncta (right box) that was photobleached in (D). (D) Representative confocal images of the region that was analyzed by FRAP for the data shown in (A). Scale bar in (C), 10 µm. Scale bar in (D), 1 µm. Error bars in (B) represent SD, n = 3 independent experiments. Approximately 20 puncta/experiment were analyzed. NS: not significant (p≥0.05); **p<0.01, Student’s unpaired t-test.
Figure 5—figure supplement 9
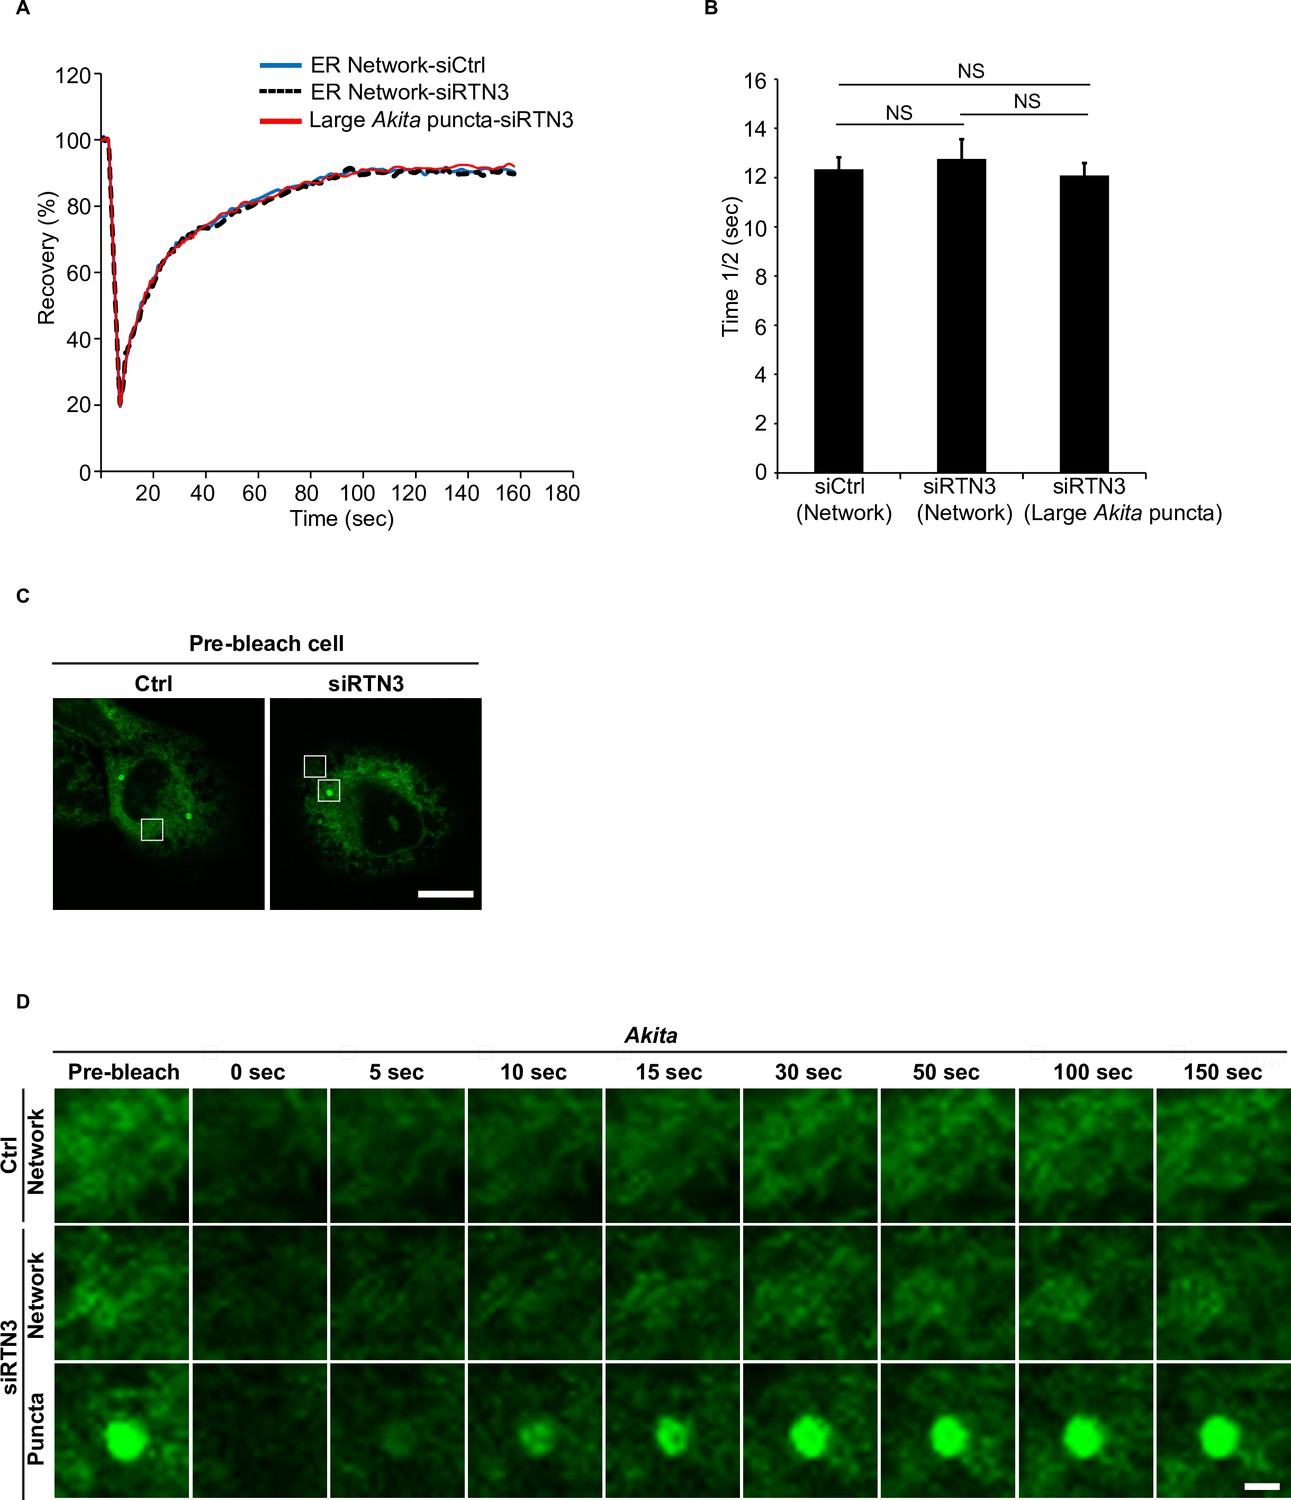
Large Akita puncta rapidly recover after photobleaching in siRTN3 cells.
(A) Fluorescence recovery after photobleaching (FRAP) analysis of the endoplasmic reticulum (ER) network in Ctrl cells, siRTN3 cells, and large Akita-sfGFP puncta (average size ≥0.32 µm2) in siRTN3 cells. (B) The half time of fluorescence recovery (time 1/2) after photobleaching for the data shown in (A). (C) Left: a control cell showing the region of the ER (see box) that was photobleached in (D). Right: an RTN3-depleted cell showing the region of the ER (top box) and Akita puncta (bottom box) that was photobleached in (D). (D) Representative confocal images of the region that was analyzed by FRAP for the data shown in (A). Scale bar in (C), 10 µm. Scale bar in (D), 1 µm. Error bars in (B) represents SD, n = 3 independent experiments. Approximately 20 puncta/experiment were analyzed. NS: not significant (p≥0.05); Student’s unpaired t-test.
Figure 6 with 1 supplement
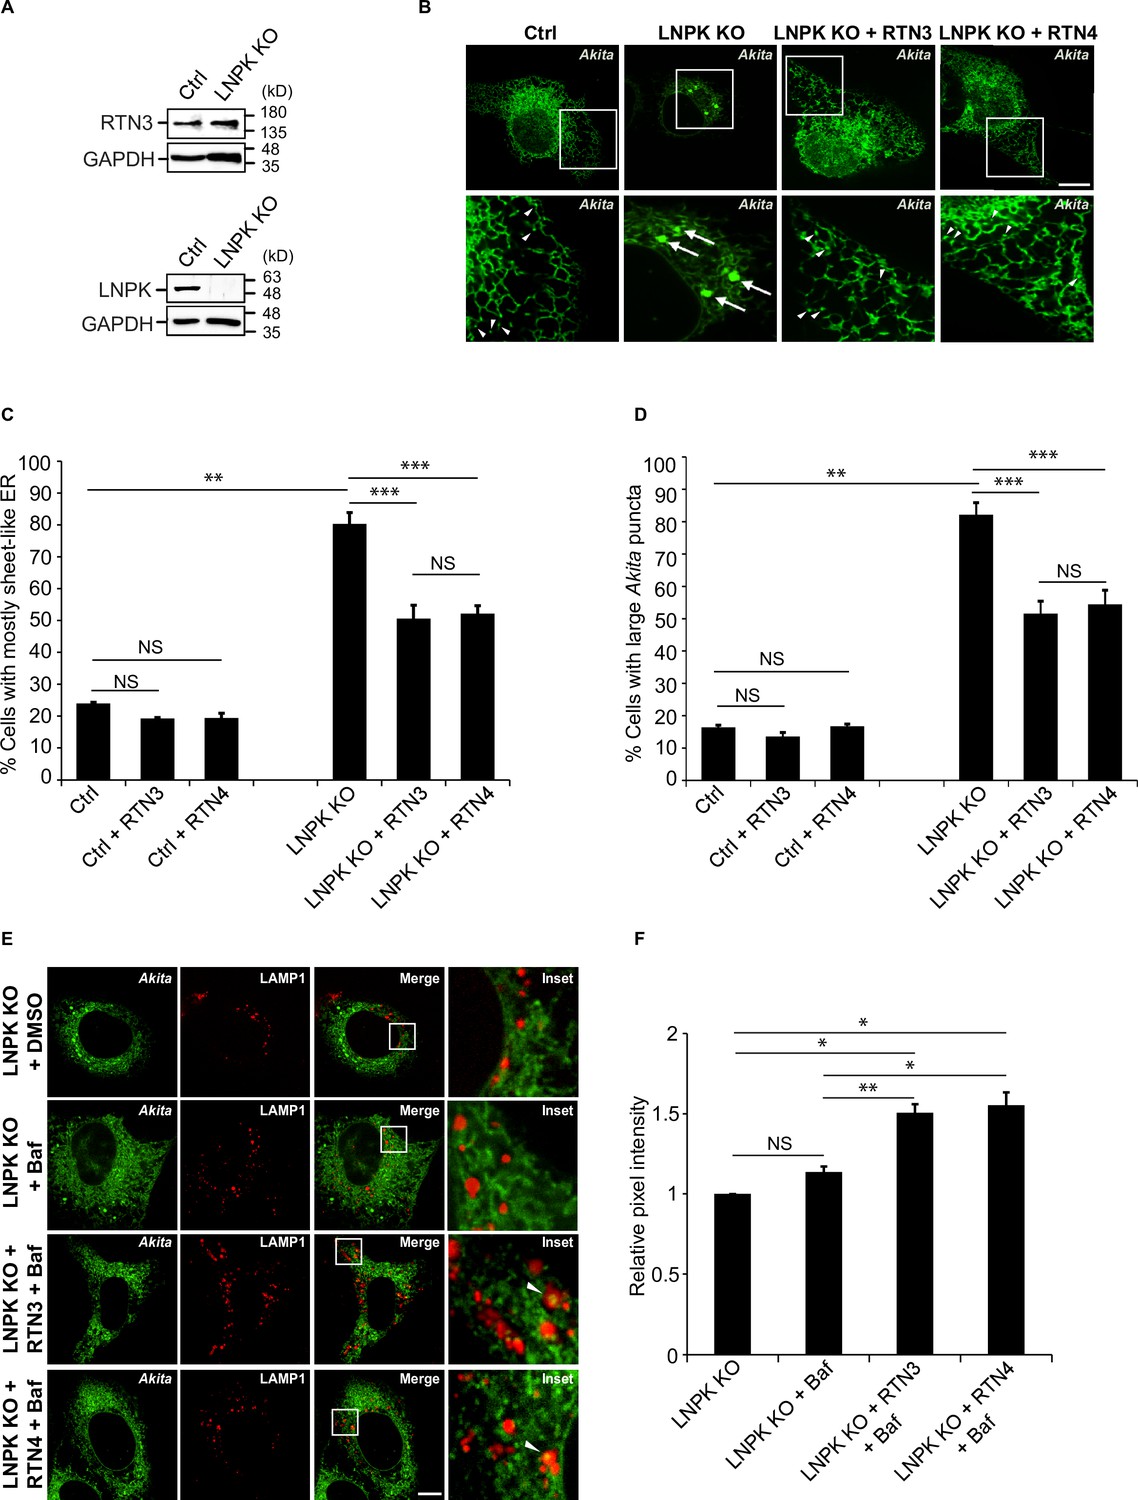
Restoration of the tubular endoplasmic reticulum (ER) network in LNPK KO cells reduces the accumulation of large Akita puncta.
(A) Ctrl and LNPK KO cells were analyzed for the expression of endogenous RTN3 (top) or LNPK (bottom) by immunoblotting. Glyceraldehyde 3-phosphate dehydrogenase (GAPDH) was used as a loading control. (B) mCherry-RTN3 or mCherry-RTN4 was transfected in control and LNPK KO cells expressing Akita-sfGFP and analyzed by confocal microscopy. Arrowheads mark representative small Akita puncta present in the ER tubules. Arrows mark large Akita puncta (≥0.5 µm2). (C) Bar graph showing the % of cells with mostly sheet-like ER for the data shown in (B). (D) Bar graph showing the % of cells with large Akita-sfGFP puncta for the data shown in (B). (E) mTurquoise2-RTN3 or mTurquoise2-RTN4 was transfected in control and LNPK KO cells expressing Akita-sfGFP and LAMP1-mCherry, and treated with Baf. (F) Quantitation of Akita-sfGFP in LAMP1-mCherry structures for the data shown in (E). The DMSO control for each condition was set to 1.0. Scale bar in (B) and (E), 10 µm. Error bars in (C), (D), and (F) represent SEM; n = 3 independent experiments. Approximately 30–40 cells were quantified in each experiment. NS: not significant (p≥0.05); *p<0.05, **p<0.01, ***p<0.001, Student’s unpaired t-test.
-
Figure 6—source data 1
Uncropped blots for Figure 6A.
- https://cdn.elifesciences.org/articles/71642/elife-71642-fig6-data1-v2.zip
Figure 6—figure supplement 1
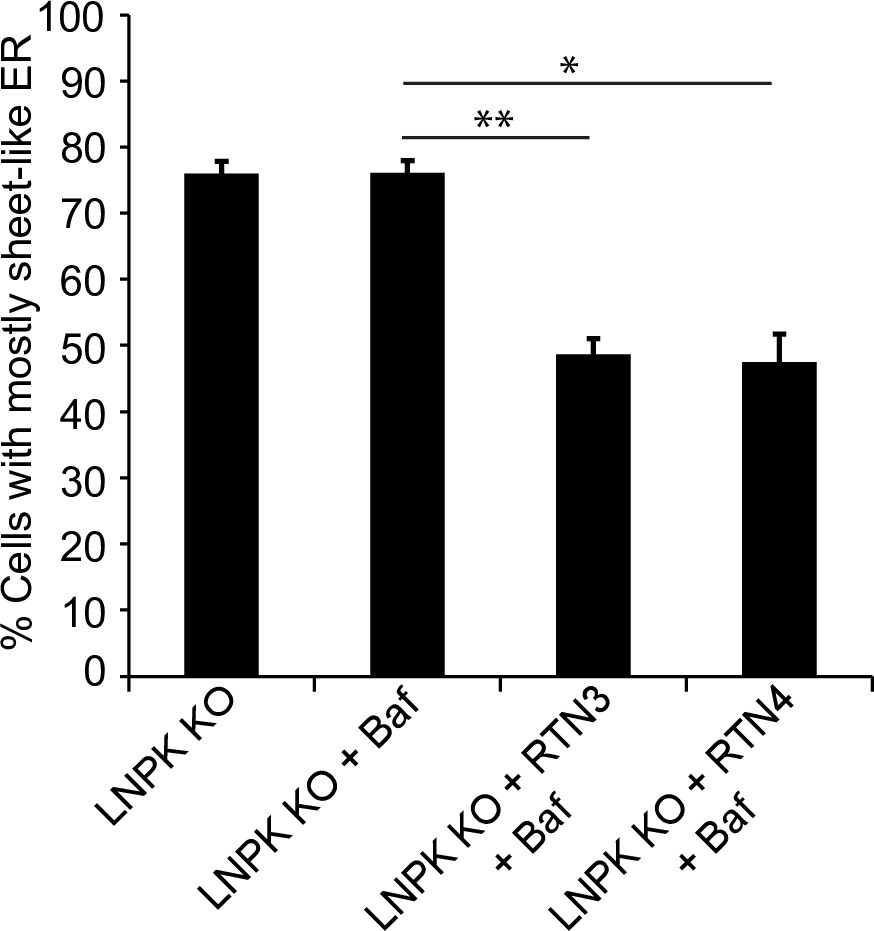
The reticulons partially restored the tubular network in LNPK KO cells.
LNPK KO cells were transfected with mTurquoise2-RTN3 or mTurquoise2-RTN4 and the % of cells with sheet-like endoplasmic reticulum (ER) was calculated for the data shown in Figure 6E. Error bars represent SEM; n = 3 independent experiments. Approximately 30–40 cells/experiment were examined. *p<0.05, **p<0.01, Student’s unpaired t-test.
Figure 7
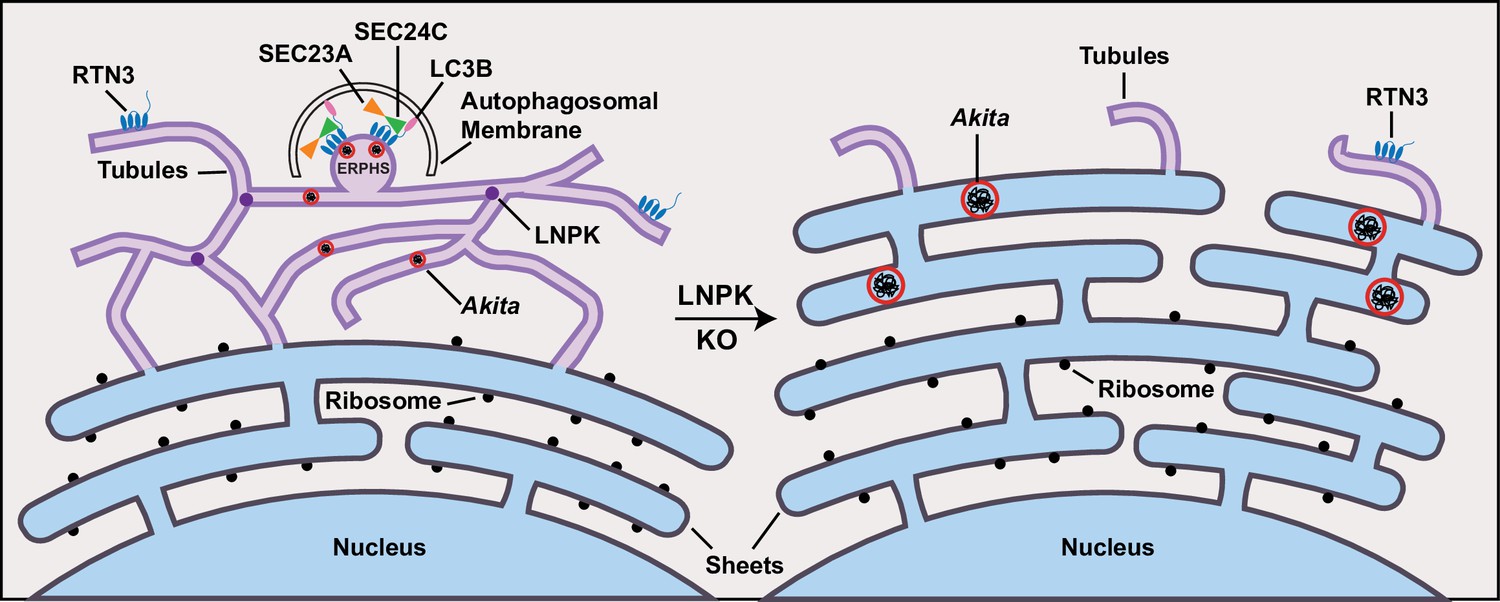
Akita puncta do not enlarge in the tubules.
ER-phagy sites (ERPHS) are formed when Akita puncta associate with RTN3 puncta, LC3B, and SEC24C on the tubules. The association of RTN3 with LC3B occurs in the absence of SEC24C. In LNPK KO cells, the tubular polygonal network collapses and large Akita puncta accumulate in sheet-like endoplasmic reticulum (ER). Large Akita puncta also accumulate in siSEC24C and siRTN3 cells.
Videos
Video 1
Small Akita puncta rapidly move in the tubular endoplasmic reticulum (ER) network.
Time-lapse images of a small Akita-sfGFP punctum (0.07 µm2) as it moves in the tubular network of U2OS cells. The punctum appears to change size and shape as it moves.
Video 2
Large Akita puncta accumulate in the dense endoplasmic reticulum (ER) and exhibit low mobility.
Time-lapse images of a large Akita-sfGFP punctum (1.249 µm2) in a dense ER region of a cell that was treated with MRT68921 for 3.5 hr.
Video 3
Small Akita puncta are found in endoplasmic reticulum (ER) tubules.
The movie shows a 3D reconstruction of 29 Z-slices, taken with 0.15 µm steps, of a single control cell with small Akita-sfGFP puncta. Images were deconvolved using Richardson–Lucy algorithm with automatic parameter setting in NIS Elements.
Video 4
Large Akita puncta accumulate in endoplasmic reticulum (ER) sheets in LNPK KO cells.
The movie shows a 3D reconstruction of a Z stack of a single LNPK KO cell with large Akita-sfGFP puncta.
Video 5
Large Akita puncta accumulate in CLIMP63 overexpressing cells.
The movie shows a 3D reconstruction of a Z stack of a control cell expressing Akita-sfGFP and mCherry-CLIMP63. Large Akita puncta can be seen in the endoplasmic reticulum (ER) sheets.
Video 6
Large Akita puncta decrease in number when CLIMP63 is cotransfected with RTN4.
The movie shows a 3D reconstruction of a Z stack of a control cell expressing Akita-sfGFP, mCherry-CLIMP63, and mTurquiose2-RTN4. Small Akita puncta can be seen in endoplasmic reticulum (ER) tubules.
Video 7
A representative INS1 cell expressing Akita-sfGFP.
The movie shows a 3D reconstruction of a Z stack of a single INS1 cell expressing Akita-sfGFP.
Video 8
The overexpression of CLIMP63 increases large Akita puncta in INS1 cells.
The movie shows a 3D reconstruction of a Z stack of a single INS1 cell coexpressing Akita-sfGFP and mCherry-CLIMP63. Large Akita puncta can be seen in sheet-like endoplasmic reticulum (ER).
Tables
Table 1
List of plasmids used in this study.
| Identifier | Plasmid | Source | Catalog no. |
|---|---|---|---|
| SFNB 2454 | mCherry-hLC3B-pcDNA3.1 | Addgene | #40827 |
| SFNB 2453 | pC1-EYFP-SEC24C | Addgene | #66608 |
| SFNB 2501 | pCDNA3.1-LAMP1-mCherry | Addgene | #45147 |
| SFNB 2498 | pLVX-Puro-mRuby-SEC23A | Addgene | #36158 |
| SFNB 2497 | pHAGE2-mCherry-RTN4a | Addgene | #86683 |
| SFNB 2502 | pC1-mCherry-SEC61beta | Addgene | #49155 |
| SFNB 2508 | pcDNA 3.1- EGFP-hCOL1A1 | Addgene | #140110 |
| SFNB 2535 | pmCherry-N1-CLIMP63 | Addgene | #136293 |
| SFNB 2462 | Proinsulin-sfGFP (also called pTarget-hProCpep SfGFP) | Haataja et al., 2013 | N/A |
| SFNB 2468 | Akita-sfGFP (also called pTarget- hProC(A7)Y-Cpep SfGFP) | Haataja et al., 2013 | N/A |
| SFNB 2455 | pHAGE-mCherry-RTN3L | An et al., 2019 | N/A |
| SFNB 2456 | pHAGE-FAM134B-mTurquoise | An et al., 2019 | N/A |
| SFNB 2467 | pC1-mAaus0.5-SEC24A | This study | N/A |
| SFNB 2477 | pC1-mCherry-SEC24A | This study | N/A |
| SFNB 2471 | pC1-mCherry-SEC24C | This study | N/A |
| SFNB 2457 | SEC13-GFP | Hammond and Glick, 2000 | N/A |
| SFNB 2458 | EGFP-SEC16A | Watson et al., 2006 | N/A |
| SFNB 2489 | pRc/RSV-G57S Pro-AVP-FLAG | Shi et al., 2017 | N/A |
| SFNB 2491 | pcDNA3.1-C28F POMC-FLAG | Kim et al., 2018 | N/A |
| SFNB 2513 | pC1-mTurquoise2-RTN3 | This study | N/A |
| SFNB 2514 | pC1-mTurquoise2-RTN4 | This study | N/A |
| SFNB 2536 | pC1-mTurquoise2-CLIMP63 | This study | N/A |
| SFNB 2523 | pC1-Proinsulin-FLAG | This study | N/A |
| SFNB 2517 | pcDNA3.1-POMC-WT-myc | Kim et al., 2018 | N/A |
| SFNB 2518 | pRc/RSV- Pro-AVP-WT-HA | Shi et al., 2017 | N/A |
Table 2
List of antibodies used in this study.
| Name | Source | Catalog no. | Dilution used |
|---|---|---|---|
| Rabbit anti-SEC24A | Gift from Randy Schekman | N/A | 1:1000 |
| Rabbit anti-SEC24B | Gift from Randy Schekman | N/A | 1:400 |
| Rabbit anti-SEC24C | Gift from Randy Schekman | N/A | 1:1000 |
| Rabbit anti-SEC24D | Gift from Randy Schekman | N/A | 1:1000 |
| Mouse anti RTN3 (F-6) | Santacruz Biotechnology | sc-374599 | 1:1000 |
| Rabbit anti-LNPK | Chen et al., 2015 | N/A | 1:1000 |
| Rabbit anti FAM134B | Proteintech Group, Rosemont, IL | 21537-1-AP; 00014408 | 1:1000 |
| Mouse GAPDH loading control monoclonal antibody (GA1R) | Thermo Fisher Scientific, Waltham, MA | MA5-15738 | 1:5000 |
| Anti-mouse IgG (H + L), HRP conjugate | Promega | W4021; 0000421603 | 1:10,000 |
| Rabbit IgG HRP linked whole Ab | Millipore Sigma | GENA934 | 1:10,000 |
| Mouse monoclonal anti-FLAG M2 antibody | Millipore Sigma | F3165; SLB45142 | 1:1000 |
| HA-Tag (C29F4) rabbit mAb | Cell Signaling | 3724T | 1:1000 |
| Myc-Tag (71D10) rabbit mAb | Cell Signaling | 2278T | 1:1000 |
| Anti-GFP mouse IgG1κ (clones 7.1 and 13.1) | Roche | 11814460001 | 1:3000 |
| Rabbit anti-SEC24C (for immunofluorescence and western blots) | Bethyl | A304-759A | 1:1000 |
| Rabbit anti-Nogo (RTN4) A + B antibody | Abcam | ab47085 | 1:1000 |
| Rabbit anti-LC3 pAb | MBL | PM036 | 1:1000 |
| Goat anti-mouse IgG (H + L) cross-adsorbed secondary antibody, Alexa Fluor 488 or 594 | Thermo Fisher Scientific | A-11001A-11005 | 1:1000 |
| Goat anti-rabbit IgG (H + L) highly cross-adsorbed secondary antibody, Alexa Fluor 488 or 594 | Thermo Fisher Scientific | A-11008A-11037 | 1:1000 |
Table 3
List of siRNAs used in this study.
| Name | Target gene | Source | Catalog no. | Target sequence |
|---|---|---|---|---|
| siCtrl | Control | Dharmacon(siGenomeNon-Targeting siRNA Pool) | D-001206-13-05 | |
| siSEC24A | SEC24A | Dharmacon(siGenome-SMARTpool) | M-024405-01-0005 | CCAAGAAGGUAUUACAUCACAAAUGCACGUCUAGAUGAGGAAACUUCUUUGUUAGGUGGUUGUAUUUCUCGGUAUU |
| siSEC24B | SEC24B | Dharmacon(siGenome-SMARTpool) | M-008299-01-0006 | GGGAAAGGCUGUGACAAUAGACCAGAAGUUCAGAAUUCCAGGGUGCAUCUAUUAUUACCAGAUUCAUUUCGGUGUA |
| siSEC24C | SEC24C | Dharmacon(siGenome-SMARTpool) | M-008467-01-0007 | GCAAACGUGUGGAUGCUUACAGGGAAGCUCUUUCUAUUUGGCUGAUCUAUAUCGAAACUGUAUAUGAUUCGGUAUU |
| siSEC24D | SEC24D | Dharmacon(siGenome-SMARTpool) | M-008493-01-0008 | GAGGAACCCUUUACAAAUAGACCAGAGAUCUCAACUGAGUACAUGAAUUGCUUGUUGGGUAAAUCACGGCGAGAGU |
| siRTN3 | RTN3 | Sigma-Aldrich | N/A | UCAGUGUCAUCAGUGUGGUUUCUUAdTdT |
| siFAM134B | FAM134B | Sigma-Aldrich | N/A | CAAAGATGACAGTGAATTAdTdT |
Additional files
Download links
A two-part list of links to download the article, or parts of the article, in various formats.
Downloads (link to download the article as PDF)
Open citations (links to open the citations from this article in various online reference manager services)
Cite this article (links to download the citations from this article in formats compatible with various reference manager tools)
Endoplasmic reticulum tubules limit the size of misfolded protein condensates
eLife 10:e71642.
https://doi.org/10.7554/eLife.71642


