Widespread nociceptive maps in the human neonatal somatosensory cortex
- Department of Neuroscience, Physiology & Pharmacology, University College London, United Kingdom
- Department of Developmental Neuroscience, University College London, United Kingdom
- Elizabeth Garrett Anderson Obstetric Wing, University College London Hospitals, United Kingdom
Figures
Figure 1 with 2 supplements
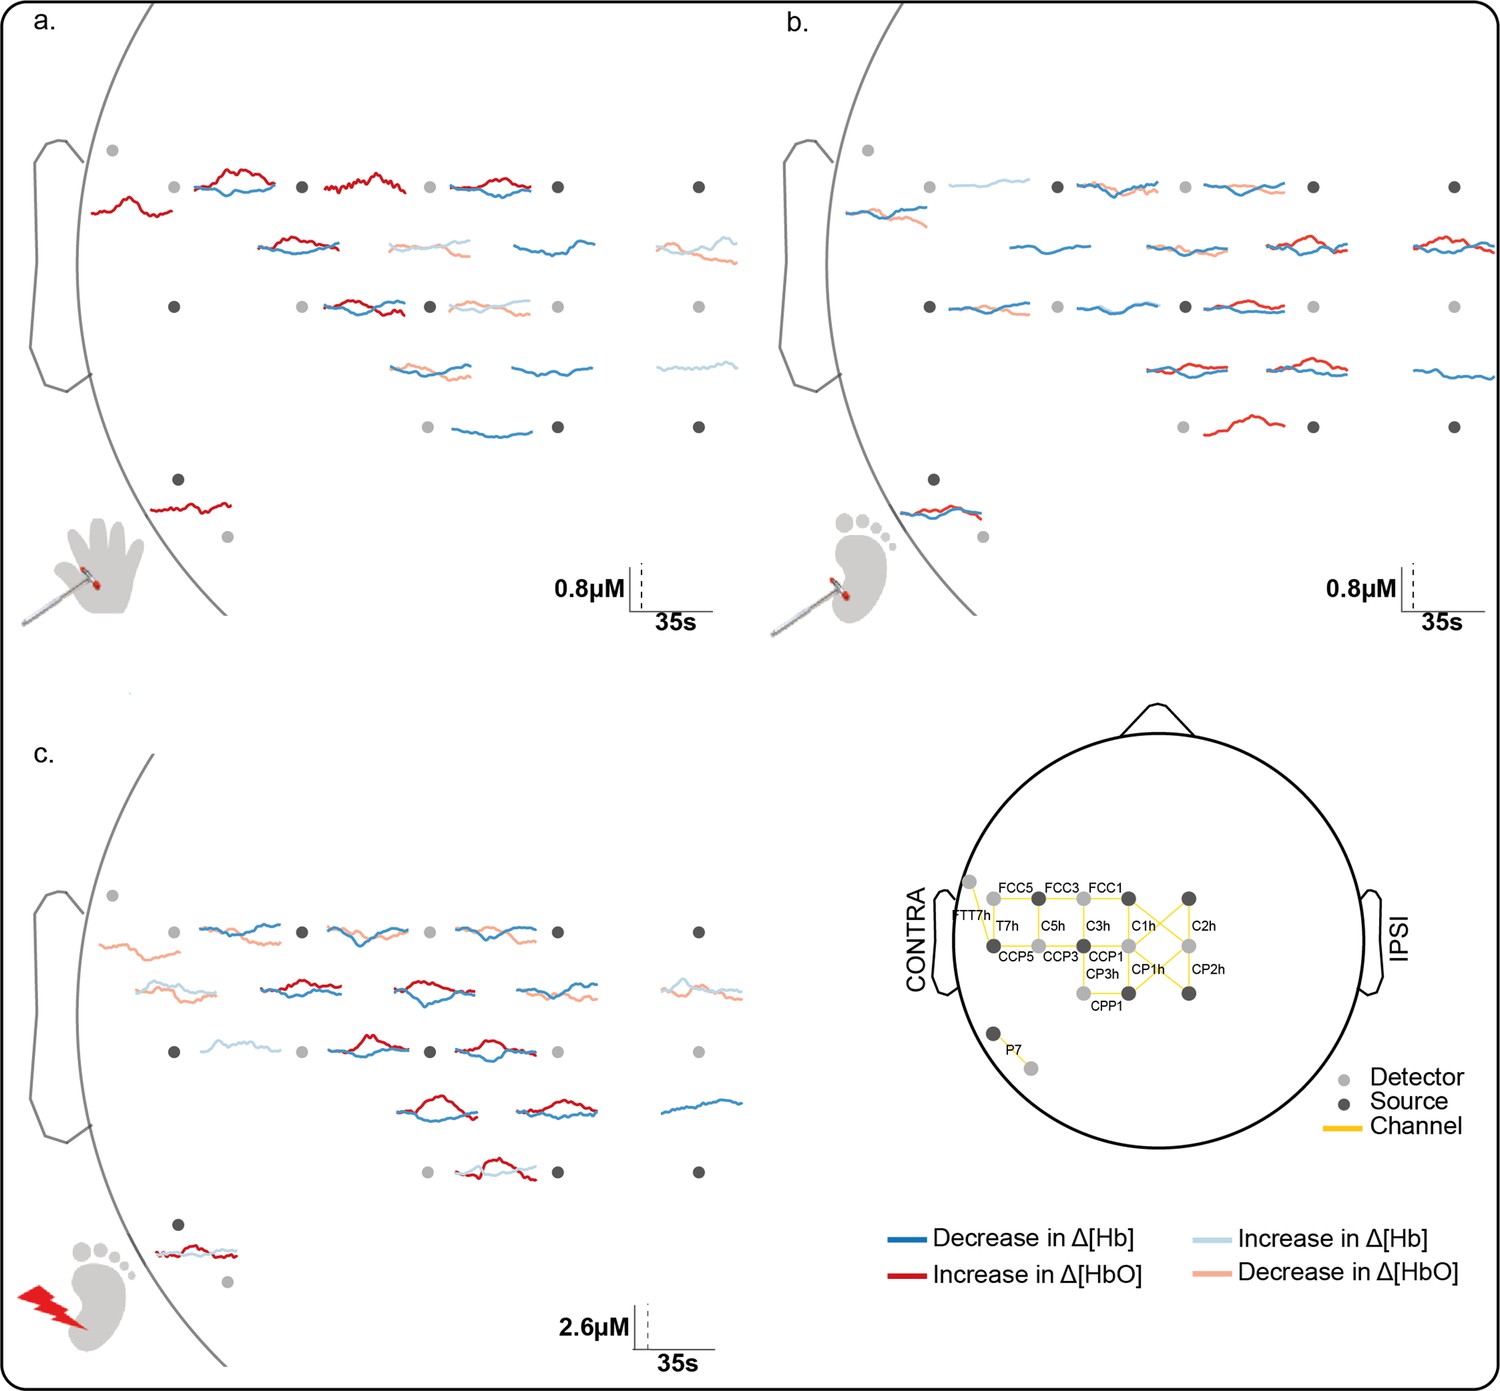
Significant channel-wise haemodynamic response following innocuous (touch) and noxious (lance) mechanical stimulation of hand and heel.
Average significant change in concentration of oxygenated (Δ[HbO]) (red) and deoxygenated haemoglobin (Δ[Hb]) (blue) during (a) hand touch (n = 11), (b) heel touch (n = 16), and (c) heel lance (n = 11). Channels with significant increases in Δ[HbO] and decreases in Δ[Hb] (i.e. canonical response) during the activation period are shown with solid dark lines, channels with an inverse response only (decrease in Δ[HbO] and increase in Δ[Hb]) are shown with pale solid lines. Note the difference in the scale bar between touch and lance. The equivalent plots for non-significant changes are shown in Figure 1—figure supplement 1 and details of individual channel responses are in Figure 1—source data 1.
-
Figure 1—source data 1
Significant concentration changes at each channel following innocuous mechanical stimulation (touch) of the heel and the hand and following heel lance.
- https://cdn.elifesciences.org/articles/71655/elife-71655-fig1-data1-v2.xlsx
Figure 1—figure supplement 1
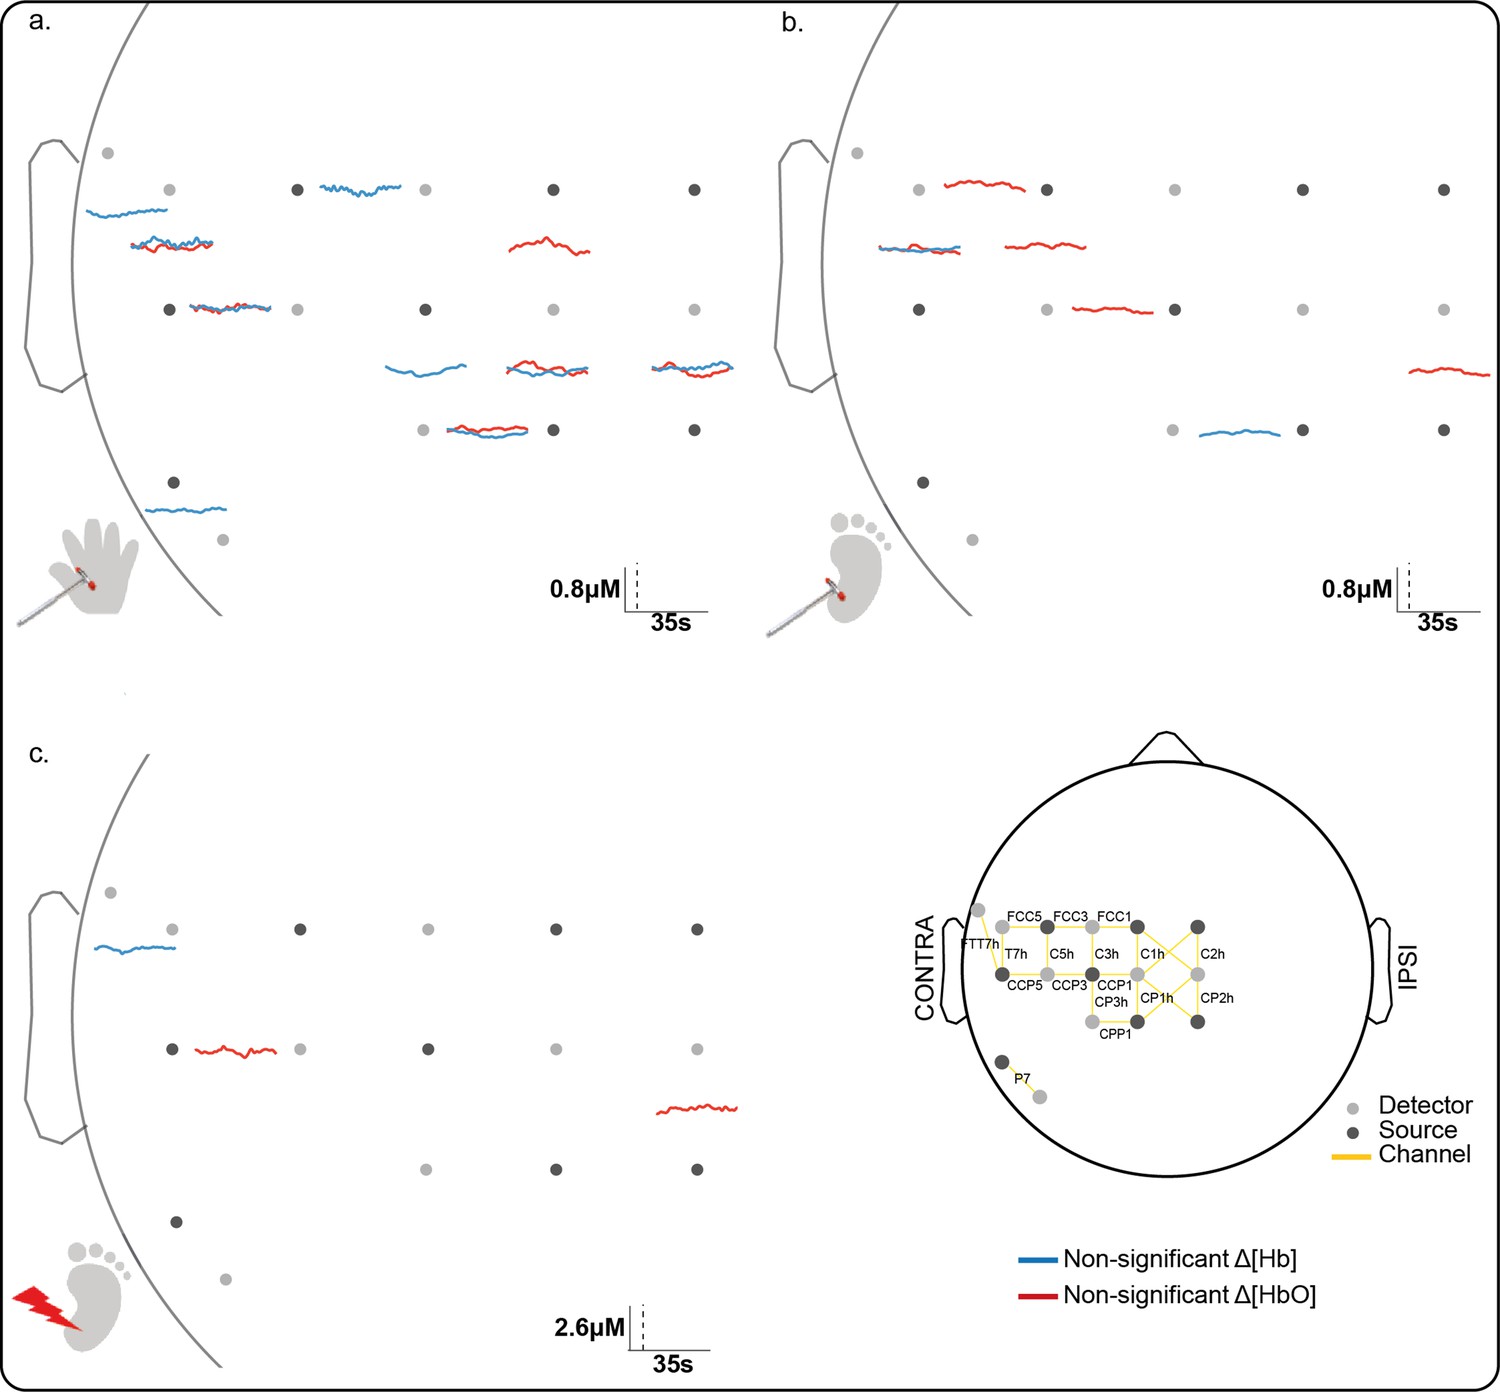
Non-significant channel-wise haemodynamic responses following innocuous and noxious mechanical stimulation of hand and heel.
Average non-significant change in concentration of oxygenated (Δ[HbO]) (red) and deoxygenated haemoglobin (Δ[Hb]) (blue) during (a) hand touch (n = 11), (b) heel touch (n = 16), and (c) heel lance (n = 11). Channels with increases in Δ[HbO] and decreases in Δ[Hb] (i.e. canonical response) during the activation period are shown with sold dark lines, inverse responses are shown with solid pale lines. Black vertical line represents stimulus onset. Note the difference in the scale bar between touch and lance. For channels where a non-significant canonical and inverse response was found at different latencies, the canonical response only is depicted.
Figure 1—figure supplement 2
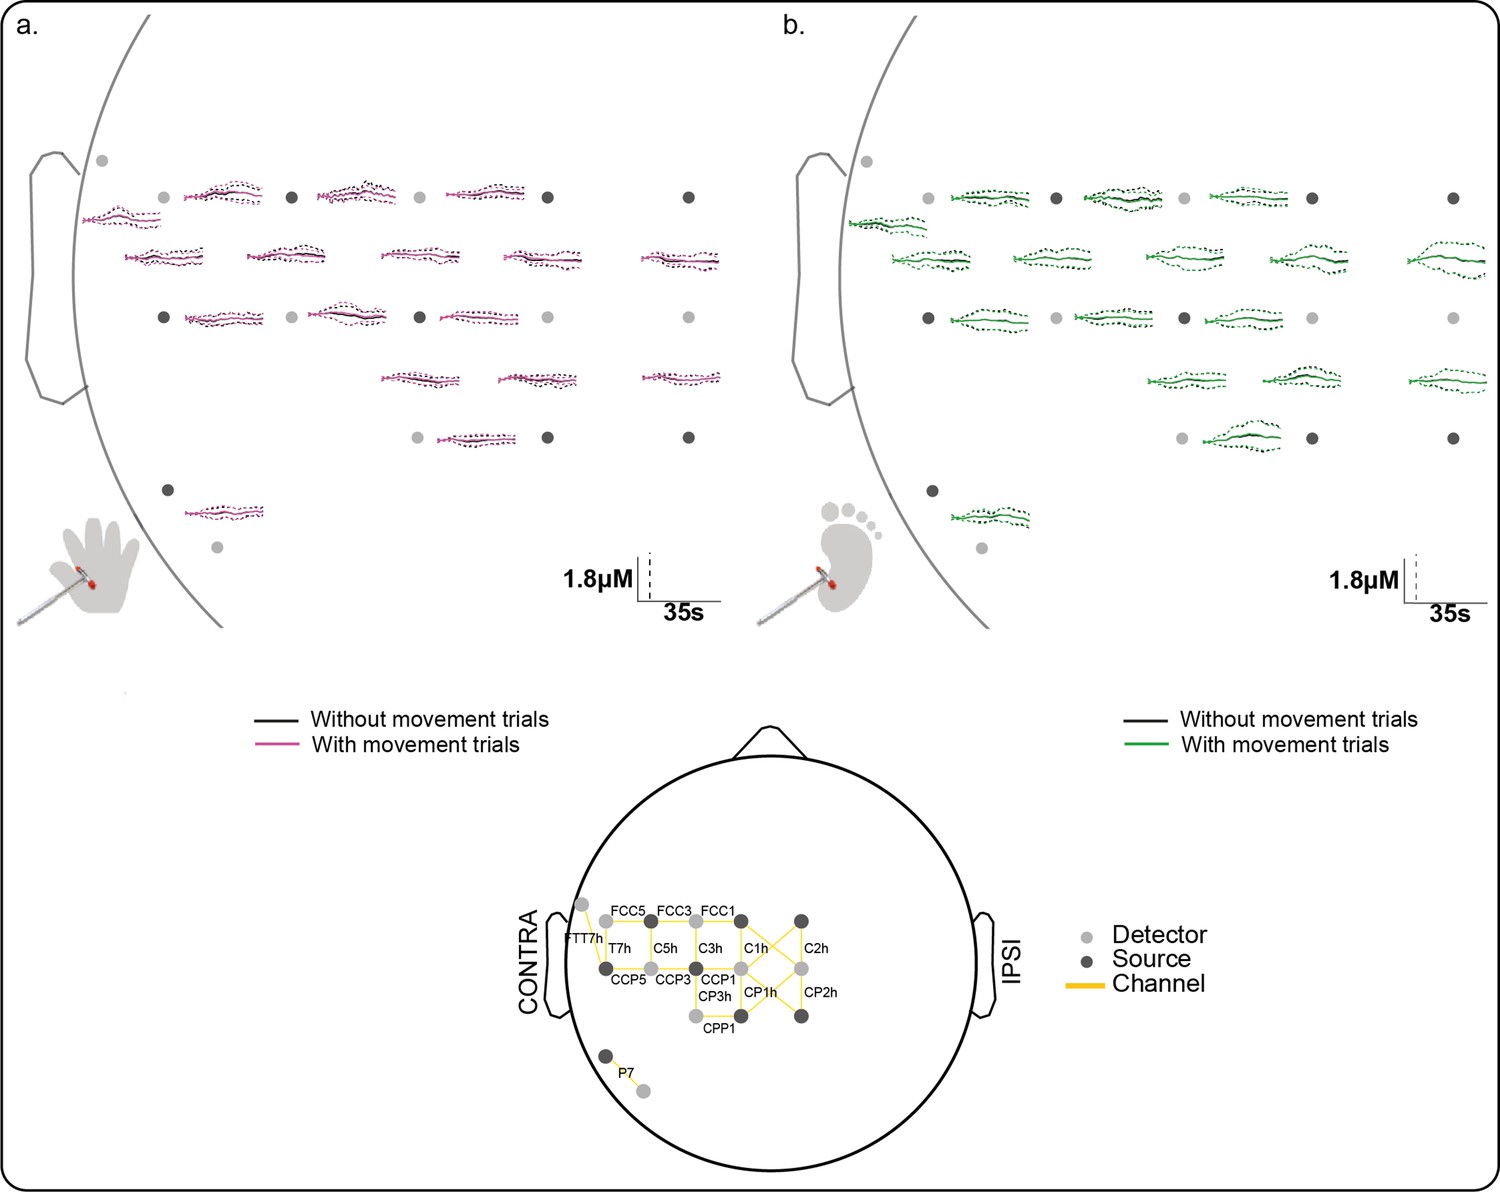
Average channel-wise Δ[HbO] response following innocuous mechanical stimulation of the hand and heel with and without excluding trials with movement.
Average change in concentration of oxygenated (Δ[HbO]) haemoglobin during (a) hand touch (n = 11) and (b) heel touch (n = 16) with (pink/green) and without (black) trials during which the infant moved. Dashed lines represent standard deviation. No significant differences were found at any channel.
Figure 2

Image reconstruction at peak latency of the Δ[HbO] and Δ[Hb] response to an innocuous (touch) and noxious (lance) mechanical stimulation of hand and heel.
Significant changes (compared to baseline) in concentration of oxygenated (Δ[HbO]) (top row) and deoxygenated haemoglobin (Δ[Hb]) (bottom row) following (a) hand touch (n = 11), (b) heel touch (n = 16), and (c) heel lance (n = 11).
Figure 3 with 1 supplement
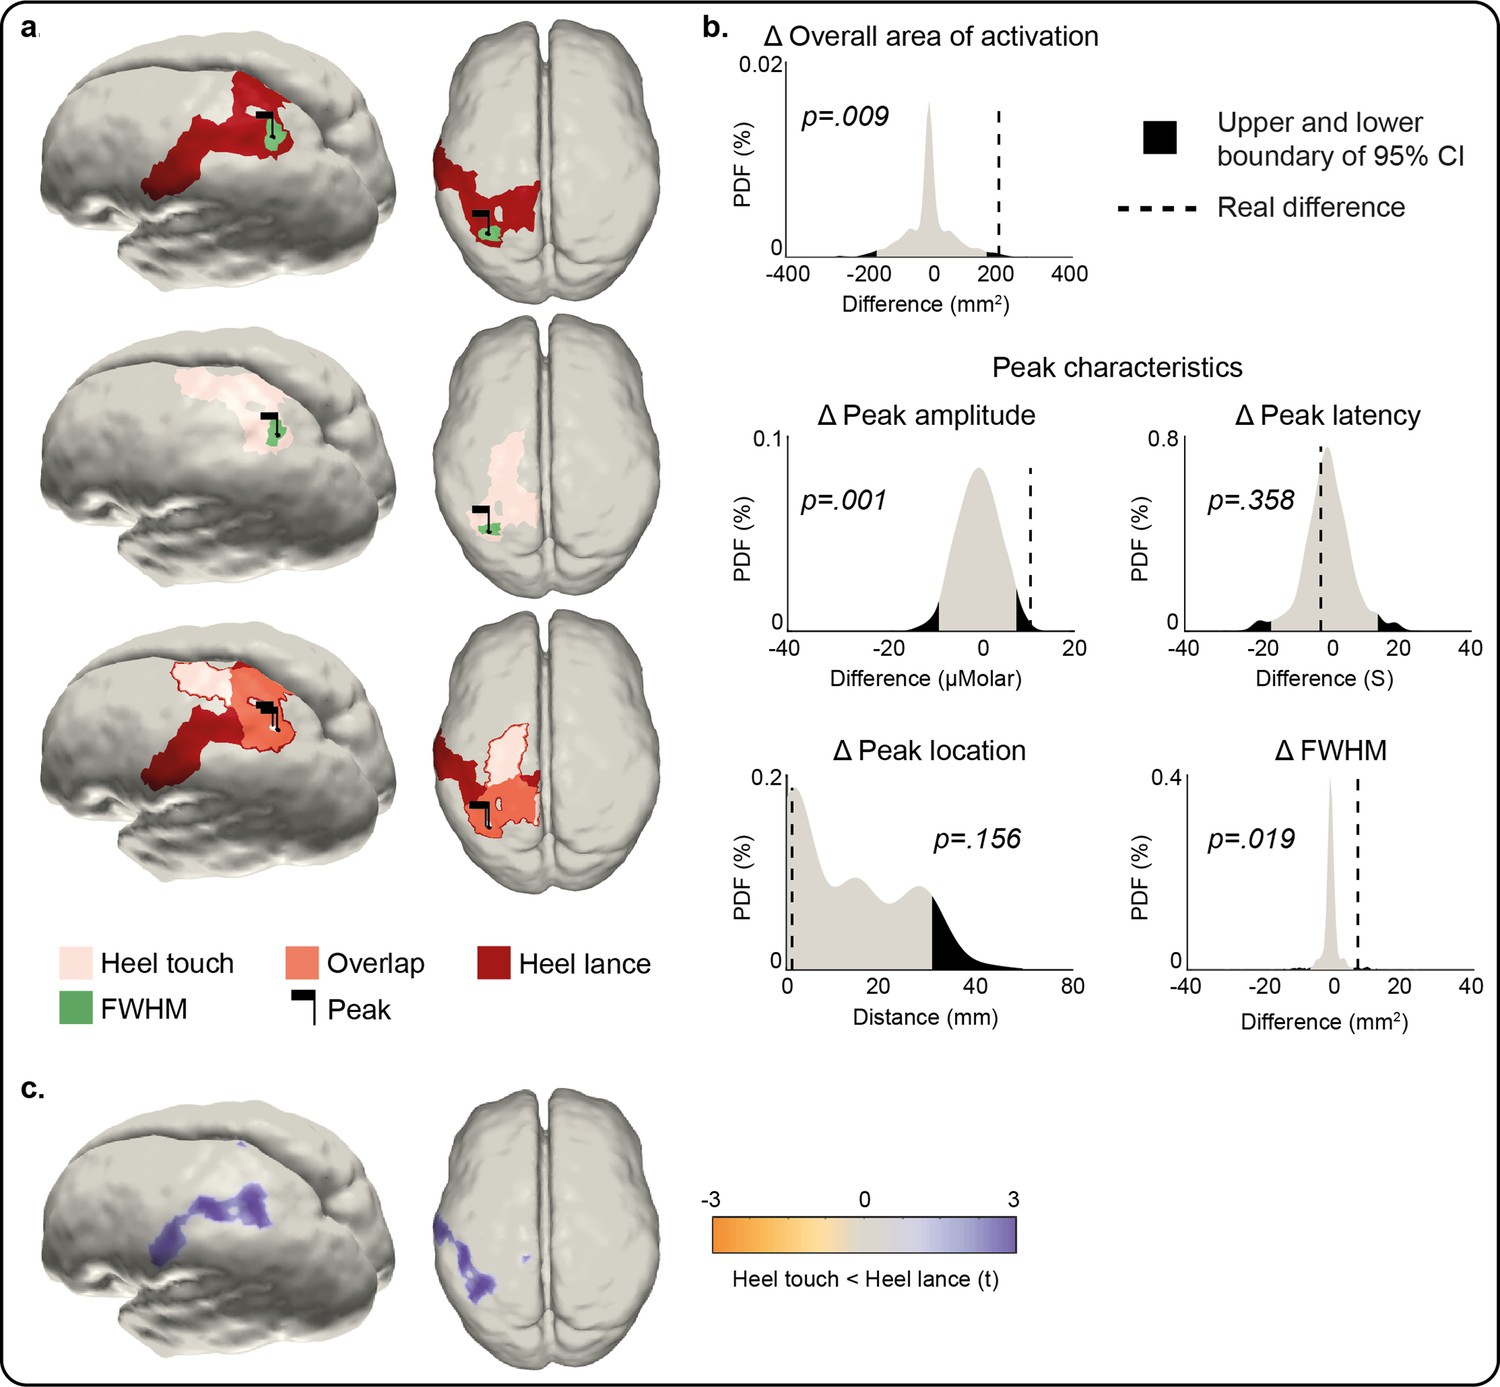
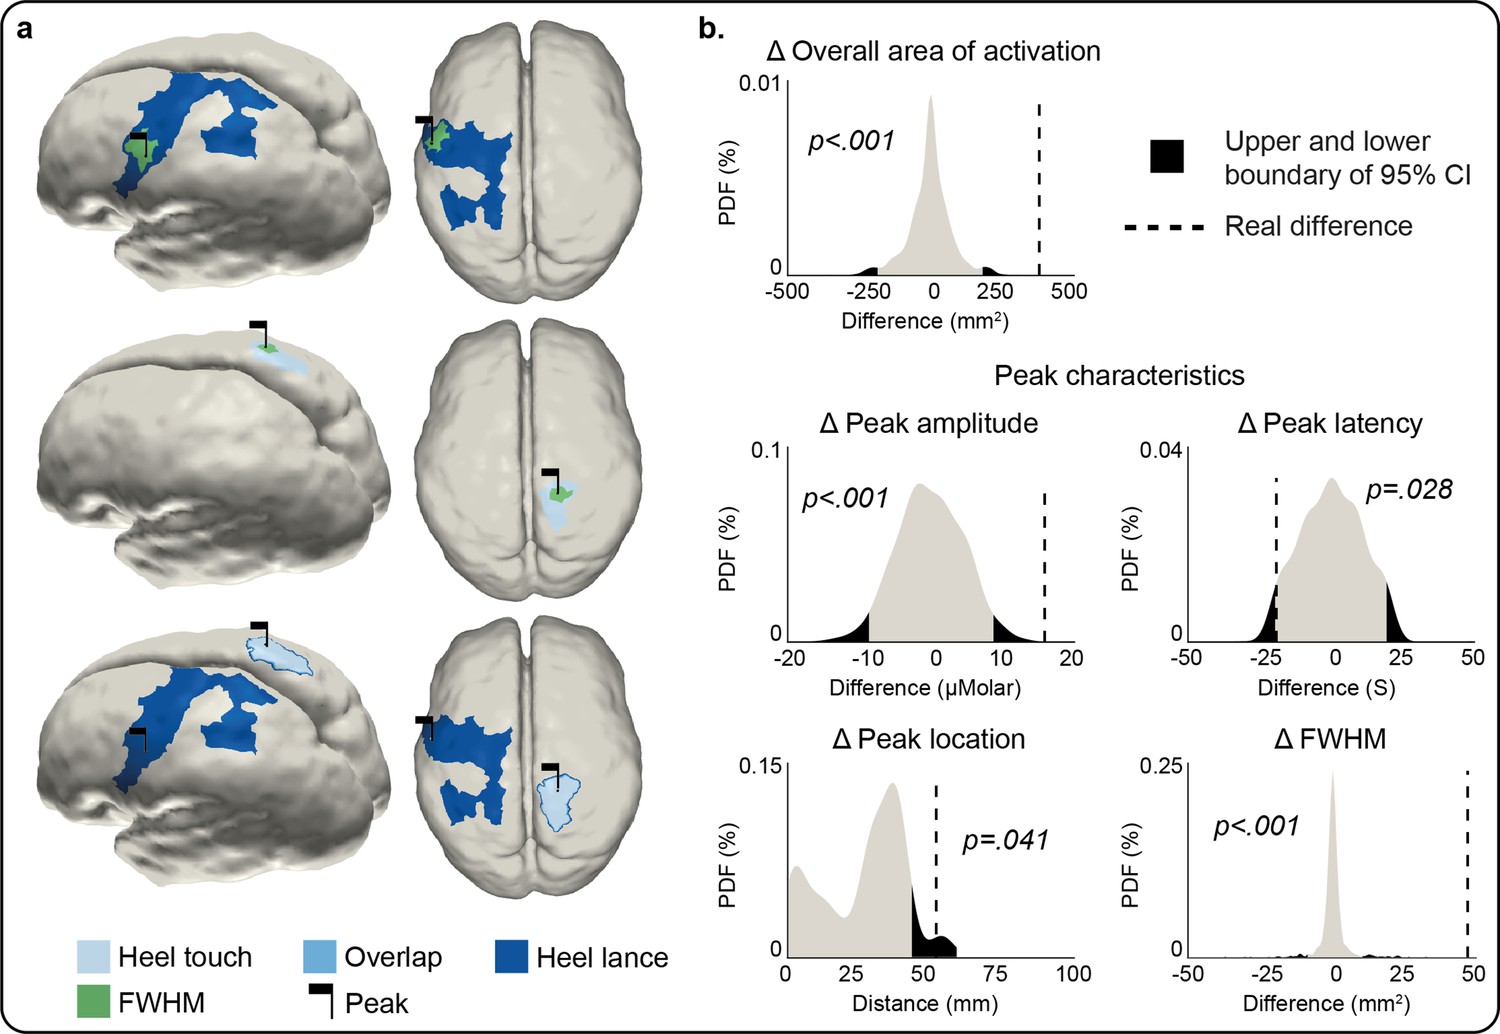
Comparison of the peak and area of activation of the Δ[HbO] response to an innocuous (touch) and noxious (lance) mechanical stimulation of the heel.
(a) Overall area of significant changes in concentration of oxygenated haemoglobin (Δ[HbO]) following heel lance (red), heel touch (pink), and both (orange). Black flags demark the location of peak changes and green areas the extent of their full-width half-maximum (FWHM). (b) Statistical position of real differences between heel touch and lance in peak amplitude, FWHM, latency and location, and overall area of activation in respect to non-parametric null distributions obtained with bootstrapping and phase scrambling. (c) Comparison of response magnitude at each node. Results show the t-statistic at significantly different nodes within the areas of activation shown in (a). The equivalent plots forΔ[Hb] are shown in Figure 3—figure supplement 1 and Figure 3—source data 1.
-
Figure 3—source data 1
Comparison of Δ[HbO] and Δ[Hb] responses to an innocuous (touch) and noxious (lance) mechanical stimulation of the heel.
Parameter estimates for the change in oxygenated haemoglobin (Δ[HbO]) and deoxygenated haemoglobin (Δ[Hb]) following a heel lance and heel touch, and p value from statistical comparison. A two-tailed test was used (α = 0.025) for all parameters except peak location (α = 0.05). The Euclidean distance between the heel touch and heel lance peak locations has been provided rather than x, y, z coordinates of each peak. Linked to Figure 3 and Figure 3—figure supplement 1 .
- https://cdn.elifesciences.org/articles/71655/elife-71655-fig3-data1-v2.xlsx
Figure 3—figure supplement 1
Comparison of the peak and area of activation of the Δ[Hb] response to an innocuous (touch) and noxious (lance) mechanical stimulation of the heel.
(a) Overall area of significant changes in concentration of deoxygenated haemoglobin (Δ[Hb]) following heel lance (dark blue), heel touch (pale blue), and both (mid blue). Black flags demark the location of peak changes and green areas the extent of their full-width half-maximum (FWHM). (b) Statistical position of real differences between heel touch and lance in peak amplitude, FWHM, latency and location, and overall area of activation in respect to non-parametric null distributions obtained with bootstrapping and phase scrambling.
Figure 4
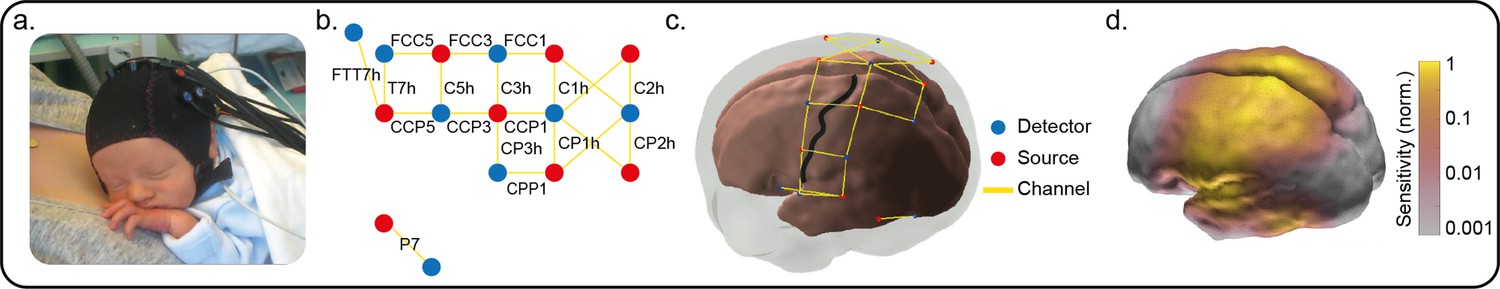
Optode locations and sensitivity map.
(a) Typical functional near-infrared spectroscopy (fNIRS) setup on a neonate of 35+2 weeks’ gestational age (GA), 7 days’ postnatal age (PNA). (b) Channel locations according to the international 10–5 placement system (Oostenveld and Praamstra, 2001). Names of four diagonal channels (channels overlaying Cz and CPz) are not included as these were omitted from the analysis due to low signal-to-noise ratio. (c) Locations of the fNIRS sources, detectors and resulting measurement channels registered to a 39-week anatomical atlas. The central sulcus has been highlighted with a black line and the location of S1 is the gyrus posterior to this sulcus. (d) Normalised fNIRS sensitivity illustrating the spatial coverage provided by the channel arrangement in panel (c). This sensitivity map was calculated using the photon measurement density functions derived from the TOAST++ light transport modelling package.
Author response image 1

Tables
Table 1
Infant demographics.
Demographic information about the subjects that received tactile and noxious stimuli of heel and hand.
| Heel lance | Heel touch | Hand touch | p | |
|---|---|---|---|---|
| N | 11 | 16 | 11 | |
| GA (weeks+days) | 39+2 (35+2–41+5) | 39+4 (35–42+3) | 39+2 (37+5–41+3) | 0.287 |
| PNA (days) | 4 (0–7) | 3 (0–6) | 3 (0–4) | 0.115 |
| Females | 4 (36%) | 6 (38%) | 5 (45%) | 0.889 |
| Birth weight (g) | 3134 (2220–4072) | 3250 (2360–4080) | 3300 (2450–3754) | 0.774 |
| Caesarean deliveries | 2 (18%) | 8 (50%) | 3 (27%) | 0.196 |
| Head circumference (cm) | 34 (32–35.5) | 34.25 (31–37) | 34 (32.5–36) | 0.900 |
-
Values represent median and range or proportion. GA = gestational age (weeks from the first day of the mother’s last menstrual cycle to birth); PNA = postnatal age (days since birth). No significant difference was found in any demographic parameter across the three groups (one-way ANOVA results in the last column).
Table 2
Infant movements.
The number of infants who displayed movements or received tactile stimulation from their mother each second in the 30 s following lance.
| Number of infant and maternal movements | |||||||
|---|---|---|---|---|---|---|---|
| Post-lance (s) | Hand | Head | Face | Foot | Arm | Mother touching face | Mother touching head |
| 1 | 1 | 1 | 4 | 0 | 2 | 1 | 1 |
| 2 | 1 | 1 | 6 | 1 | 2 | 1 | 1 |
| 3 | 1 | 0 | 6 | 1 | 2 | 1 | 1 |
| 4 | 1 | 0 | 6 | 0 | 2 | 1 | 1 |
| 5 | 1 | 1 | 6 | 0 | 2 | 1 | 1 |
| 6 | 1 | 1 | 6 | 0 | 2 | 1 | 0 |
| 7 | 0 | 1 | 4 | 0 | 1 | 1 | 0 |
| 8 | 0 | 1 | 3 | 0 | 1 | 1 | 0 |
| 9 | 0 | 1 | 2 | 0 | 1 | 1 | 0 |
| 10 | 0 | 0 | 1 | 0 | 1 | 1 | 0 |
| 11 | 0 | 0 | 1 | 0 | 1 | 1 | 0 |
| 12 | 0 | 0 | 1 | 0 | 1 | 1 | 0 |
| 13 | 0 | 0 | 1 | 0 | 1 | 1 | 0 |
| 14 | 0 | 0 | 1 | 0 | 1 | 1 | 0 |
| 15 | 0 | 0 | 1 | 0 | 0 | 1 | 0 |
| 16 | 0 | 0 | 1 | 0 | 0 | 1 | 0 |
| 17 | 0 | 0 | 0 | 0 | 0 | 1 | 0 |
| 18 | 0 | 0 | 0 | 0 | 0 | 1 | 0 |
| 19 | 0 | 0 | 0 | 0 | 0 | 1 | 0 |
| 20 | 0 | 0 | 0 | 0 | 0 | 1 | 0 |
| 21 | 0 | 0 | 0 | 0 | 0 | 1 | 0 |
| 22 | 0 | 0 | 0 | 0 | 0 | 1 | 0 |
| 23 | 0 | 0 | 0 | 0 | 0 | 1 | 0 |
| 24 | 0 | 0 | 0 | 0 | 0 | 1 | 0 |
| 25 | 0 | 0 | 0 | 0 | 0 | 1 | 0 |
| 26 | 0 | 0 | 0 | 0 | 0 | 1 | 0 |
| 27 | 0 | 0 | 0 | 0 | 0 | 1 | 0 |
| 28 | 0 | 0 | 0 | 0 | 0 | 1 | 0 |
| 29 | 0 | 0 | 0 | 0 | 0 | 1 | 0 |
| 30 | 0 | 0 | 0 | 0 | 0 | 1 | 0 |
-
Each movement or stimulation was scored as present (1) or not present (0) per infant, and the value in each cell represents the total number of infants (out of 11) for whom each movement or stimulation was observed.
Additional files
Download links
A two-part list of links to download the article, or parts of the article, in various formats.
Downloads (link to download the article as PDF)
Open citations (links to open the citations from this article in various online reference manager services)
Cite this article (links to download the citations from this article in formats compatible with various reference manager tools)
Widespread nociceptive maps in the human neonatal somatosensory cortex
eLife 11:e71655.
https://doi.org/10.7554/eLife.71655


