Analysis of long and short enhancers in melanoma cell states
- VIB-KU Leuven Center for Brain & Disease Research, Belgium
- KU Leuven, Department of Human Genetics KU Leuven, Belgium
- Cancer Genomics Laboratory, The Francis Crick Institute, United Kingdom
Figures
Figure 1 with 1 supplement
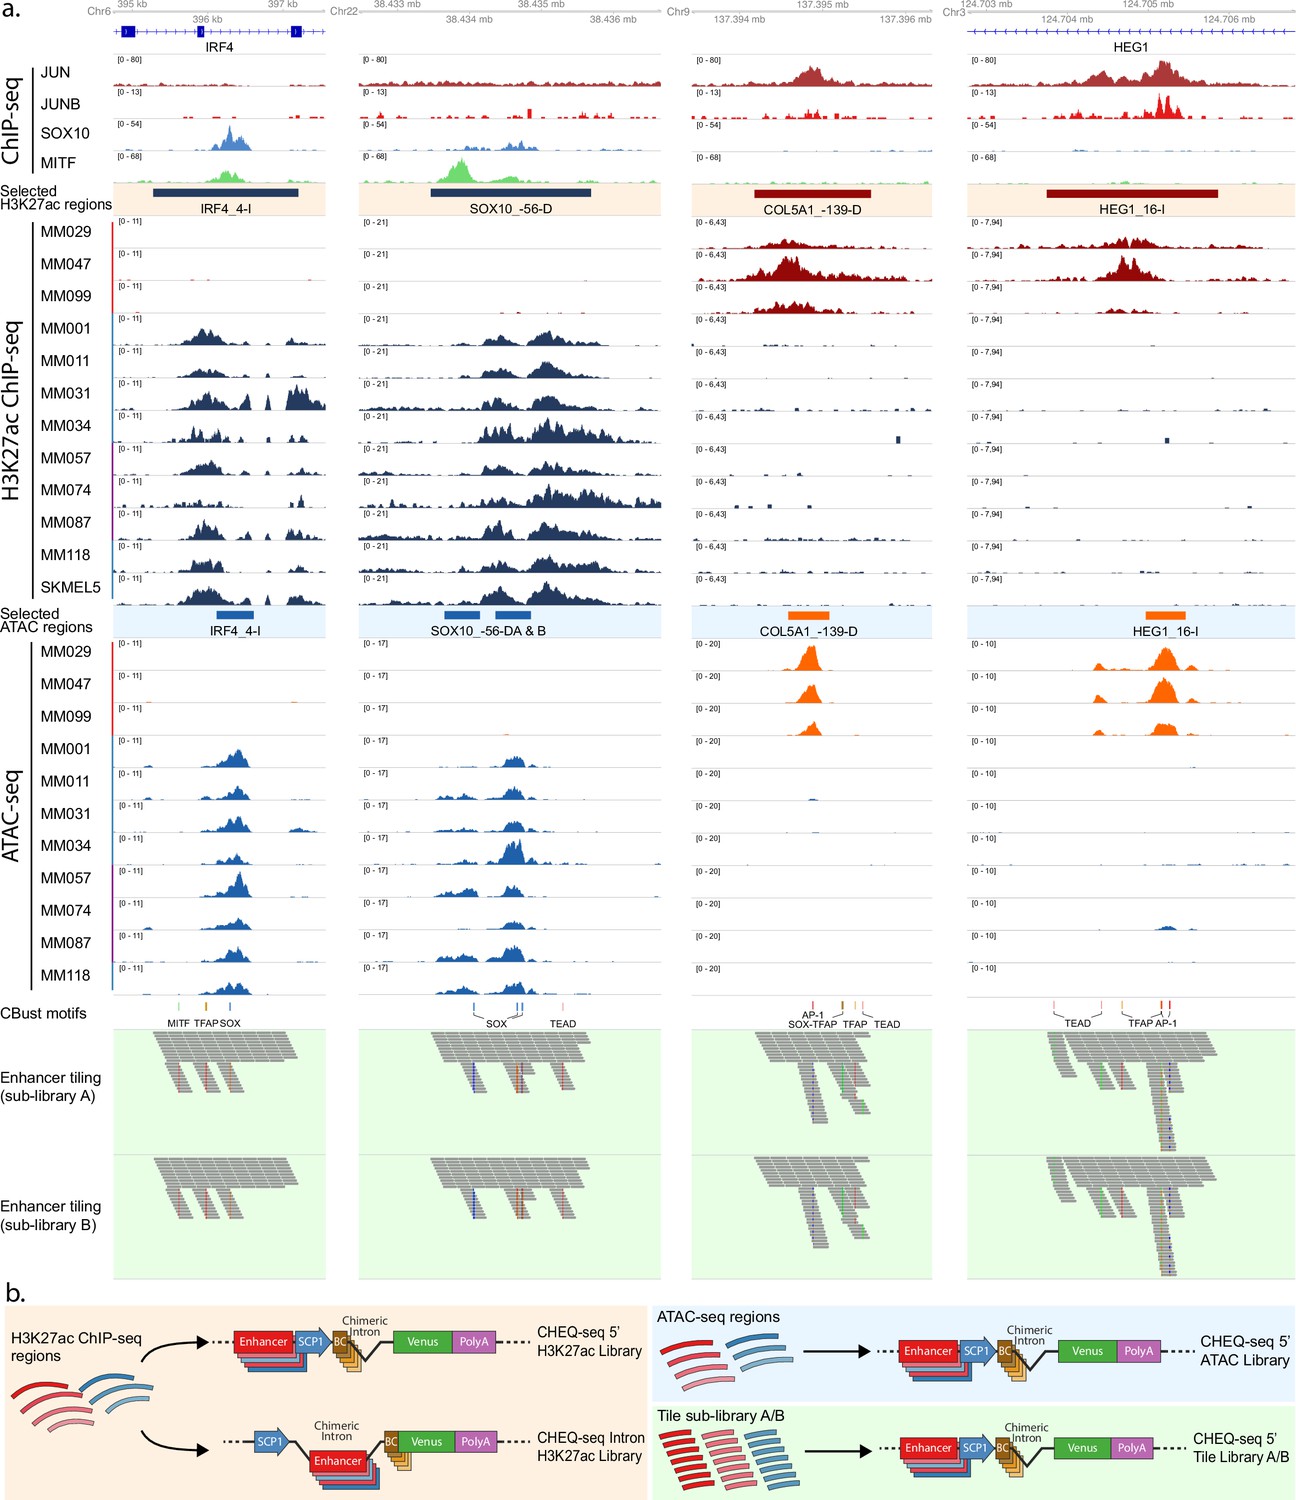
Selection and cloning of melanoma state specific regions.
(a) Cell state-specific regions were selected based on H3K27ac ChIP-seq signal from a panel of melanoma cell lines containing both mesenchymal-like (MES) (red bar) and melanocytic (MEL) lines (pure MEL: blue bar; intermediate MEL: purple bar). ATAC-seq data from the same lines were used to identify accessibility peaks within these regions. Finally, the regions were tiled with 190 bp tiles with a shift of 20 bp (sublibrary A). Sublibrary B was generated by shifting all tiles 10 bp downstream. Cluster-Buster (CBust) was used to identify transcription factor (TF) motifs, and new tiles were generated with mutated motifs. (b) Reporter vector configurations used for the evaluation of the H3K27ac enhancers (left panel), the ATAC-seq enhancers (top-right panel), and the enhancer tiling (bottom-right panel). SCP1, Super Core Promoter 1; BC, barcode.
Figure 1—figure supplement 1
Selection pipeline and cell line profiles.
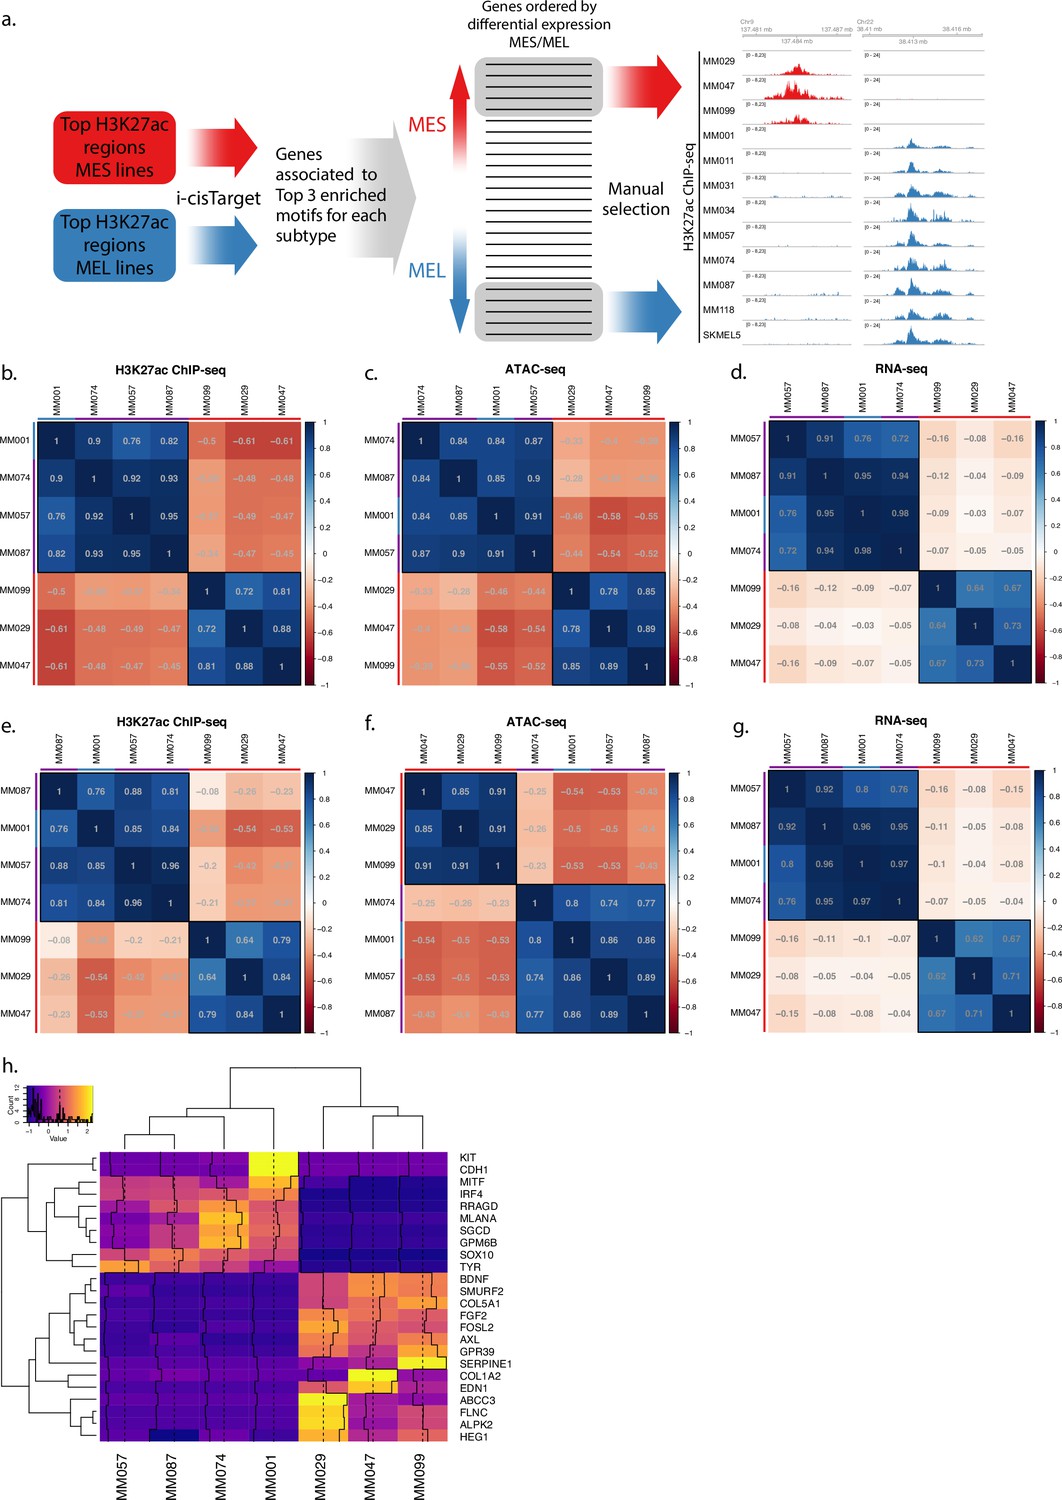
(a) Region selection flowchart. Top differentially acetylated regions for each subtype are used as input to i-cisTarget. The top three enriched motifs are selected and the list of genes associated with those motifs is used to filter the list of differentially expressed genes. Subtype-specific regions are manually selected by looking at the genome ~150 kb upstream and downstream of the remaining top differentially expressed genes. (b–d) Correlation tables displaying the Pearson’s correlation coefficient for H3K27ac ChIP-seq mean signal of the H3K27ac library regions (b), ATAC-seq mean signal of the same regions (c), and gene expression of the predicted region’s target genes from single-cell RNA-seq (d). (e–g) Same correlation tables as (b–d) but for the ATAC-based library regions. Red, purple, and blue bars indicate mesenchymal-like (MES), intermediate, and melanocytic (MEL) lines, respectively. (h) Mean transcript expression from single-cell RNA-seq data of each gene associated with an enhancer.
Figure 2 with 2 supplements
Enhancer activity in MM001.
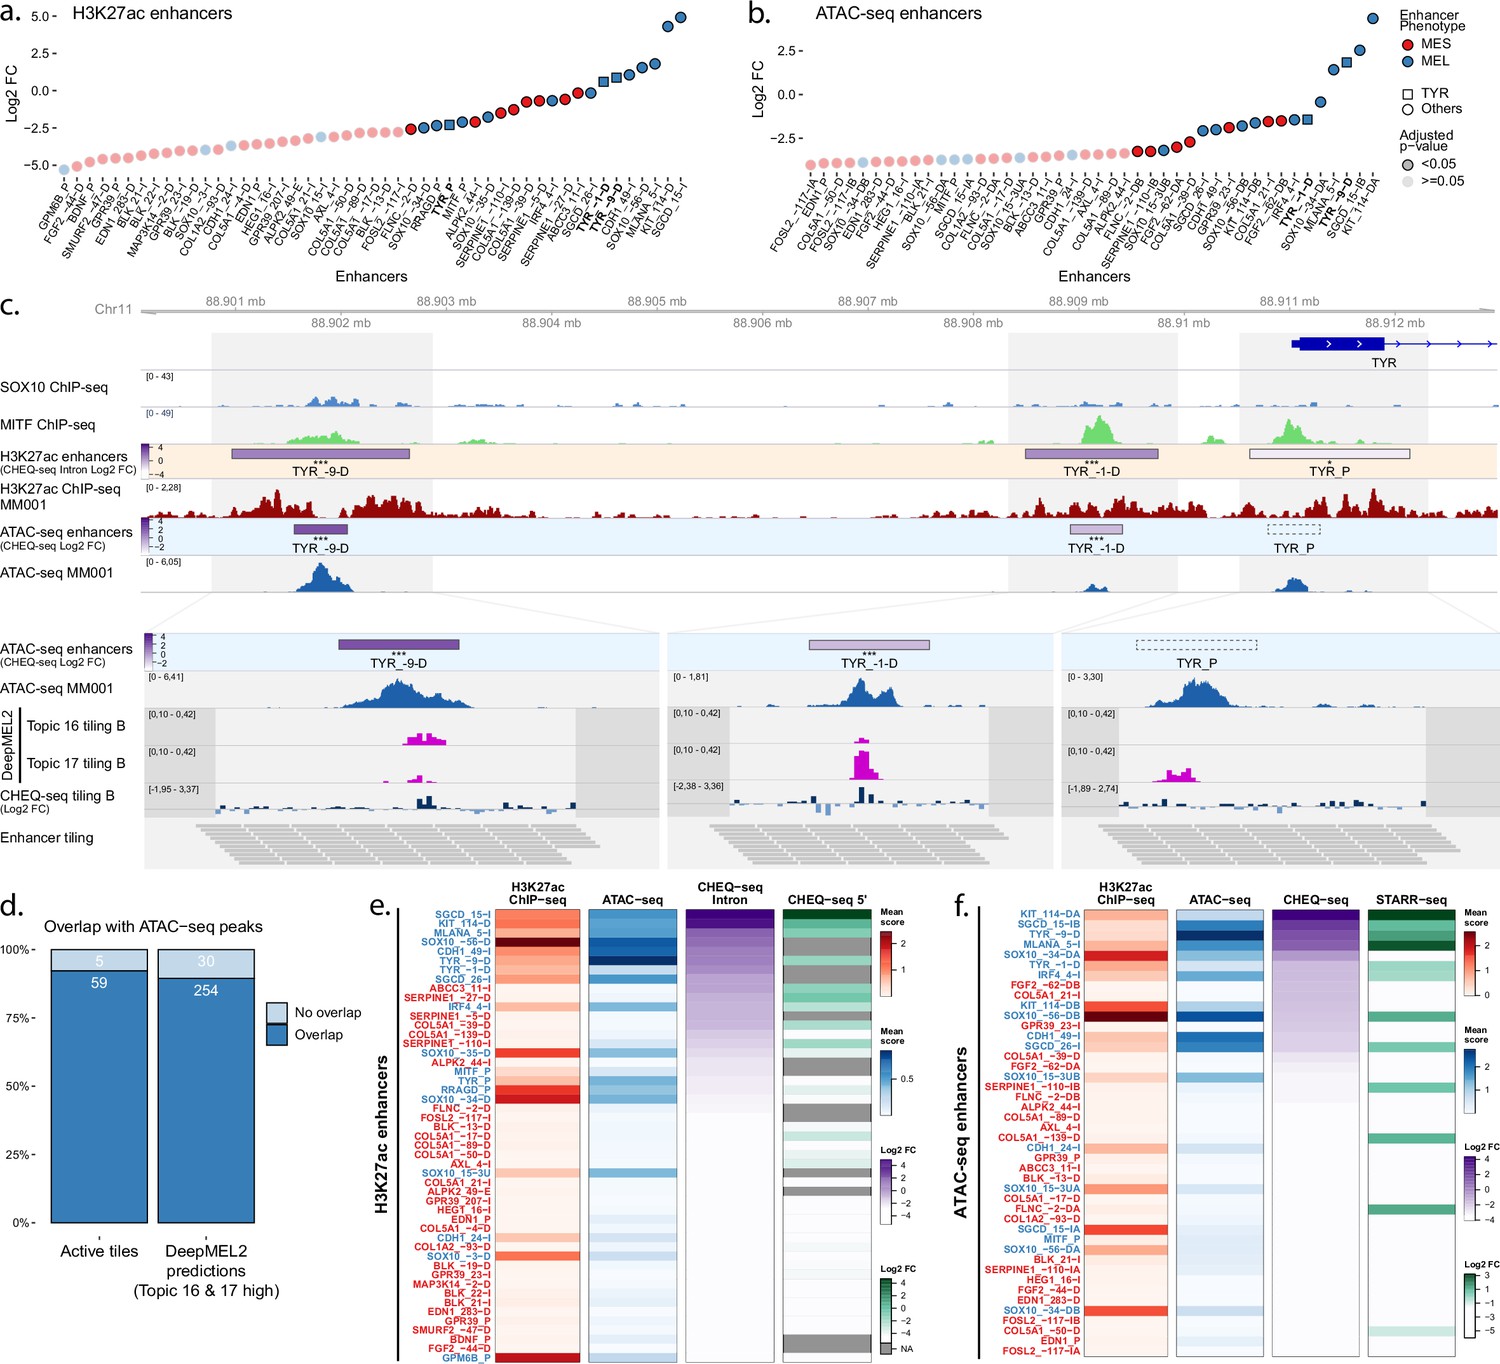
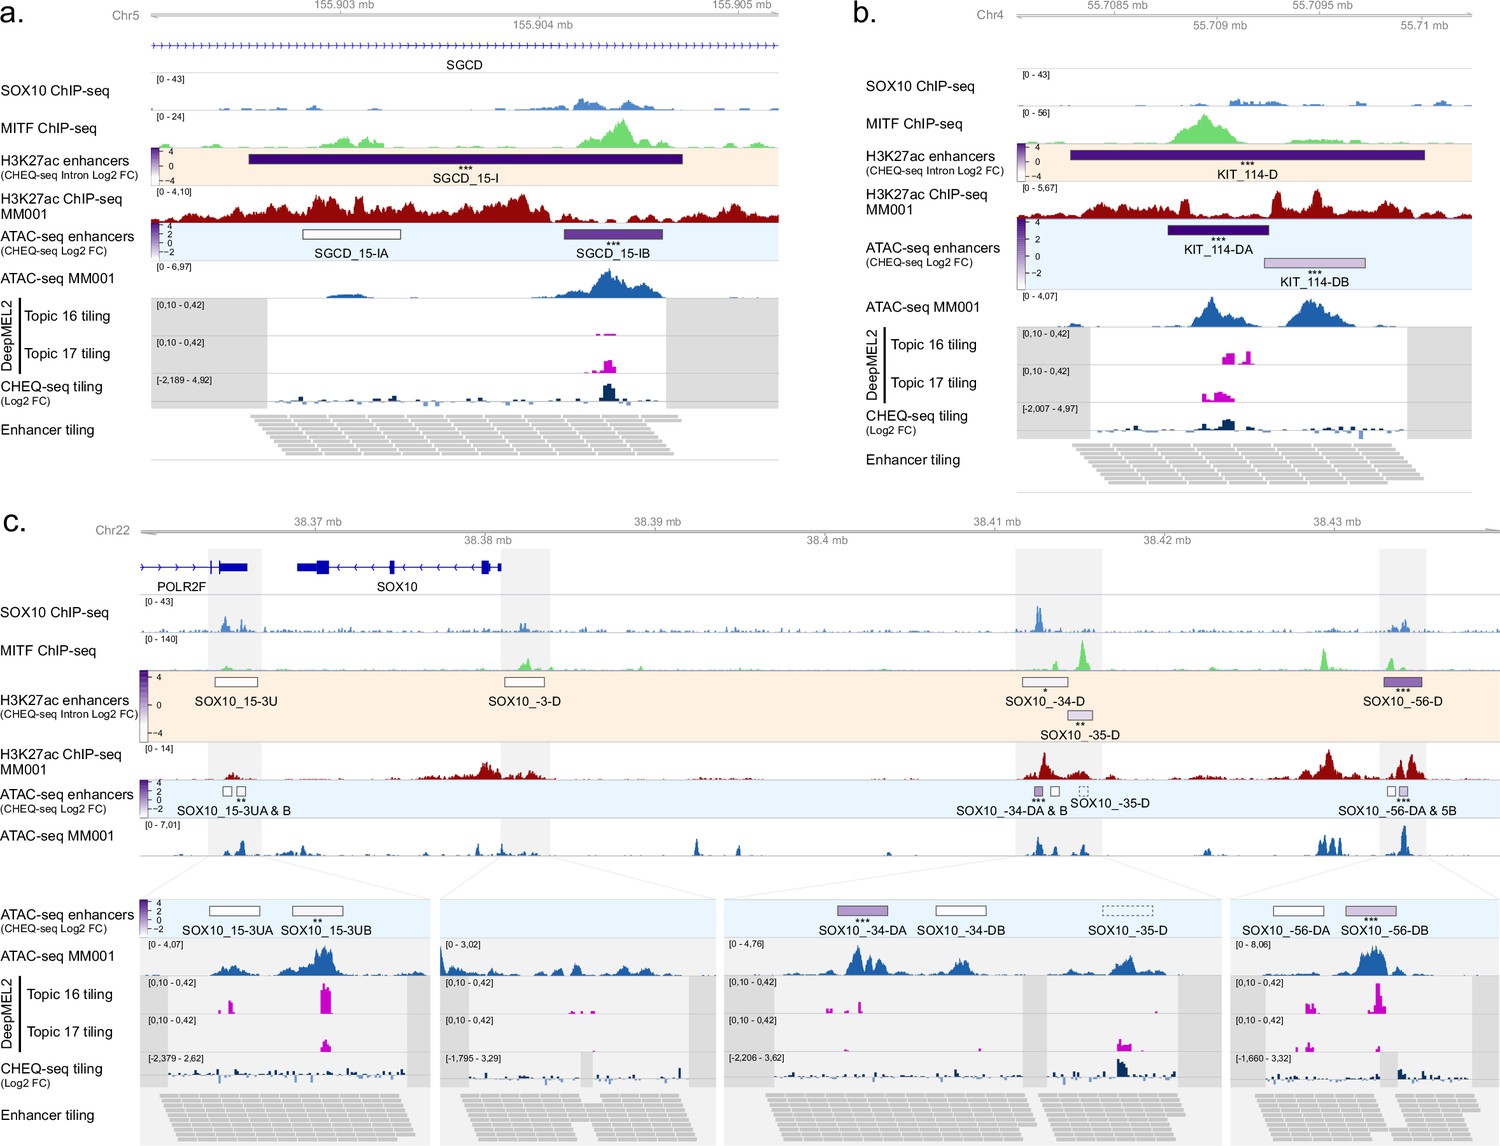
(a, b) Enhancer activity profile for the CHEQ-seq intron H3K27ac library (a) and CHEQ-seq ATAC-seq library (b). Enhancer regions displayed in panel (c) have their name indicated in bold and their value is displayed with a triangle. (c) Enhancer activity of regions selected around the TYR genes. SOX10 and MITF ChIP-seq as well as H3K27ac ChIP-seq and ATAC-seq for MM001 are displayed, and, in the zoomed-in regions (light gray areas), DeepMEL2 predictions and CHEQ-seq values of the enhancer tiling B library are represented. Dark gray areas are regions not covered by a tile. CHEQ-seq activity is visible in the ‘H3K27ac enhancers’ and ‘ATAC-seq enhancers’ tracks. Benjamini–Hochberg adjusted p-values: *<0.05; ***<0.001. Dashed box: region not recovered following DNA synthesis, cloning, or massively parallel reporter assay (MPRA). (d) Percentage of overlap between active tiles and ATAC-seq peaks (left) and high DeepMEL2 predictions with ATAC-seq peaks (right).(e, f) Heatmaps of H3K27ac library (e) and ATAC-seq library (f), displaying H3K27ac ChIP-seq signal, ATAC-seq signal, and enhancer activity in MM001 ordered by MPRA values. Only MPRA values of significantly active enhancers are displayed.
-
Figure 2—source data 1
CHEQ-seq 5′ H3K27ac activity.
Enhancer activity values for the CHEQ-seq 5′ H3K27ac library in all cell lines. These data were also used in Figures 3 and 6, Figure 2—figure supplement 1, and Figure 3—figure supplement 1.
- https://cdn.elifesciences.org/articles/71735/elife-71735-fig2-data1-v2.txt
-
Figure 2—source data 2
CHEQ-seq intron H3K27ac activity.
Enhancer activity values for the CHEQ-seq intron H3K27ac library in all cell lines. These data were also used in Figures 2—6, Figure 2—figure supplements 1 and 2, Figure 3—figure supplements 1 and 2, and Figure 4—figure supplement 1.
- https://cdn.elifesciences.org/articles/71735/elife-71735-fig2-data2-v2.txt
-
Figure 2—source data 3
CHEQ-seq ATAC activity.
Enhancer activity values for the CHEQ-seq ATAC library in all cell lines. These data were also used in Figures 3—6, Figure 2—figure supplements 1 and 2, Figure 3—figure supplements 1 and 2, and Figure 4—figure supplement 1.
- https://cdn.elifesciences.org/articles/71735/elife-71735-fig2-data3-v2.txt
-
Figure 2—source data 4
CHEQ-seq tiling library B activity.
Enhancer activity values for the CHEQ-seq enhancer tiling library B in all cell lines. These data were also used in Figures 3—6Figure 2—figure supplement 2Figure 3—figure supplement 2, Figure 4—figure supplement 1, Figure 5—figure supplement 1, and Figure 6—figure supplement 1.
- https://cdn.elifesciences.org/articles/71735/elife-71735-fig2-data4-v2.txt
-
Figure 2—source data 5
DeepMEL2 prediction scores for tiling library B.
DeepMEL2_GABPA prediction scores for the enhancer tiling B library. These data were also used in Figures 3, 5 and 6, Figure 2—figure supplement 2, Figure 3—figure supplement 2, and Figure 4—figure supplement 1.
- https://cdn.elifesciences.org/articles/71735/elife-71735-fig2-data5-v2.txt
-
Figure 2—source data 6
STARR-seq ATAC activity.
Enhancer activity values for the STARR-seq ATAC library in all cell lines. These data were also used in Figures 3 and 6, Figure 2—figure supplement 1, and Figure 3—figure supplement 1.
- https://cdn.elifesciences.org/articles/71735/elife-71735-fig2-data6-v2.txt
Figure 2—figure supplement 1
Additionnal MPRAs on H3K27ac and ATAC regions in MM001.
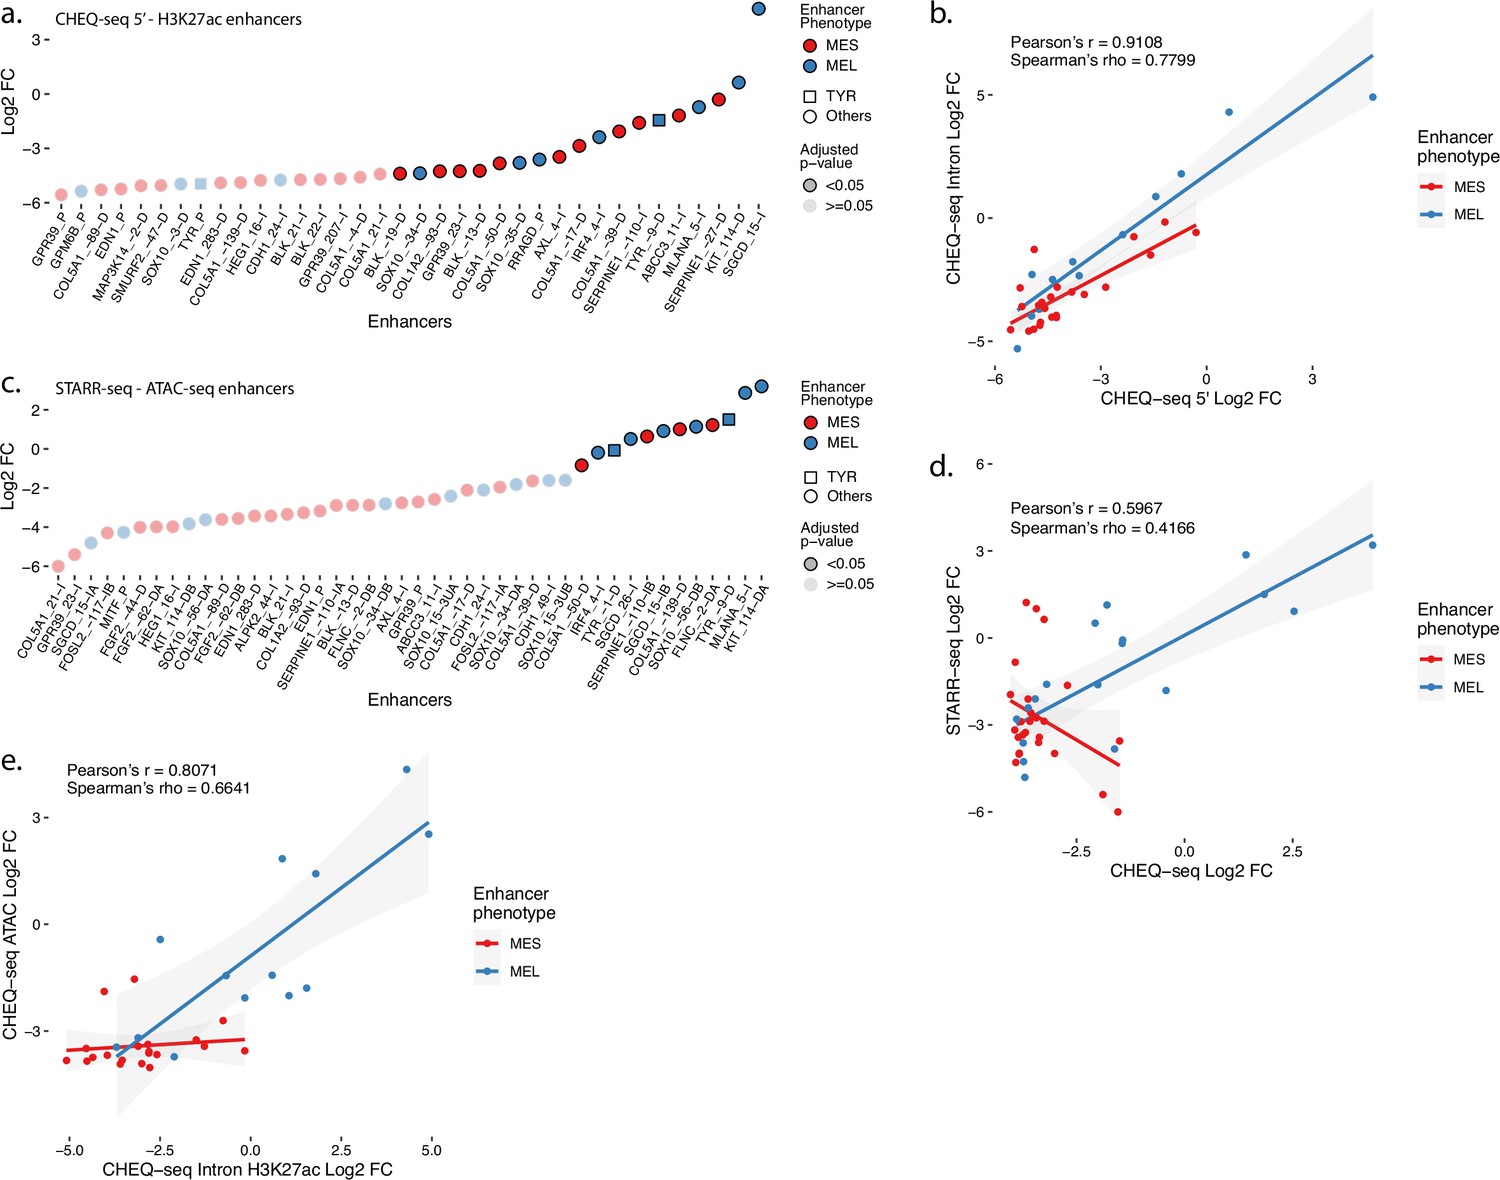
(a) Enhancer activity profile for the CHEQ-seq intron H3K27ac library in MM001. (b) Scatterplot representation of CHEQ-seq intron vs. CHEQ-seq 5′ H3K27ac library in MM001. (c) Enhancer activity profile for the STARR-seq ATAC-seq library in MM001. (d) Scatterplot representation of CHEQ-seq vs. STARR-seq ATAC-seq library in MM001. (e) Scatterplot representation of CHEQ-seq intron H3K27ac library vs. CHEQ-seq ATAC-seq library in MM001. For H3K27ac regions with 2 ATAC-seq peaks, the highest value was assigned to the region.
Figure 2—figure supplement 2
Enhancer activity of H3K27ac regions with two selected ATAC peaks in MM001.
(a, b) Enhancer activity of SGCD_2 (a), KIT_1 (b), and SOX10 (c) regions. SOX10 and MITF ChIP-seq, H3K27ac ChIP-seq and ATAC-seq for MM001 and DeepMEL2 predictions and CHEQ-seq values of the enhancer tiling are displayed. Dark gray areas are regions not covered by the tiling library. CHEQ-seq activity is visible in the H3K27ac enhancers and ATAC-seq enhancers tracks. Benjamini–Hochberg adjusted p-values: *<0.05; **<0.005; ***<0.001.
Figure 3 with 2 supplements
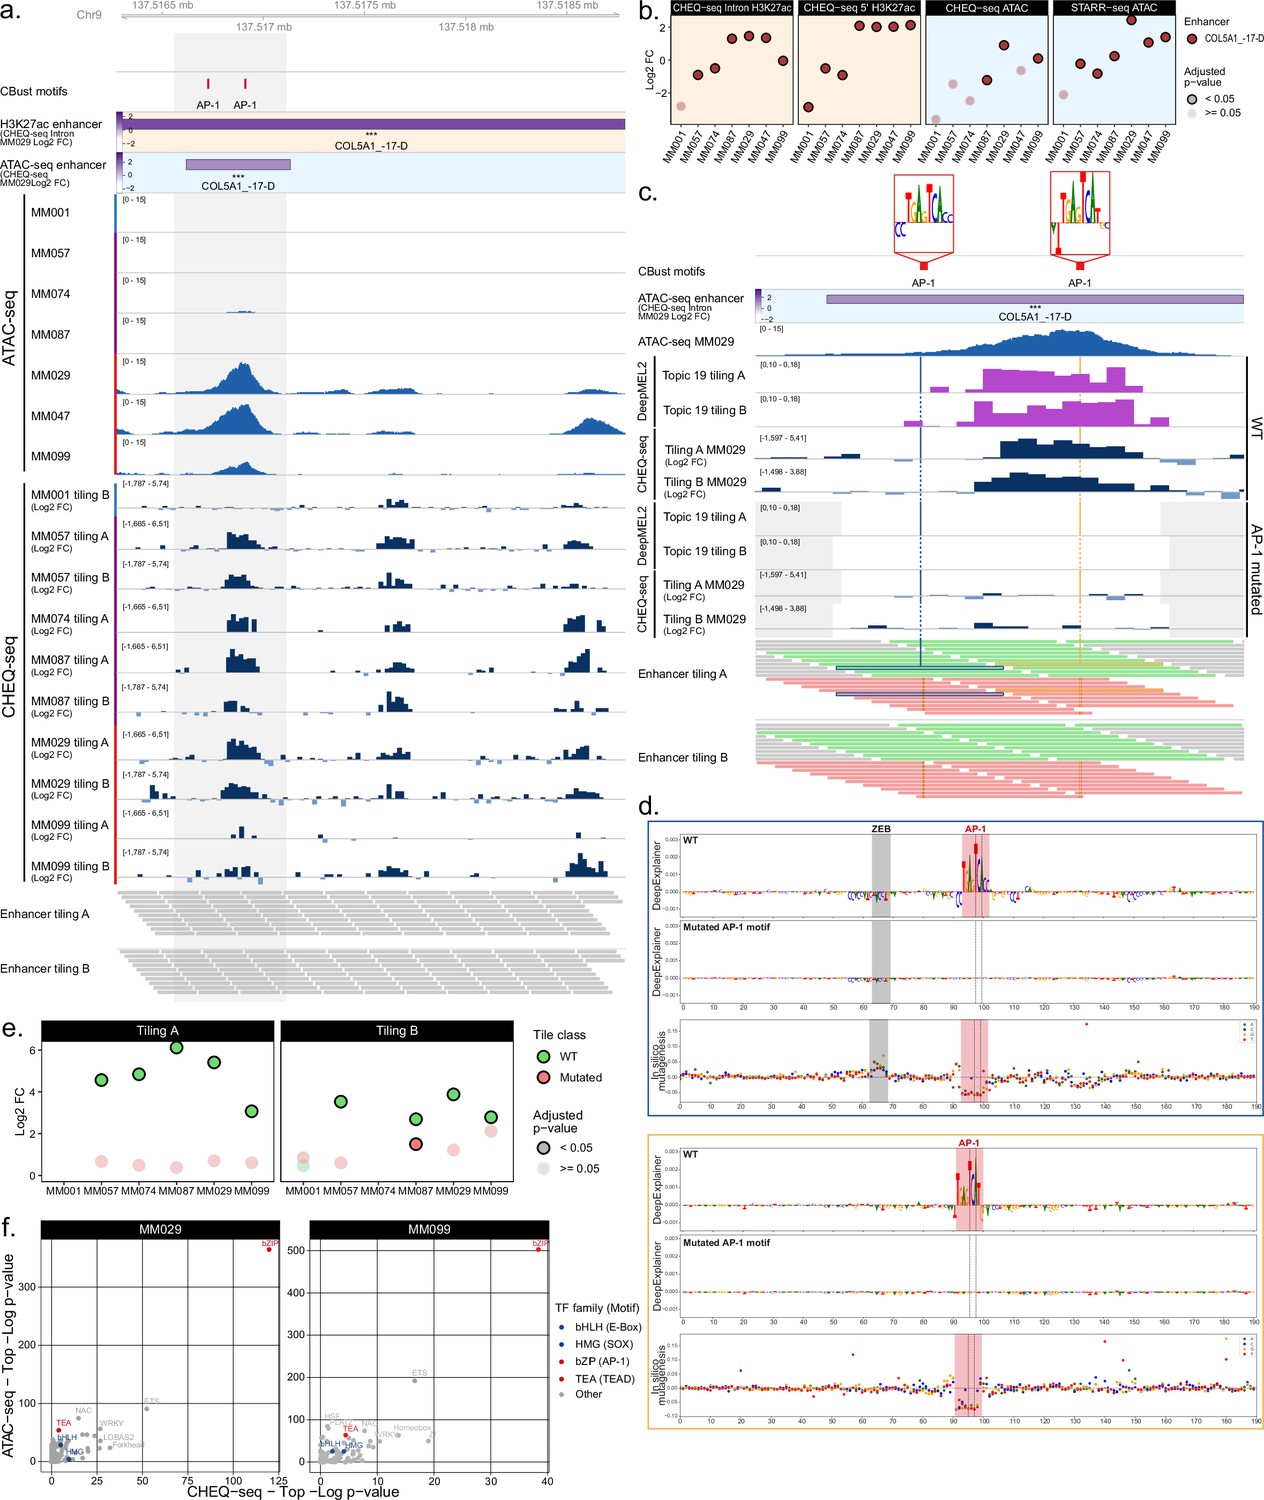
Enhancer activity in MM029.
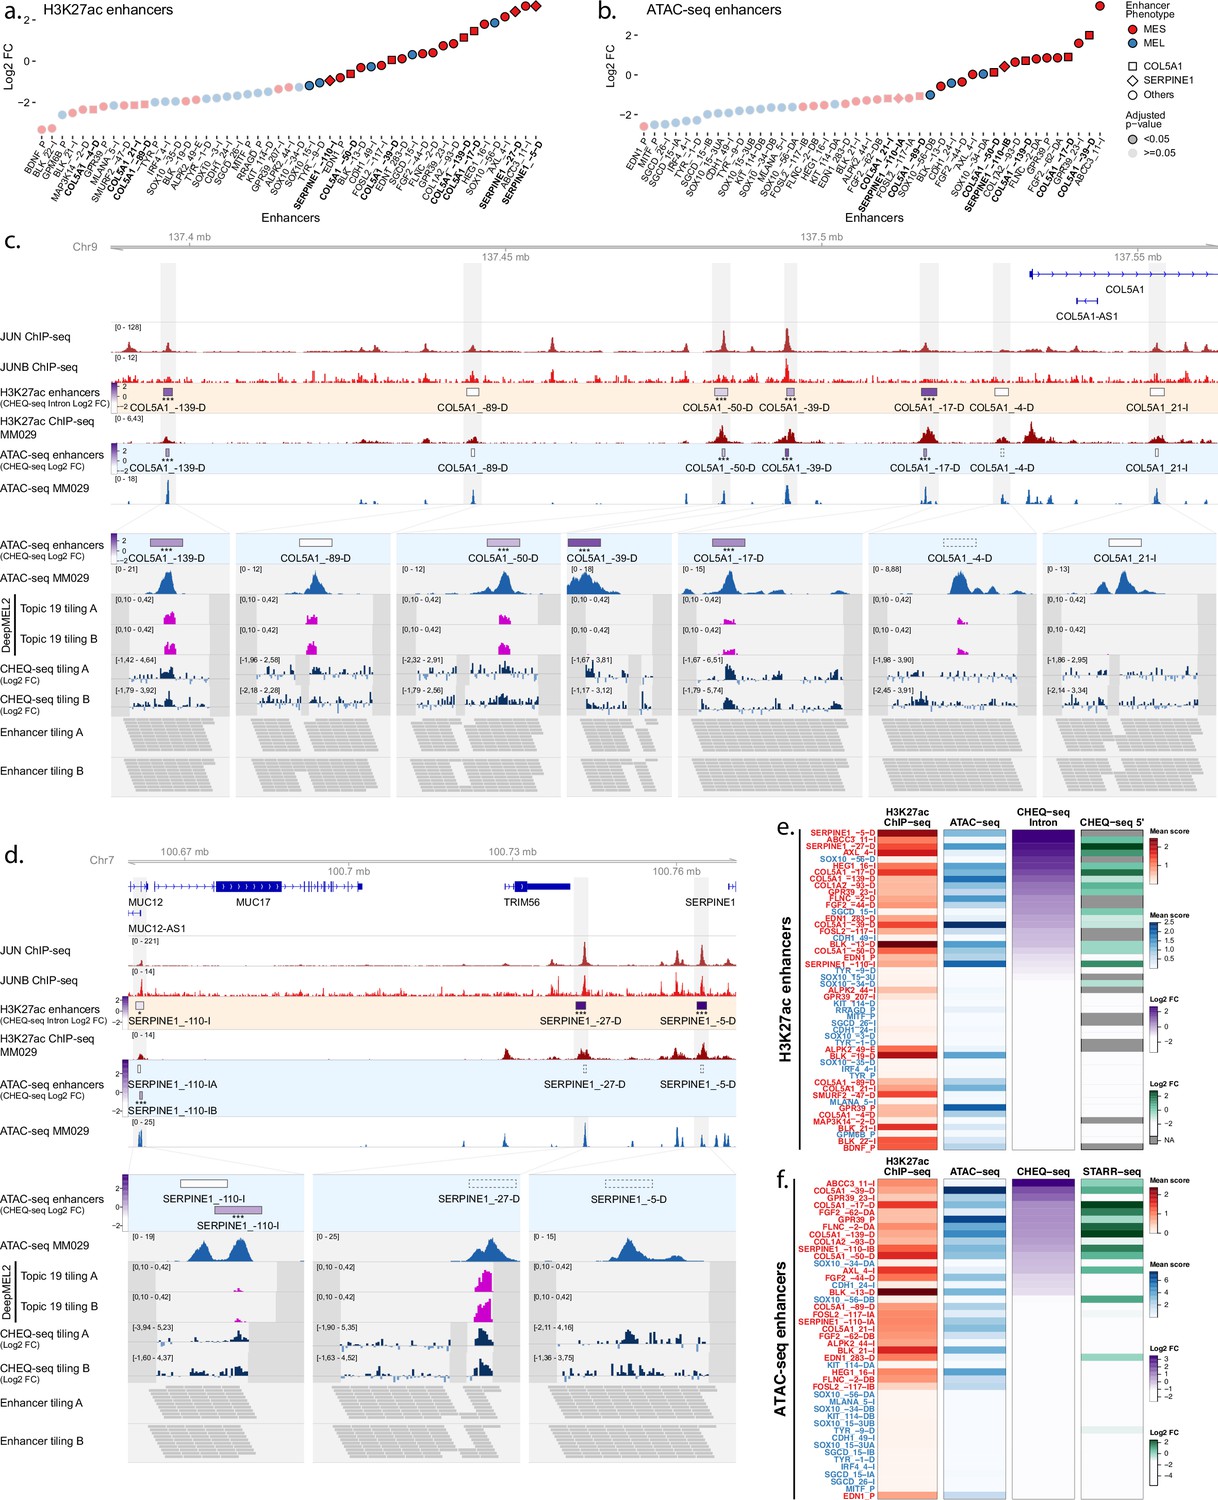
Enhancer activity profile for the CHEQ-seq intron H3K27ac library (a) and CHEQ-seq ATAC-seq library (b). Enhancer regions displayed in panel (c) and (d) have their name indicated in bold, and their value is displayed with a different shape. Enhancer activity of regions selected around the COL5A1 (c) and SERPINE1 (d) genes. JUN and JUNB ChIP-seq and H3K27ac ChIP-seq and ATAC-seq for MM029 are displayed, and, in the zoomed-in regions (light gray areas), DeepMEL2 predictions and CHEQ-seq values of the enhancer tiling are represented. Dark gray areas are regions not covered by the tiling library. CHEQ-seq activity is visible in the ‘H3K27ac enhancers’ and ‘ATAC-seq enhancers’ tracks. Benjamini–Hochberg adjusted p-values: *<0.05; ***<0.001. Dashed boxes: regions not recovered following DNA synthesis, cloning, or massively parallel reporter assay (MPRA). Heatmaps of H3K27ac library (e) and ATAC-seq library (f), displaying H3K27ac ChIP-seq signal, ATAC-seq signal, and enhancer activity in MM001 ordered by MPRA values. Only MPRA values of significantly active enhancers are displayed.
-
Figure 3—source data 1
CHEQ-seq tiling library A activity.
Enhancer activity values for the CHEQ-seq enhancer tiling library A in all cell lines. These data were also used in Figures 4 and 6, Figure 3—figure supplement 2, Figure 4—figure supplement 1, Figure 5—figure supplement 1, and Figure 6—figure supplement 1.
- https://cdn.elifesciences.org/articles/71735/elife-71735-fig3-data1-v2.txt
-
Figure 3—source data 2
DeepMEL2 prediction scores for tiling library A.
DeepMEL2_GABPA prediction scores for the enhancer tiling A library. These data were also used in Figure 6, Figure 3—figure supplement 2, and Figure 4—figure supplement 1.
- https://cdn.elifesciences.org/articles/71735/elife-71735-fig3-data2-v2.txt
Figure 3—figure supplement 1
Additionnal MPRAs on H3K27ac and ATAC regions in MM029.
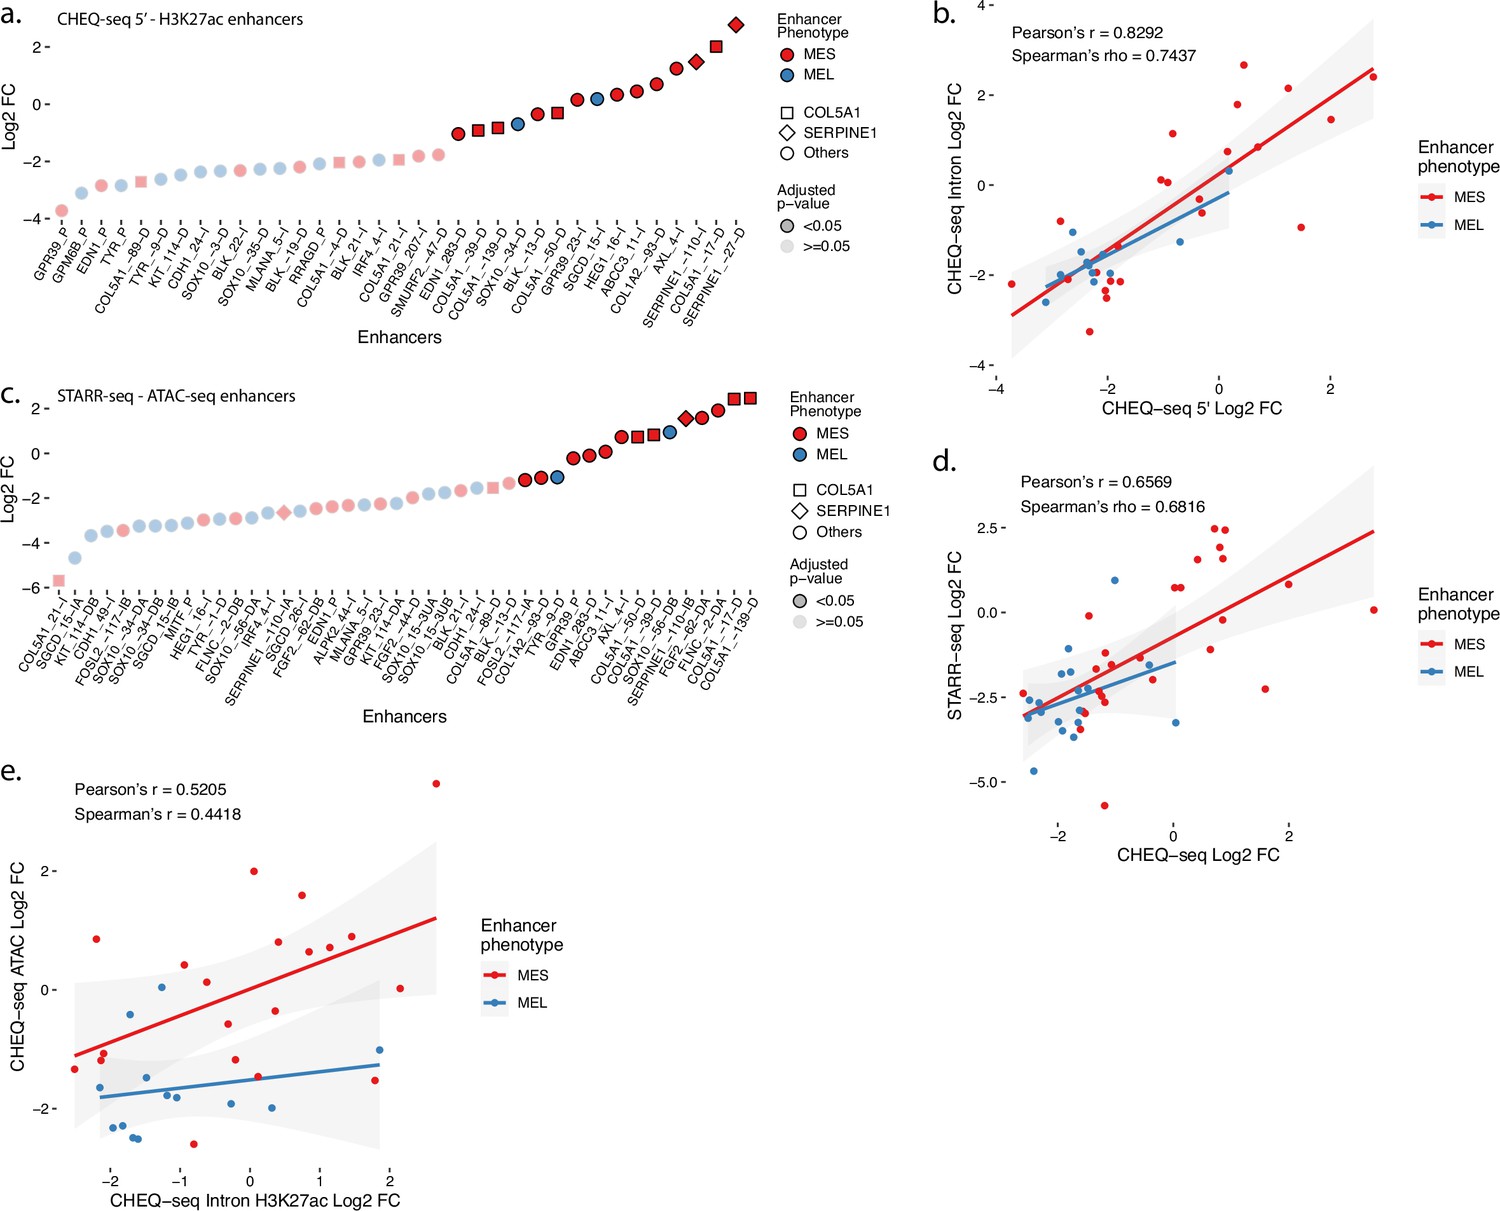
(a) Enhancer activity profile for the CHEQ-seq intron H3K27ac library in MM029. (b) Scatterplot representation of CHEQ-seq intron vs. CHEQ-seq 5′ H3K27ac library in MM029. (c) Enhancer activity profile for the STARR-seq ATAC-seq library in MM029. (d) Scatterplot representation of CHEQ-seq vs. STARR-seq ATAC-seq library in MM029. (e) Scatterplot representation of CHEQ-seq intron H3K27ac library vs. CHEQ-seq ATAC-seq library in MM029. For H3K27ac regions with two ATAC-seq peaks, the highest value was assigned to the region.
Figure 3—figure supplement 2
Enhancer activity of H3K27ac regions with two selected ATAC peaks in MM029.
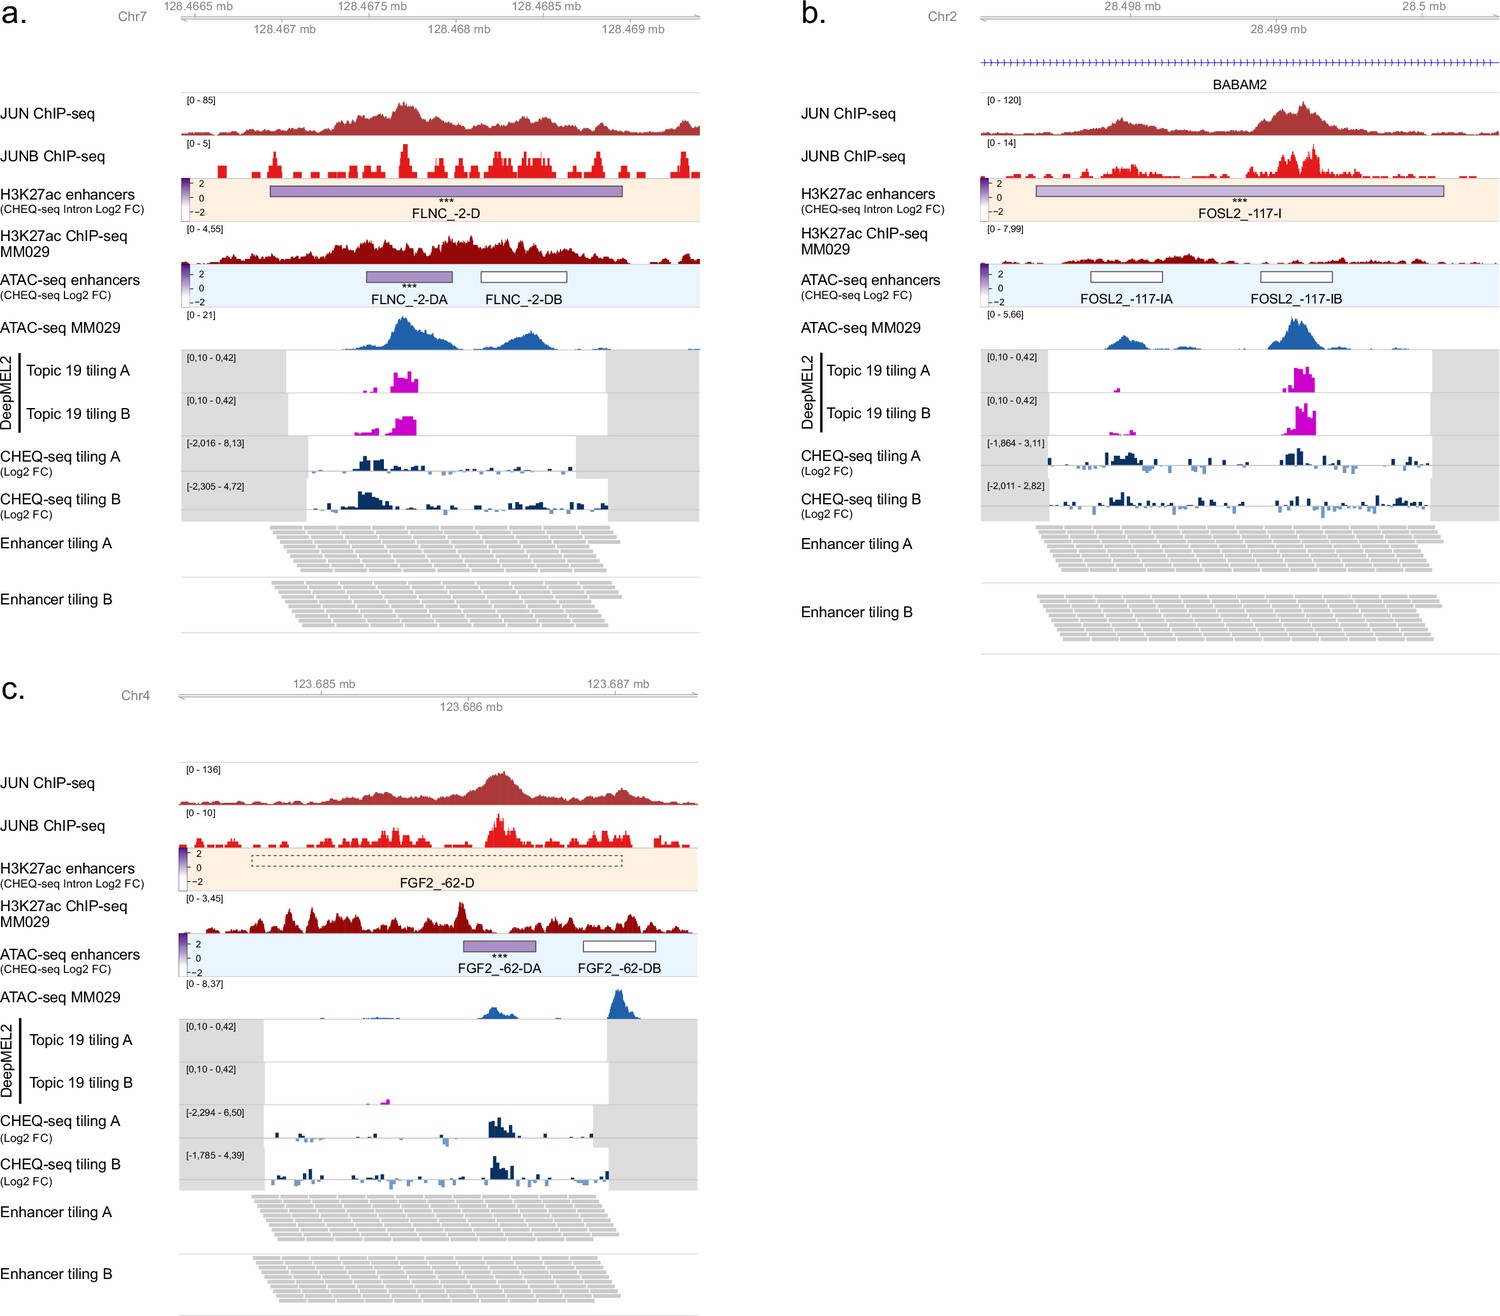
(a) Enhancer activity of FLNC_1 (a), FOSL2_1 (b), and FGF2_1 (c) regions. JUN and JUNB ChIP-seq, H3K27ac ChIP-seq, and ATAC-seq for MM029 and DeepMEL2 predictions and CHEQ-seq values of the enhancer tiling are displayed. Dark gray areas are regions not covered by the tiling library. CHEQ-seq activity is visible in the H3K27ac enhancers and ATAC-seq enhancers tracks. Benjamini–Hochberg adjusted p-values: ***<0.001. Dashed box: regions not recovered following synthesis, cloning, or massively parallel reporter assay (MPRA).
Figure 4 with 1 supplement
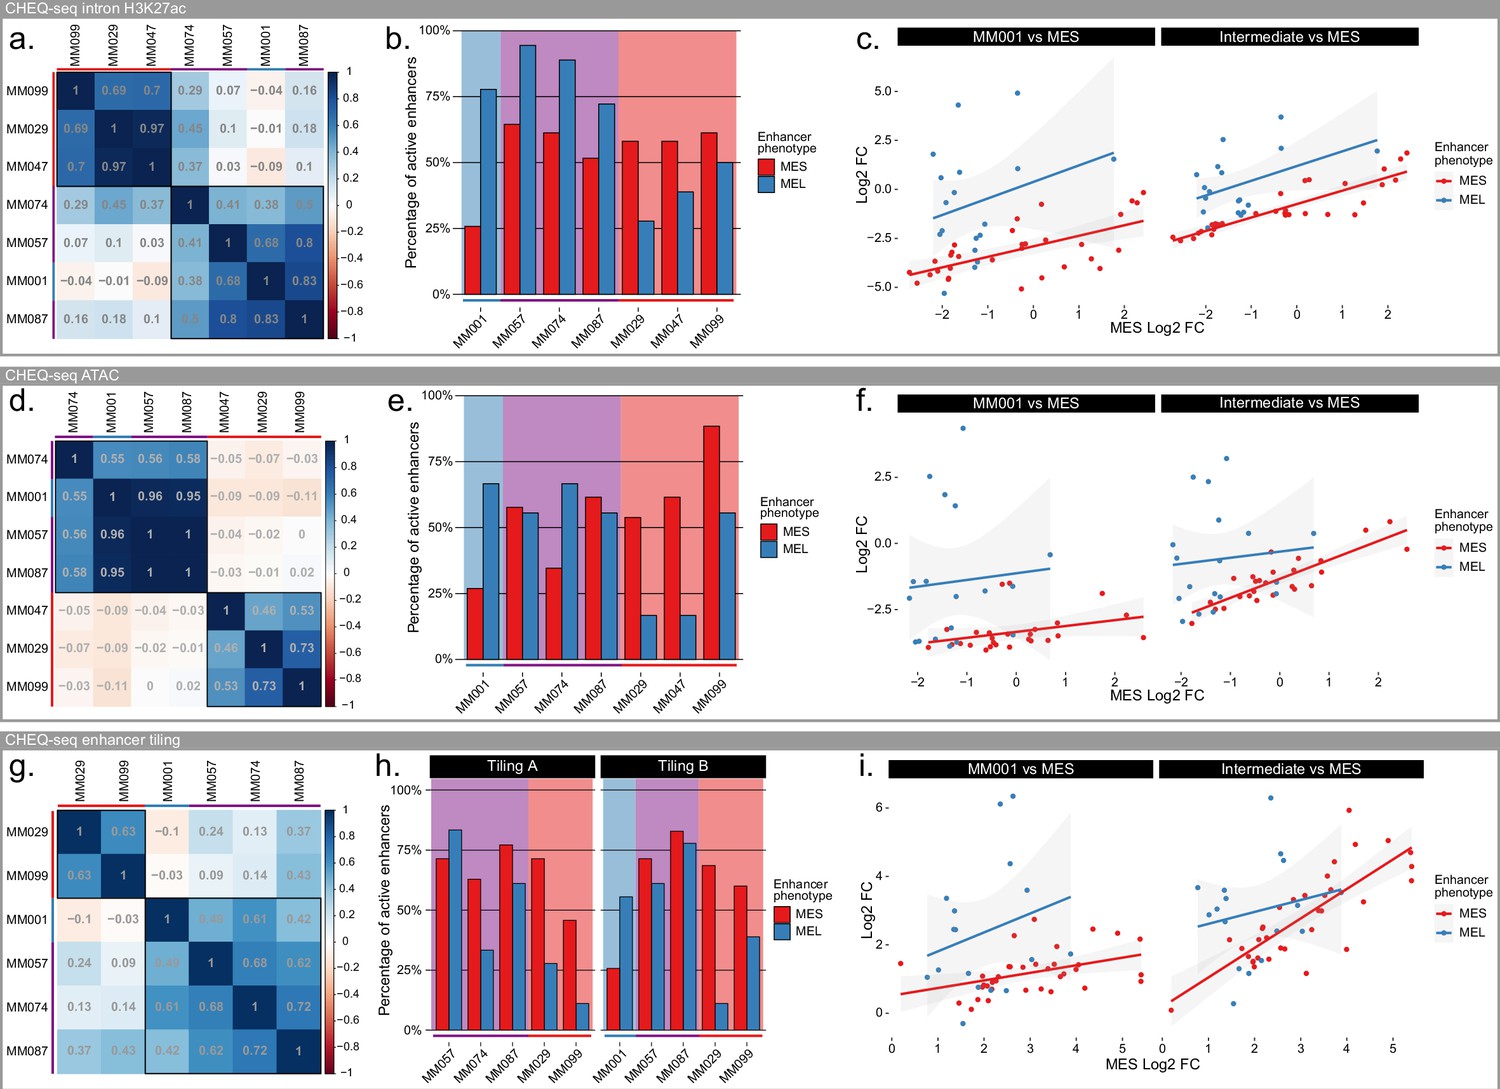
Specificity of melanocytic (MEL) and mesenchymal-like (MES) enhancers in intermediate lines.
(a–c) Pearson’s correlation coefficient table across 7 malignant melanoma (MM) lines (a), percentage of active MEL and MES enhancers for each line (b), and scatterplot of CHEQ-seq results for the CHEQ-seq intron H3K27ac library. (d–f) same as panels (a–c) but for the CHEQ-seq ATAC-seq library. (g–i) same as panels (a–c) but for the combined CHEQ-seq enhancer tiling libraries. Red, purple, and blue bars next to cell line names and background indicate MES, intermediate, and MEL lines respectively.
Figure 4—figure supplement 1
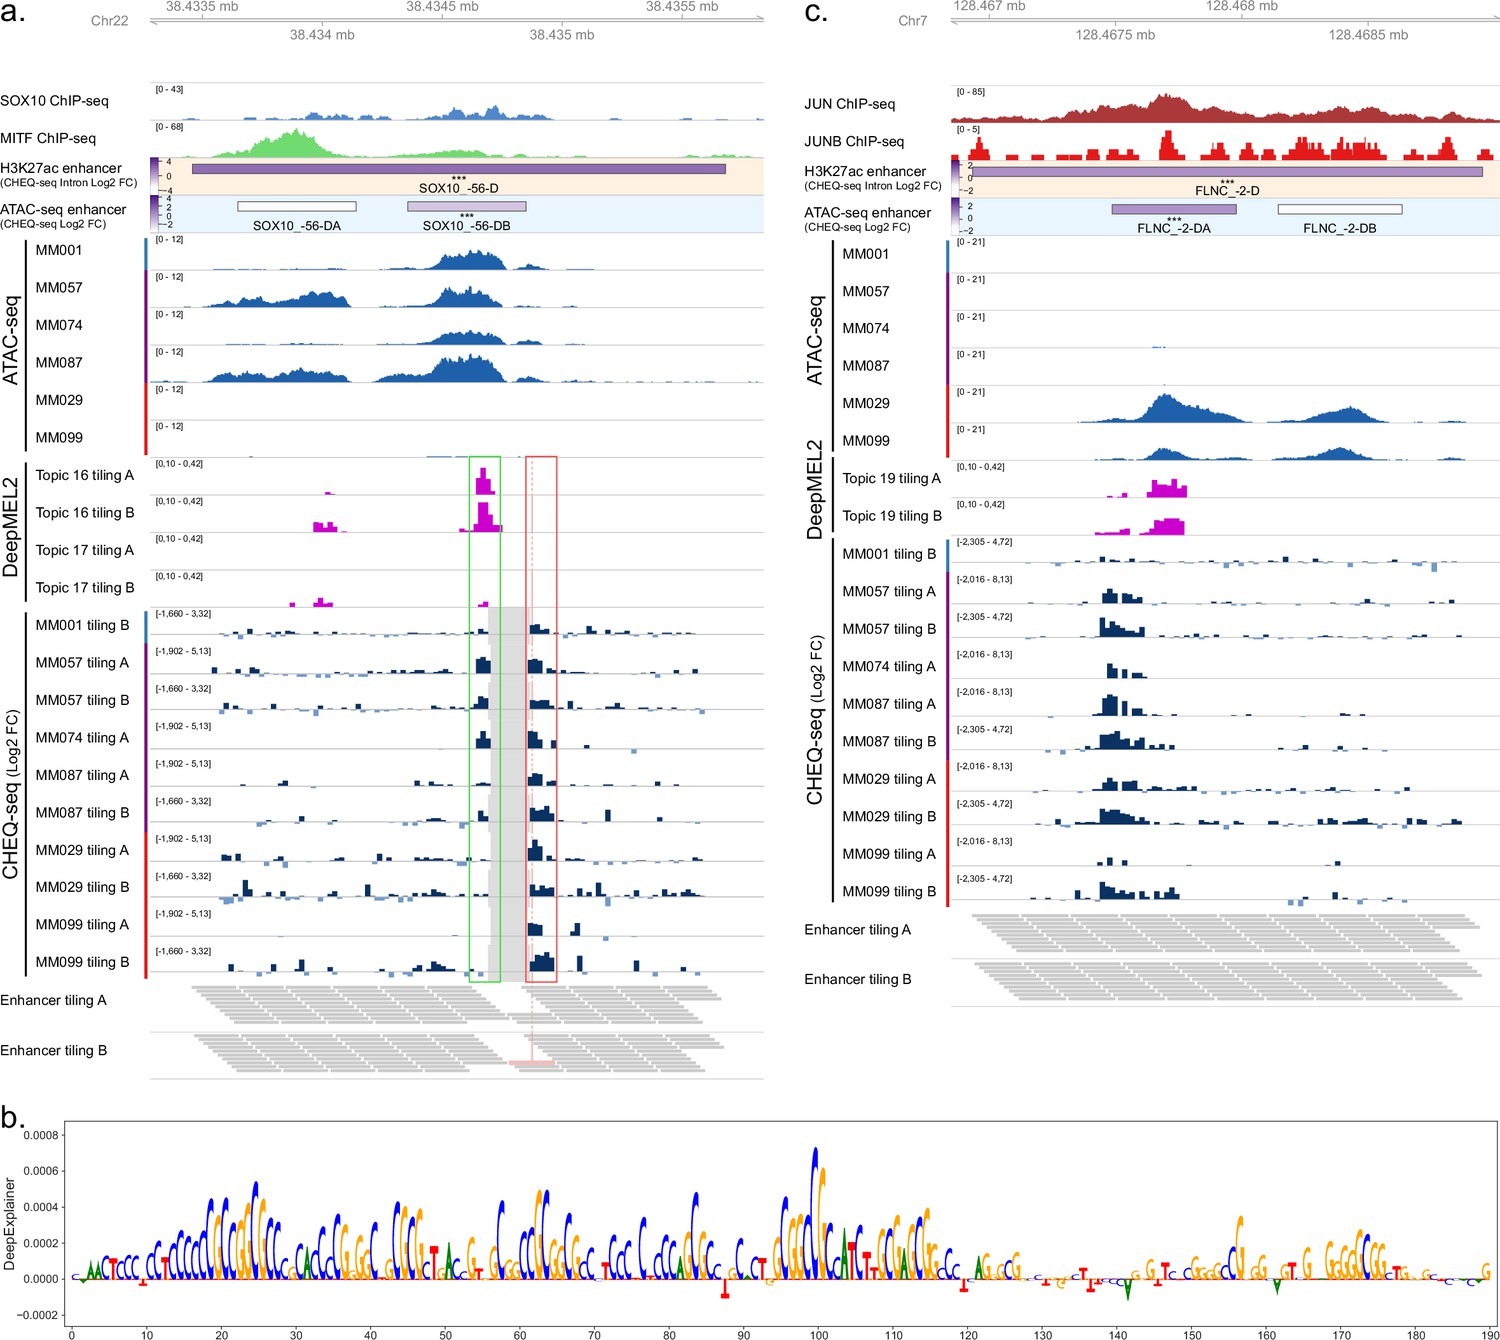
Analysis of SOX10_-56-D and FLNC_-2-D activity in all cell lines.
(a) Enhancer tiling profile of the SOX10_5 region across all tested malignant melanoma (MM) lines. MM001 activity is shown for the H3K27ac and ATAC-seq regions. The gray area in the CHEQ-seq tiling tracks corresponds to tiles that were not found in the libraries after cloning. The perfect overlap of those missing tiles in libraries A and B suggests that their high GC content caused the synthesis to fail. Bars on the side of the ATAC-seq and CHEQ-seq tracks indicate the phenotype of the cell lines (blue: melanocytic [MEL]; purple: MEL-intermediate; red: mesenchymal-like [MES]). MEL-specific and ubiquitous enhancers are highlighted in green and red, respectively. (b) DeepExplainer profile of the tile highlighted in pink in (a) for topic 31 (promoter). (c) Enhancer tiling profile of the FLNC_1 region across all tested MM lines. MM029 activity is shown for the H3K27ac and ATAC-seq regions. Benjamini–Hochberg adjusted p-values: ***<0.001.
Figure 5 with 5 supplements
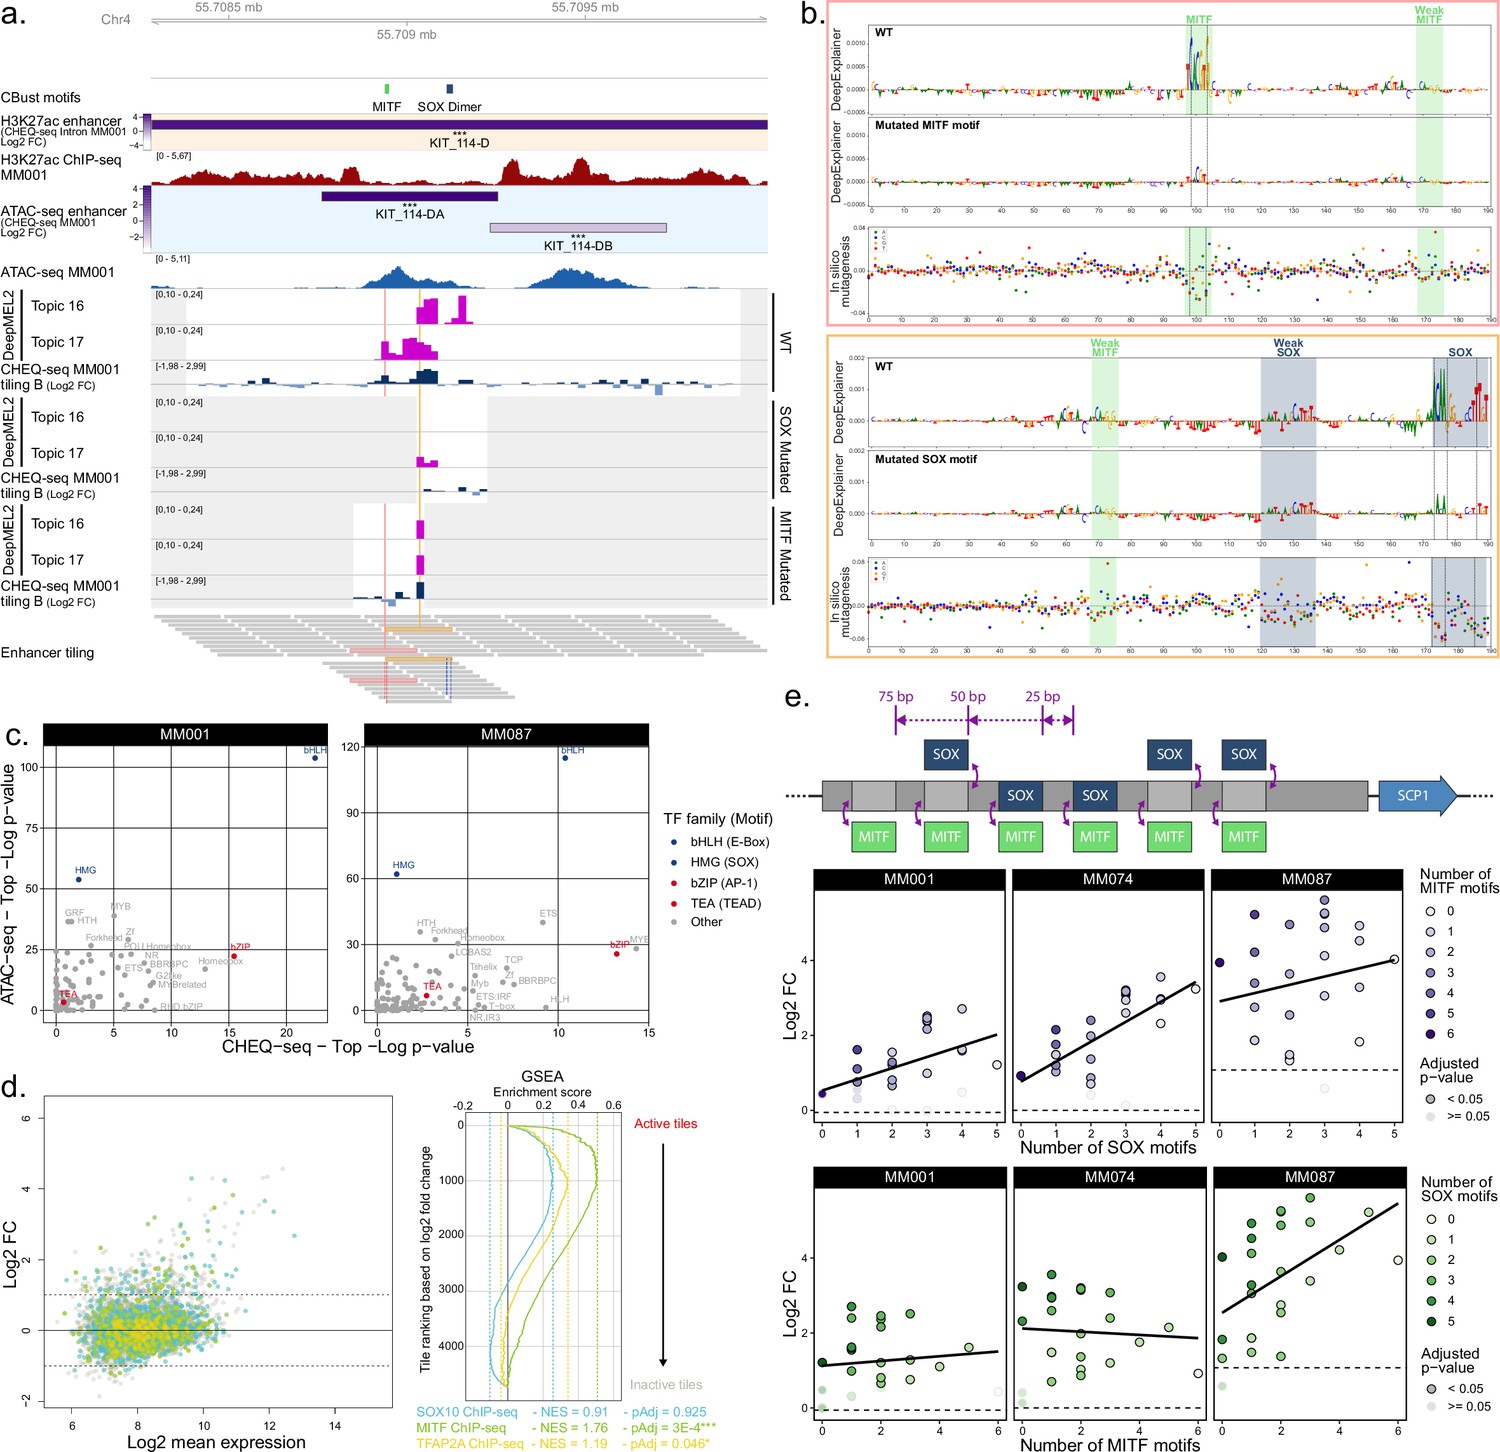
Analysis of transcription factors driving MEL specific enhancer activity.
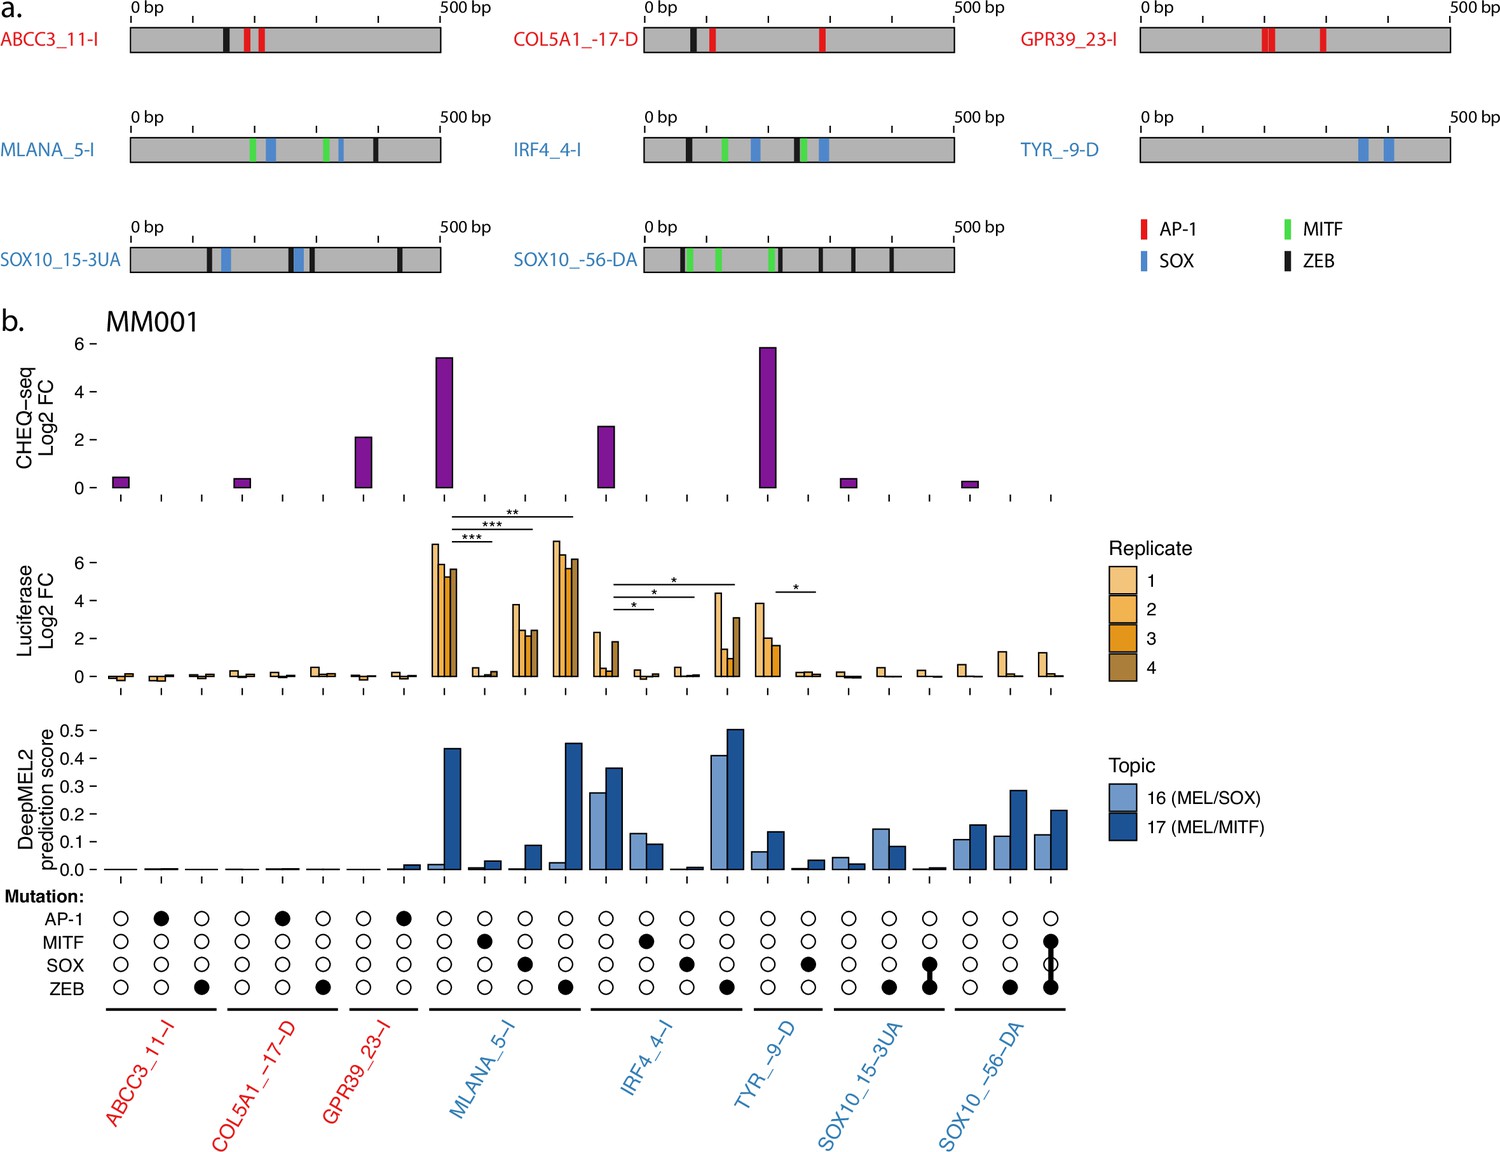
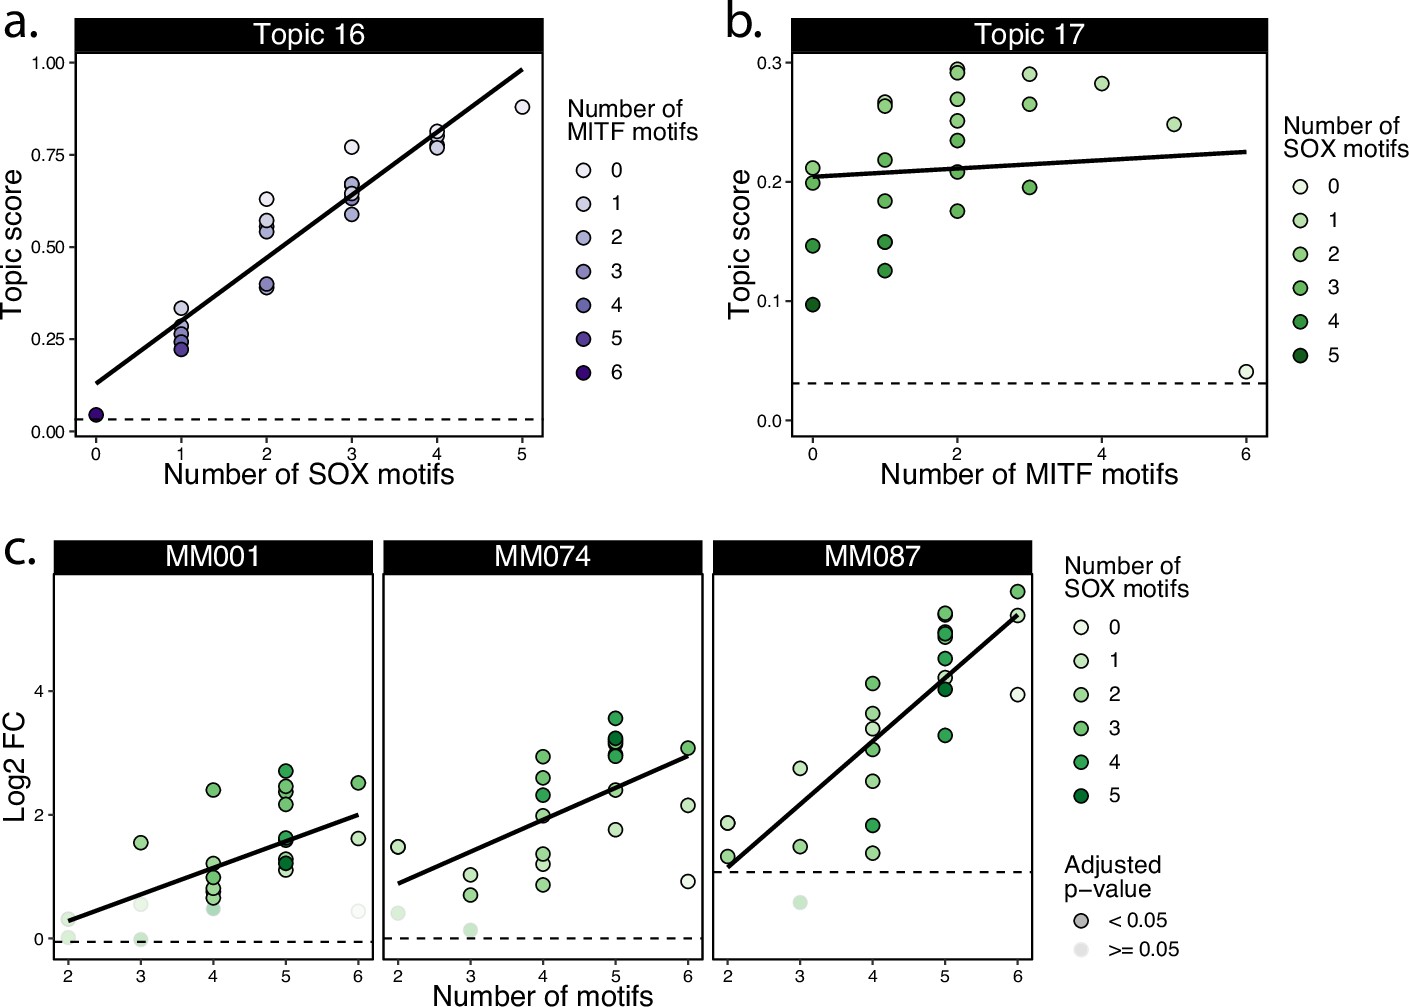
(a) KIT_114-D region activity summary in MM001. The ‘CBust motifs’ track shows identified transcription factor binding sites (TFBSs) for MITF and SOX. DeepMEL2 prediction scores for topics 16 (SOX) and 17 (MITF) and CHEQ-seq activity values are shown for the wild-type (WT), SOX mutated, and MITF mutated tiles. Gray areas are regions not covered by the tiling library. The ‘Enhancer tiling’ track represents the actual location of the tiles. (b) DeepExplainer profiles for the tiles highlighted in pink and yellow in the ‘Enhancer tiling’ track of panel (a). Each profile consists of the WT (top panel) and mutated (middle panel) tile nucleotide score and in silico mutagenesis score for the WT tile (bottom panel). Dashed lines indicate the location of mutated nucleotides. (c) Comparison of the most enriched motif families as identified by HOMER between ATAC-seq (top ¼ most accessible tiles vs. rest) and CHEQ-seq tiling libraries (all active tiles vs. all inactive tiles) for MM001 and MM087. (d) Tiles in the MA plot are colored based on whether or not they overlap with SOX10 (blue), MITF (green), or TFAP2A (yellow) ChIP-seq peaks. Gene Set Enrichment Analysis (GSEA) of the enrichment of SOX10, MITF, and TFAP2A ChIP-seq on the tiles ranked according to their activity (log2 fold change [FC]). For each of the ChIP-seq peak sets, the negative enrichment score (NES) and Benjamini–Hochberg adjusted p-value (pAdj) are shown. (e) Top panel: cartoon of SOX and MITF motif combinations in a background sequence. Middle and bottom panels: CHEQ-seq activity of synthetic enhancers with background sequence 2 in MM001, MM074, and MM087 sorted by the number of SOX (middle panel) or MITF (bottom panel) motifs present in the sequence. Dashed line indicates the log2 FC value of the background sequence without any motif.
-
Figure 5—source data 1
CHEQ-seq SOX-MITF combinations activity.
Enhancer activity values for the CHEQ-seq SOX-MITF combinations library in MM001, MM074, and MM087.
- https://cdn.elifesciences.org/articles/71735/elife-71735-fig5-data1-v2.txt
Figure 5—figure supplement 1
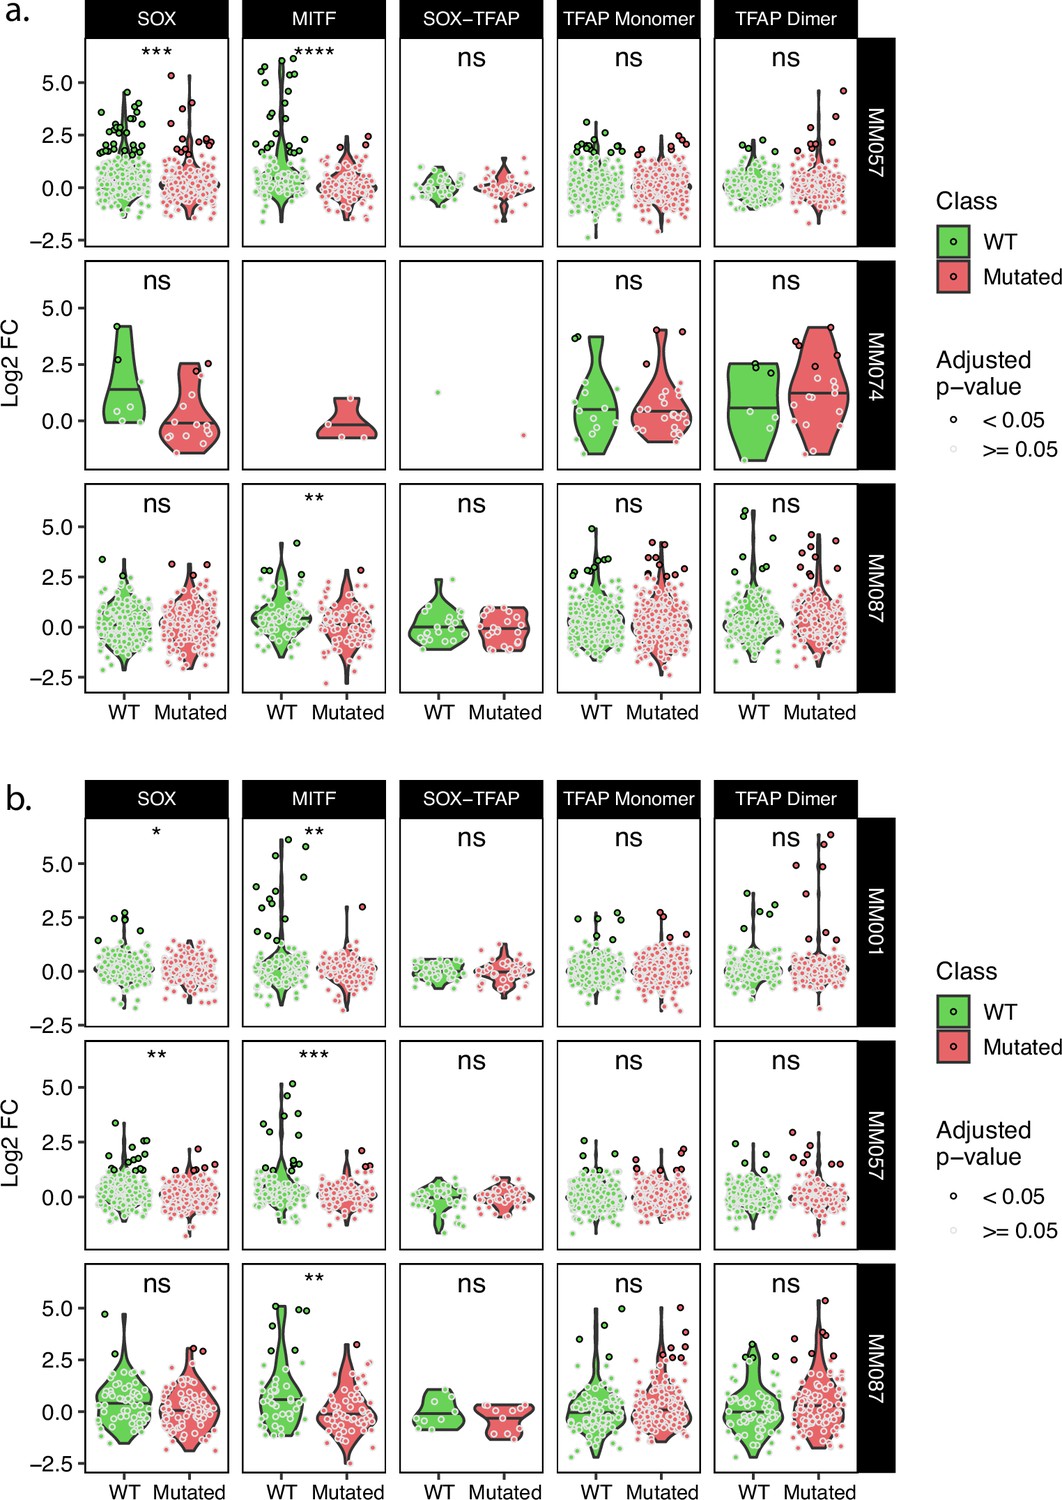
Comparison of wild-type and TFBSs mutant tile activity for key MEL TFs.
(a, b) Expression of wild-type and corresponding mutated tiles for the tiling A (a) and B (b) libraries. t-test p-values: ns ≥ 0.05; *<0.05; **<0.01; ***<0.001; ****<0.0001.
Figure 5—figure supplement 2
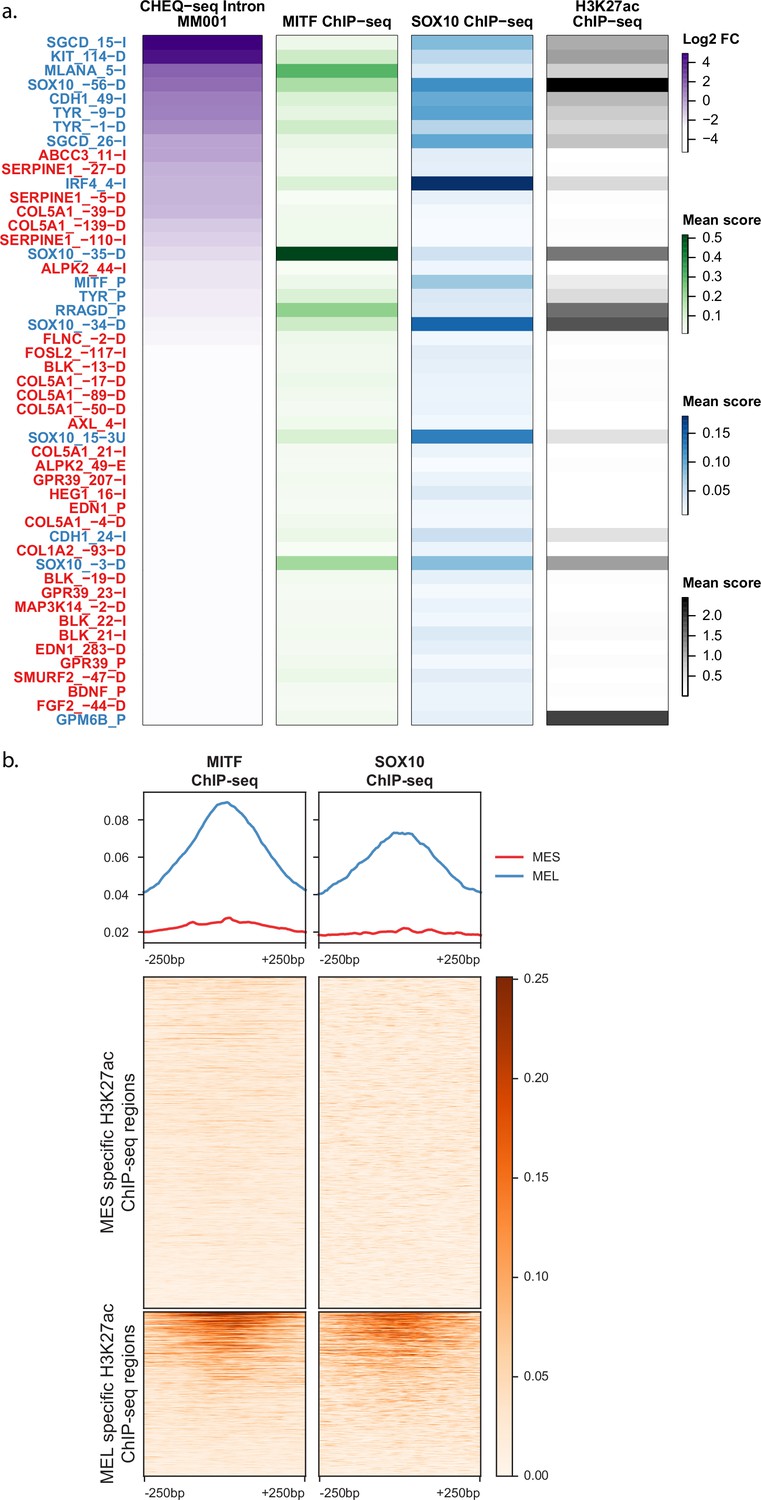
MITF and SOX10 ChIP-seq signal in differentially acetylated regions.
(a) Heatmaps of H3K27ac library regions displaying CHEQ-seq intron signal for MM001 together with the ChIP-seq signal for MITF, SOX10, and H3K27ac. (b) Heatmaps of normalized ChIP-seq signal over the mesenchymal-like (MES) (13,453) and melanocytic (MEL) (6669) differentially acetylated regions from Verfaillie et al., 2015.
Figure 5—figure supplement 3
Luciferase assay validation of TF functionality in MM001.
(a) Location of transcription factor binding sites (TFBSs) for each tested region. (b) Measuring the effect of TFBS mutations in melanocytic (MEL) and mesenchymal-like (MES) ATAC regions via luciferase assay in MM001. CHEQ-seq signal of wild-type regions is displayed as reference (top panel). CHEQ-seq fold change is input normalized. Luciferase fold change is blank normalized. Region names in red and blue are MES- and MEL-specific ATAC regions, respectively. t-test p-values: *<0.05; **<0.01; ***<0.001.
-
Figure 5—figure supplement 3—source data 1
Luciferase assay values.
Luciferase assay values performed in MM001 and MM099. These data were also used in Figure 5—figure supplement 3.
- https://cdn.elifesciences.org/articles/71735/elife-71735-fig5-figsupp3-data1-v2.csv
Figure 5—figure supplement 4
Investigation of SOX10-dependent ATAC-seq regions in MM087.
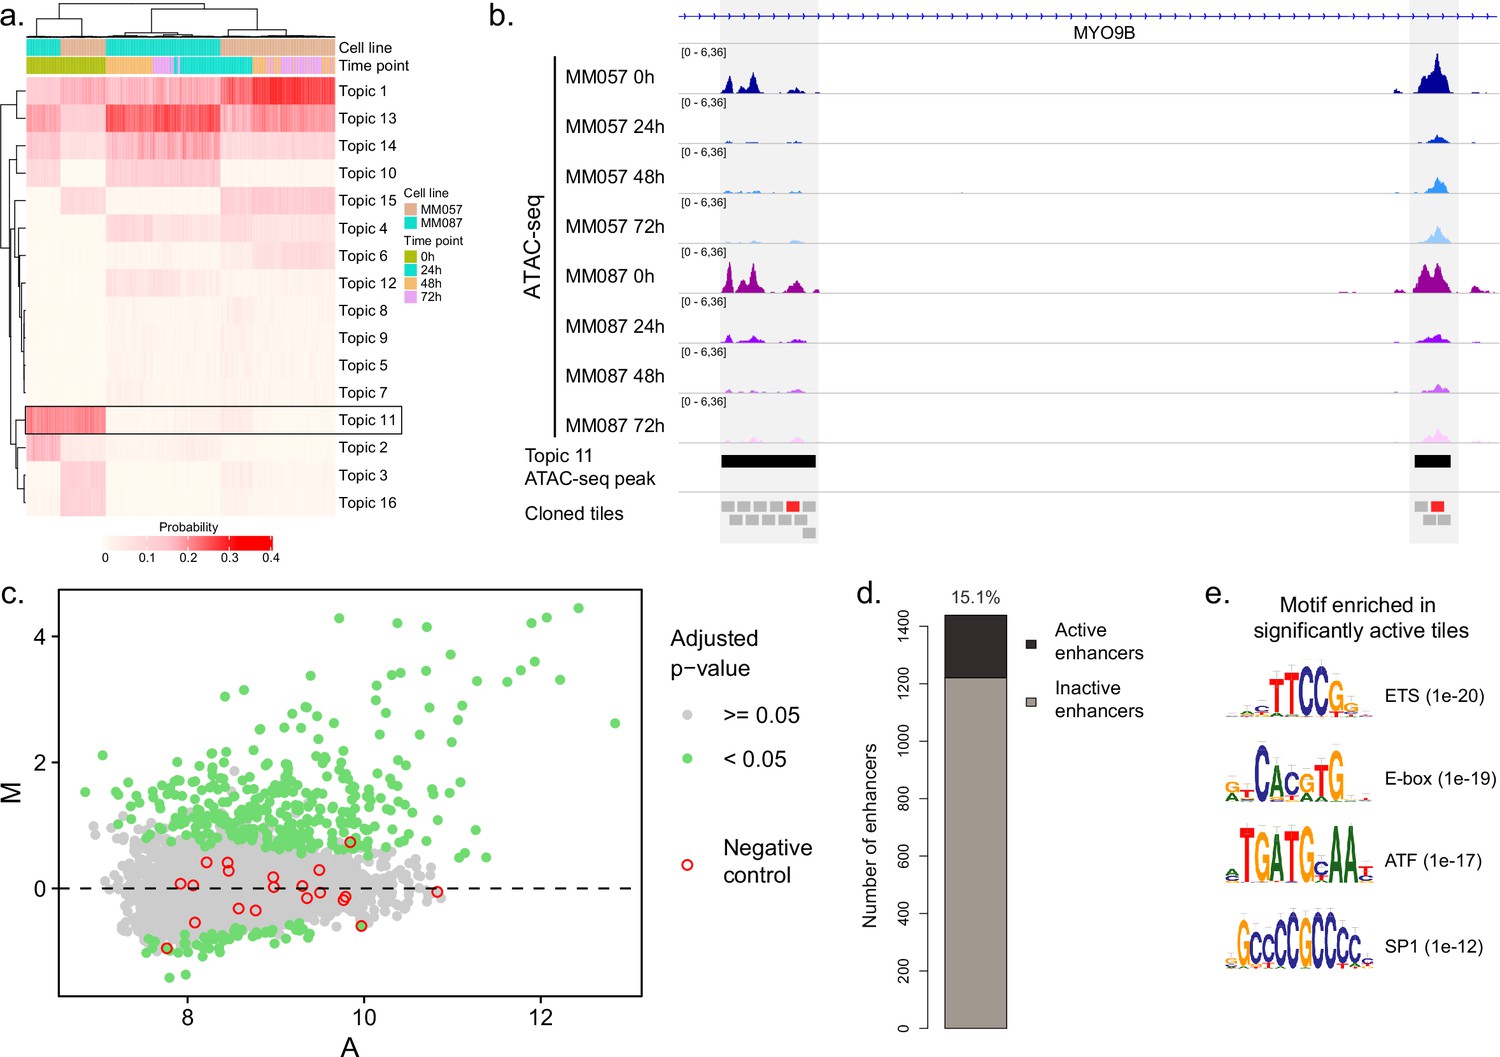
(a) Heatmap of topic contribution for each ATAC-seq region over the different cell lines and time points. The highlighted topic 11 contains regions that have reduced predictions following knockdown (KD). (b) ATAC-seq profiles of MM057 and MM087 at 0, 24, 48, and 72 hr post SOX10-KD. Two topic 11 peaks and 190 bp tiles spanning the enhancers are highlighted by black and gray boxes, respectively. Active tiles are highlighted in red. (c) MA plot of all tested tiles in MM087. (d) Number of active enhancers. An enhancer is defined as active if at least one of its tiles is active. (e) List of the most enriched motifs from the HOMER analysis of active vs. inactive enhancers.
-
Figure 5—figure supplement 4—source data 1
CHEQ-seq SOX10-KD activity.
Enhancer activity values for the CHEQ-seq SOX10-KD library in MM087. These data were also used in Figure 5—figure supplement 4.
- https://cdn.elifesciences.org/articles/71735/elife-71735-fig5-figsupp4-data1-v2.txt
Figure 5—figure supplement 5
DeepMEL2 prediction scores for SOX-MITF motif combinations.
(a) Synthetic combinations of SOX and MITF motifs DeepMEL2 prediction scores for topic 16 with scores ordered by the number of SOX motifs in the sequence. (b) Synthetic combinations of SOX and MITF motifs DeepMEL2 prediction scores for topic 17 with scores ordered by the number of MITF motifs in the sequence. (c) CHEQ-seq activity of synthetic enhancers in MM001, MM074, and MM087 sorted by the number of motifs (SOX + MITF) present in the sequence. Dashed line indicates the topic score/log2 fold change (FC) value of the background sequence without any motif.
-
Figure 5—figure supplement 5—source data 1
DeepMEL2 SOX-MITF combinations prediction scores.
DeepMEL2_GABPA predictions scores for the SOX-MITF combinations sequences.
- https://cdn.elifesciences.org/articles/71735/elife-71735-fig5-figsupp5-data1-v2.txt
Figure 6 with 3 supplements
Analysis of transcription factors driving MES specific enhancer activity.
(a) ATAC-seq signal and CHEQ-seq wild-type (WT) tiles activity in the COL5A1_–17-D H3K27ac library region. ‘CBust motifs’ track shows AP-1 TFBSs. Activity of H3K27ac and ATAC-seq regions is from MM029. (b) Enhancer activity for the H3K27ac ChIP-seq and ATAC-based COL5A1_–17-D region. (c), CHEQ-seq activity of WT tiles and AP-1 binding site mutant tiles in MM029. ‘DeepMEL2’ tracks correspond to the accessibility prediction score for each tile. The displayed region corresponds to the highlighted area in panel (a). Gray areas in ‘DeepMEL2’ and ‘CHEQ-seq tiling’ tracks correspond to regions not covered by the tiling library. In the ‘Enhancer tiling’ tracks, red and green tiles are the mutated and WT tiles, respectively. (d), DeepExplainer profiles for the tiles highlighted in blue and yellow in the ‘Enhancer tiling A’ track of panel (c). Each profile consists of the WT (top panel) and mutated (middle panel) tile nucleotide score and in silico mutagenesis score (bottom panel). Dashed lines indicate the location of mutated bases. (e), CHEQ-seq signal of the most active tile among the mutated and corresponding WT tiles for the COL5A1_–17-D region. (f), Comparison of the most enriched motif families as identified by HOMER between ATAC-seq (top ¼ most accessible tiles vs. rest) and CHEQ-seq tiling libraries (all active tiles vs. all inactive tiles) for MM029 and MM099.
Figure 6—figure supplement 1
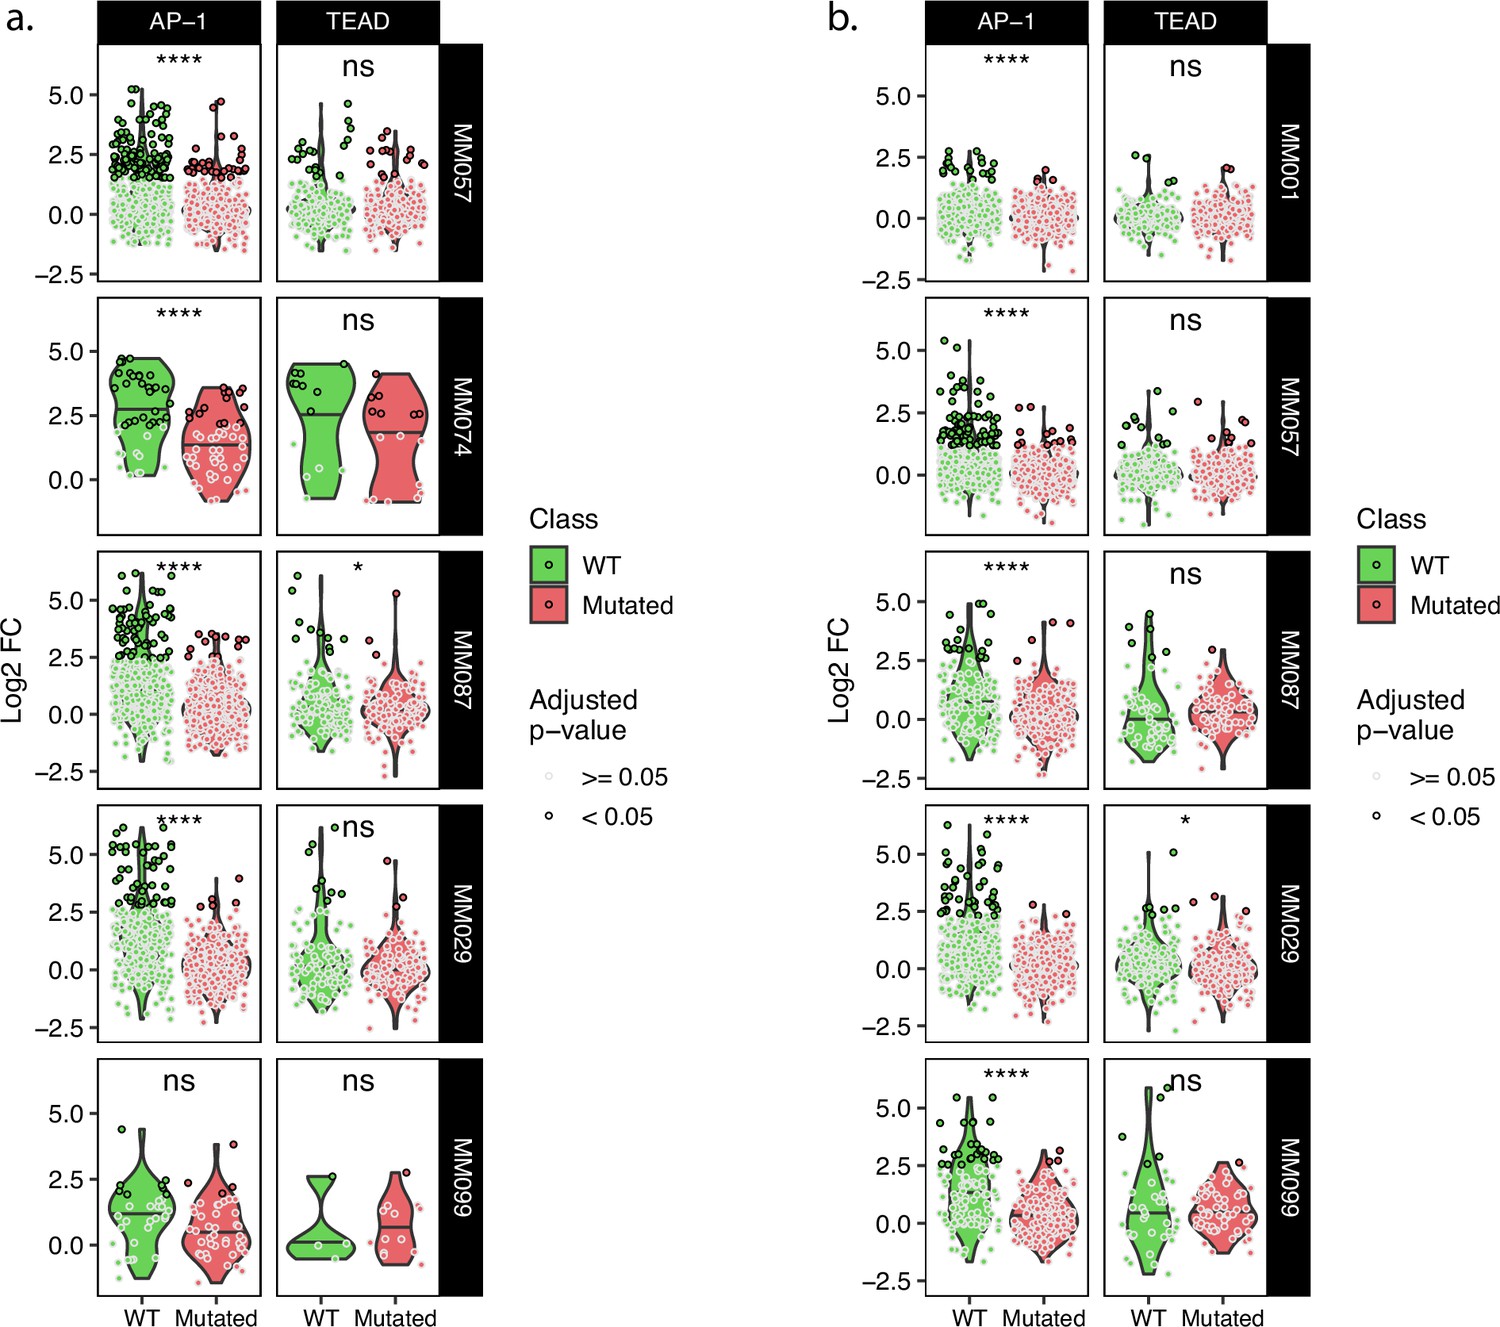
Comparison of wild-type and TFBSs mutant tile activity for key MES TFs.
(a, b) Expression of wild-type and corresponding mutated tiles for the tiling A (a) and B (b) libraries. t-test p-values: ns ≥ 0.05; *<0.05; ****<0.0001.
Figure 6—figure supplement 2
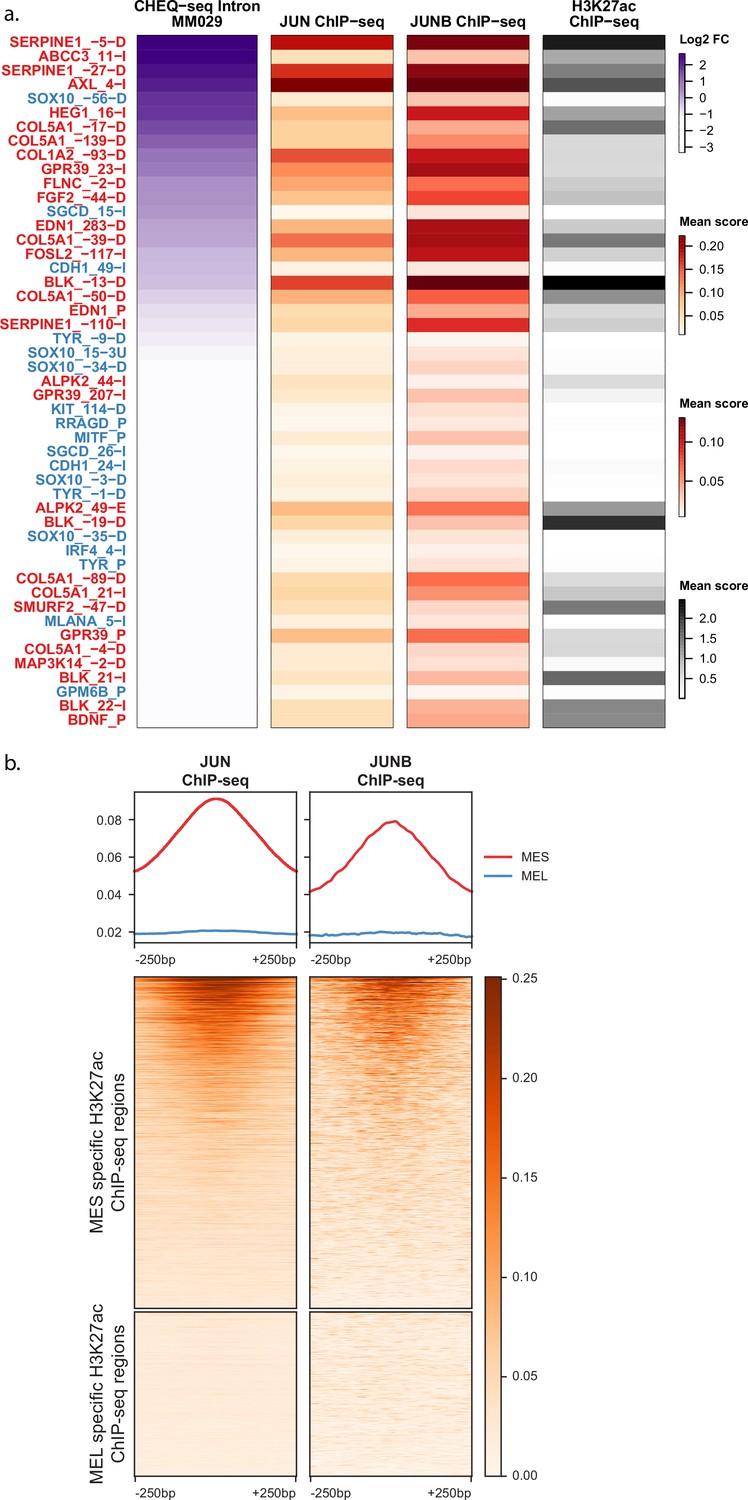
AP-1 ChIP-seq signal in differentially acetylated regions.
(a) Heatmaps of H3K27ac library regions displaying CHEQ-seq intron signal for MM029 together with the ChIP-seq signal for JUN, JUNB, and H3K27ac. (b) Heatmaps of normalized ChIP-seq signal over the mesenchymal-like (MES) (13,453) and melanocytic (MEL) (6669) differentially acetylated regions from Verfaillie et al., 2015.
Figure 6—figure supplement 3
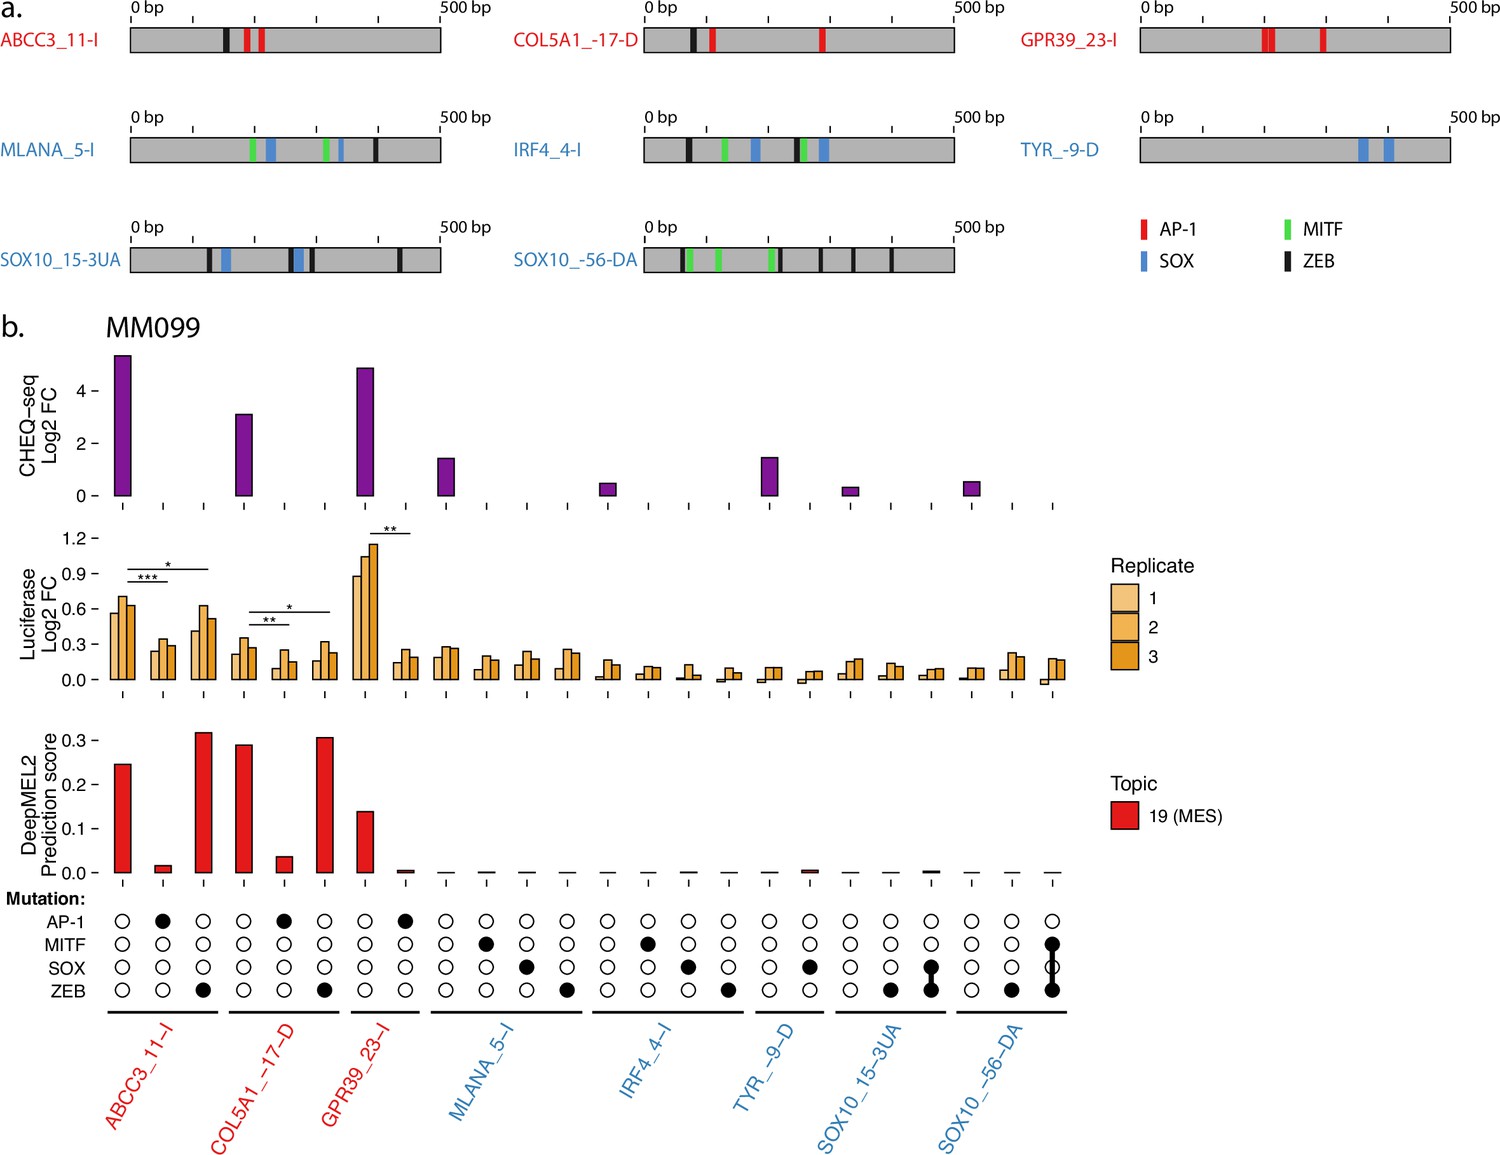
Luciferase assay validation of TF functionality in MM099.
(a) Location of transcription factor binding sites (TFBSs) for each tested region. (b), Measuring the effect of TFBS mutations in melanocytic (MEL) and mesenchymal-like (MES) ATAC regions via luciferase assay in MM099. CHEQ-seq signal of wild-type regions is displayed as reference (top panel). CHEQ-seq fold change is input normalized. Luciferase fold change is blank normalized. Region names in red and blue are MES- and MEL-specific ATAC regions, respectively. t-test p-values: *<0.05; **<0.01; ***<0.001.
Author response image 1
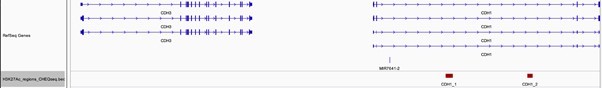
Location of CDH1_1 and CDH1_2 regions in regard to CDH1 and CDH3 genes.
Author response image 2

(a) Sequence logo visualisation of the MITF motif position weight matrix. (b) DeepExplainer profile of the tile “chr6:395485-395675@@IRF4_4-I==wt” containing the MITF motif identified by ClusterBuster using the MITF PWM (green highlight) and flanking ZEB motifs (grey highlights). (c) DeepExplainer profile of the IRF4_4-I ATAC-seq region. The MITF motif (not identified by ClusterBuster) is highlighted in green. (d) Tracks showing ChIP-seq signal, location of selected motifs and tiles. Grey vertical lines highlight the overlap of the selected motif with ChIP-seq peak summit for SOX10 and AP-1.
Author response image 3
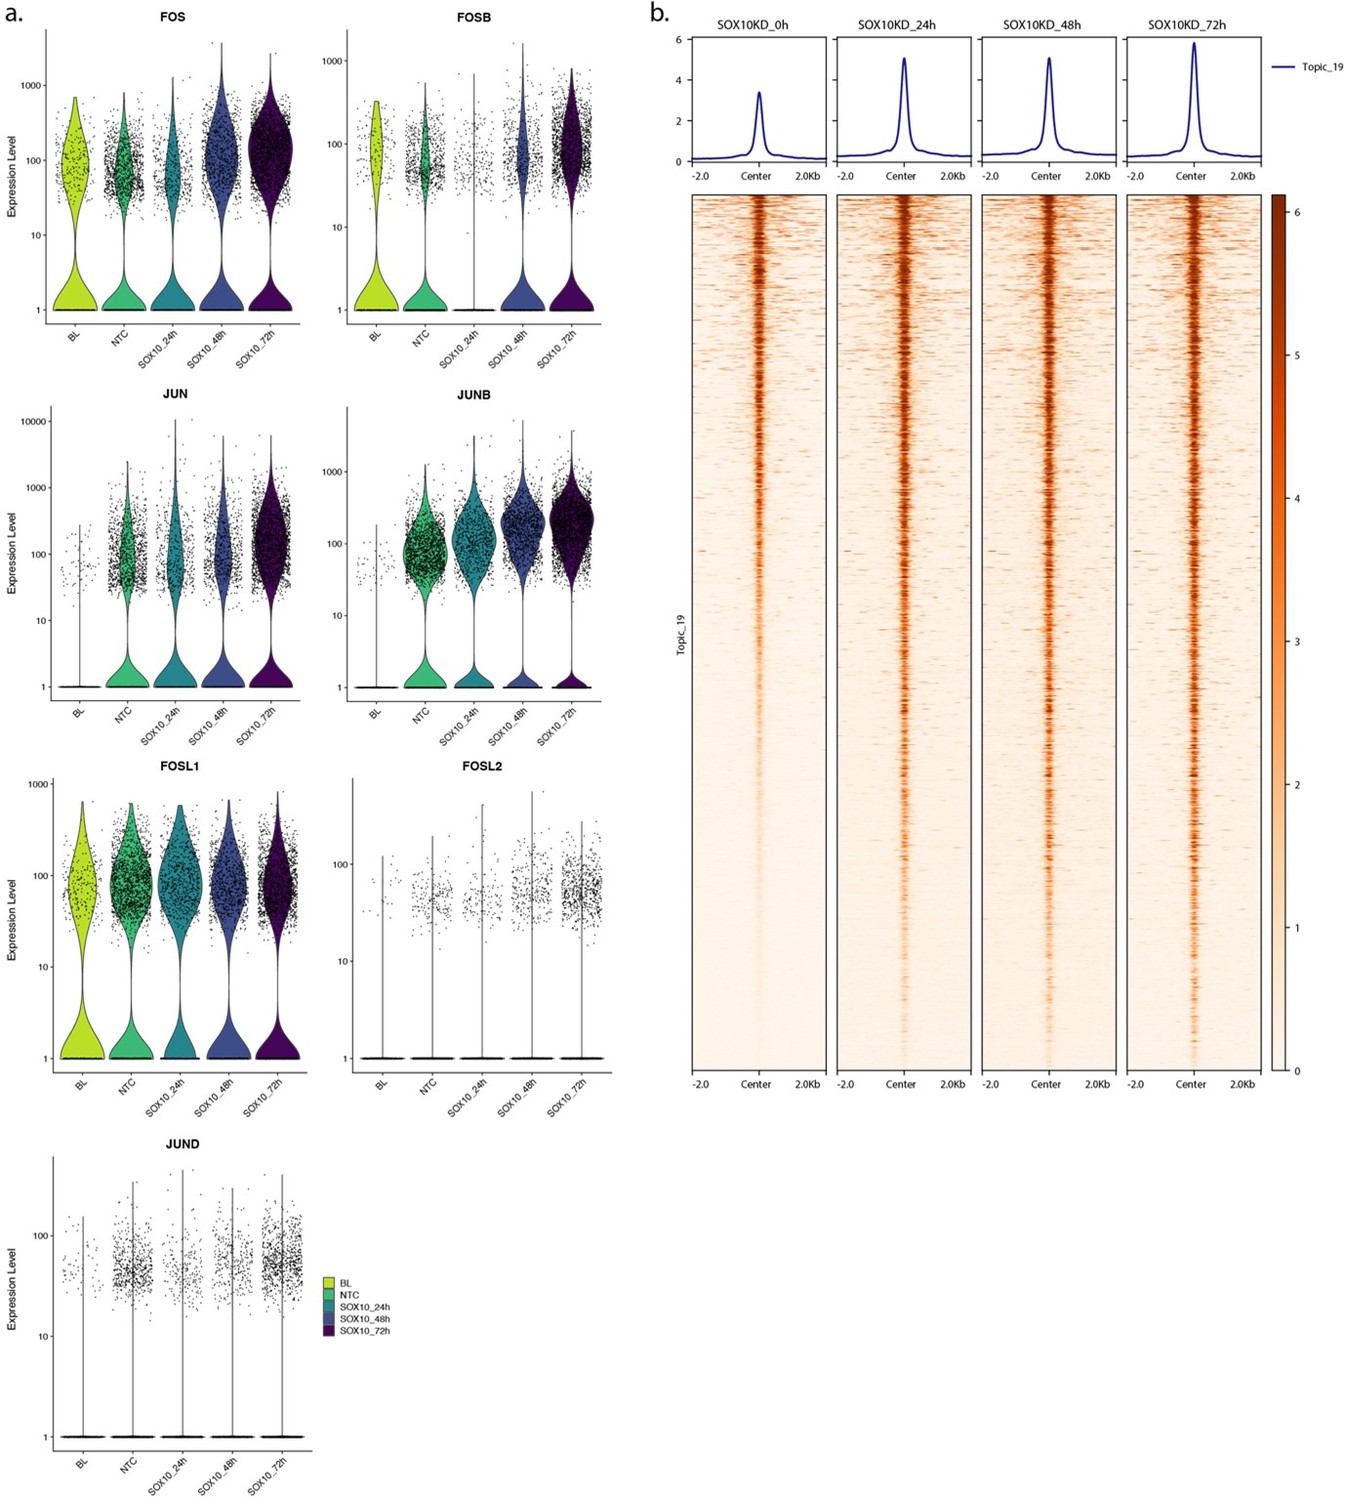
(a) Transcript expression level of AP-1 members upon SOX10 knock down in MM087 at different time points. BL: Base Line, NTC: Non-Targeting Control. (b) Heatmap of MM087 ATAC-seq signal in topic 19 regions upon SOX10 knock down.
Author response image 4
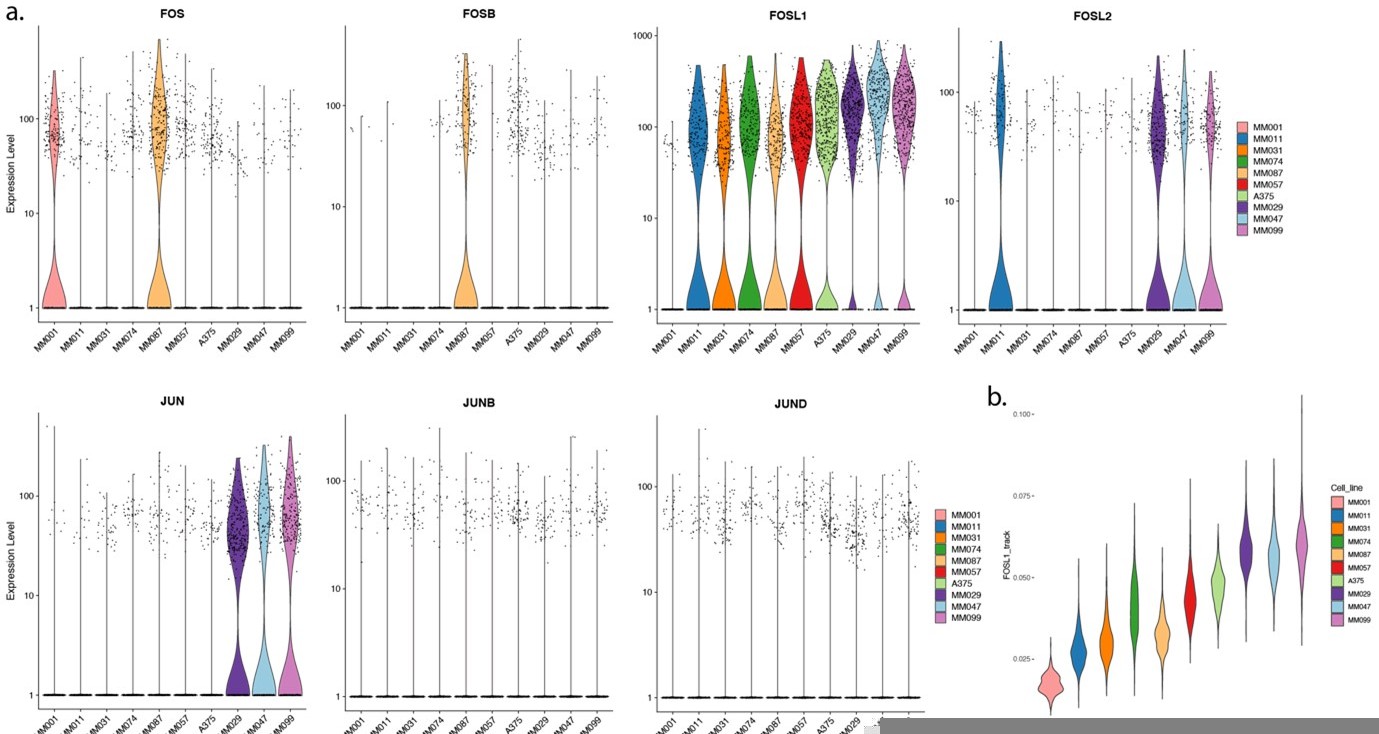
(a) Transcript expression level of AP-1 members from scRNA-seq of melanoma cell lines. (b) Track-based FOSL1 regulon activity.
Tables
Key resources table
| Reagent type (species) or resource | Designation | Source or reference | Identifiers | Additional information |
|---|---|---|---|---|
| Commercial assay or kit | KAPA-HiFi HotStart ReadyMix | Roche | Material # 7958935001 | |
| Commercial assay or kit | NEBuilder HiFi DNA Assembly Master Mix | NEB | Cat # E2621L | |
| Commercial assay or kit | In-Fusion HD Cloning Plus Kits | Takara | Cat # 638,911 | |
| Recombinant DNA reagent | pSA293- CHEQ-seq | This paper | Addgene: 174669;RRID:Addgene_174669 | CHEQ-seq backbone vector |
| Other | MF-Millipore 0.05 µm | Merck | Ref: VMWP02500 | 25 mm diameter, mixed cellulose esters (MCE) membrane |
| Strain, strain background (Escherichia coli) | Endura Electro Competent Cells | Lucigen | Cat # 60242-2 | Electrocompetent bacteria |
| Commercial assay or kit | MinElute PCR Purification Kit | QIAGEN | ID: 28004 | |
| Commercial assay or kit | SPRIselect | Beckman Coulter | Product # B23317 | |
| Commercial assay or kit | innuPREP RNA Mini Kit 2.0 | Analytik Jena | Cat # 845-KS-2040250 | |
| Commercial assay or kit | Dynabeads mRNA purification kit | Ambion | Cat # 61006 | |
| Commercial assay or kit | GoScript RT kit | Promega | Cat # A5003 | |
| Recombinant DNA reagent | pGL4.23-GW | Promega | Addgene: 60323;RRID:Addgene_60323 | Luciferase backbone vector |
| Recombinant DNA reagent | pRL-TK | Promega | Cat # E2241 | Renilla vector |
| Commercial assay or kit | Dual-Luciferase Reporter Assay System | Promega | Cat # E1910 |
Additional files
-
Supplementary file 1
Composition of the massively parallel reporter assay (MPRA) libraries and list of sequences tested by luciferase assay.
For the ATAC-seq-based library, modifications to the original sequence to allow DNA synthesis are indicated in the ‘Modification’ column. For the SOX-MITF combinations library, a table indicating the arrangement of the binding sites is provided.
- https://cdn.elifesciences.org/articles/71735/elife-71735-supp1-v2.xlsx
-
Supplementary file 2
List of primers used for the generation of each massively parallel reporter assay (MPRA) library and for the sequencing library preparation.
- https://cdn.elifesciences.org/articles/71735/elife-71735-supp2-v2.xlsx
-
Transparent reporting form
- https://cdn.elifesciences.org/articles/71735/elife-71735-transrepform1-v2.docx
Download links
A two-part list of links to download the article, or parts of the article, in various formats.
Downloads (link to download the article as PDF)
Open citations (links to open the citations from this article in various online reference manager services)
Cite this article (links to download the citations from this article in formats compatible with various reference manager tools)
Analysis of long and short enhancers in melanoma cell states
eLife 10:e71735.
https://doi.org/10.7554/eLife.71735


