Invariant representation of physical stability in the human brain
- Center for Brains, Minds and Machines, Massachusetts Institute of Technology, United States
- Department of Brain and Cognitive Sciences, Massachusetts Institute of Technology, United States
- Amherst College, United States
Figures
Figure 1
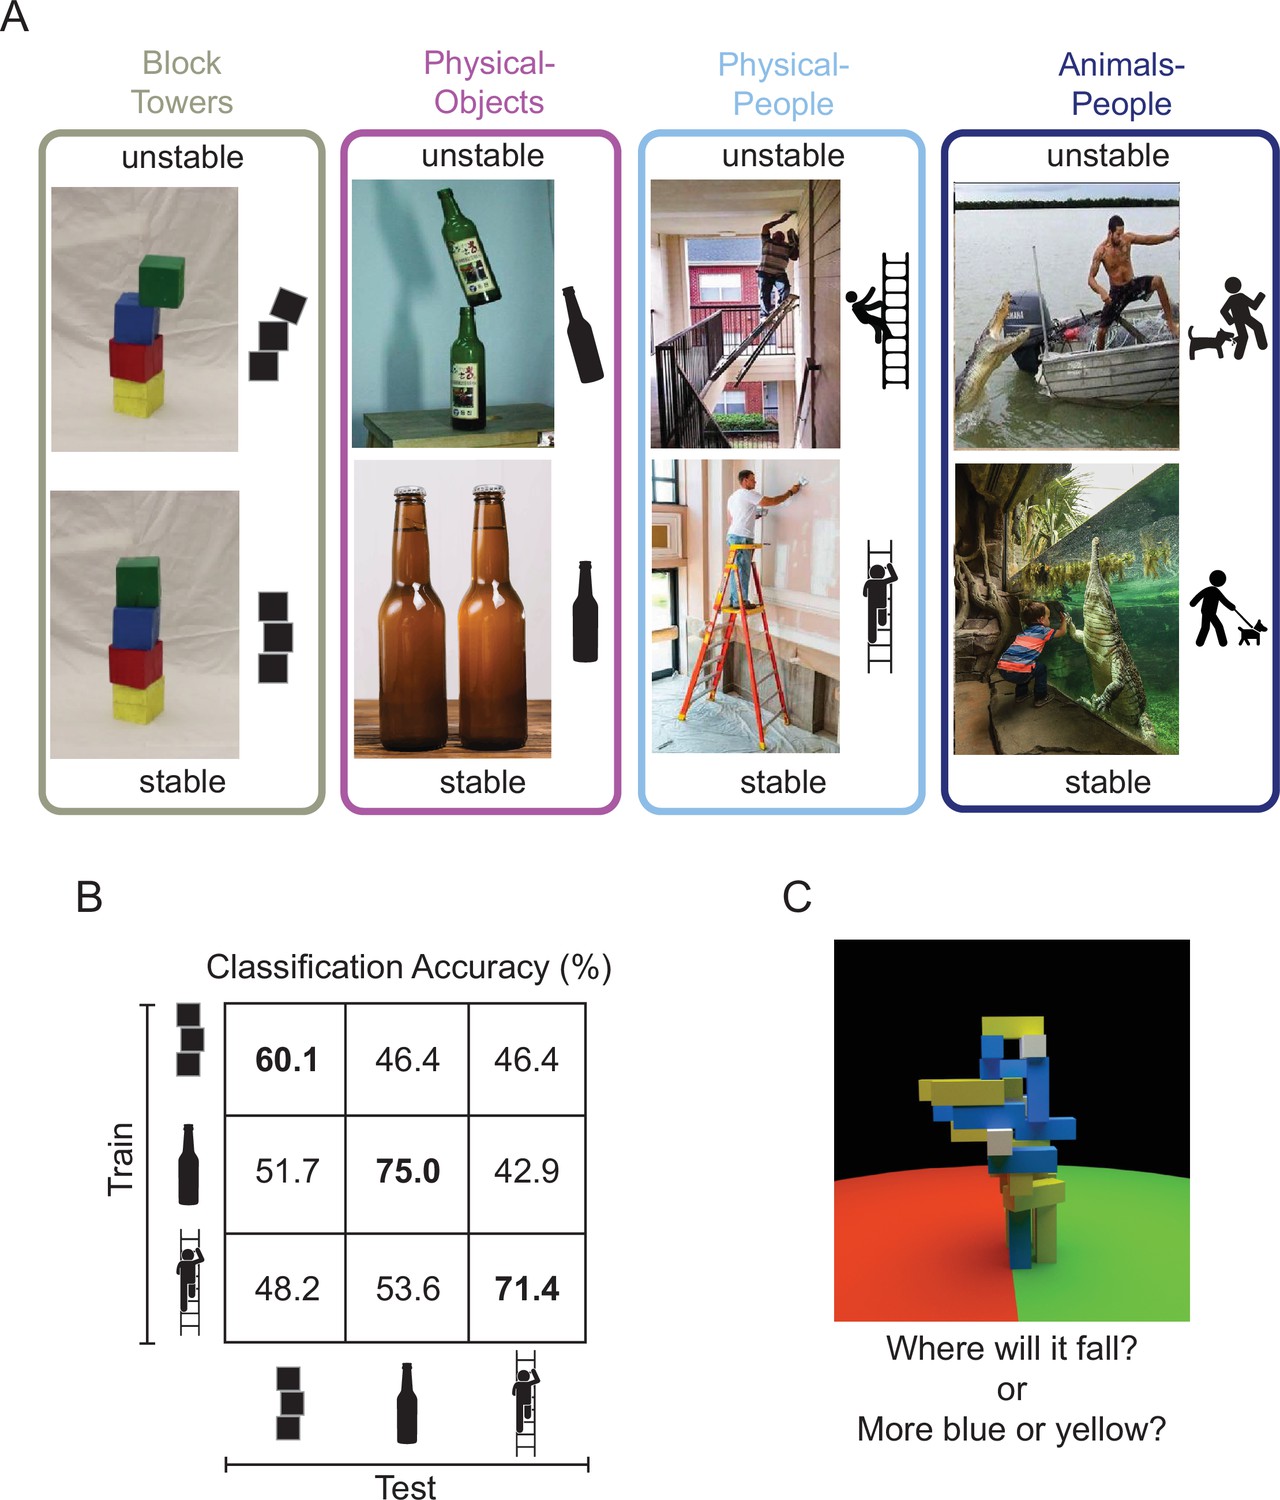
Design of studies conducted on machines and brains.
(A) Image sets depicting (1) unstable versus stable block towers (left), (2) objects in unstable versus stable configurations (middle left, the Physical-Objects set), (3) people in physically unstable versus stable situations (middle right, the Physical-People set), and (4) people in perilous (‘unstable’) versus relatively safe (‘stable’) situations with respect to animals (right, the Animals-People set). Note that by ‘physically unstable’ we refer to situations that are currently unchanging, but that would likely change dramatically after a small perturbation like a nudge or a puff of wind. The former three scenarios were used to study the generalizability of feature representations in a deep convolutional neural network (CNN) and the latter three scenarios were used in the human fMRI experiment. (B) Accuracy of a linear support vector machine (SVM) classifier trained to distinguish between CNN feature patterns for unstable versus stable conditions, as a function of Test Set. Accuracy within a scenario (i.e., train and test on the same scenario) was computed using a fourfold cross-validation procedure. (C) A functional localizer task contrasted physical versus nonphysical judgments on visually identical movie stimuli (adapted from Figure 2A from Fischer et al., 2016). During the localizer task, subjects viewed movies of block towers from a camera viewpoint that panned 360° around the tower, and either answered ‘where will it fall?’ (physical) or ‘does the tower have more blue or yellow blocks?’ (nonphysical).
Figure 2 with 1 supplement
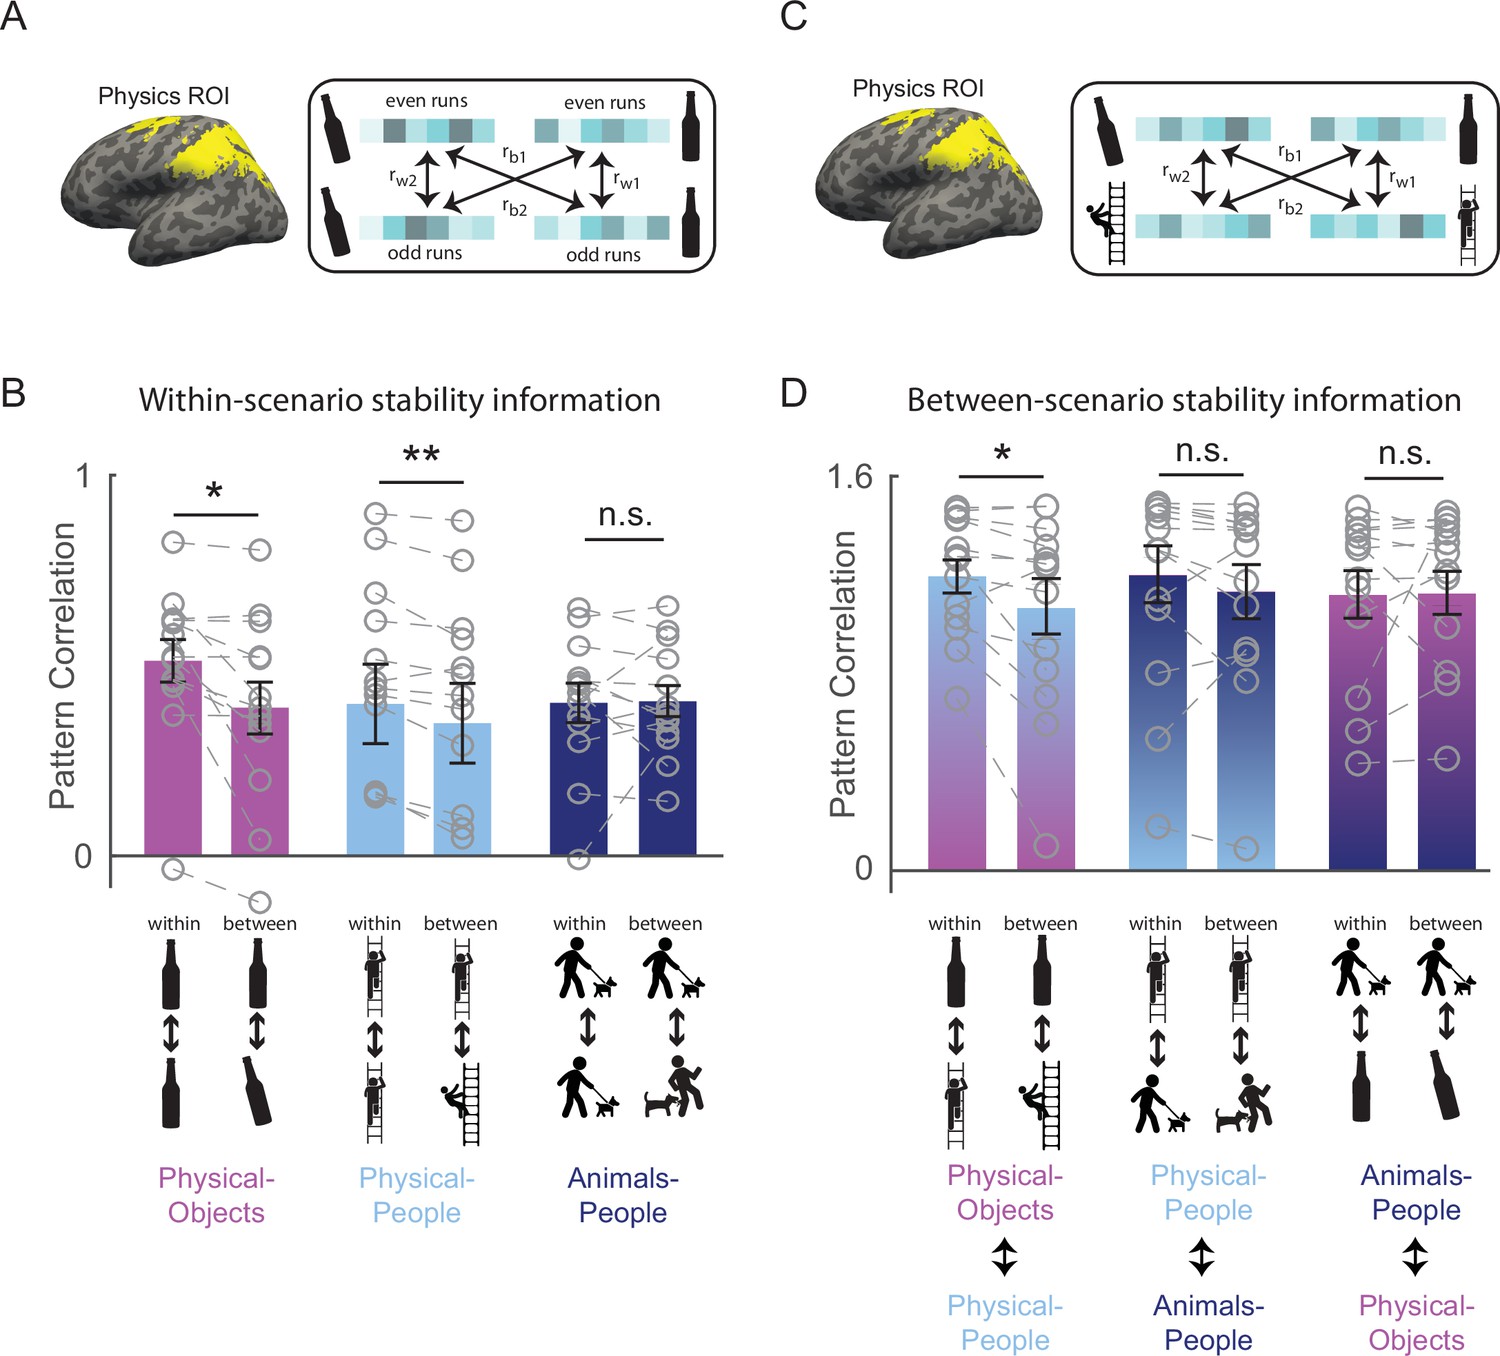
Generalizable representation of physical stability in the human brain.
(A) Functionally defined regions of interest implicated in intuitive physical inference (the Physics Network) were defined in each participant individually by intersecting the activation from a localizer task with anatomical constraint parcels in the frontal and parietal lobes shown in yellow (see Methods). Patterns of activity across voxels in these functional regions of interest (fROIs) were extracted separately in each participant for each combination of even and odd runs, unstable and stable conditions, and scenario (Physical-Objects, Physical-People, and Animals-People). Following standard practice (Haxby et al., 2001), correlations between even and odd runs in the pattern of response across voxels were computed both within stability conditions (rw1 = stable even to stable odd and rw2 = unstable even to unstable odd), and between stability conditions (rb1 = stable even to unstable odd and rb2 = unstable even to stable odd), for each of the three scenario types. (B) Bar plot showing average pattern correlations within and between conditions with paired t-tests done after Fisher transformation, for each scenario type. (C) is similar to (A) but the within and between stability pattern correlations were computed across scenario types (rw1 and rw2 indicate pattern correlations computed within stable or within unstable conditions across scenario, and rb1 and rb2 indicate pattern correlations computed between stable and unstable conditions across scenario). (D) is same as in (B) but for pattern correlations computed across scenarios. Note that the across scenario correlations in (D) are overall higher than within-scenario correlations in (C) because the data were not split into odd and even runs for the across scenario case. Gray circles and the corresponding connecting lines denote individual subject’s data. Error bars indicate standard error of mean across subjects. ** and * indicate statistically significant effect at p ≤ 0.005 and p ≤ 0.05, respectively, and n.s. indicates no statistically significant effect.
Figure 2—figure supplement 1
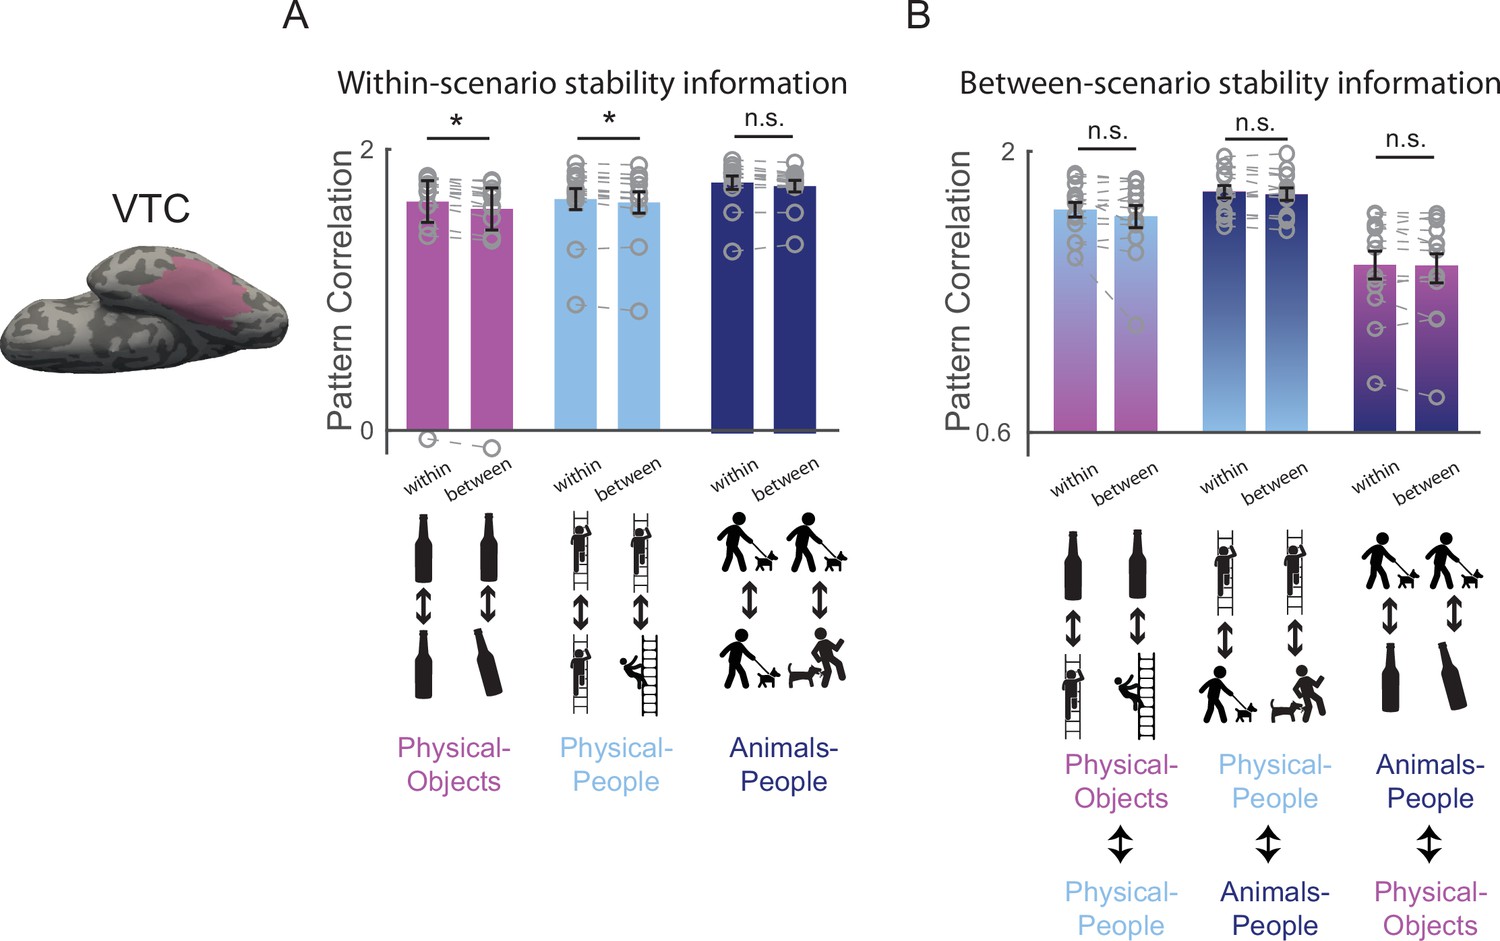
Stability decoding in ventral temporal cortex (VTC) regions of interest (ROI).
(A) Bar plot showing average pattern correlations within and between stability conditions with paired t-tests done after Fisher transformation, for each scenario type. (B) is same as in (A) but for pattern correlations computed across scenario types.
Figure 3
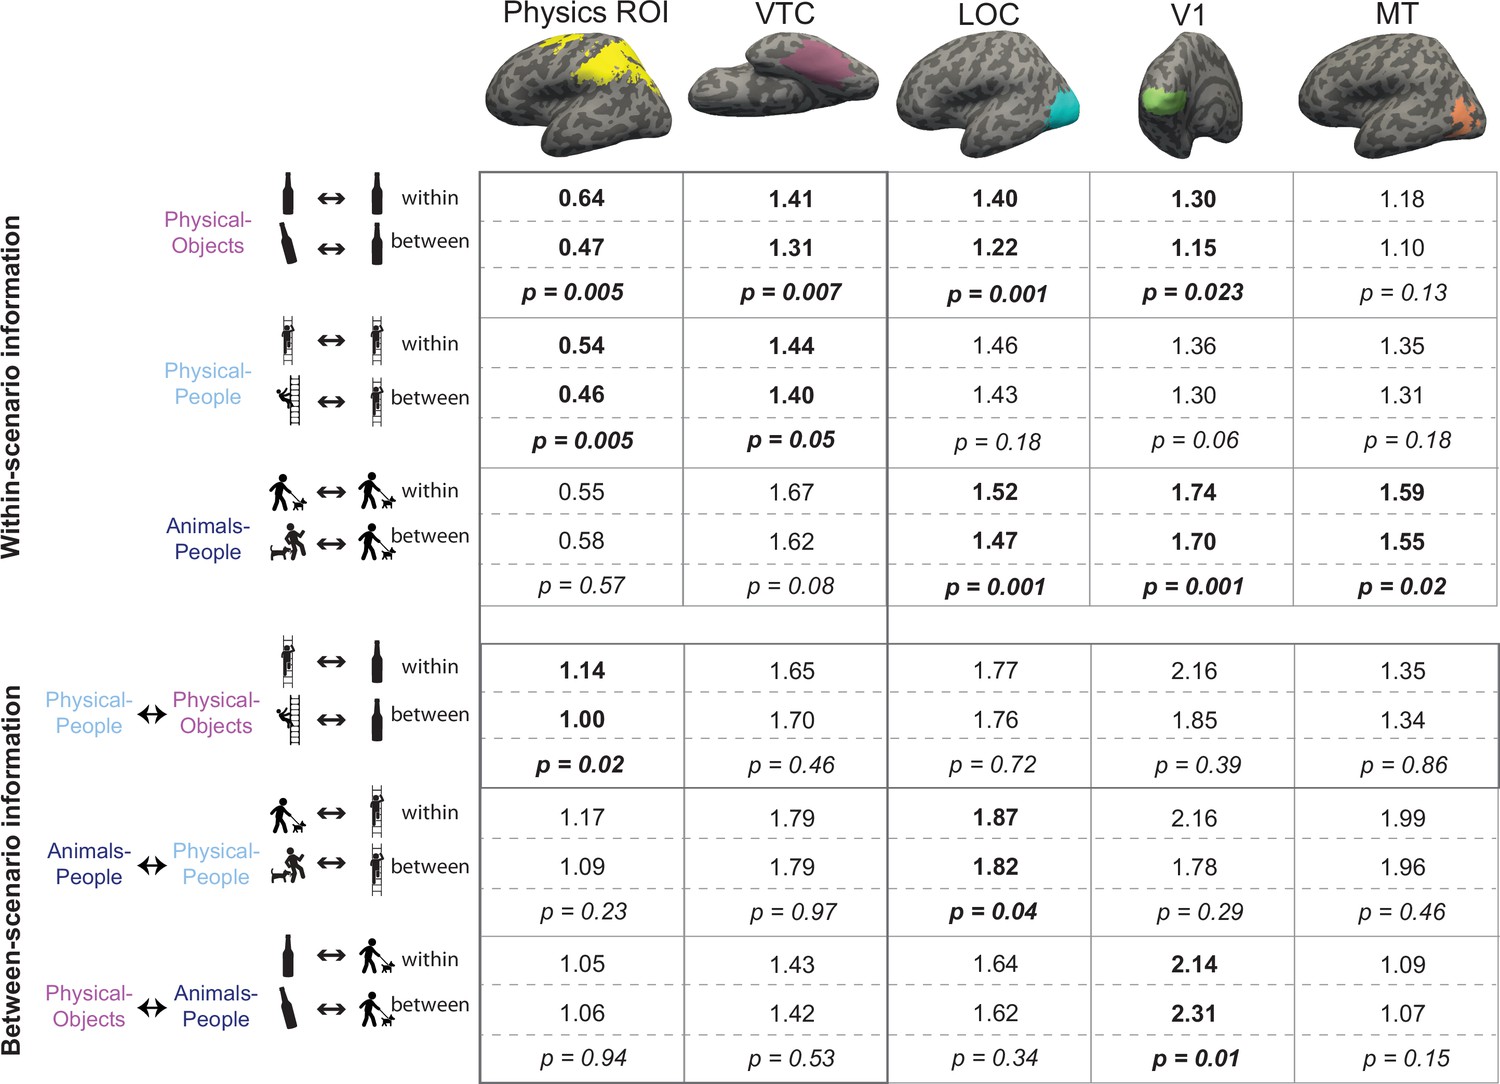
Multivoxel pattern correlation analysis in all regions of interest (ROIs).
Each cell shows the average Fisher transformed correlation within and between stability conditions, along with the p value for a paired t-test comparing the two sets of values. Each column includes the results from one functional regions of interest (fROI). The top three rows contain results for the analyses within-scenario type and the bottom three rows show results for the pattern correlation analysis across scenarios. Significantly higher correlations for within than between conditions are highlighted in bold. The row depicting the crucial cross-decoding result with significant generalization only in the Physics Network ROI is highlighted with a darker bounding box.
Figure 4
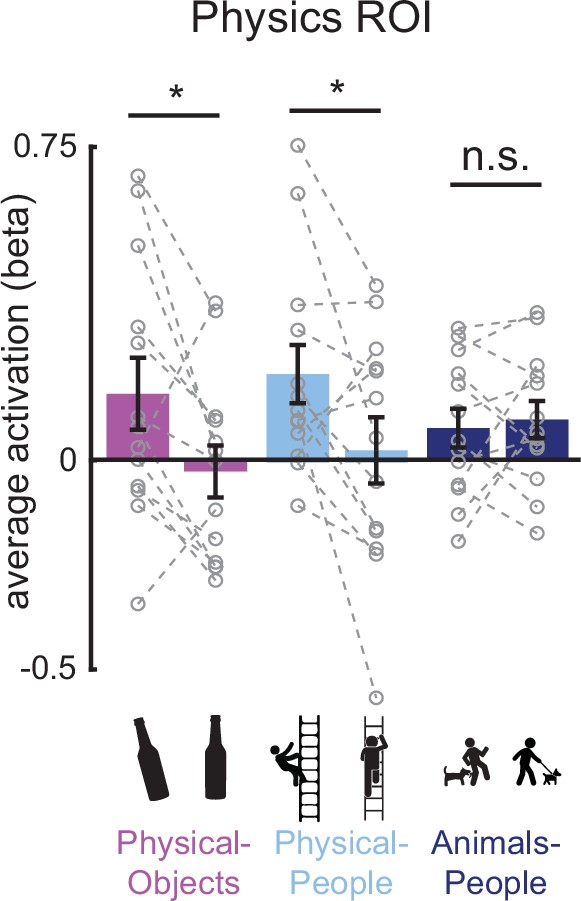
Bar plot showing the average activation (GLM beta estimates) in the physics functional regions of interest (fROI) for both stable and unstable conditions in each of the three scenario types (Physical-Objects, Physical-People, and Animals-People).
Gray circles and the corresponding connecting lines indicate individual subject’s data. Error bars indicate standard error of mean across subjects. * indicates significant effect at p < 0.05 and n.s. indicates no statistically significant effect.
Figure 5
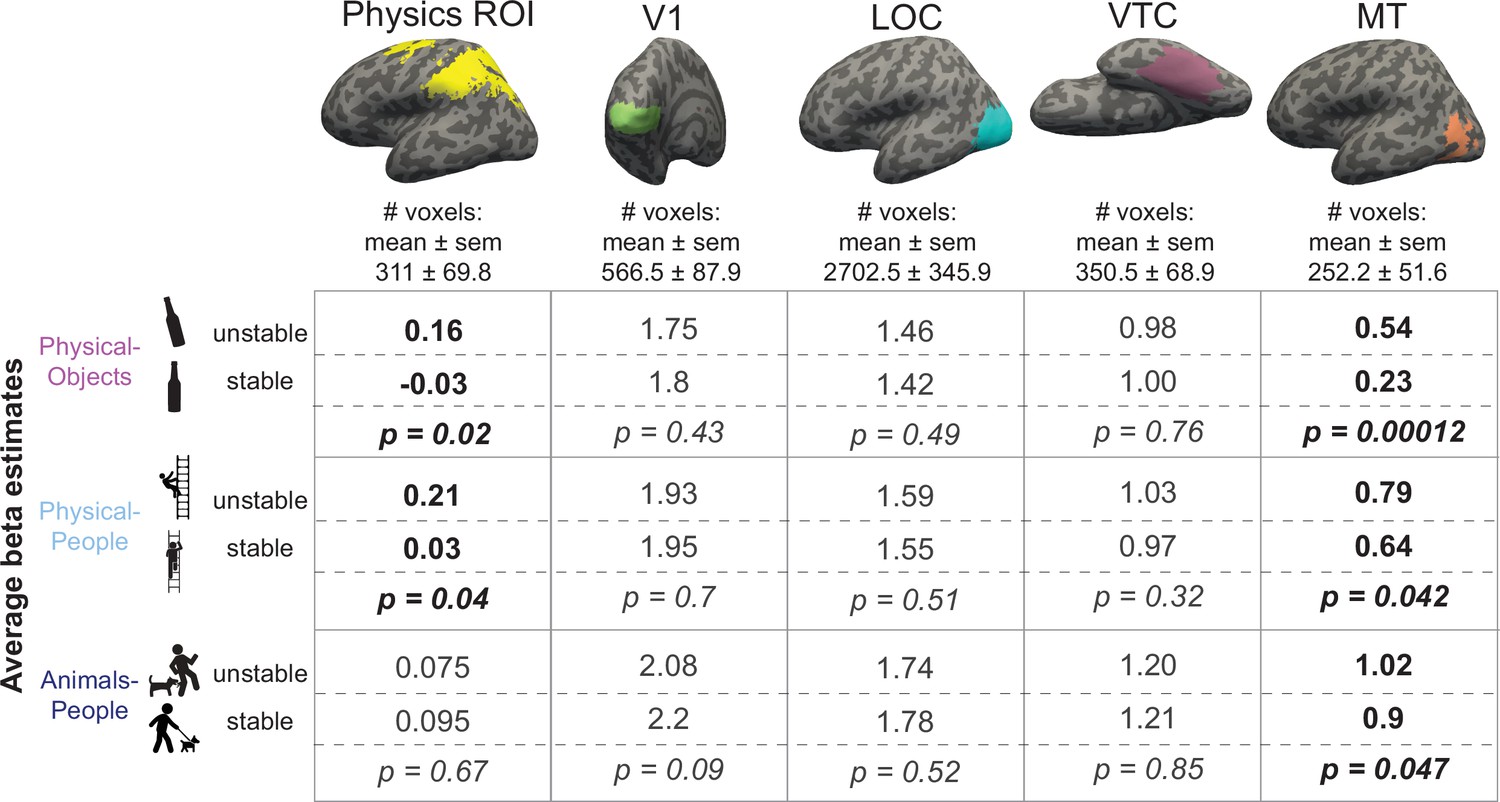
Average beta values for unstable and stable conditions in each of the scenarios.
Columns represent different functional regions of interest (fROIs). Each cell shows average GLM estimated beta values for unstable and stable conditions along with the p value for a paired t-test comparing the two sets of values. Scenarios showing significantly higher response to unstable scenes compared to stable scenes are highlighted in bold in each column.
Tables
Author response table 1
| Physical-Objects | Physical-People | Animals-People | ||||
|---|---|---|---|---|---|---|
| Stable | Unstable | Stable | Unstable | Non-Peril | Peril | |
| % Accuracy (mean ± std across subjects) | 94.4 ± 1.9 | 93.1 ± 1.9 | 88.5 ± 3.3 | 95.7 ± 1.4 | 93.5 ± 1.4 | 99.5 ± 0.4 |
| p-value (signrank test on avg. accuracy across subjects) | p = 0.67 | p = 0.008 | p = 0.002 | |||
Author response table 2
| Physical-Objects | Physical-People | Animals-People | ||||
|---|---|---|---|---|---|---|
| Stable | Unstable | Stable | Unstable | Non-Peril | Peril | |
| Reaction Time, ms (mean ± std) | 862.1 ± 43.8 | 943.2 ± 45.2 | 1088.2 ± 48.8 | 958.1 ± 46.8 | 1003.2 ± 60.8 | 881.5 ± 29.9 |
| p-value (signrank test on avg. RTs across subjects) | p = 0.05 | p = 0.002 | p = 0.008 | |||
| Average RT, ms | 902.7 | 1023.2 | 942.3 | |||
| RT difference, ms (unstable – stable) | 81.2 | -130.1 | -121.7 | |||
Additional files
-
Supplementary file 1
Average values of eye tracking variables and interestingness ratings for stable and unstable conditions in all three scenarios.
Each cell shows the average value of the variable for stable and unstable conditions along with the p value for a paired t-test comparing the two sets of values across subjects. The first five columns correspond to eye movement variables collected on 6 subjects during the fMRI experiment and the last column is for the interestingness rating collected on the same set of images but in 11 subjects outside the scanner (see Methods for details). Since the subjects were instructed to maintain fixation at the center of the image, we did not observe any saccadic events (amplitude >1°) and hence we are calling the small ballistic events as simply eye movements. Significant effects (p < 0.05) are highlighted in bold.
- https://cdn.elifesciences.org/articles/71736/elife-71736-supp1-v1.docx
-
Supplementary file 2
MVPA in the candidate physics regions computed separately for parietal and frontal ROIs.
Each cell shows the average Fisher transformed within and between stability condition pattern correlations along with the p value for a paired t-test comparing the two sets of values. Each column includes the results from one fROI. The top three rows contain results for within-scenario pattern correlation analysis and the bottom three rows show results for the pattern correlation analysis across scenarios. Significant effects with within condition correlations greater than between condition correlations are highlighted in bold.
- https://cdn.elifesciences.org/articles/71736/elife-71736-supp2-v1.docx
-
Supplementary file 3
Average beta values for unstable and stable conditions in each of the scenarios computed separately for parietal and frontal physics ROIs.
Each cell shows average GLM estimated beta values for unstable and stable conditions along with the p value for a paired t-test comparing the two sets of values across subjects. Scenarios showing significantly higher response to unstable scenes compared to stable scenes are highlighted in bold in each column.
- https://cdn.elifesciences.org/articles/71736/elife-71736-supp3-v1.docx
-
Supplementary file 4
Reaction time analysis for stable and unstable conditions in each of the scenarios for the stability judgment task.
- https://cdn.elifesciences.org/articles/71736/elife-71736-supp4-v1.docx
-
Supplementary file 5
Accuracies for stable and unstable conditions in each of the scenarios for the stability judgment task.
- https://cdn.elifesciences.org/articles/71736/elife-71736-supp5-v1.docx
-
Supplementary file 6
Methods and results for the stability detection behavioral task.
- https://cdn.elifesciences.org/articles/71736/elife-71736-supp6-v1.docx
-
Transparent reporting form
- https://cdn.elifesciences.org/articles/71736/elife-71736-transrepform1-v1.docx
Download links
A two-part list of links to download the article, or parts of the article, in various formats.
Downloads (link to download the article as PDF)
Open citations (links to open the citations from this article in various online reference manager services)
Cite this article (links to download the citations from this article in formats compatible with various reference manager tools)
Invariant representation of physical stability in the human brain
eLife 11:e71736.
https://doi.org/10.7554/eLife.71736


