Regulated delivery controls Drosophila Hedgehog, Wingless, and Decapentaplegic signaling
- Cardiovascular Research Institute University of California, San Francisco, United States
Figures
Figure 1 with 4 supplements

Signal transduction is constant in conditions that vary amounts of Hh production.
(A) Schematic of the wing disc and ASP indicating A and P compartments, ASP and trachea (blue), myoblasts (orange), and domains of expression for Hh (green), Dpp and Ptc (pink), and Wg (red). Rectangle (dashed lines, 20 μm×20 μm) indicates region that was imaged at high magnification in (D) and in Figure 2A,D. (B) Bar graph showing the number of hh genes in genotypes with different combinations of WT hh and hh BAC transgenes; gray and green bars represent genes encoding Hh and Hh:GFP, respectively. (C) Bar graph showing the amount of Hh RNA (blue) in wing discs and Hh protein (red) in wing disc P compartments, measured by qPCR and α-Hh antibody staining, respectively, with genotypes indicated and number of hh genes indicated by numbers in the bars; values normalized to the amount of hh RNA and Hh protein in genotype with 1 copy of WT hh (+). (D) Optical sections showing α-Ptc antibody staining in region indicated in (A) by rectangle for indicated genotypes. Scale bar: 20 μm. (E) Bar graph of widths of antibody stained Ptc domains in (D), manually measured from maximum intensity projections of optical sections spanning 10 μm from the most apical side of the wing pouch cells. No statistically significant differences for 1–4 gene copies (p>0.05), n=6–8 for each genotype. (F) Adult wings for indicated genotypes. Scale bar: 100 μm. (G) Bar graph showing the measured wing size (left) and wing shape (right); no statistically significant differences (p>0.05), n=12–18 for each genotype. (H) Wing discs for each indicated genotype. Error bars in (D, G) indicate standard deviation (SD). Scale bar: 100 μm. Genotypes: +- (WT hh gene); HS (40 k Hh BAC); HL- (100 k Hh BAC); HS (Hh:GFP 40 k BAC); + (hhAC/+); HS, (Hh:GFP 40 k BAC; hhAC/hhAC); HS,+ (Hh:GFP 40 k BAC; hhAC/+); HS,+,+ (Hh 40 k BAC; +/+); HL,+,+ (Hh 100 k BAC; +/+); HS,+,+ (Hh:GFP 40 k BAC; +/+); HS,HL,+,+ (Hh 40 k BAC / Hh 100 k BAC +/+); hhG4>HhGFP (hhGal4 UAS-HhGFP, +/+).
-
Figure 1—source data 1
Amount of Hh mRNA.
- https://cdn.elifesciences.org/articles/71744/elife-71744-fig1-data1-v3.xlsx
-
Figure 1—source data 2
Ptc band width.
- https://cdn.elifesciences.org/articles/71744/elife-71744-fig1-data2-v3.xlsx
Figure 1—figure supplement 1
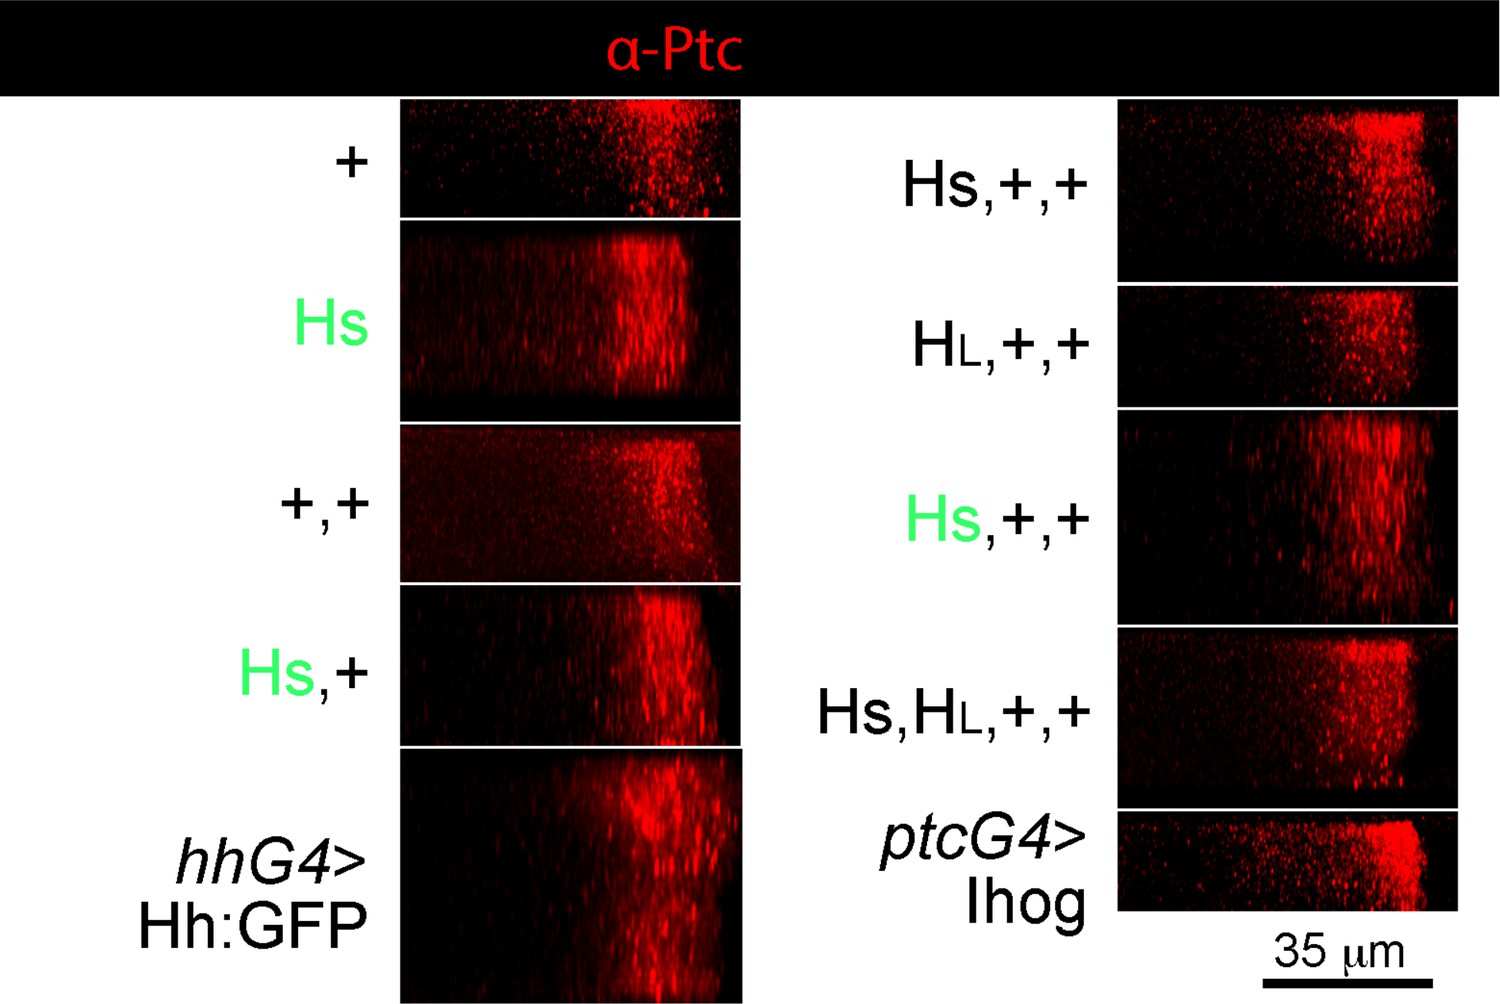
Apical/basal distributions of Ptc in hh gene copy number genotypes.
Panels show representative maximum projection compilations of multiple cross-sections of wing discs stained with α-Ptc antibody. Anterior, left; posterior, right; apical, up; basal, down. Width of Ptc stripe unchanged except for ptcGal4>Ihog (elevated A compartment staining) and hhGal4>Hh:GFP (thicker disc).
Figure 1—figure supplement 2
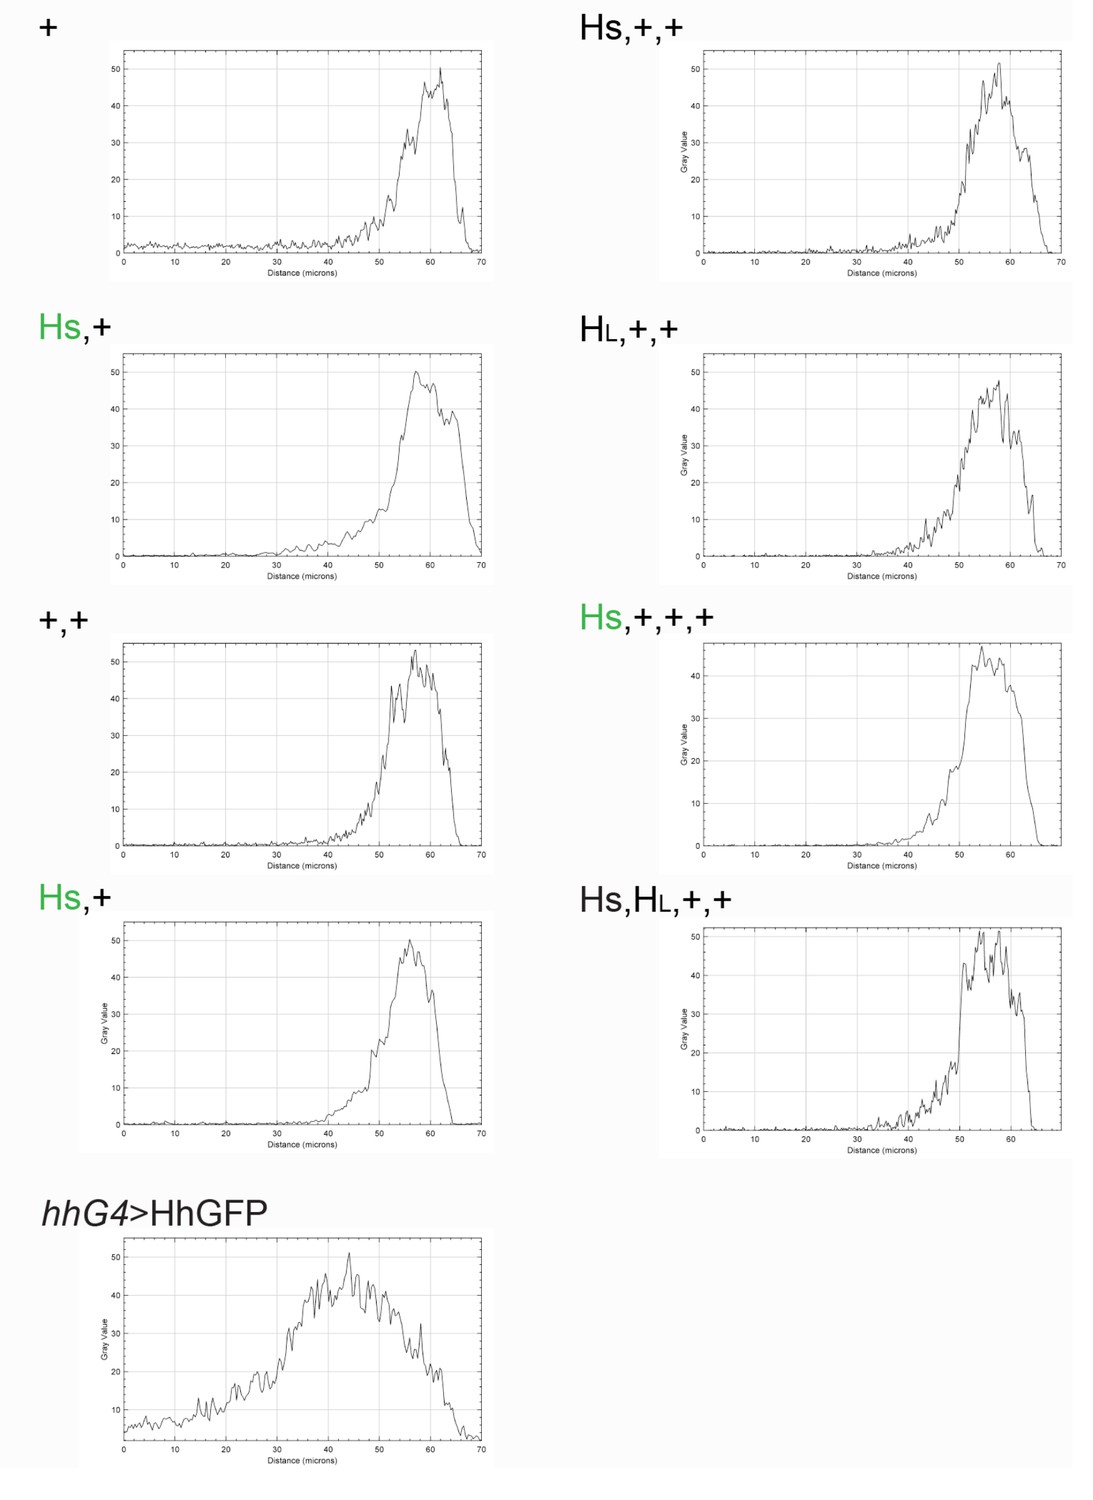
Intensity profiles of Ptc expression in hh gene copy number genotypes.
Representative profiles of bands of Ptc expression in Figure 1D.
Figure 1—figure supplement 3

Knot expression in hh gene copy number genotypes.
Images from wing discs stained with α-Knot antibody. Anterior, left; posterior, right. Numbers indicate gene copy number. Bar graph shows average width of the Kn band, which is not statistically significant difference in the genotypes. N=8–10.
-
Figure 1—figure supplement 3—source data 1
Kn band width.
- https://cdn.elifesciences.org/articles/71744/elife-71744-fig1-figsupp3-data1-v3.xlsx
Figure 1—figure supplement 4
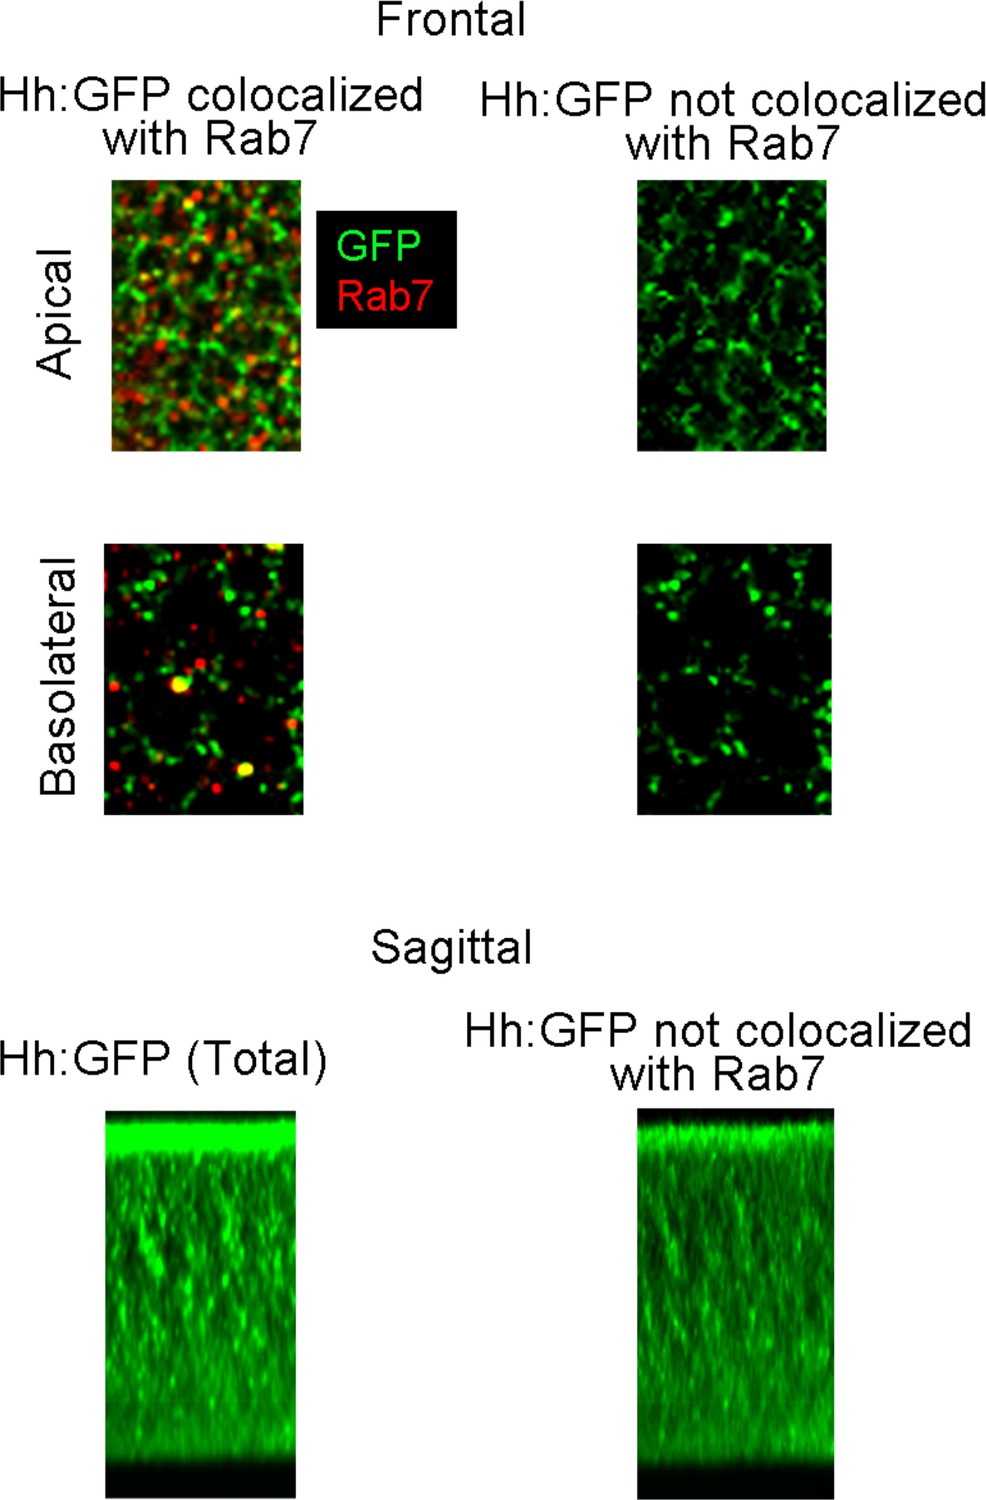
Colocalization of Hh and Rab7 in the wing imaginal disc.
Wing discs (Hh:GFP/+) were stained with α-GFP and α-Rab7 antibodies; frontal images from apical and basal optical sections (upper panels) were shown with both α-GFP and α-Rab7 staining (left panels) and after removal of pixels with both red and green fluorescence using ImageJ. Bottom panels show images of sagittal projects of staining of Hh:GFP before (left) and after (right) removal of pixels with both red and green fluorescence using ImageJ.
Figure 2 with 3 supplements
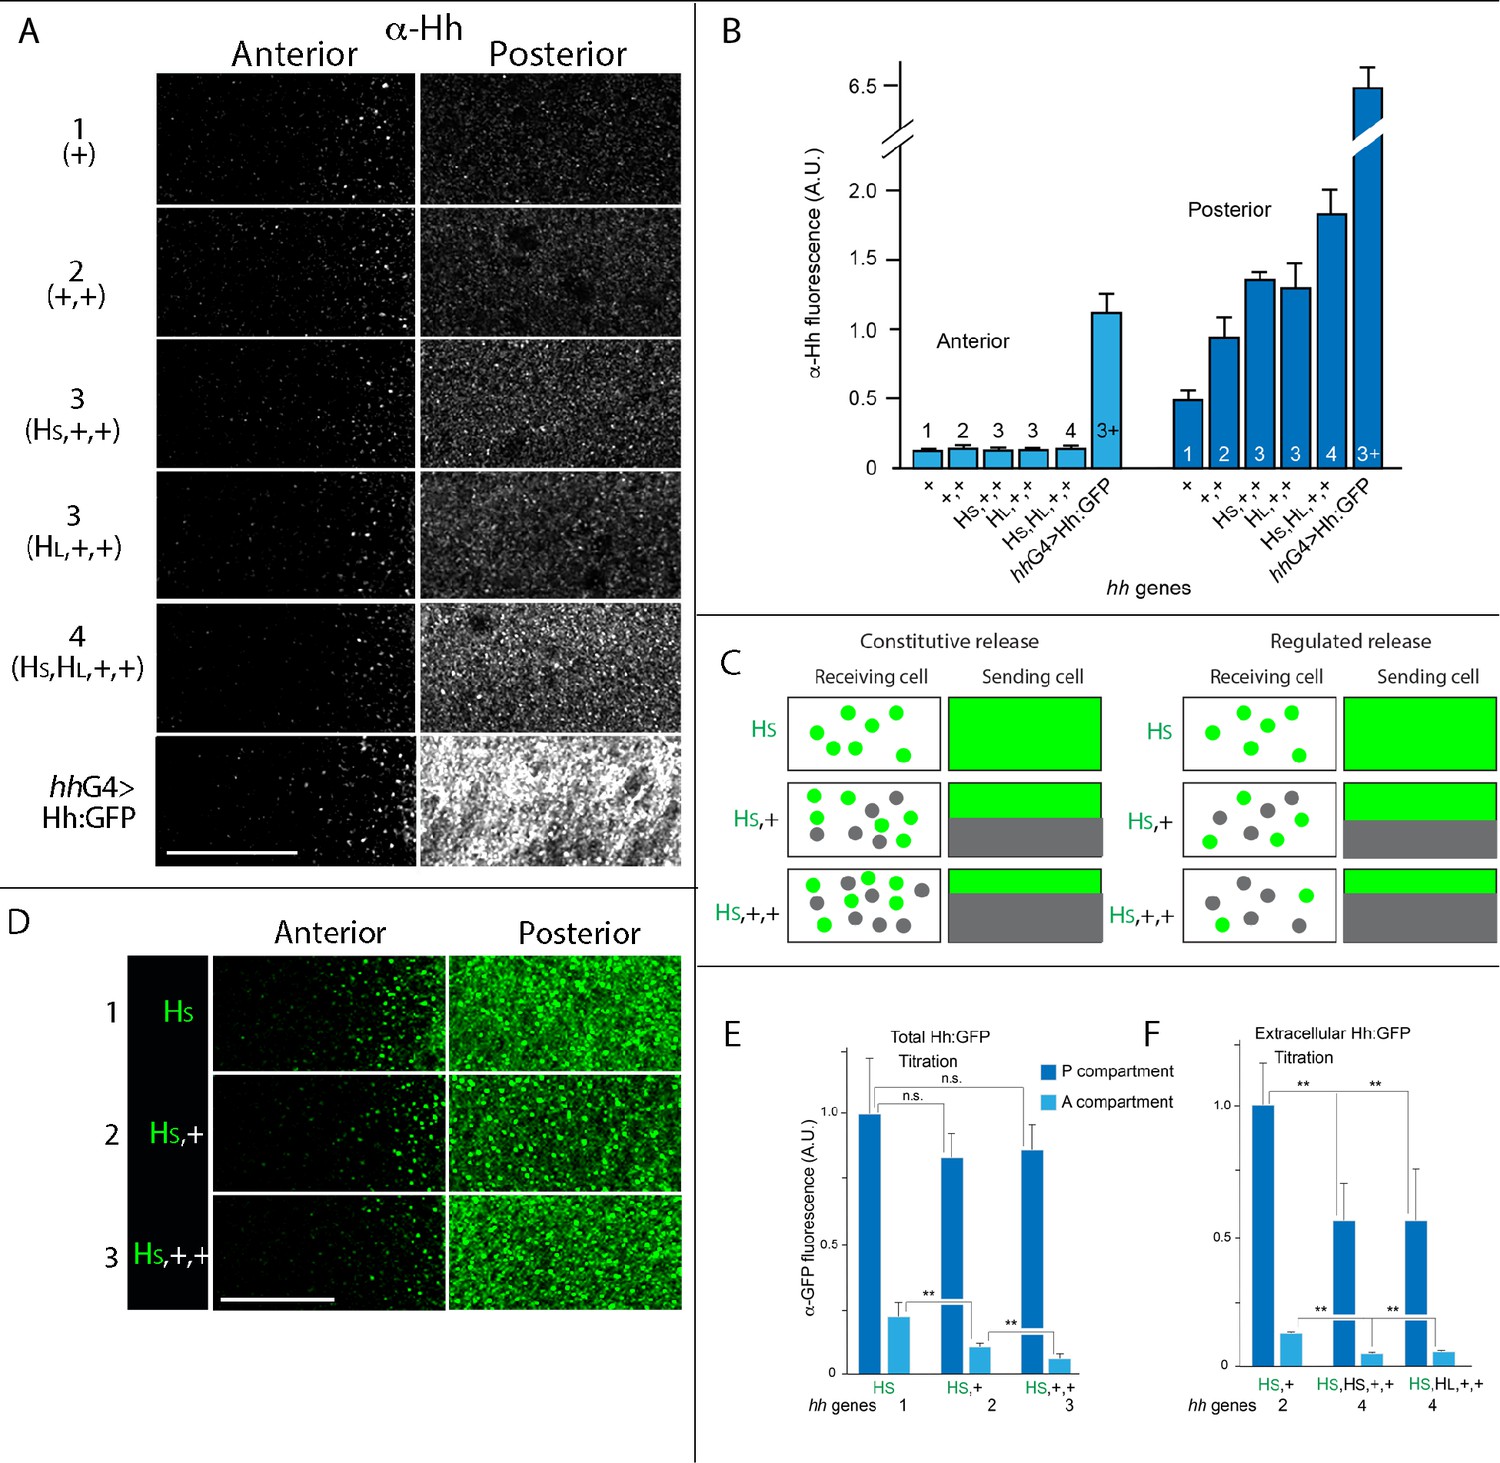
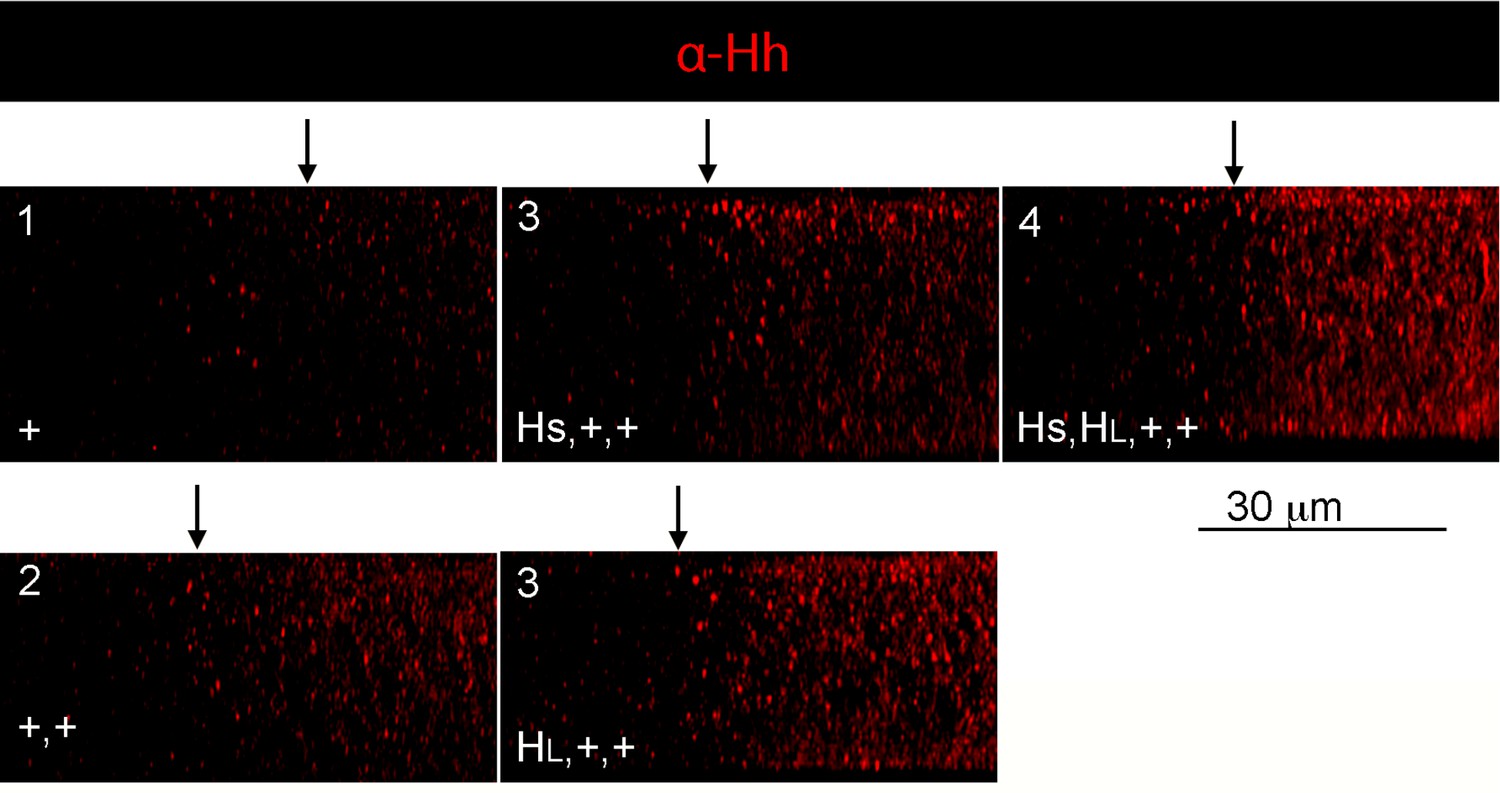
Hh delivery is constant in conditions that vary amounts of Hh production.
(A) α-Hh antibody staining in regions indicated in Figure 1A for indicated genotypes. (B) Bar graph showing the intensity of α-Hh antibody staining in A and P compartments of wing blades for indicated genotypes. No statistically significant differences for A compartment (p>0.05) except for hhGal4>Hh:GFP; for P compartment, staining was statistically different for genotypes with different numbers of hh genes (1, 2, 3, and 4, hhGal4; Student’s t-test, p<0.05), but not between equivalent numbers of genes (HS,+,+ and HL,+,+; p>0.05), n=5–7 discs for each genotype. (C) Schematic portraying the predicted differences between constitutive release and regulated release for different genotypes, Hh and Hh:GFP indicated by gray and green dots, respectively. (D) Images of α-GFP antibody staining in regions indicated in Figure 1A for indicated genotypes. (E, F) Bar graphs showing wing discs with indicated genotypes stained with α-GFP antibody using standard fixation (E) or extracellular staining protocol (F). **-p<0.005, n.s.-p>0.05; n=4–6 for each genotype. Abbreviations as in Figure 1. Scale bar: 20 μm.
-
Figure 2—source data 1
Amount of Hh.
- https://cdn.elifesciences.org/articles/71744/elife-71744-fig2-data1-v3.xlsx
-
Figure 2—source data 2
Amount of Hh:GFP.
- https://cdn.elifesciences.org/articles/71744/elife-71744-fig2-data2-v3.xlsx
-
Figure 2—source data 3
Amount of extracellular Hh:GFP.
- https://cdn.elifesciences.org/articles/71744/elife-71744-fig2-data3-v3.xlsx
Figure 2—figure supplement 1
Apical/basal distributions of Hh in hh gene copy number genotypes.
Sagittal images from optical sections of wing discs stained with α-Hh antibody. Anterior, left; posterior, right. Arrows indicate the approximate location of A/P compartment borders.
Figure 2—figure supplement 2
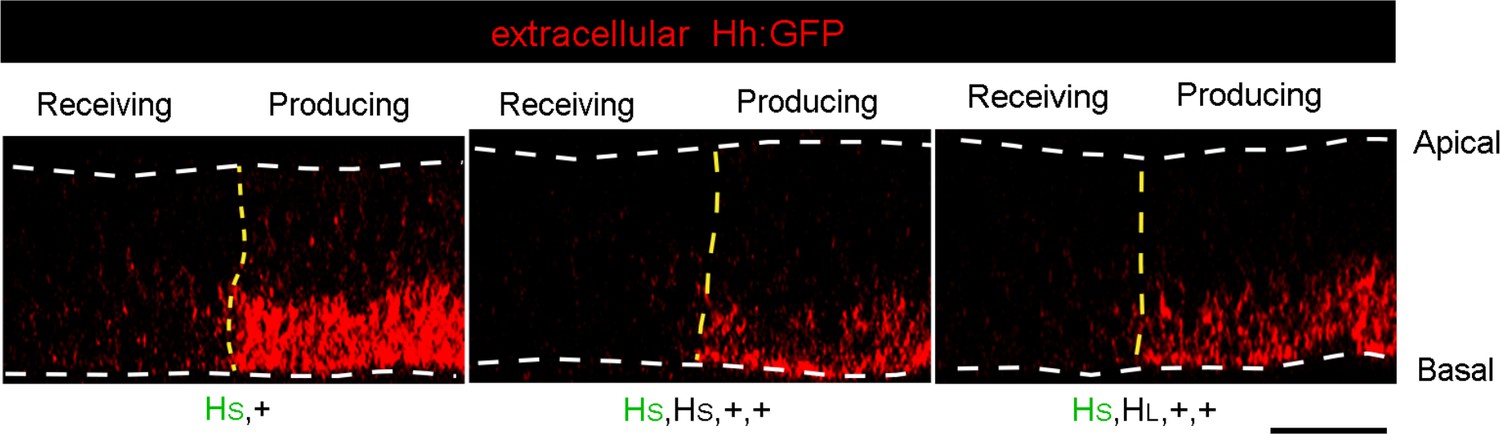
Distributions of extracellular Hh in hh gene copy number genotypes.
Sagittal images from optical sections of wing discs with one Hh:GFP gene together with one, or three hh genes. Discs were stained with α-GFP antibody. Anterior, left; posterior, right. Yellow dashed lines indicate the approximate location of A/P compartment borders; white dashed lines indicate the locations of apical (top) and basal (bottom) membranes. Scale bar: 25 μm.
Figure 2—figure supplement 3
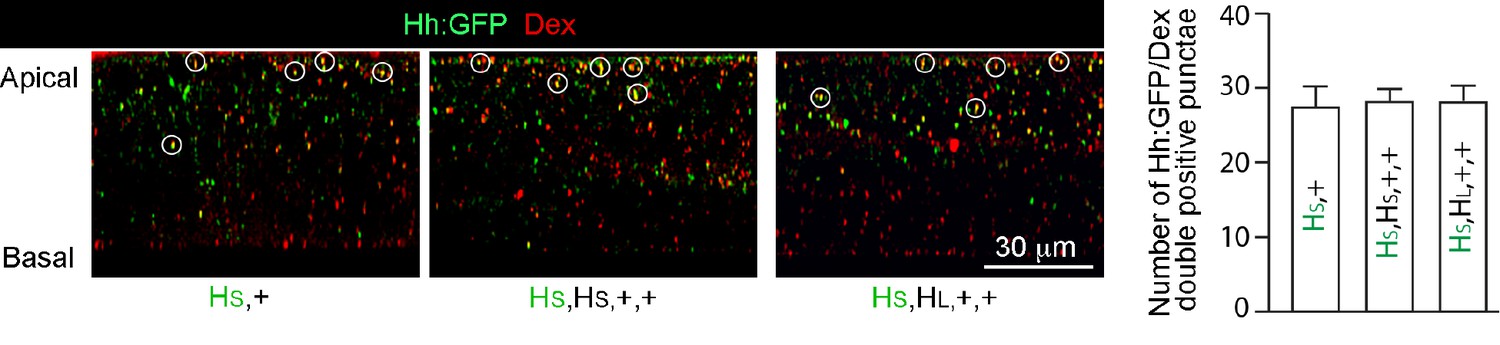
Dextran uptake in hh gene copy number genotypes.
Sagittal images from optical sections of wing discs with one Hh:GFP gene together with one, or three hh genes, following incubation with Red Dextran (MW 3000) and staining with α-GFP antibody. White circles indicate colocalization. Graph shows number of Hh:GFP/Dextran double-positive punctae for indicated genotypes.
-
Figure 2—figure supplement 3—source data 1
Amount of punctae with Hh:GFP and Dex.
- https://cdn.elifesciences.org/articles/71744/elife-71744-fig2-figsupp3-data1-v3.xlsx
Figure 3 with 1 supplement
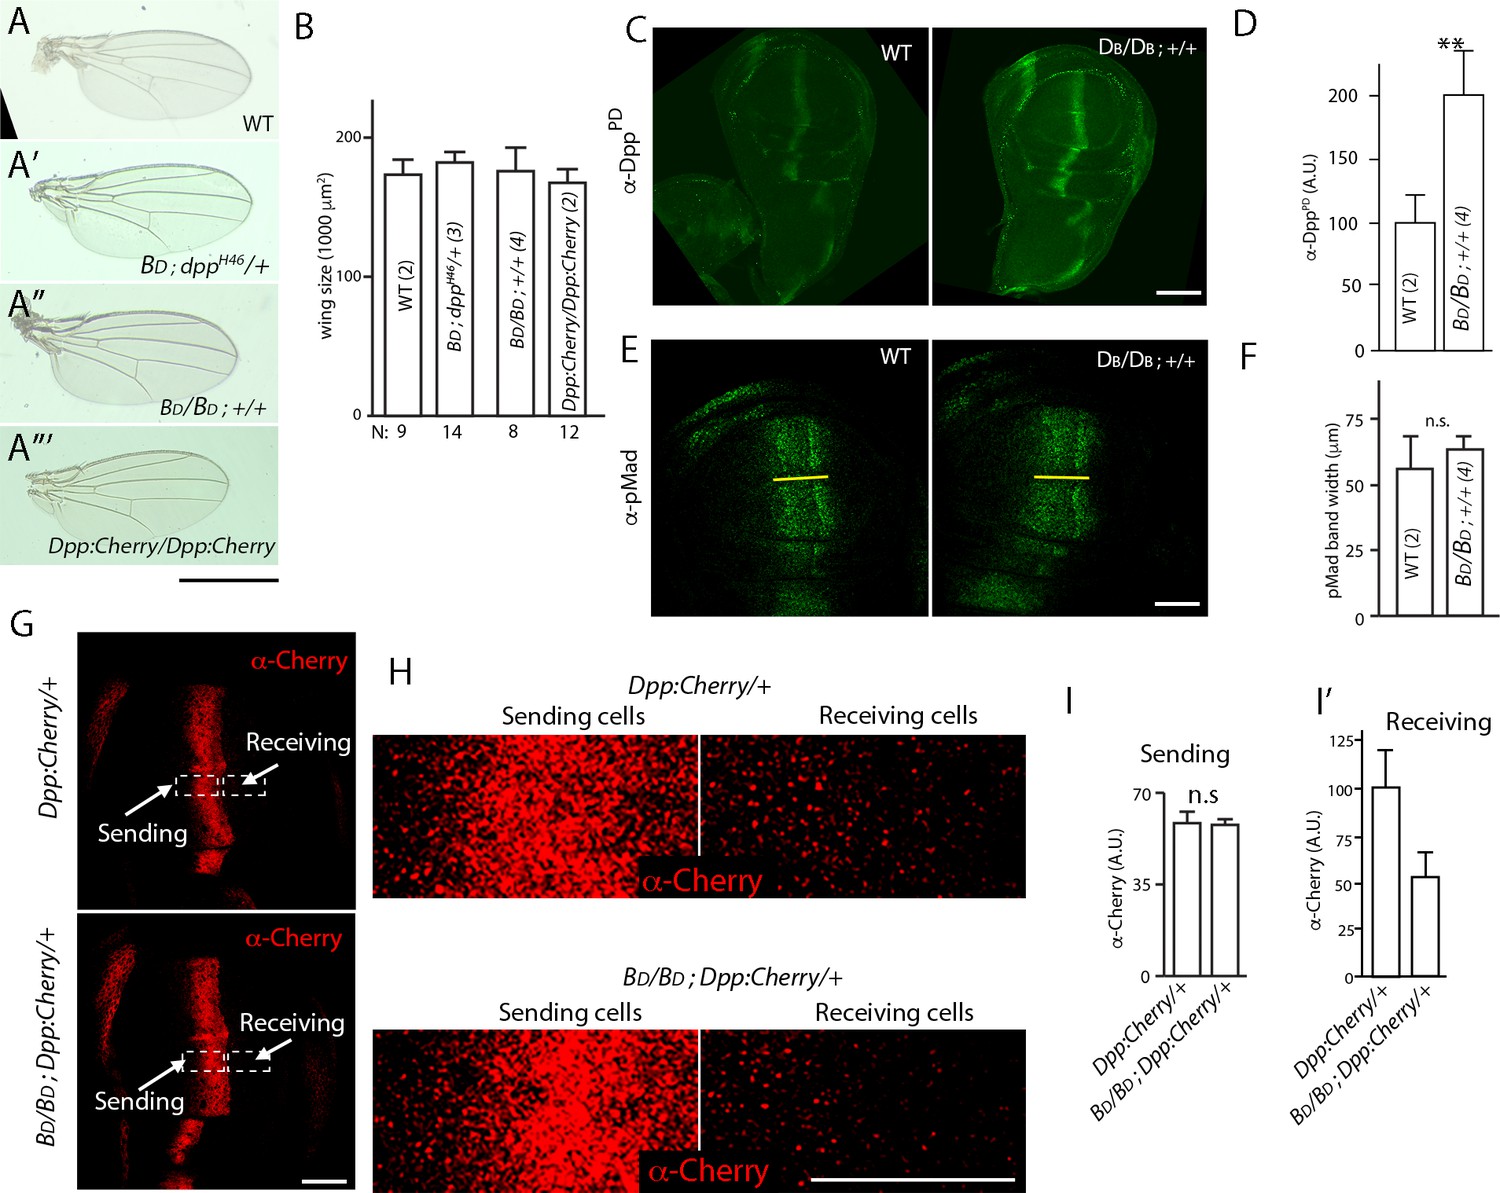
Dpp delivery and signal transduction are constant in conditions that vary amounts of Dpp production.
(A–A”’) Adult wings for indicated genotypes. Scale bar: 100 μm. (B) Bar graph showing size of adult wings for genotypes in (A–A”’); error bars indicate SD, N indicates number of wings analyzed; no statistically significant differences indicated by Student’s t-test (p>0.05). (C) Wing discs with two (WT) and four dpp genes: WT (+/+); four (BD/BD; +/+) stained with α-Dpp prodomain (α-DppPD) antibody; scale bar: 100 μm. (D) Bar graph quantifying α-DppPD antibody staining for wing discs with indicated genotypes, n=7 (two genes) and 8 (four genes). Difference is statistically significant (Student’s t-test [p<0.005]). (E) Images of wing discs with indicated genotypes stained with α-pMAD antibody; yellow line marks the width of pMAD band; scale bar: 50 μm. (F) Bar graph quantifying α-pMAD antibody staining for wing discs with indicated genotypes; n=7 (two genes) and 3 (four genes). No statistically significant differences indicated by Student’s t-test (p>0.05). (G) Wing discs with (upper panel) one untagged Dpp (+) and one Dpp:Cherry encoding gene, or (lower panel) three untagged Dpp and one Dpp:Cherry encoding gene stained with α-Cherry antibody; scale bar: 50 μm. (H) High magnification images of boxed regions in (G); scale bar: 25 μm. (I, I’) Bar graphs quantifying α-Cherry antibody staining in sending (I) and receiving regions (I’) for indicated genotypes; error bars indicate SD; (I) no statistically significant differences indicated by Student’s t-test (p>0.05); n=7 for each genotype. (I’) Difference is statistically significant (p<0.05). BD, Dpp-encoding BAC transgene; Dpp:Cherry, Dpp:Cherry knock-in allele.
-
Figure 3—source data 1
Wing size.
- https://cdn.elifesciences.org/articles/71744/elife-71744-fig3-data1-v3.xlsx
-
Figure 3—source data 2
Amount of Dpp.
- https://cdn.elifesciences.org/articles/71744/elife-71744-fig3-data2-v3.xlsx
-
Figure 3—source data 3
pMad band width.
- https://cdn.elifesciences.org/articles/71744/elife-71744-fig3-data3-v3.xlsx
-
Figure 3—source data 4
Amount of Dpp:Cherry (Sending).
- https://cdn.elifesciences.org/articles/71744/elife-71744-fig3-data4-v3.xlsx
Figure 3—figure supplement 1

Salm expression in dpp gene copy number genotypes.
Images of wing discs stained with α-Salm antibody. Anterior, left; posterior, right. Bar graph shows average width of the Salm band measured in the dashed yellow lined box, which is not statistically significant difference in the genotypes with two (WT) and four (BD/BD; +/+) dpp gene copies. N=8. Scale bar: 20 μm.
-
Figure 3—figure supplement 1—source data 1
Spalt band width.
- https://cdn.elifesciences.org/articles/71744/elife-71744-fig3-figsupp1-data1-v3.xlsx
Figure 4 with 1 supplement
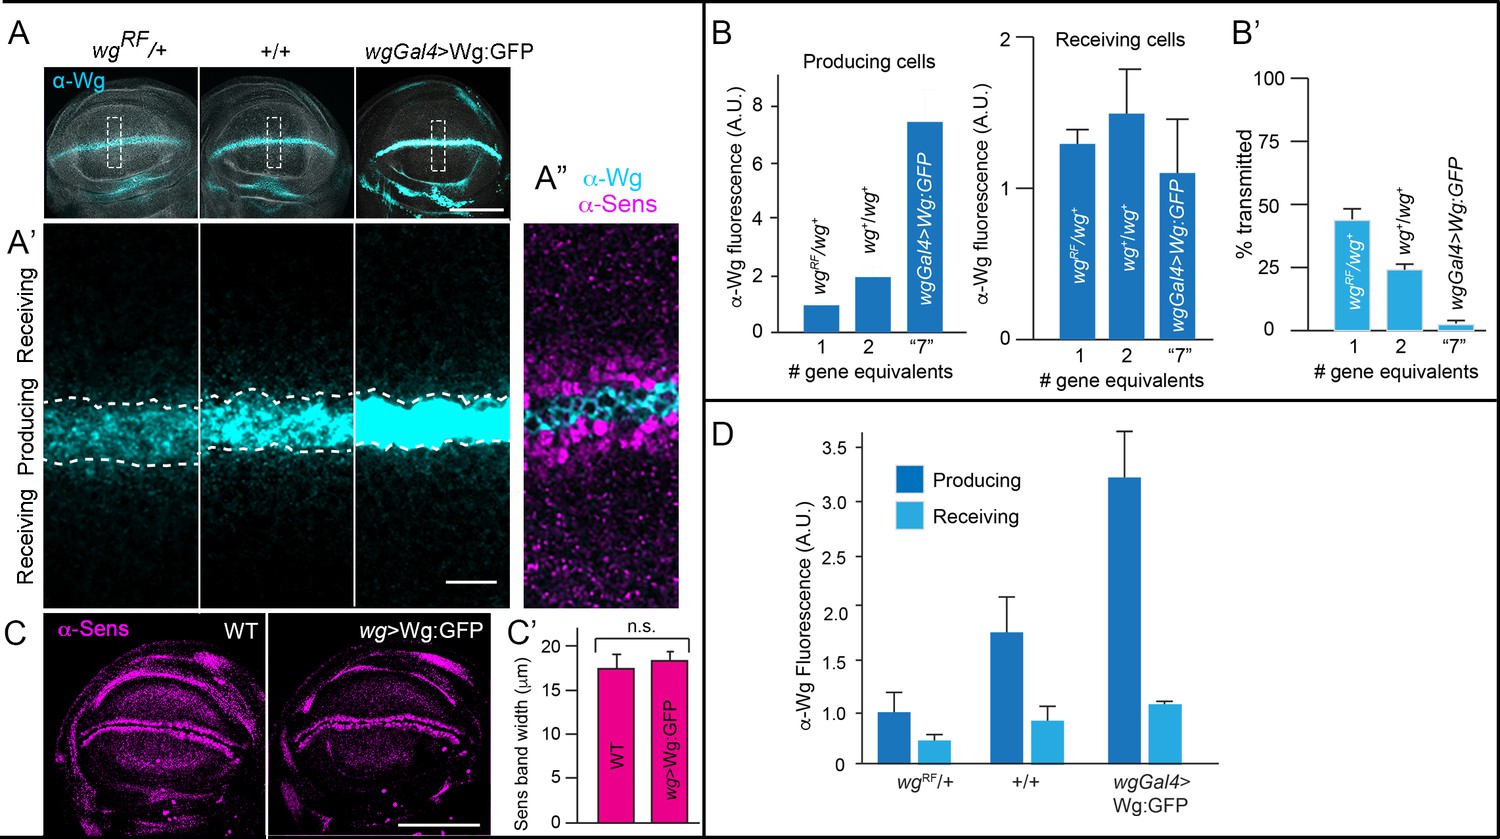
Wg signal transduction is constant in conditions that vary amounts of Wg production.
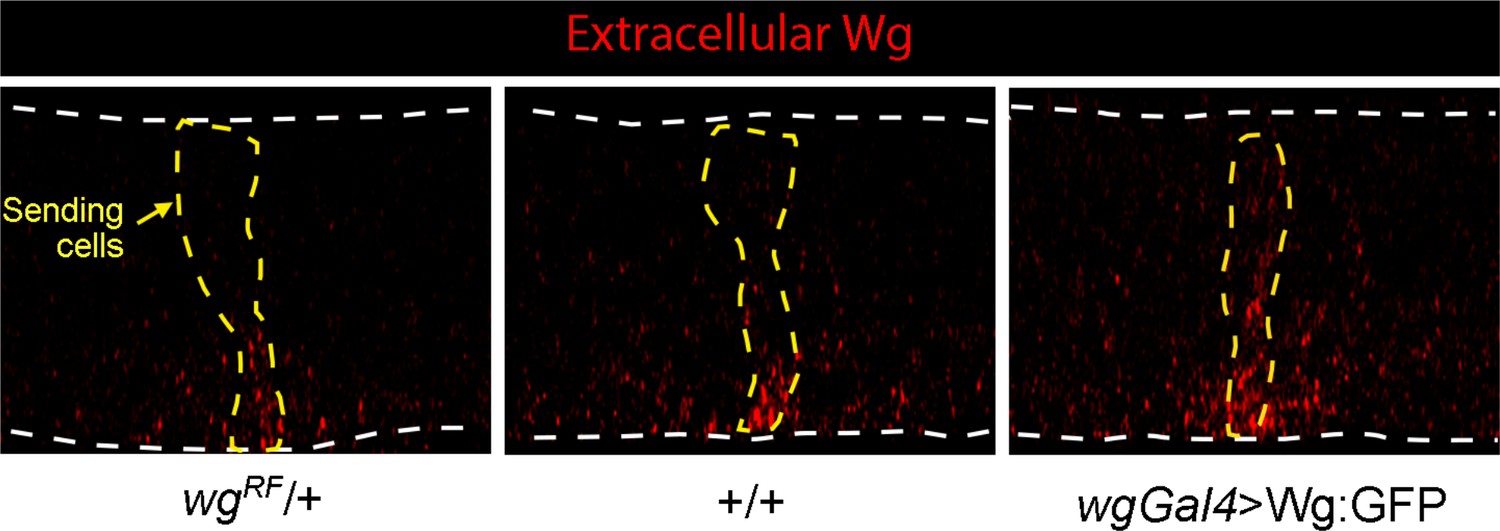
(A–A’) Wing blades for indicated genotypes stained with α-Wg antibody (cyan) and phalloidin (gray); one gene (wg−/+), two genes (+/+), overexpression (wgGal4>UAS-wg; +/+). Scale bar: 100 μm. (A’) higher magnification images of boxed regions (30 μm×90 μm) in (A), dashed white lines mark boundary between producing and receiving cells. Scale bar: 10 μm. (A’’) Optical section of region similar to (A’) stained with α-Wg (cyan) and α-Sens antibodies (magenta). (B) Bar graphs quantifying α-Wg staining for indicated genotypes; n=5–6 for each genotype. Values are normalized to the intensity of α-Wg staining for wgRF/wg+ (1 copy of wg gene). # gene equivalents indicate approximate Wg production functionality for each genotype. Difference in the producing cells is statistically significant (Student’s t-test [p<0.005]), while difference in the receiving cells is not (Student’s t-test [p>0.05]). (B’) Bar graph quantifies the fraction of Wg in the receiving cell as % of total wing blade α-Wg antibody intensity in receiving cell. Statistical significance indicated by p<0.0005. (C) Wing blades with two WT genes or Wg overexpression (wgGal4>UAS-Wg:GFP; +/+) stained with α-Sens antibody. Scale bar: 100 μm. (C’) Bar graph quantifies the width of α-Sens antibody stained band in maximum intensity projections of optical sections for entire apical-basal depth; 10 length measures were taken for each disc; no statistically significant differences (p>0.05); n=4 for each genotype. Genotypes: wg−/+ (wgRF/+); +/+ (WT); wg-Gal4>wg (wg-Gal4; UAS-Wg:GFP / +/+).
-
Figure 4—source data 1
Amounts of Wg.
- https://cdn.elifesciences.org/articles/71744/elife-71744-fig4-data1-v3.xlsx
-
Figure 4—source data 2
Sens band width.
- https://cdn.elifesciences.org/articles/71744/elife-71744-fig4-data2-v3.xlsx
-
Figure 4—source data 3
Amounts of extracellular Wg.
- https://cdn.elifesciences.org/articles/71744/elife-71744-fig4-data3-v3.xlsx
Figure 4—figure supplement 1
Dll expression in hh gene copy number genotypes.
(A) Images of wing discs stained with α-Dll antibody. Anterior, left; posterior, right; dorsal down. (B) Schematic showing location of region analyzed for fluorescence intensity. (C) Fluorescence intensity profiles for the genotypes with 1 (wgRF/+), 2 (+/+), and transgene (wgGal4>Wg:GFP) wg genes. N=5–7.
Figure 5
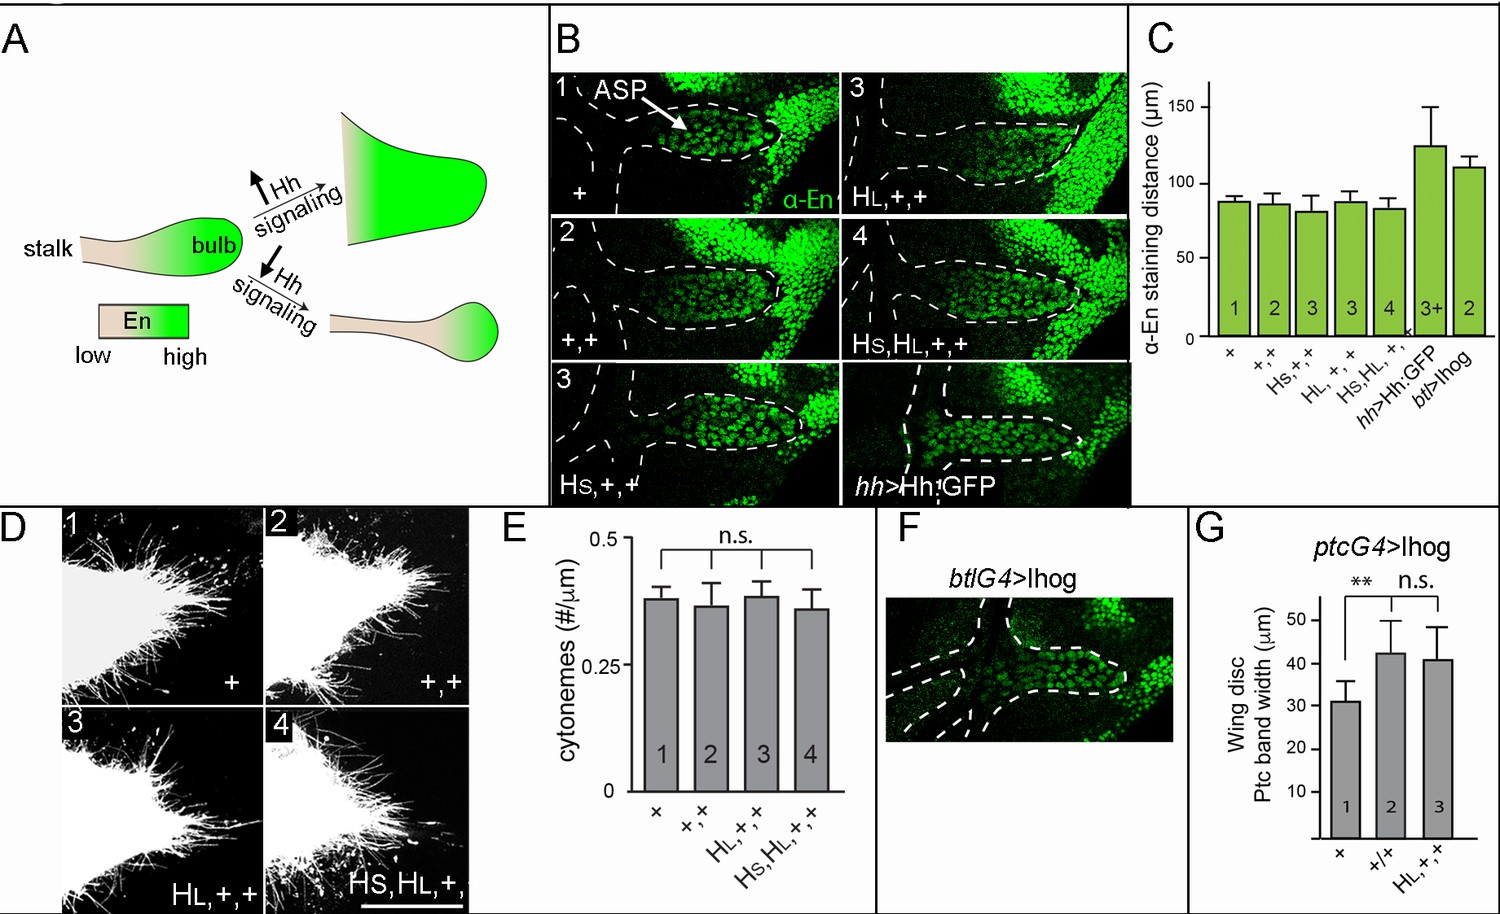
Neither signal transduction nor cytoneme number scales with Hh production in the ASP.
(A) Schematic showing En expression (green) in WT ASP (left), ASP with high levels of Hh signal transduction and no stalk (top right), or ASP with low levels of Hh signal transduction and elongated stalk (bottom right). (B) α-En staining (green) of ASPs (bulb within white dashed line) for indicated genotypes (number of hh genes indicated in upper left). (C) Bar graph quantifying the distance of α-En antibody staining from the tip of the ASP toward the stalk for indicated genotypes (numbers of genes indicated in bars); no statistically significant differences indicated by p>0.05, n=5–7 for each genotype. (D) Cytonemes marked by the expression of Cherry:CAAX (btl-lexA>lexO-Cherry:CAAX) in the ASP for indicated genotypes (number of genes indicated in upper left). (E) Number of cytonemes for indicated genotypes (number of genes indicated in bars). Statistically significant differences indicated by p>0.05, n=5 for each genotype. (F) Ectopic overexpression of Ihog in the ASP reduced the stalk and increased extent of α-En staining (green). (G) Width of α-Ptc staining band in the wing discs ectopically overexpressing Ihog in the indicated genotypes; differences between 1 and 2 hh copies statistically significant (p<0.05). Abbreviations as in Figure 1.
-
Figure 5—source data 1
Cytoneme density.
- https://cdn.elifesciences.org/articles/71744/elife-71744-fig5-data1-v3.xlsx
-
Figure 5—source data 2
Ptc band width.
- https://cdn.elifesciences.org/articles/71744/elife-71744-fig5-data2-v3.xlsx
Figure 6
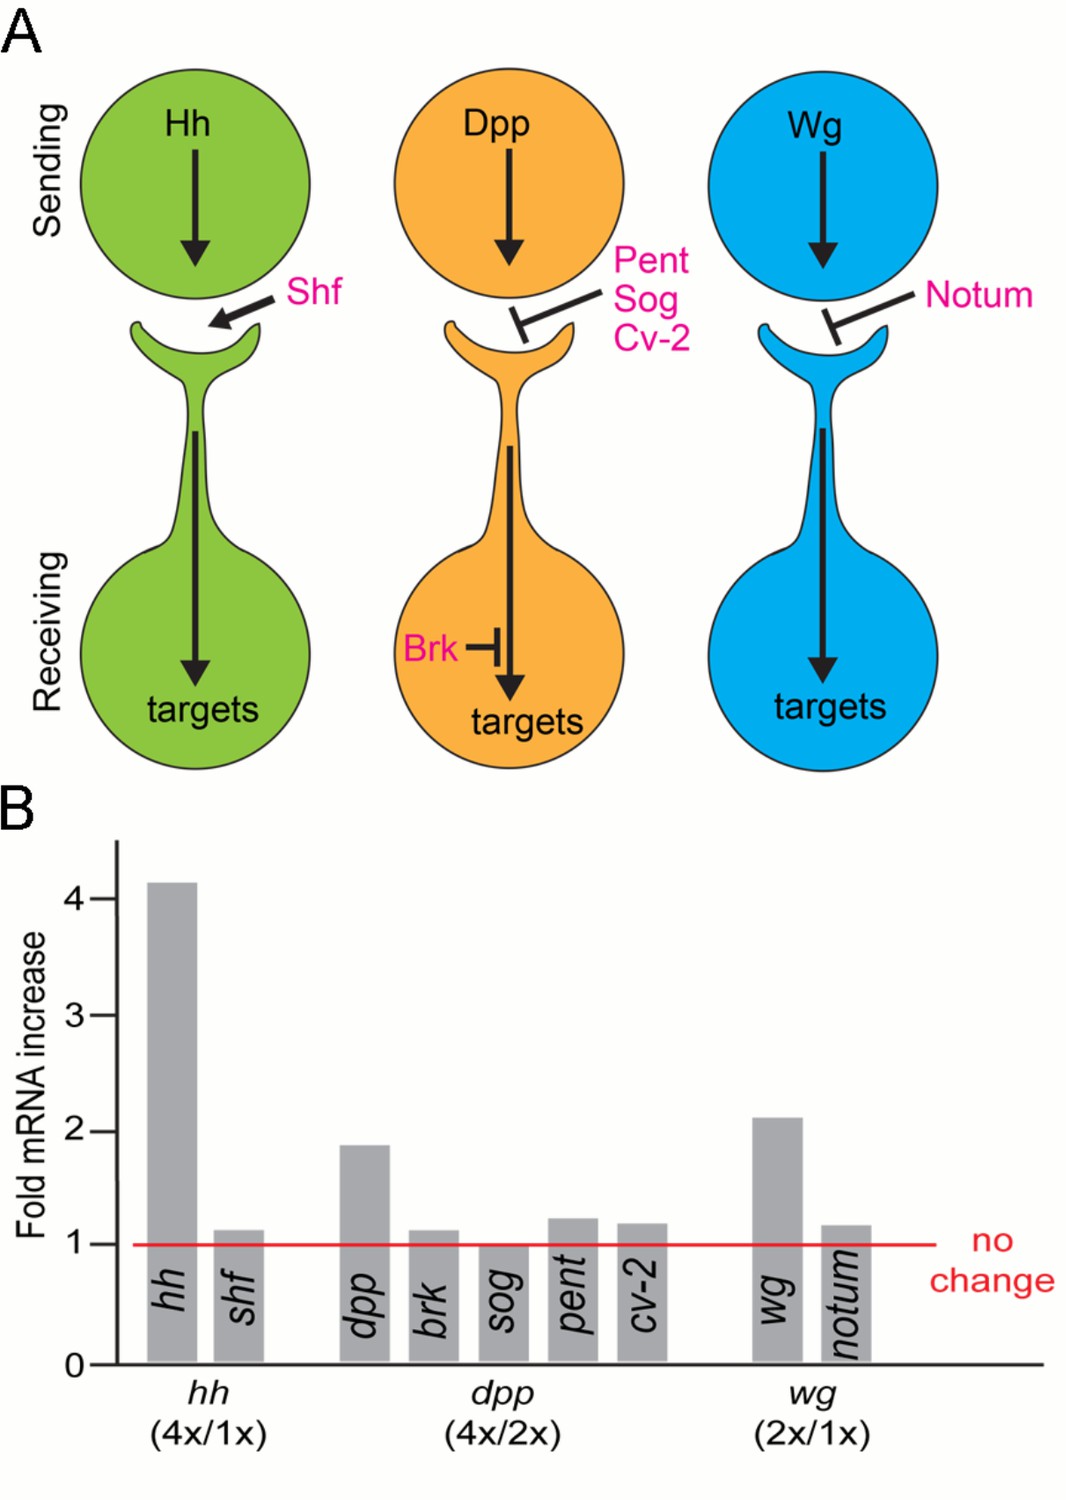
Expression of morphogen signaling modulators is not affected by varying amounts of morphogen production.
(A) Schematic showing where morphogen signaling modulators are predicted to function in the context of cytoneme-mediated exchange. Shf, an extracellular factor that facilitates Hh dispersion; Pent, Sog, and Cv-2, extracellular inhibitors of Dpp signaling; Brk, a transcriptional repressor of Dpp signal transduction; Notum, an extracellular inhibitor of Wg signaling. (B) Bar graph showing the levels of morphogen signaling modulator mRNA as determined by qPCR. Bars represent the ratio between the change in mRNA levels relative to predicted RNA increase that scales with gene copy.
-
Figure 6—source data 1
Relative mRNA amounts.
- https://cdn.elifesciences.org/articles/71744/elife-71744-fig6-data1-v3.xlsx
Figure 7 with 1 supplement
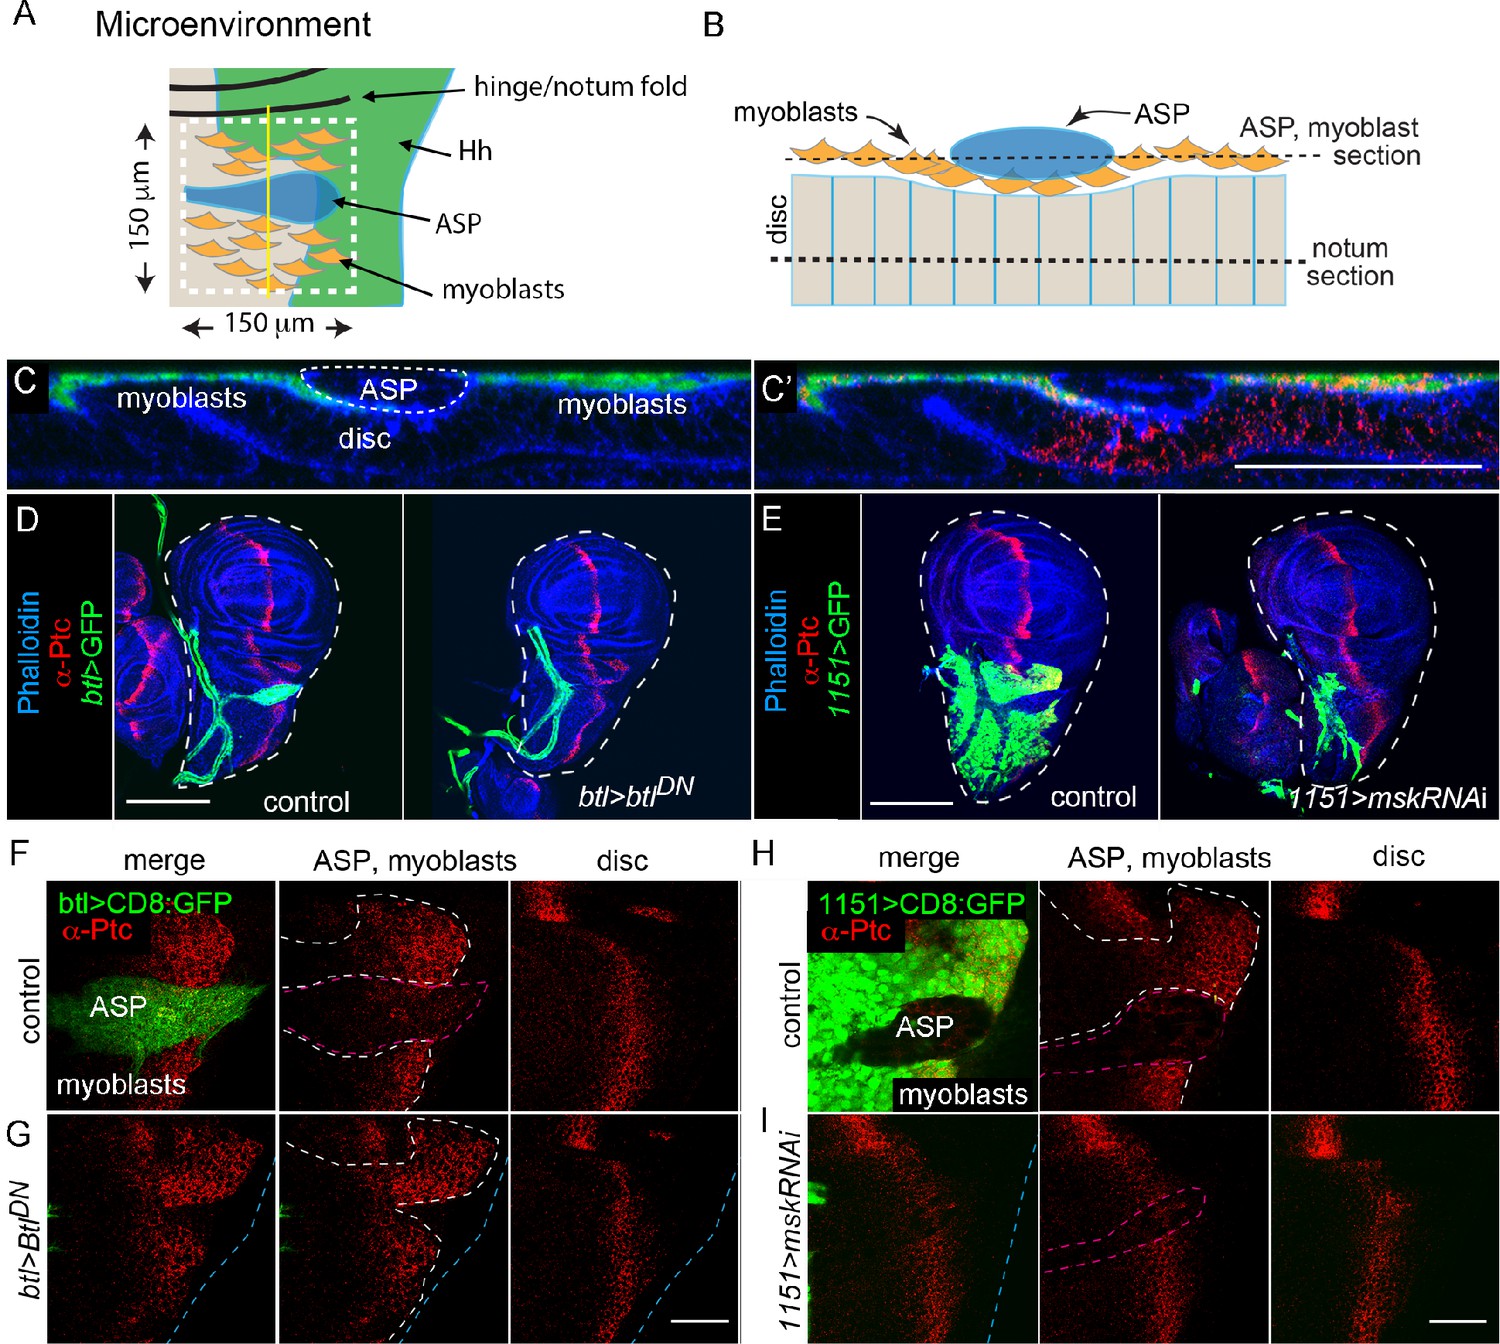
Hh distributions in the ASP, myoblast, and the notum primordium are not inter-dependent.
(A) Schematic showing the microenvironment (white dashed line) in the notum primordium with myoblasts (orange), ASP (blue), Hh-expressing notum cells (green), and notum A compartment (beige). (B) Schematic showing cross-section of the microenvironment at the yellow line in (A). (C) Confocal image of the cross-section shown in (B); myoblasts (green), phalloidin staining (blue), and α-Ptc staining (red). Scale bar: 50 μm. (D) Wing discs stained with α-Ptc antibody (red) and phalloidin (blue) for control genotype (WT) and (E) ASP ablation genotype (btl-Gal4>BtlDN); trachea and ASP marked by CD8:GFP (green) driven by btl-Gal4. Scale bar: 100 μm. (F) α-Ptc staining (red) of the microenvironment for control genotype (WT, ASP marked by CD8:GFP [green] driven by btl-Gal4; outlined by red dashed line in middle panel) and (G) ASP ablation genotype (btl-Gal4>BtlDN); white dashed lines surround myoblasts, blue dashed lines indicate the notum primordium. (H, I) Similar to (F, G) but with myoblast ablation; myoblasts marked CD8:GFP (green), ablated by knockdown of msk (1151-Gal4>mskRNAi). Scale bar: 50 μm. Genotypes: (C) 1151-Gal4/+; UAS-CD8:GFP/+; (F, G) control (btl-Gal4 UAS-CD8:GFP/+); btl>BtlDN (btl-Gal4 UAS-CD8:GFP/UAS-BtlDN); (H, I) control (1151-Gal4/+; UAS-CD8:GFP/+; 1151>mskRNAi [1151-Gal4/+; UAS-CD8:GFP/UAS-mskRNAi]).
Figure 7—figure supplement 1
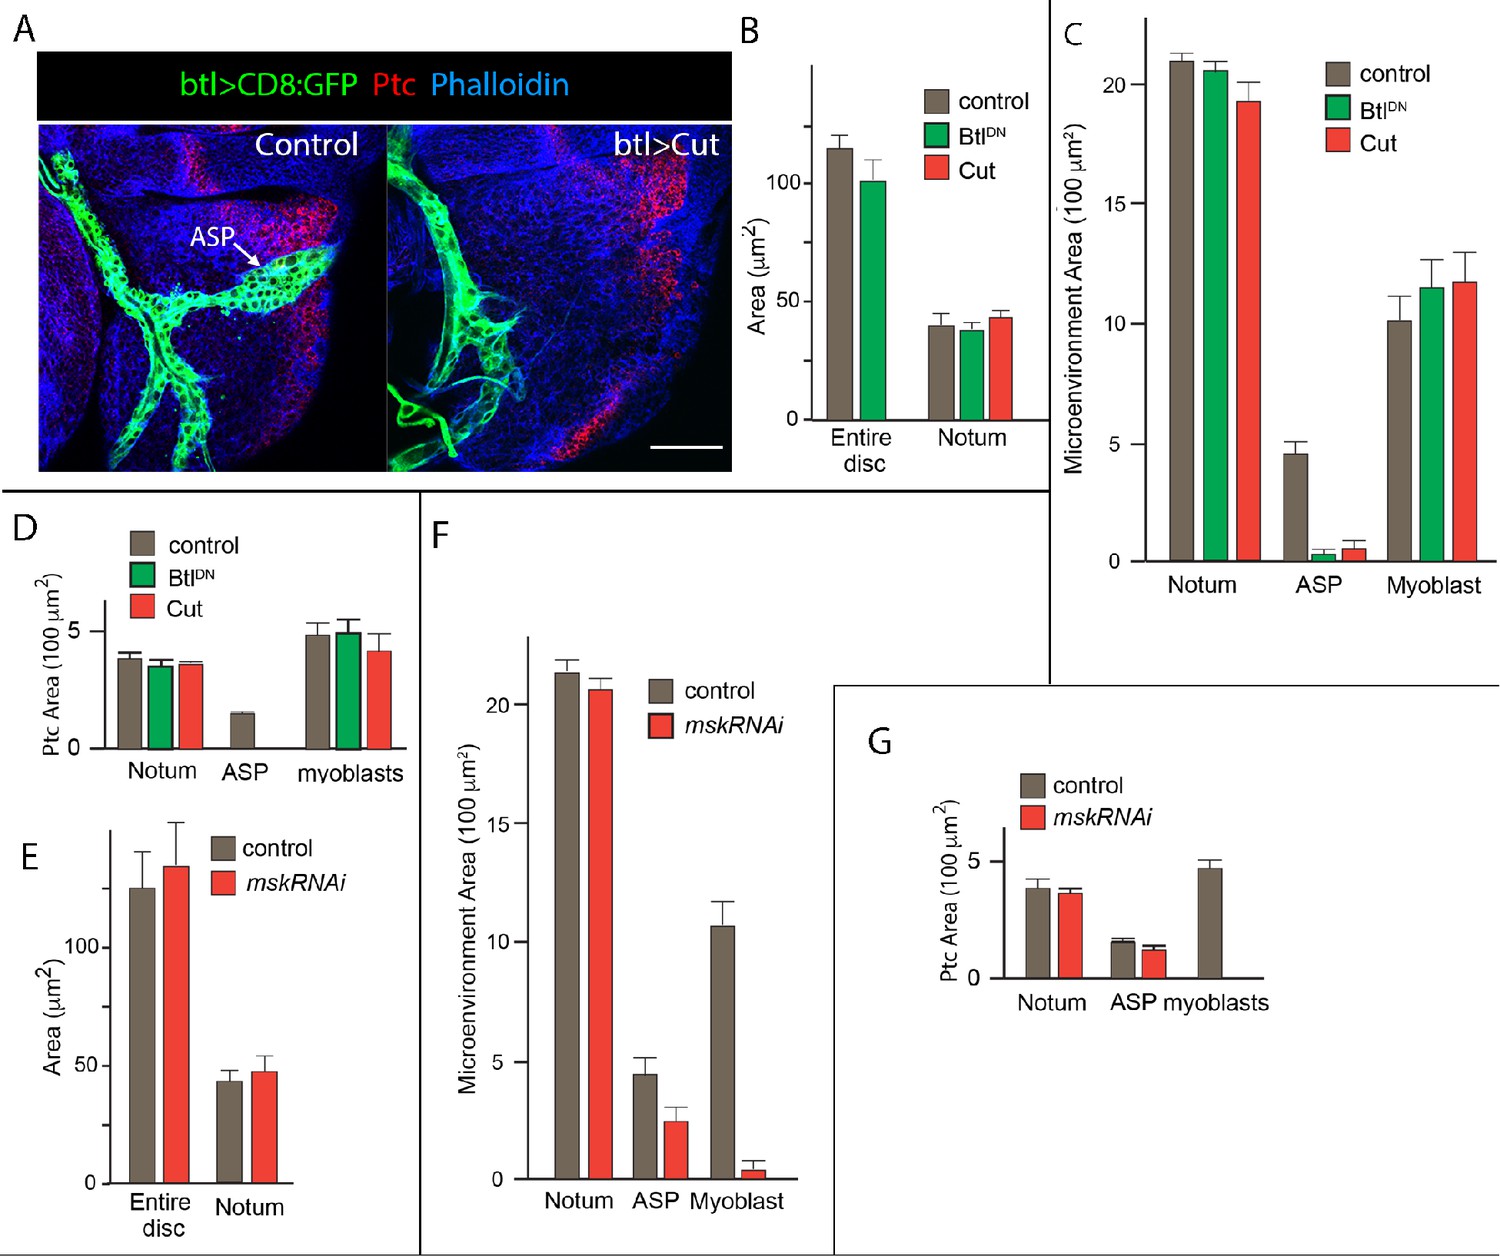
Unchanged size of wing disc with ablation of ASP or myoblasts.
(A) Notum primordium stained with α-Ptc antibody (red) and phalloidin (blue), with trachea and ASP marked by CD8:GFP (green) driven by btl-Gal4; control genotype (WT), ASP ablation genotype (btl-Gal4>Cut). Scale bar: 50 μm. (B) Bar graph quantifying the size of the entire wing disc and notum primordium in control genotype (btl-Gal4/+) and in ASP ablation genotypes (btl>BtlDN and btl>Cut). Units for the area are in 100 μm2. Differences not statistically significant (Student’s t-test [p>0.05]). (C) Same as (B) but comparing microenvironment size in control (btl-Gal4/+) and myoblast ablation (btl>mskRNAi−) genotypes. Notum and myoblast size differences not statistically significant (Student’s t-test [p>0.05]); ASP size differences are statistically significant (Student’s t-test [p<0.05]). (D) Comparison of area of Ptc expression in control and ASP ablation genotypes. Notum size differences not statistically significant (Student’s t-test [p>0.05]); ASP and myoblast size differences are statistically significant (Student’s t-test [p<0.05]). (E) Comparison of size of entire disc and notum in control and myoblast ablation genotypes. Differences not statistically significant (Student’s t-test [p>0.05]). (F) Comparison of size of microenvironment in control and myoblast ablation genotypes. Differences in the area of Ptc expression in the Notum not statistically significant. (G) Comparison of area of Ptc expression in control and myoblast ablation genotypes. Differences in the area of Ptc expression in the Notum and ASP not statistically significant.
Figure 8
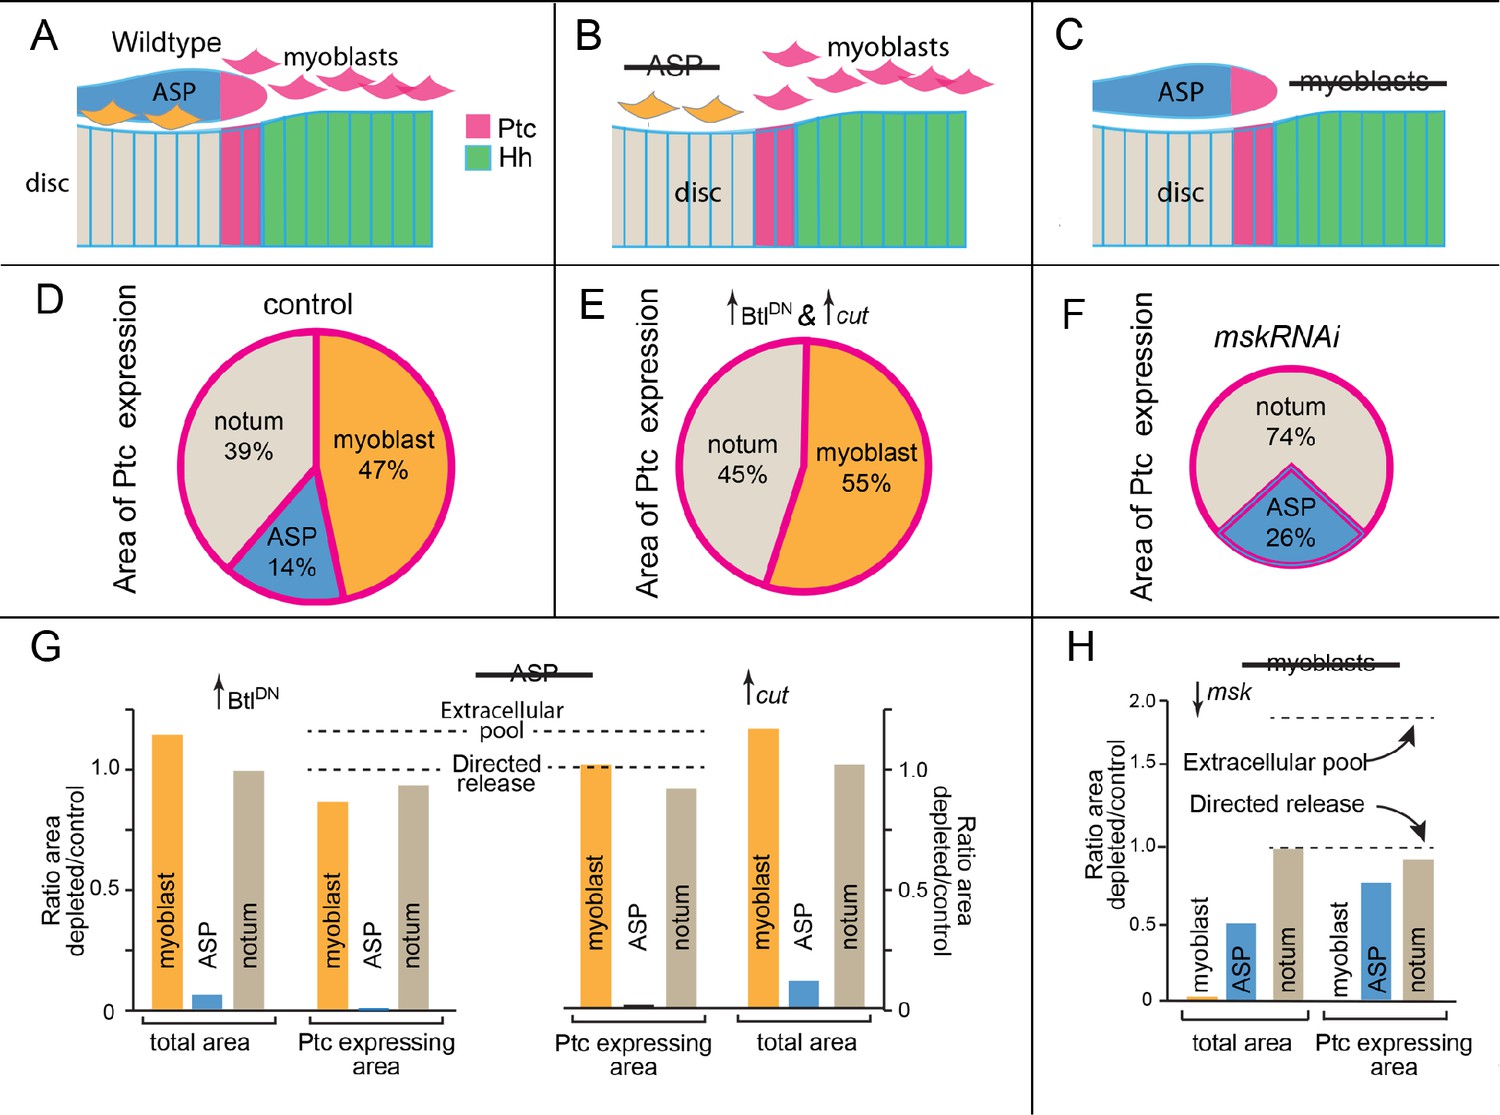
Hh signaling in the notum microenvironment.
(A–C) Cartoons depicting Hh-expressing (green) and Ptc-expressing cells (pink) in microenvironment of (A) control (wildtype), (B) no ASP (btlG4>BtlDN and btlG4>Cut), and (C) no myoblasts (1141G4>mskRNAi). (D–F) Pie graphs depicting the fraction of microenvironment that expresses Ptc in control (D), no ASP (E), and no myoblasts (F) genotypes. (G, H) Bar graphs quantifying total area and Ptc-expressing areas of myoblasts, ASP, notum (total) in control (WT) and ASP-ablation genotype (btl-Gal4>BtlDN); n=5 and 4 (control and ASP ablation, respectively). Dashed lines indicate predicted changes in Ptc-expressing area under extracellular pool model of dispersion or directed release model of dispersion. (H) Similar to (G) but with the myoblasts depleted by the expression of mskRNAi in the myoblasts (1141Gal4>mskRNAi); n=5.
Tables
Key resources table
| Reagent type (species) or resource | Designation | Source or reference | Identifiers | Additional information |
|---|---|---|---|---|
| Cell line (Drosophila) | hhac | Lee et al., 1992 | ||
| Cell line (Drosophila) | dppH46 | Irish and Gelbart, 1987 | ||
| Cell line (Drosophila) | wgRF | Pérez-Garijo et al., 2009 | ||
| Transfected construct | 40k Hh BAC | Chen et al., 2017 | ||
| Transfected construct | 40k Hh:GFP BAC | Chen et al., 2017 | ||
| Transfected construct | 100k Hh BAC | Chen et al., 2017 | ||
| Transfected construct | Dpp BAC | this study | ||
| Transfected construct | Dpp:Cherry | Fereres et al., 2019 | ||
| Transfected construct | wg-Gal4 | Giráldez et al., 2002 | ||
| Transfected construct | 1151-Gal4 | Roy and Vijay Raghavan, 1997 | ||
| Transfected construct | UAS-Wg:GFP | Pfeiffer et al., 2002 | ||
| Transfected construct | UAS-mCD8:GFP | Roy et al., 2011 | ||
| Transfected construct | btl-LHG | Roy et al., 2014 | ||
| Transfected construct | lexO-Cherry:CAAX | from Konrad Basler | ||
| Transfected construct | UAS-Cut | Hardiman et al., 2002 | ||
| Transfected construct | UAS-btlDN | Reichman-Fried and Shilo, 1995 | ||
| Transfected construct | UAS-mskRNAi | Bloomington Drosophila Stock Center | #27572 | |
| Antibody | α-Ptc | DSHB, Apa1 | 1/500 | |
| Antibody | α-Hh | from Phillip Ingham | 1/500 | |
| Antibody | α-GFP | Roche | #11814460001 | 1/500; 2/500 for extracellular staining |
| Antibody | α-Dpp-Prodomain | Akiyama and Gibson, 2015 | 1/500 | |
| Antibody | α-RFP | Rockland | #:600-401-379 | 1/500 |
| Antibody | α-Wg | DSHB, 4D4 | 1/500; 3/500 for extracellular staining | |
| Antibody | α-Sens | Nolo et al., 2000 | 01/00 | |
| Antibody | α-En | DSHB, 4D9 | 01/25 | |
| Antibody | α-Knot | Crozatier and Vincent, 1999 | 1/500 | |
| Antibody | α-Salm | Zhang et al., 2011 | 1/500 | |
| Antibody | α-Dll | McKay et al., 2009 | 1/500 | |
| Antibody | goat α-mouse IgG, Alexa Fluor 488 | Invitrogen | A-11001 | 1/500 |
| Antibody | goat α-mouse IgG, Alexa Fluor 555 | Invitrogen | A-21422 | 1/500 |
| Antibody | goat α-rabbit IgG, Alexa Fluor 488 | Invitrogen | A-11008 | 1/500 |
| Antibody | goat α-rabbit IgG, Alexa Fluor 555 | Invitrogen | A-21428 | 1/500 |
| Antibody | goat α-rat IgG, Alexa Fluor 555 | Invitrogen | A-21434 | 1/500 |
| Antibody | goat α-rat IgG, Alexa Fluor 488 | Invitrogen | A-11006 | 1/500 |
| Other | Vectashield Antifade Mounting Medium | Vector Laboratories | H-1000-10 |
Additional files
Download links
A two-part list of links to download the article, or parts of the article, in various formats.
Downloads (link to download the article as PDF)
Open citations (links to open the citations from this article in various online reference manager services)
Cite this article (links to download the citations from this article in formats compatible with various reference manager tools)
Regulated delivery controls Drosophila Hedgehog, Wingless, and Decapentaplegic signaling
eLife 10:e71744.
https://doi.org/10.7554/eLife.71744


