Fitness effects of CRISPR endonucleases in Drosophila melanogaster populations
- Department of Computational Biology, Cornell University, United States
- Institut für Populationsgenetik, Vetmeduni Vienna, Austria
- Vienna Graduate School of Population Genetics, Vetmeduni Vienna, Austria
- Department of Molecular Biology and Genetics, Cornell University, United States
- Center for Bioinformatics, School of Life Sciences, Peking-Tsinghua Center for Life Sciences, Peking University, China
Figures
Figure 1
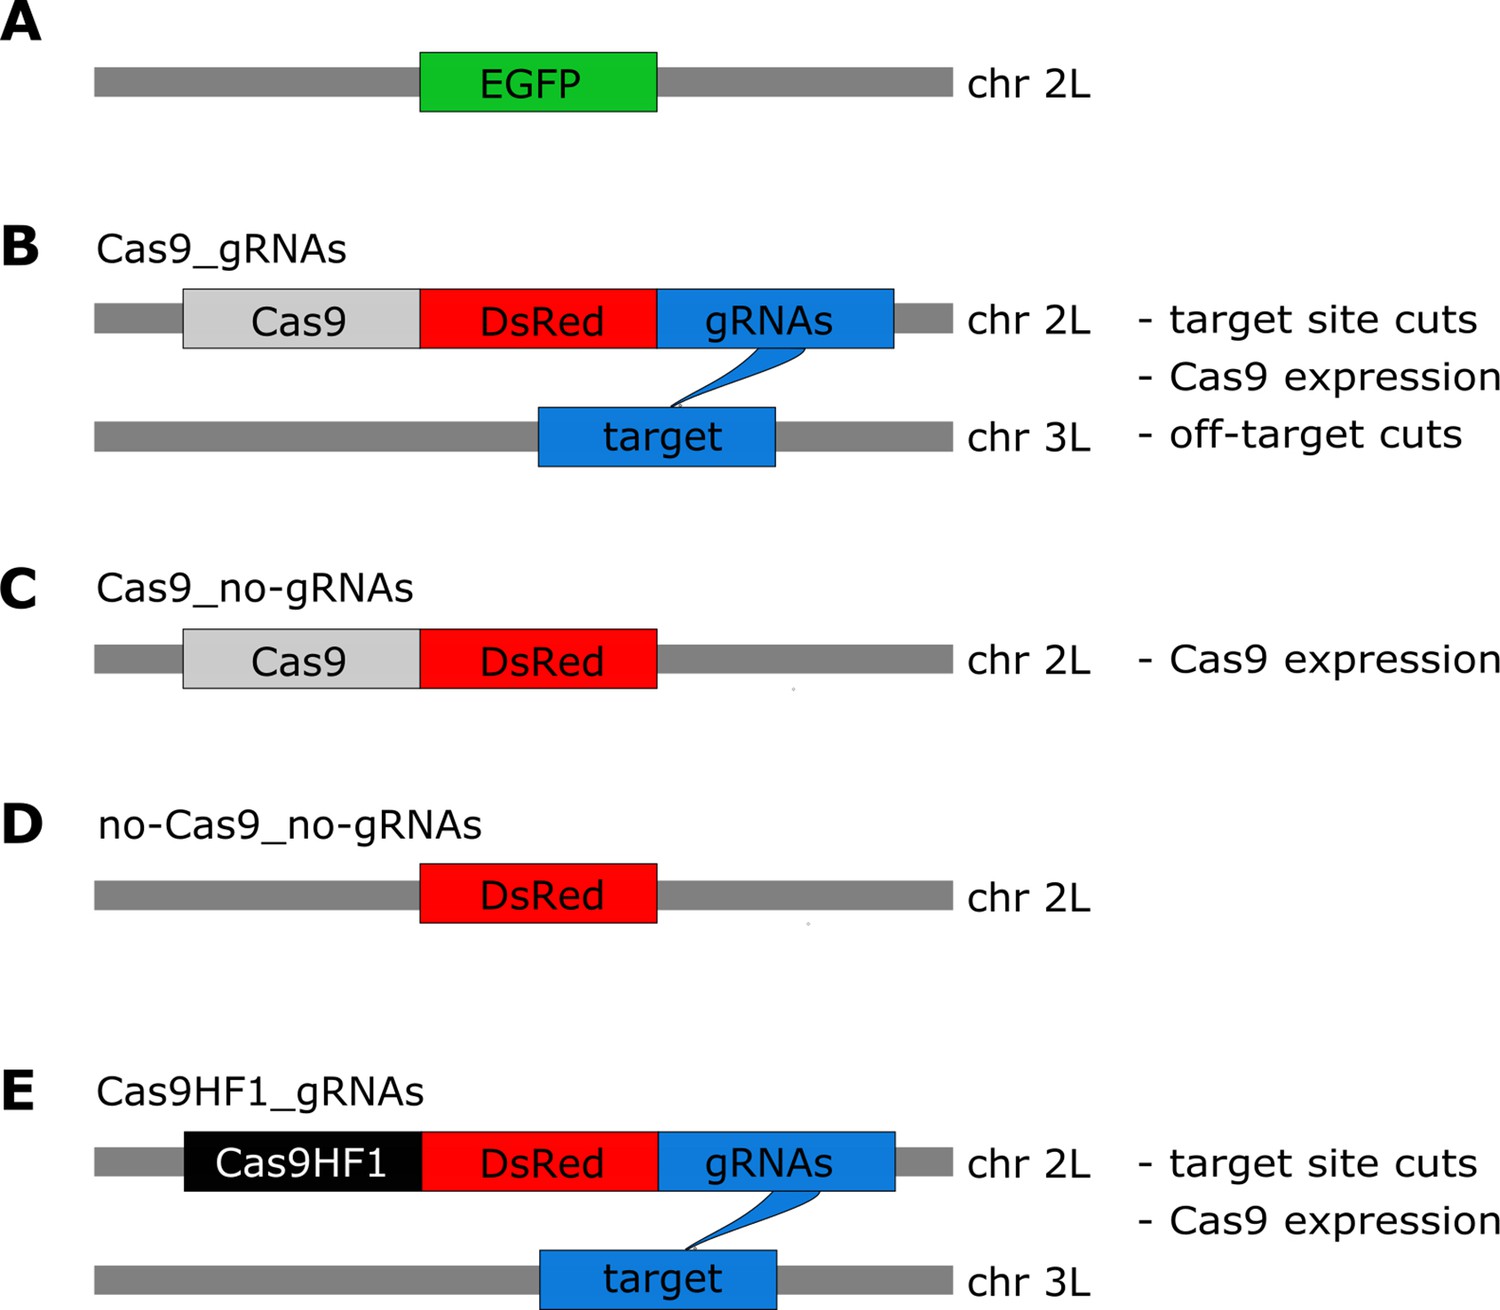
Overview of constructs and the potential types of fitness costs in the four constructs.
(A) The starting point for our constructs is an EGFP marker inserted into chromosome 2 L (~20.4 Mb). The four constructs are then inserted into this EGFP locus (thereby disrupting EGFP). (B) The Cas9_gRNAs construct contains Cas9, DsRed, and gRNAs. The gRNAs target chromosome 3 L (~18.3 Mb), instead of the sister chromatid. (C) The Cas9_no-gRNAs construct carries Cas9 and DsRed, but no gRNAs are expressed. (D) The no-Cas9_no-gRNAs construct carries only the fluorescent marker DsRed. (E) The Cas9HF1_gRNAs construct has the same structure as Cas9_gRNAs but carries Cas9HF1 instead of Cas9.
Figure 2 with 1 supplement

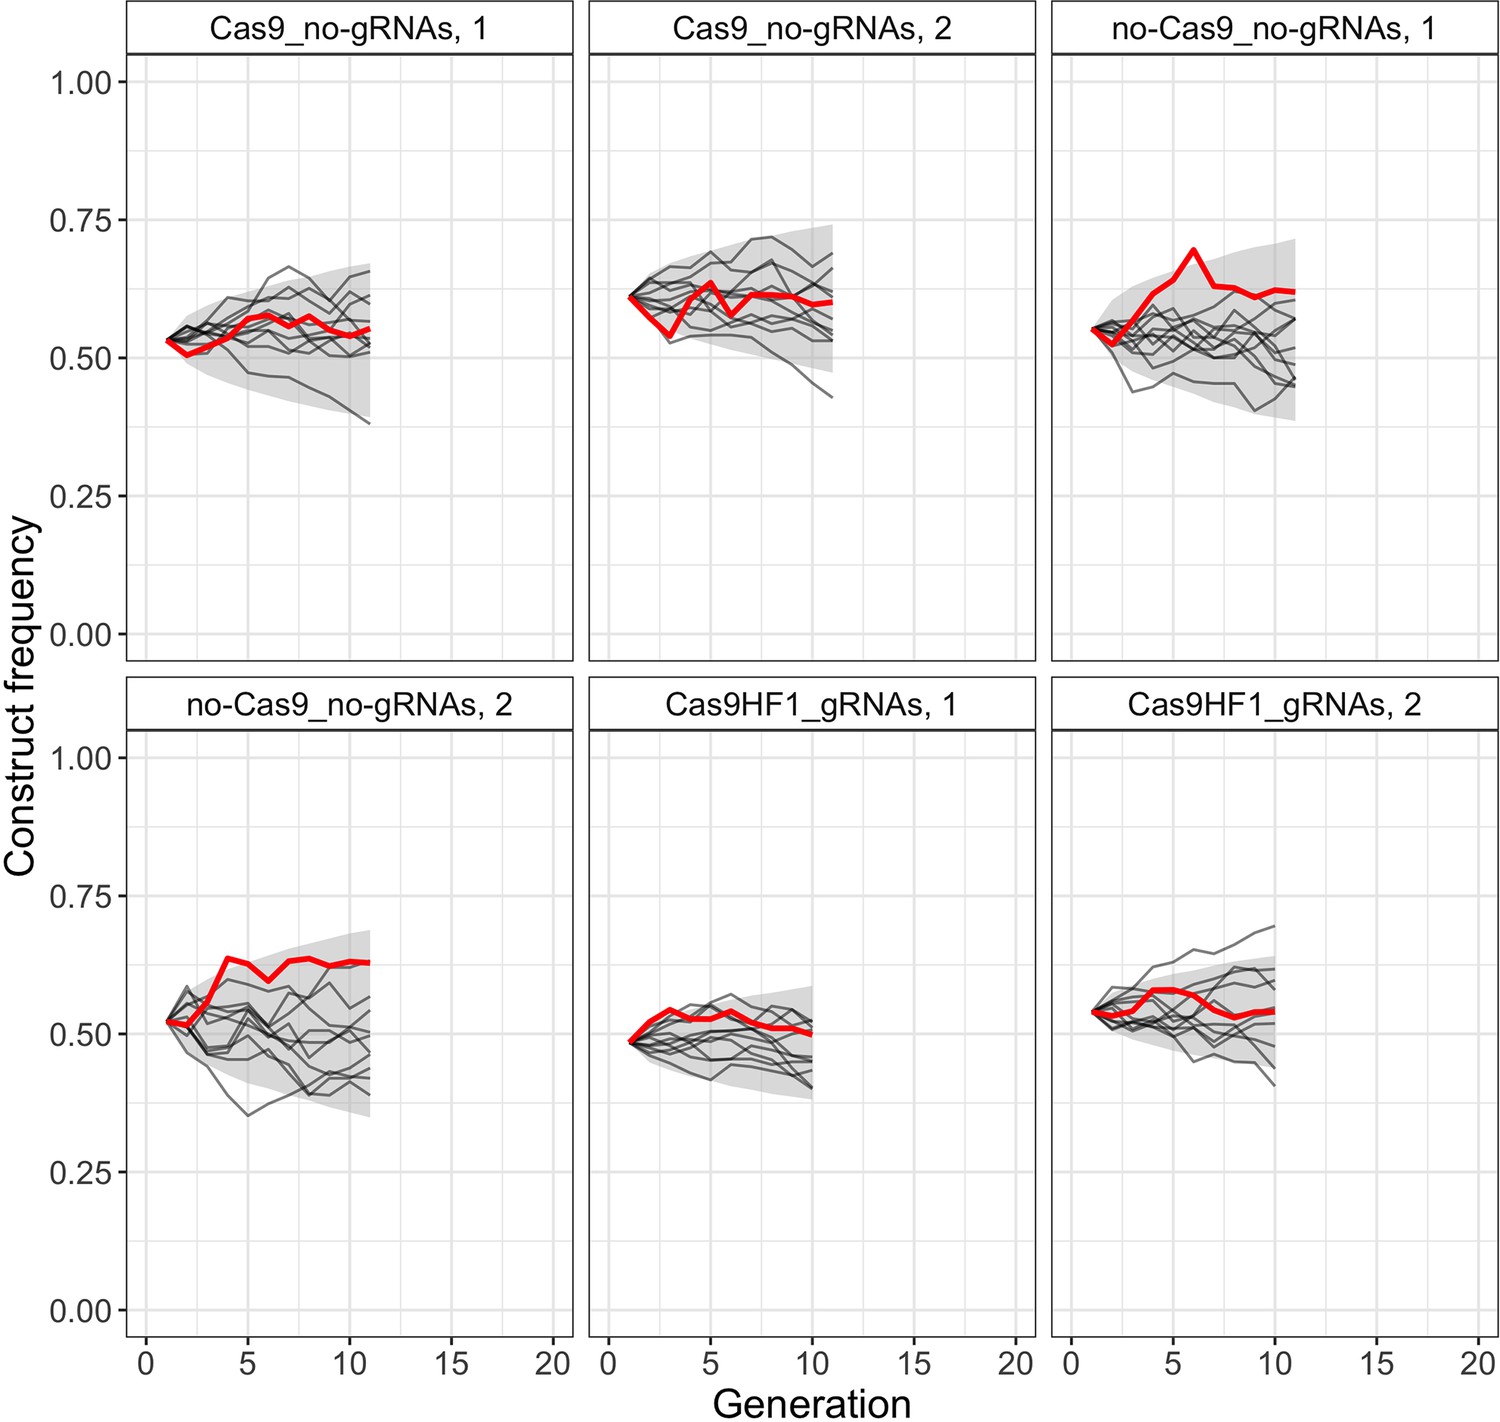
Construct frequency trajectories in the cage populations.
Each line is one cage experiment. To obtain construct frequencies, we screened all adult flies for each generation in the respective cage experiments (see Figure 2—figure supplement 1 for population sizes).
Figure 2—figure supplement 1
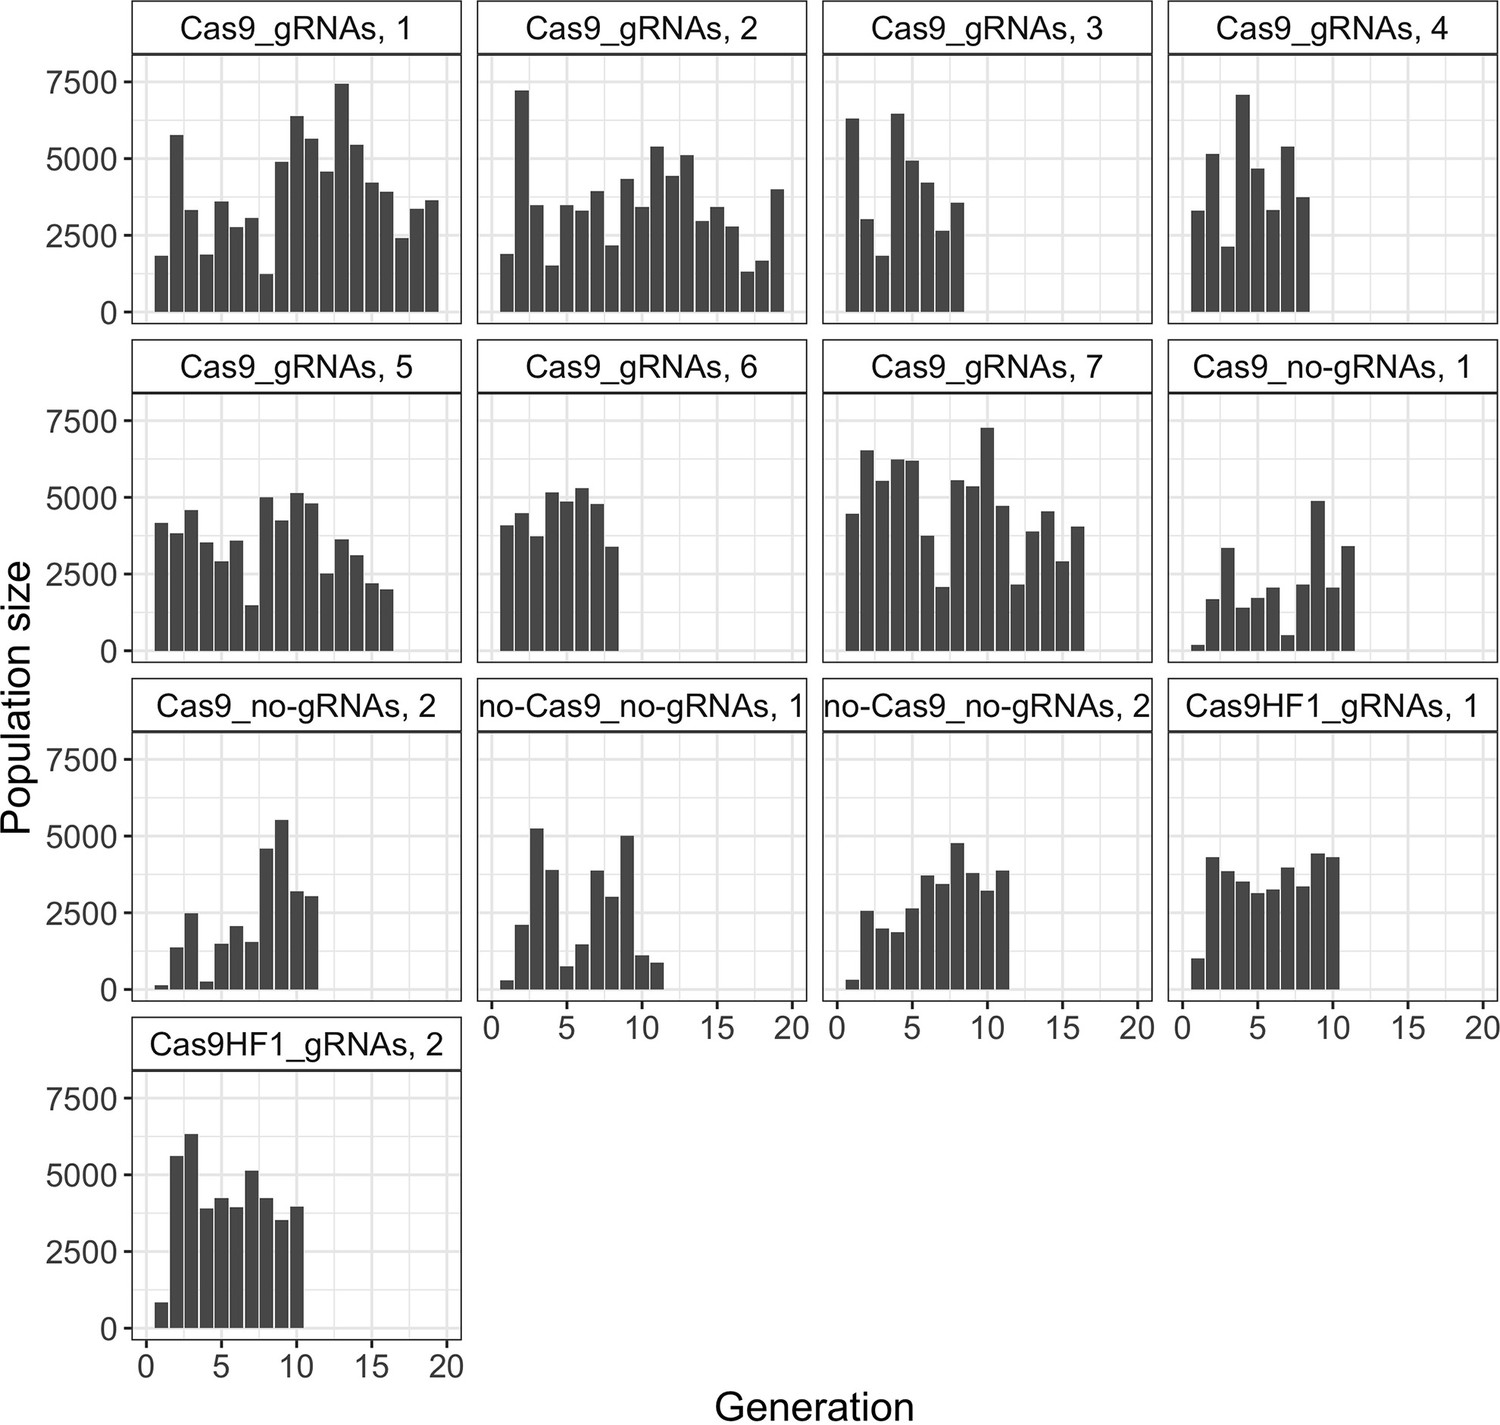
Population sizes of all D. melanogaster cage populations.
Figure 3 with 2 supplements
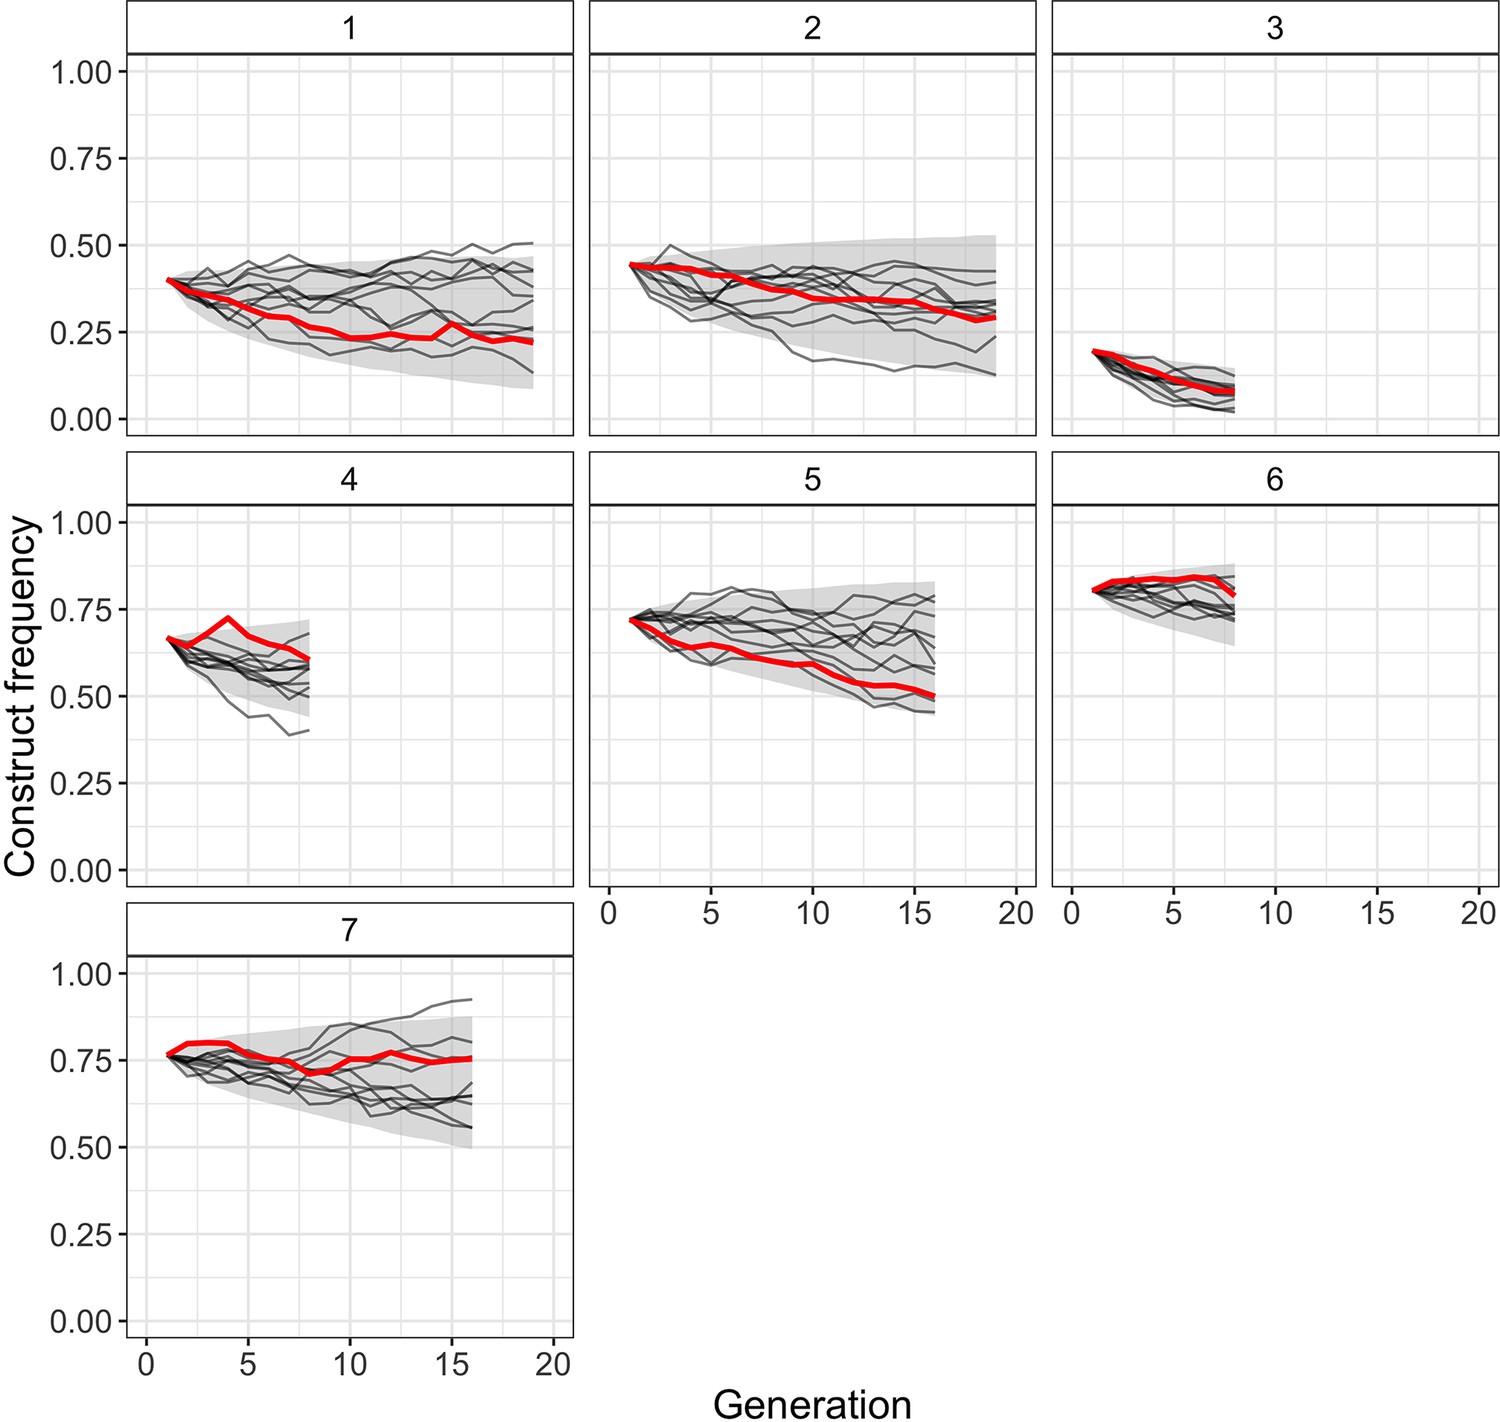
Comparison of observed Cas9_gRNAs construct frequencies with simulated trajectories of the full model with viability selection under its maximum likelihood parameter estimates (, direct fitness estimate = 0.98, off-target fitness estimate = 0.84).
Solid red lines present observed construct frequencies, black lines show 10 simulated trajectories for each cage, and the shaded area represents the range between the 2.5 and 97.5 percentile of the simulated trajectories (10,000 simulations per cage).
Figure 3—figure supplement 1
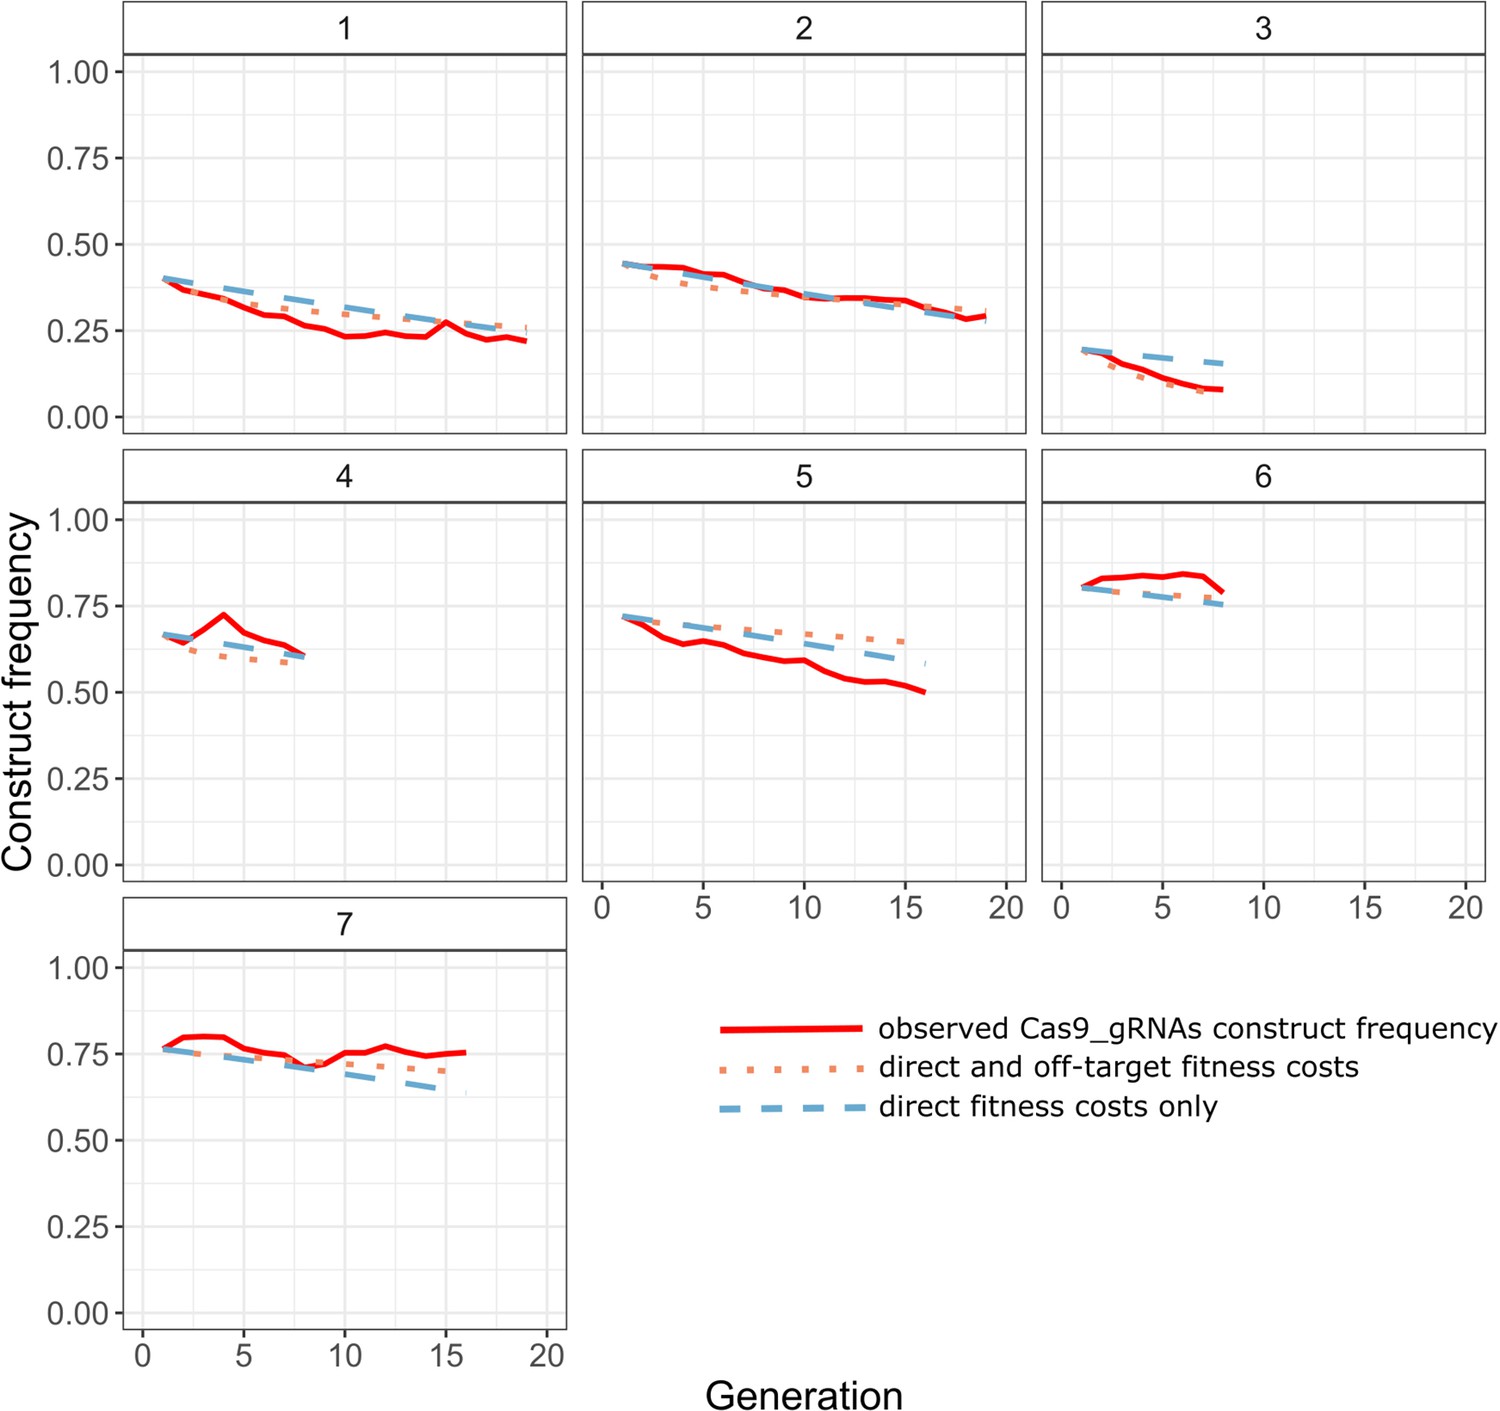
Comparison of observed construct frequencies (solid red line) in our experimental Cas9_gRNAs cages with the predicted trajectories of the full inference model with viability selection (dotted, orange line; off-target fitness = 0.84, direct fitness = 0.98), and the construct model with viability selection (dashed, blue line; direct fitness = 0.96), using the inferred maximum likelihood parameter estimates (Table 2).
Genetic drift was not simulated.
Figure 3—figure supplement 2
Comparison of observed construct frequencies with simulated trajectories of a neutral model.
Solid red lines present observed construct frequencies, black lines show 10 simulated trajectories for each cage, and the shaded area represents the range between the 2.5 and 97.5 percentile of the simulated trajectories (10,000 simulations per cage). We used the following inferred effective population sizes for the different constructs: Cas9_no-gRNAs: ; no-Cas9_no-gRNAs: ; Cas9HF1_gRNAs: .
Figure 4
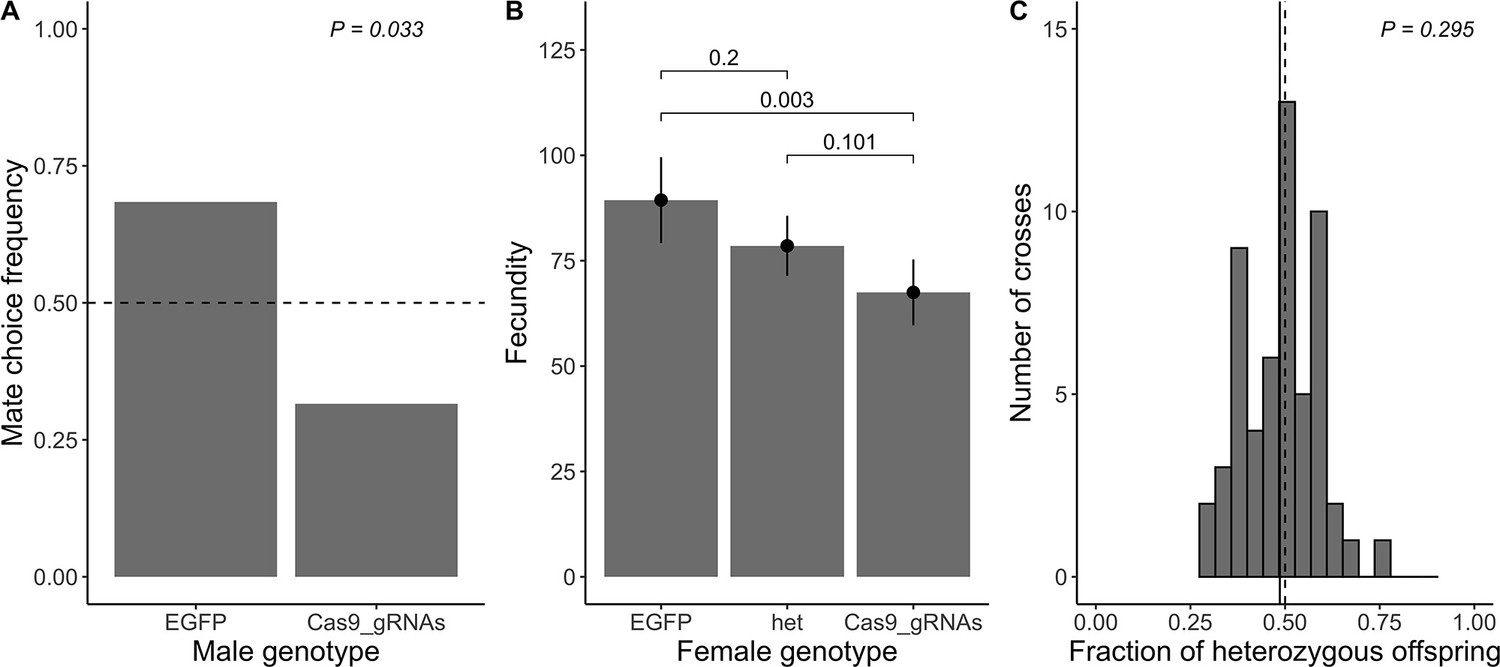
Direct measurement of fitness parameters.
(A) Observed mate choice frequency (y-axis) of EGFP homozygous females (sample size n=38) choosing between EGFP and Cas9_gRNAs homozygous males (x-axis; as only two genotypes were tested, the frequencies sum up to 1). In case of no mate choice preference, the expected mate choice frequency is 0.5 (horizontal dashed line). The observed mate choice frequency of EGFP homozygous males was significantly different from 0.5 (exact binomial test; p=0.033; chosen level of significance α= 0.05). (B) Average fecundity (y-axis) for each female genotype (x-axis). The observed average fecundity, defined as the total number of eggs per female laid over the course of three consecutive days, is plotted for each female genotype separately (EGFP = EGFP homozygous females (n=27), het = heterozygous females (n=55), and Cas9_gRNAs = Cas9_gRNAs homozygous females (n=46)). All females were mated in individual crosses to EGFP homozygous males of the same age. The fitted model is shown as black dots with error bars displaying the 95% CI. The p-values of pairwise genotype comparisons adjusted with Tukey’s method are displayed above the bars (α= 0.05). (C) Viability is measured as a fraction of heterozygous offspring from crosses between heterozygous females (n=56) and EGFP homozygous males. If the genotype does not influence viability, we expect a heterozygous offspring fraction of 0.5 (vertical dashed line). The observed fraction of heterozygous offspring (vertical solid line) does not differ from 0.5 (one sample t-test; p=0.295; α=0.05.
Figure 5
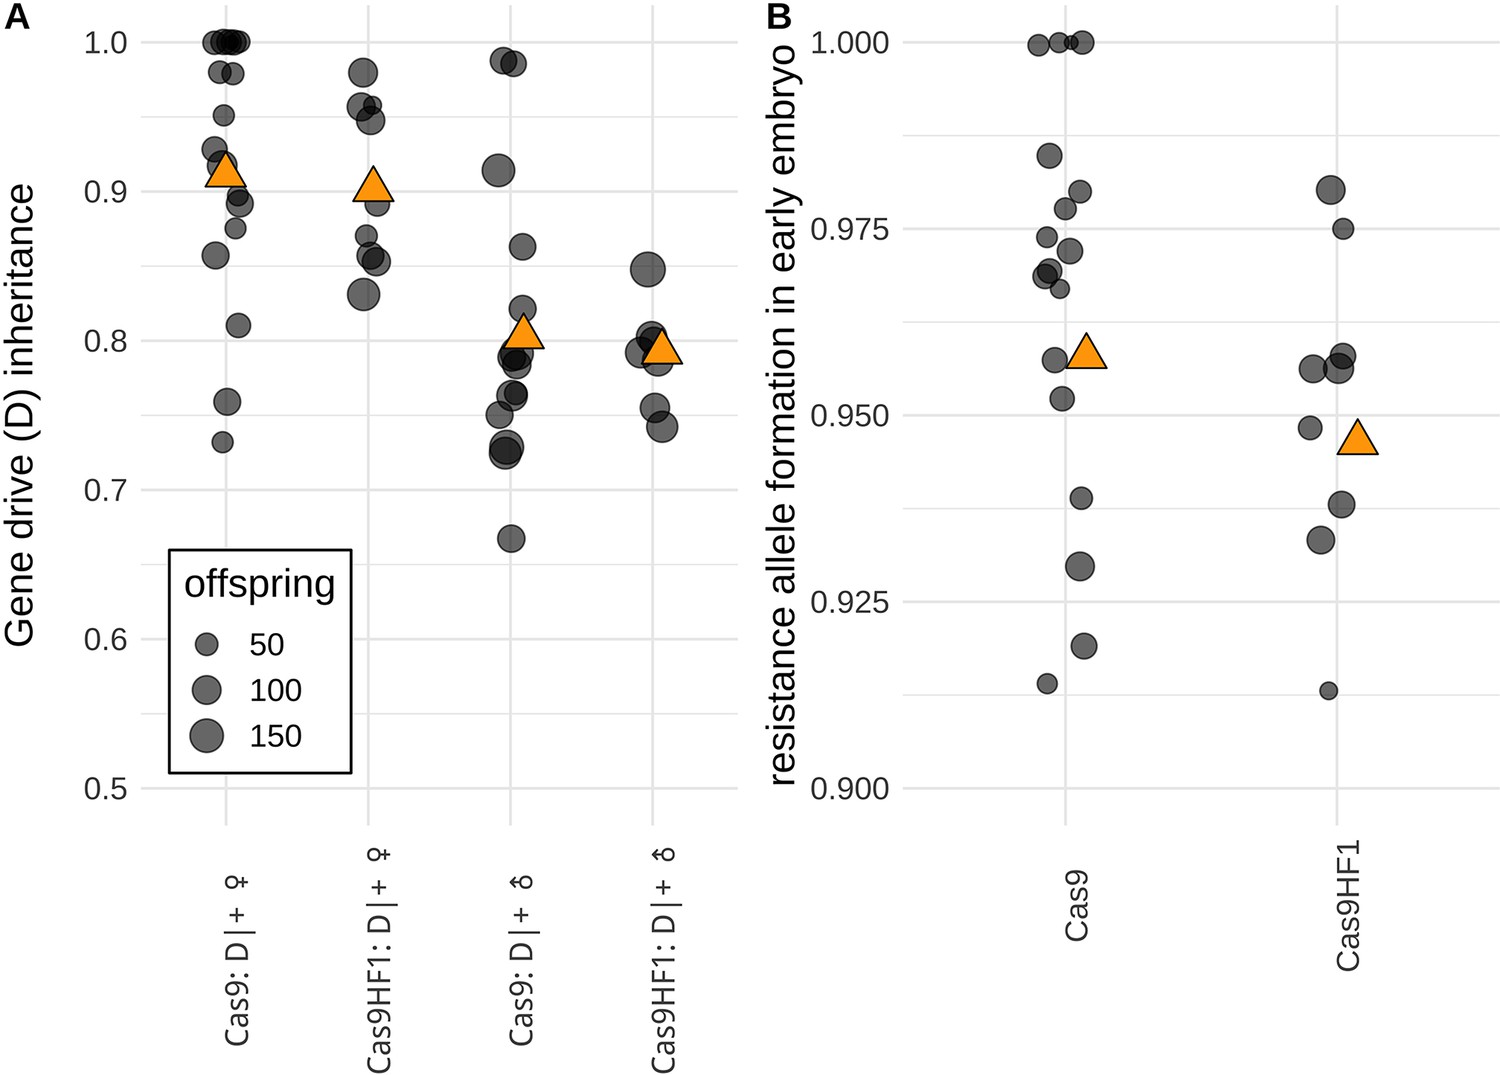
Comparison of drive performance between standard Cas9 and Cas9HF1.
(A) The gene drive inheritance rate is defined as the proportion of offspring with DsRed fluorescence from single crosses between drive heterozygotes (D|+) and EGFP homozygotes (B) Resistance allele formation occurs in early embryos due to maternally deposited Cas9 and gRNAs. The resistance allele formation rate is defined as the proportion of drive heterozygous offspring that have a nonfunctional EGFP alleles (which were originally unmutated EGFP alleles inherited from the father). Each dot represents data based on a single cross. Orange triangles show the average value from all offspring combined. An alternate analysis taking potential batch effects into account led to qualitatively similar results and can be found in Data Set S1 and S2 in Supplementary file 5.
Figure 6
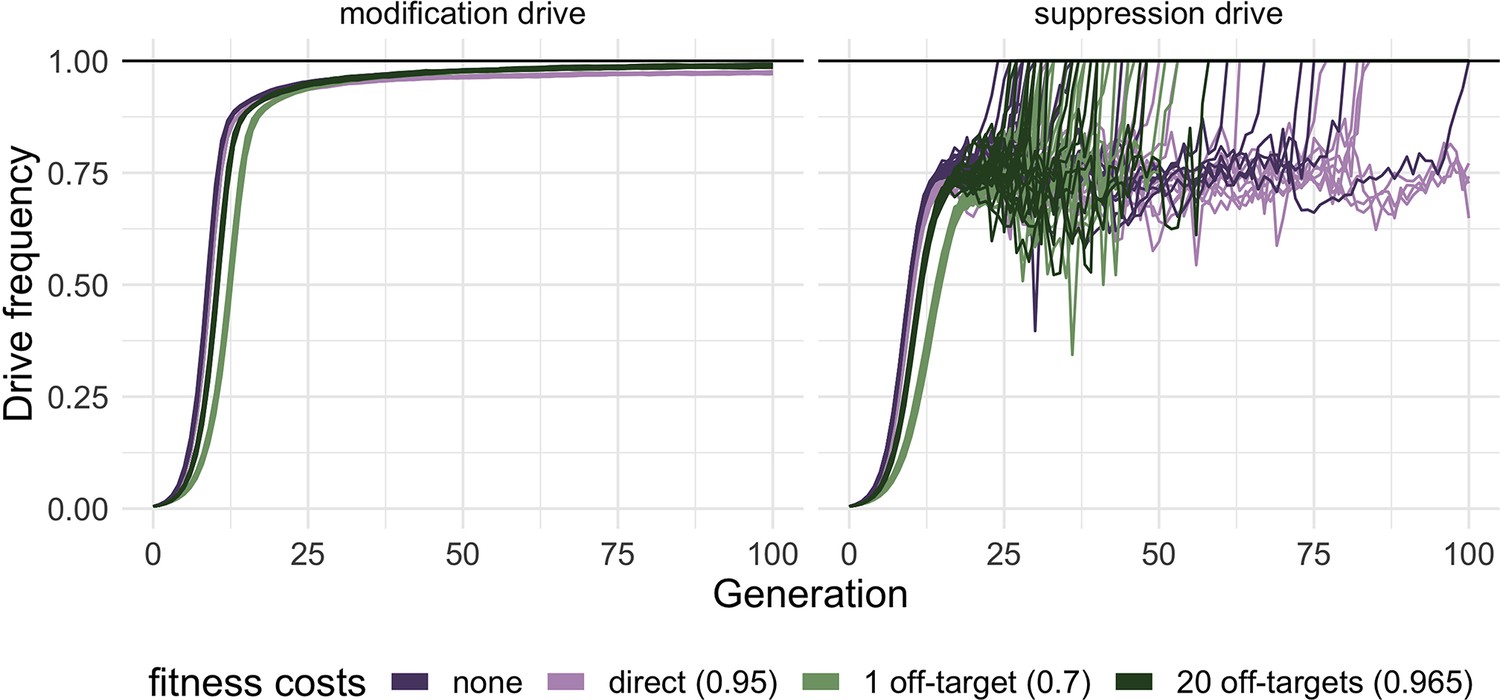
Effect of different types of fitness costs on homing drives performance.
Drive allele frequency trajectories in simulated release scenarios for modification (left panel) and suppression (right panel) homing drives suffering from various types of fitness costs were plotted after an initial release of 1% heterozygous gene drive carriers. The fitness values represent the fitness of individuals homozygous for all alleles inducing a fitness cost (reference value = 1, see also Materials and methods for further details on the fitness costs of 20 off-target sites). Fitness costs were modeled as reduced viability and are multiplicative per allele. Each line represents one individual simulation (n=20 for each drive). A suppression drive frequency of 100% (black horizontal line, right panel) indicates a successful suppression of the population. For each simulation, the carrying capacity was set to 200,000, and the low-density growth rate was 10 (Champer et al., 2020c).
Tables
Table 1
Fitness cost model overview.
The table shows which types of fitness costs are contained in each model.
| Model | Construct allele | Cut off-target allele |
|---|---|---|
| Full inference | + | + |
| Construct | + | − |
| Off-target | − | + |
| Initial off-target | − | +* |
| Neutral | − | − |
-
*
No additional cutting events at off-target sites during the experiment.
Table 2
Model comparison and parameter estimates for Cas9_gRNAs.
| Model | Selection | Direct fitness estimate | Off-target fitness estimate | P | AICc | ||
|---|---|---|---|---|---|---|---|
| Full | Viability | 175 [140–215] | 0.98 [0.95–1.00] | 0.84 [0.77–0.91] | 384.7 | 3 | –763 |
| Full | Mate choice = fecundity | 163 [131–200] | 0.96 [0.94–0.98] | 1.00 [0.95–1.06] | 378.8 | 3 | –751 |
| Construct | Viability | 164 [131–201] | 0.96 [0.93–0.98] | 1* | 378.9 | 2 | –754 |
| Construct | Mate choice = fecundity | 163 [131–200] | 0.96 [0.94–0.98] | 1* | 378.8 | 2 | –754 |
| Off-target | Viability | 173 [139–212] | 1* | 0.80 [0.74–0.88] | 383.6 | 2 | –763 |
| Off-target | Mate choice = fecundity | 157 [126–192] | 1* | 0.95 [0.90–1.01] | 375.1 | 2 | –746 |
| Initial off-target | Viability | 156 [125–191] | 1* | 0.92 [0.82–1.02] | 374.8 | 2 | –745 |
| Initial off-target | Mate choice = fecundity | 156 [125–191] | 1* | 0.96 [0.91–1.01] | 374.8 | 2 | –745 |
| Neutral | None | 154 [123–189] | 1* | 1* | 373.6 | 1 | –745 |
-
Each row shows the parameter estimates for effective population size (), maximum log likelihood () , number of free parameters in the maximum likelihood framework (P), and corrected Akaike information criterion value () where n=87 is the number of generation transitions for a specific model and selection type. 1* entries indicate that a parameter was fixed at 1 (= no fitness effect is estimated). Values in squared brackets in the parameter estimate columns represent the 95% CI estimated from a likelihood ratio test with one degree of freedom. The model with the lowest AICc (i.e. the best fit) is highlighted in bold.
Table 3
Model comparison and parameter estimates for Cas9_no-gRNAs, no-Cas9_no-gRNAs, and Cas9HF1_gRNAs.
| Construct | Model | Selection | Direct fitness estimate | Off-target fitness estimate | P | AICc | ||
|---|---|---|---|---|---|---|---|---|
| Cas9_no-gRNAs | Construct | Viability | 243 [152–366] | 1.0 [0.96–1.04] | 1* | 88.6 | 2 | –173 |
| Cas9_no-gRNAs | Initial off-target | Viability | 250 [156–377] | 1* | 0.84 [0.65–1.18] | 89.2 | 2 | –174 |
| Cas9_no-gRNAs | Neutral | None | 243 [152–366] | 1* | 1* | 88.6 | 1 | –175 |
| no-Cas9_no-gRNAs | Construct | Viability | 162 [101–243] | 1.0 [0.97–1.10] | 1* | 81.5 | 2 | –158 |
| no-Cas9_no-gRNAs | Initial off-target | Viability | 162 [101–243] | 1* | 1.12 [0.84–1.63] | 81.5 | 2 | –158 |
| no-Cas9_no-gRNAs | Neutral | None | 162 [101–243] | 1* | 1* | 81.5 | 1 | –161 |
| Cas9HF1_gRNAs | Construct | Viability | 396 [240–608] | 1.0 [0.97–1.04] | 1* | 88.1 | 2 | –171 |
| Cas9HF1_gRNAs | Initial off-target | Viability | 433 [263–655] | 1* | 1.18 [0.99–1.45] | 89.7 | 2 | –175 |
| Cas9HF1_gRNAs | Neutral | None | 396 [240–608] | 1* | 1* | 88.1 | 1 | –174 |
-
Each row shows the parameter estimates for a specific construct, model, and selection type, using the same definitions as in Table 2. For each construct, the best-fitting model is highlighted in bold.
Additional files
-
Supplementary file 1
Model comparison of Cas9_no-gRNAs, no-Cas9_no-gRNAs, Cas9HF1_gRNAs.
All cut parameters were set to 1.
- https://cdn.elifesciences.org/articles/71809/elife-71809-supp1-v2.docx
-
Supplementary file 2
Predicted off-target sequences for gRNAs 1–4.
Lowercase letters indicate a mismatch between the potential off-target sequence and the gRNA sequence.
- https://cdn.elifesciences.org/articles/71809/elife-71809-supp2-v2.docx
-
Supplementary file 3
Plasmid construction overview.
For each construct, DNA fragments, plasmids, primers, and restriction enzymes used for cloning are listed.
- https://cdn.elifesciences.org/articles/71809/elife-71809-supp3-v2.docx
-
Supplementary file 4
Annotated sequences of the final construct insertion plasmids.
- https://cdn.elifesciences.org/articles/71809/elife-71809-supp4-v2.zip
-
Supplementary file 5
Raw counts of each experimental population (different constructs and the Cas9/Cas9HF1 homing drives).
- https://cdn.elifesciences.org/articles/71809/elife-71809-supp5-v2.xlsx
-
Supplementary file 6
Picture sample set for the image-based screening pipeline.
- https://cdn.elifesciences.org/articles/71809/elife-71809-supp6-v2.zip
-
Supplementary file 7
Raw data of the phenotypic assays.
- https://cdn.elifesciences.org/articles/71809/elife-71809-supp7-v2.zip
-
Transparent reporting form
- https://cdn.elifesciences.org/articles/71809/elife-71809-transrepform1-v2.docx
Download links
A two-part list of links to download the article, or parts of the article, in various formats.
Downloads (link to download the article as PDF)
Open citations (links to open the citations from this article in various online reference manager services)
Cite this article (links to download the citations from this article in formats compatible with various reference manager tools)
Fitness effects of CRISPR endonucleases in Drosophila melanogaster populations
eLife 11:e71809.
https://doi.org/10.7554/eLife.71809


