Synaptic targets of photoreceptors specialized to detect color and skylight polarization in Drosophila
- Instititut für Biologie – Abteilung Neurobiologie, Fachbereich Biologie, Chemie & Pharmazie, Freie Universität Berlin, Germany
- Janelia Research Campus, Howard Hughes Medical Institute, United States
Figures
Figure 1 with 2 supplements
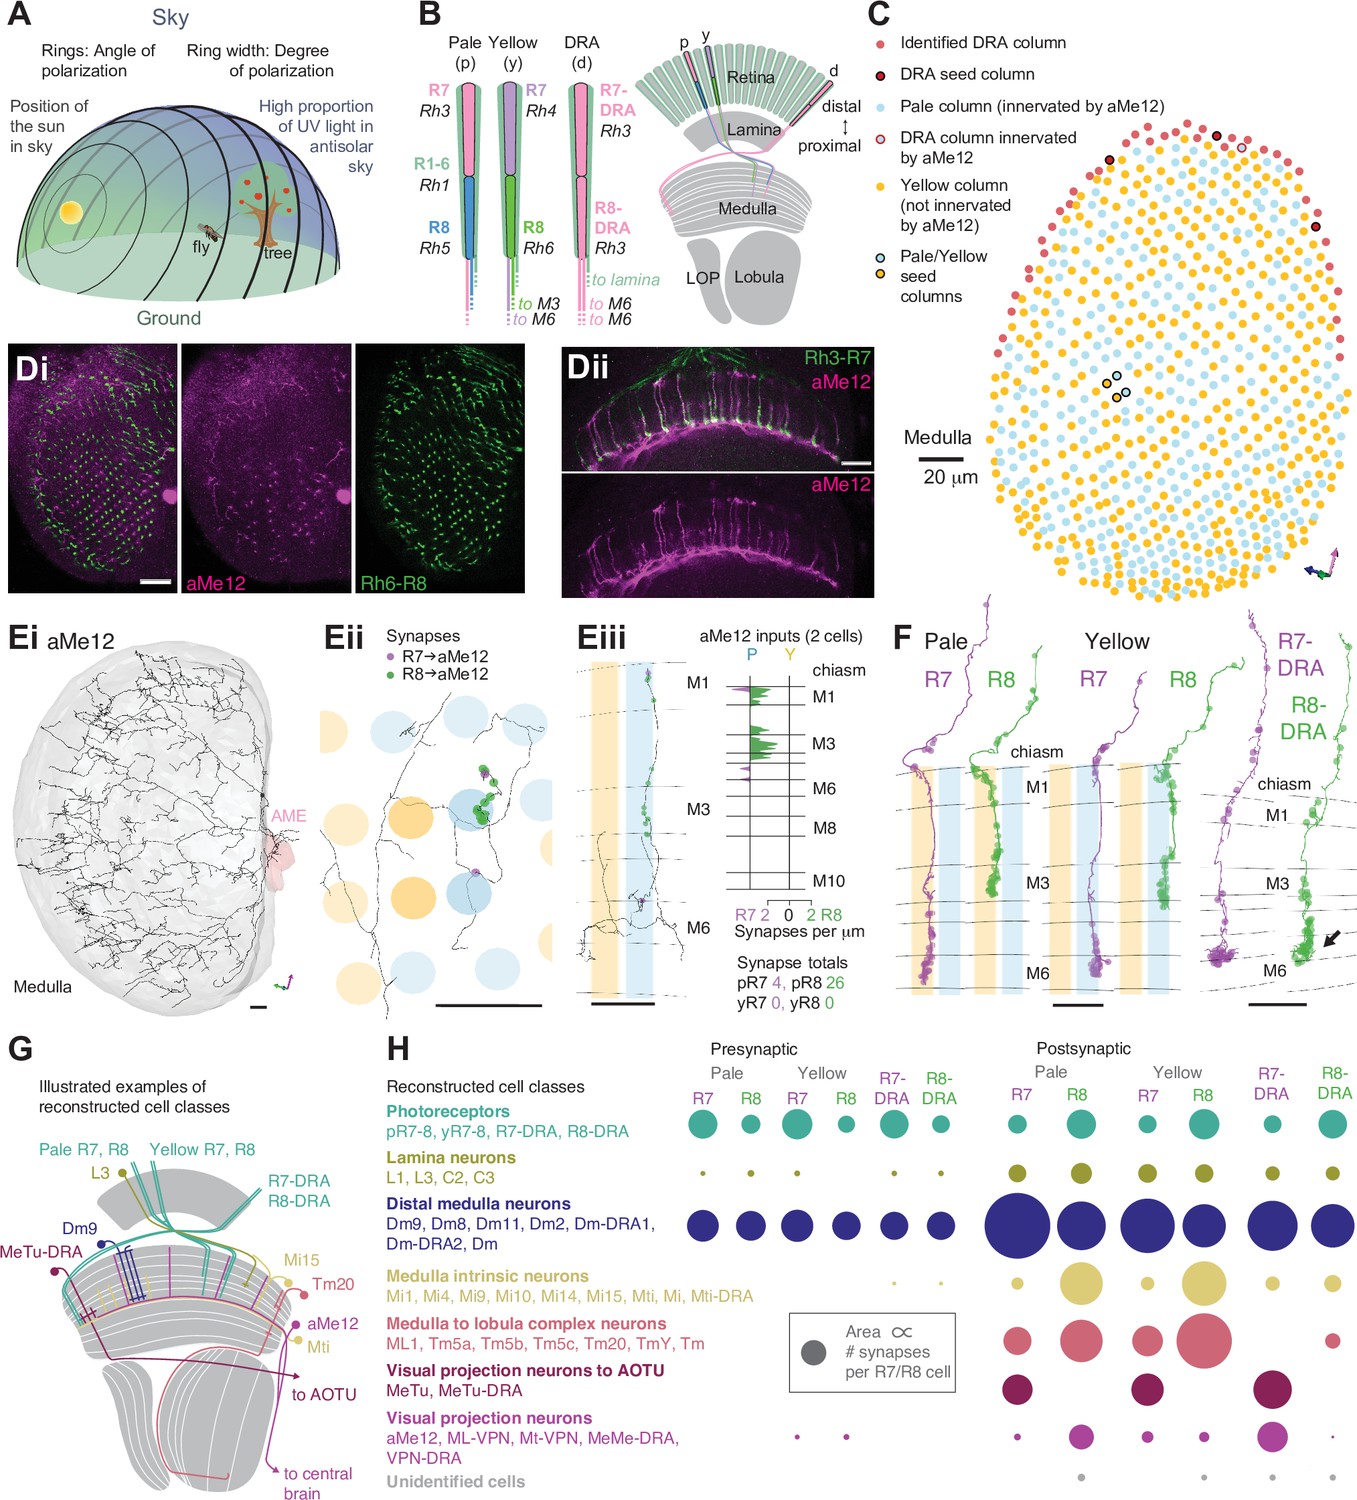
Systematic reconstruction of all synaptic targets of inner photoreceptor subtypes.
(A) Simplified schematic summarizing some of the most salient visual stimuli of a fly (center): celestial cues (sun), color gradients (distribution of green versus UV wavelengths) and skylight polarization (as defined by degree of polarization and angle of polarization) can be used for navigation, as well as more or less colorful landmarks (tree). (B) Schematic representation of the fly visual system. Left: In the retina, inner photoreceptor R7 (distal) and R8 (proximal) rhodopsin expression differs across three functionally specialized subtypes pale (p), yellow (y), and DRA (d). Rh3 and Rh4 opsins are both UV-sensitive, whereas Rh5 and Rh6 are more sensitive to blue and green wavelengths, respectively. R1-6 express Rh1 and are broadly sensitive to green and UV wavelengths. Only in the DRA, both R7 and R8 axons terminate in the same layer of the medulla neuropil (M6), which is the target layer of R7 cells outside the DRA, and non-DRA R8 cells terminate in layer M3. Right: Overview of the main four optic lobe neuropils. Only the lamina and medulla receive direct photoreceptor input. (C) Distribution of medulla columns downstream of either p (light blue), y (yellow), and DRA (red) photoreceptors reconstructed from the Zheng et al., 2018 data set. Pale columns were assigned via presence of aMe12 long vertical projections (see below). Seven seed columns used for systematic reconstruction are highlighted with black circles. The colored axes indicate the orientation of the displayed view: green for lateral, magenta for dorsal, and blue for posterior axes. Scale bar: 20 μm. (D) Double labeling of aMe12 vertical processes and yellow R8 cells. See Materials and methods and Supplementary file 4 for fly genotypes and other details of this and other light microscopy panels. Left (Di) Confocal image showing the array of medulla columns with labeling of aMe12 neurons (purple) and yellow R8 axons (green). Note that the two patterns appear near-mutually exclusive. Right (Dii) Side view of aMe12 vertical projections and pale R7 axons (green). (Di–ii) Scale bars: 20 μm. (E) Left (Ei) Skeleton of the optic lobe part of a fully reconstructed aMe12 neuron (gray), with processes leaving the medulla through the accessory medulla (pink). (Eii) Across the four central seed columns (darker shading), synaptic input from R7 (purple dots) and R8 photoreceptors (green dots) to aMe12 is specific to the designated pale columns. (Eiii) Left: Sideview depicting the distribution of R7 and R8 inputs into aMe12 across medulla layers (color code of pale and yellow columns as before). Right: Same distribution plotted as synapses/μm, for both pale and yellow columns (color code as before). (Ei–iii) Scale bars: 10 μm. (F) Reconstructed pale R7 and R8, yellow R7 and R8, and R7-DRA and R8-DRA terminals with R7 presynapses in purple and R8 presynapses in green. Note the termination of R8-DRA in the R7 target layer M6 (arrow). Scale bars: 10 μm. (G) Illustrations of examples of cell types from reconstructed neuron classes, including lamina monopolar (L3), distal medulla (Dm9), medulla intrinsic (Mi15), transmedulla (Tm20), medulla tangential intrinsic (Mti), visual projection neurons targeting the central brain (e.g. aMe12), and medulla-to-tubercle (MeTu) cells projecting to the anterior optic tubercle (AOTU). (H) For the synapses from seed column inner photoreceptors to cells with ≥3 synapses, we identified the cell type or cell class of 99.5% (3803/3821 synapses). Overview of the relative strength of these connections with different neuron classes (color code as before), including with the unidentified cells (Table 2, Table 3, Table 4, Table 5), across pale, yellow, and DRA columns (pre- and postsynaptic). Area of circles corresponds to the number of synapses per R7 and R8 cell.
Figure 1—figure supplement 1

Example electron microscopy (EM) images.
(A) Example EM images of photoreceptor synapses in medulla layer 6. Top: R7 synapse (T-bar labeled) with postsynaptic Dm2, Dm8, Dm9, and Tm5b cells. Bottom: R8-DRA synapse, with postsynaptic Dm9 and Dm-DRA2 cells. R8 synapses in layer 6 were diagnostic of DRA columns (see Materials and methods). (B) Images of synapses outside the medulla in the central (top) and DRA (bottom) seed columns. (C) Two examples of photoreceptor synapses with glia, with the arrows indicating the postsynaptic density in the glial cell. Scale bars: 500 μm.
Figure 1—figure supplement 2
Comparison with medulla-7-column connectome.
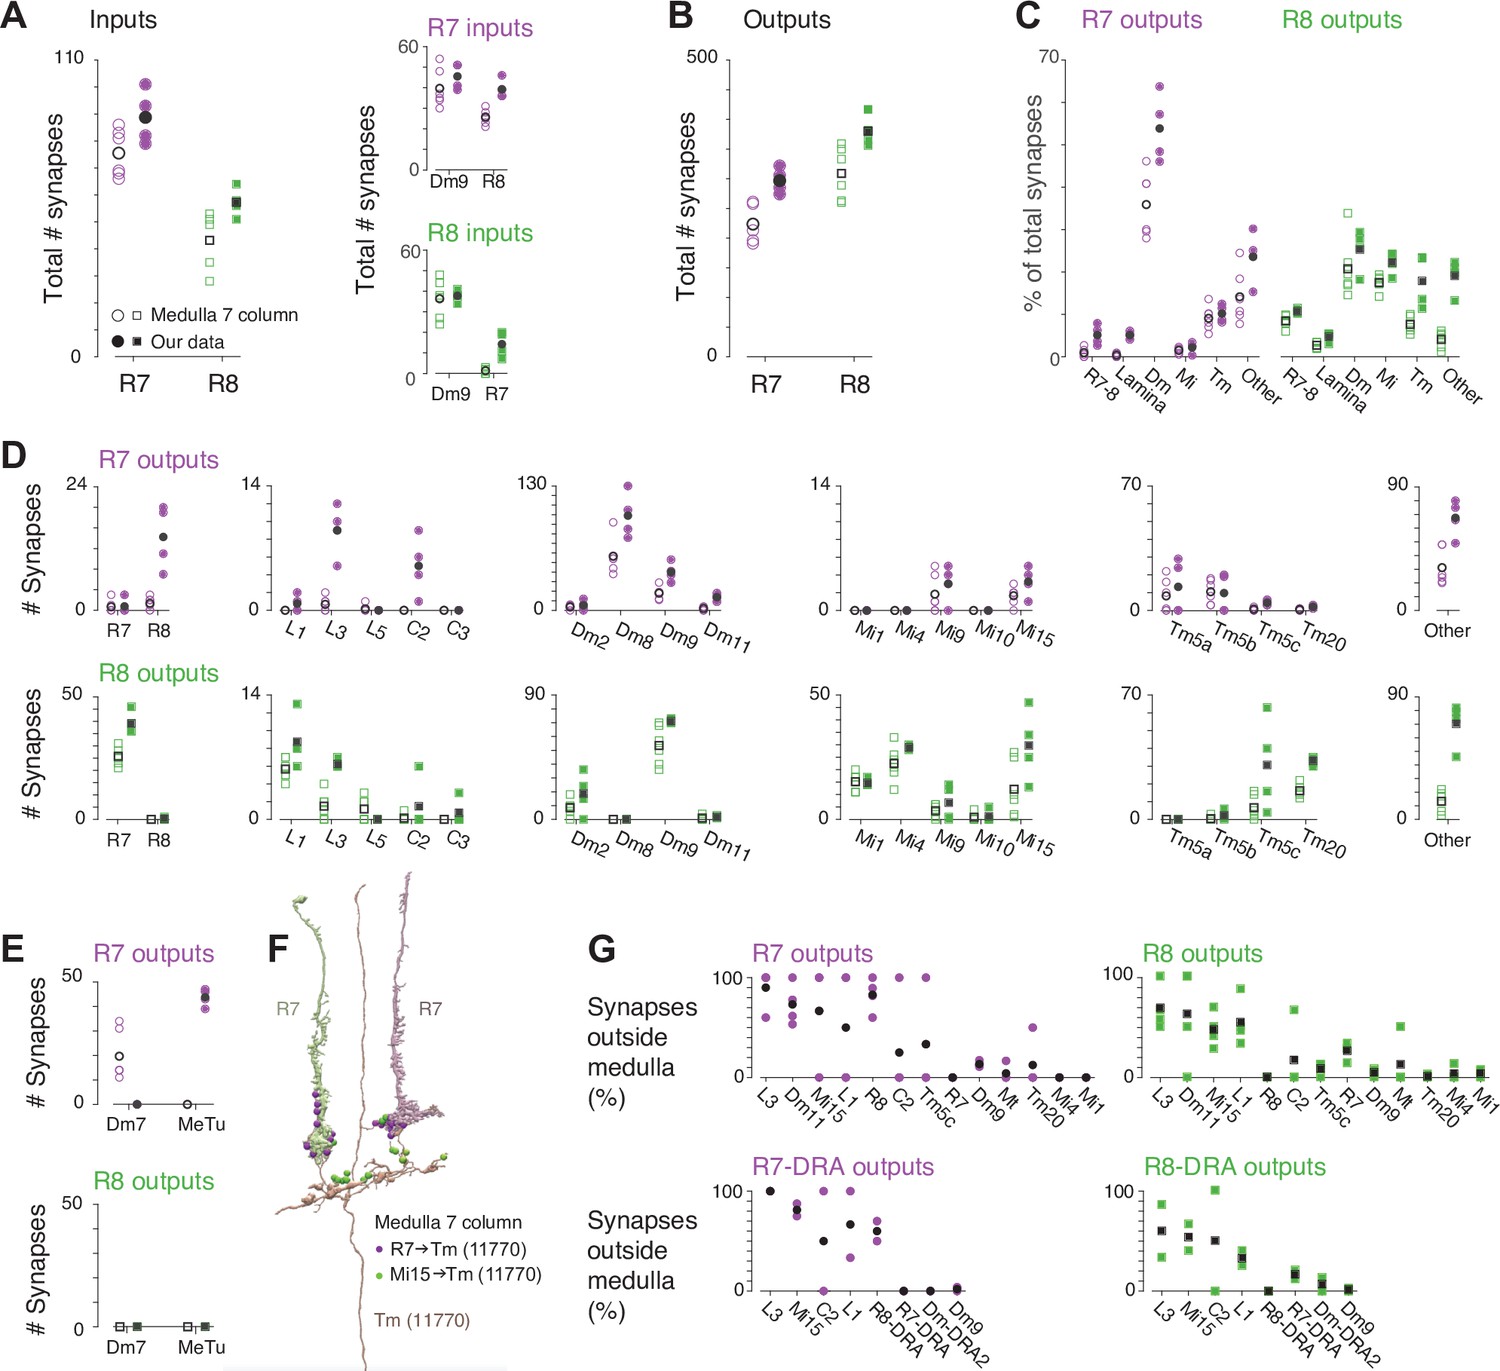
(A) Left: Comparison of total numbers of synaptic inputs to R7 (purple, circles) and R8 (green, squares) in our data set (filled symbols) and a medulla-7-column connectome (open symbols), with mean values are indicated by black symbols. These plotting conventions are used throughout the figure. We used the six columns identified as pale and yellow in the medulla-7-column connectome (Takemura et al., 2015) by Menon et al., 2019, made available in Clements et al., 2020, see Materials and methods. Right: The R7-8 photoreceptors and Dm9 inputs dominate the synaptic input to R7 (purple, circles) and to R8 (green, squares); the increased number of synapses outside medulla (see panel G) likely accounts for the higher number of inputs to our R7-8 cells. (B) Comparison of the total number of output synapses from R7 and R8. We reconstructed more output synapses, per cell, than in medulla-7-column connectome. (C) Comparison of total numbers of R7-8 output synapses disaggregated by cell classes. To enable like-for-like comparisons, we used only cell classes and cell types annotated in both data sets, with the cell types shown in D. To quantify the completeness of cell type identification, we counted all other identified cell types found each data set in the ‘Other’ category. Our reconstruction found a large increase in R7 synapses to multicolumnar Dm cells, and increases in R8 synapses to multicolumnar cell classes, such as Tm cells and cells like aMe12 in the ‘Other’ class. (D) Comparison of total numbers of R7 (top) and R8 (bottom) output synapses disaggregated by cell type, with cell types grouped from left to right by their cell class categories in C. For R7, there were increases in synapses to R8 and L3, which receive synapses outside the medulla, and Dm8 cells, which are multicolumnar. For R8, there were increases in synapses to R7 and Mi15, which receive synapses outside the medulla, and multicolumnar Tm5c and ‘Other’ cell types, and also Tm20 cells, which may be surprising because this cell type is columnar. (E) Comparison of R7-8 synapses to (medulla-7-column connectome) Dm7 and (current study) MeTu cells. These two cell types were the only cell type discrepancies between the data sets: Dm7 cells were major targets of R7 in the medulla-7-column connectome, but not in ours, while MeTu cells were major targets in our data but not in the medulla-7-column connectome. (F) Example Tm cell (brown, Tm #11770) in the medulla-7-column connectome whose dendritic morphology matched MeTu cell. Two R7 cells (green, left, and purple, right) are also shown, along with R7 synapses (green circles) and Mi15 synapses (purple). We propose that some MeTu cells are included in the medulla-7-column connectome but are currently annotated as unidentified Tm or Dm7 cells. (G) Percentages of synapses outside the medulla for R7 (left) and R8 (right) with cell types in the central (top) and DRA (bottom) seed columns. L3 in particular is almost exclusively innervated outside the medulla. Tables of synapses outside the medulla are listed for each cell type in Supplementary file 3.
Figure 2 with 1 supplement
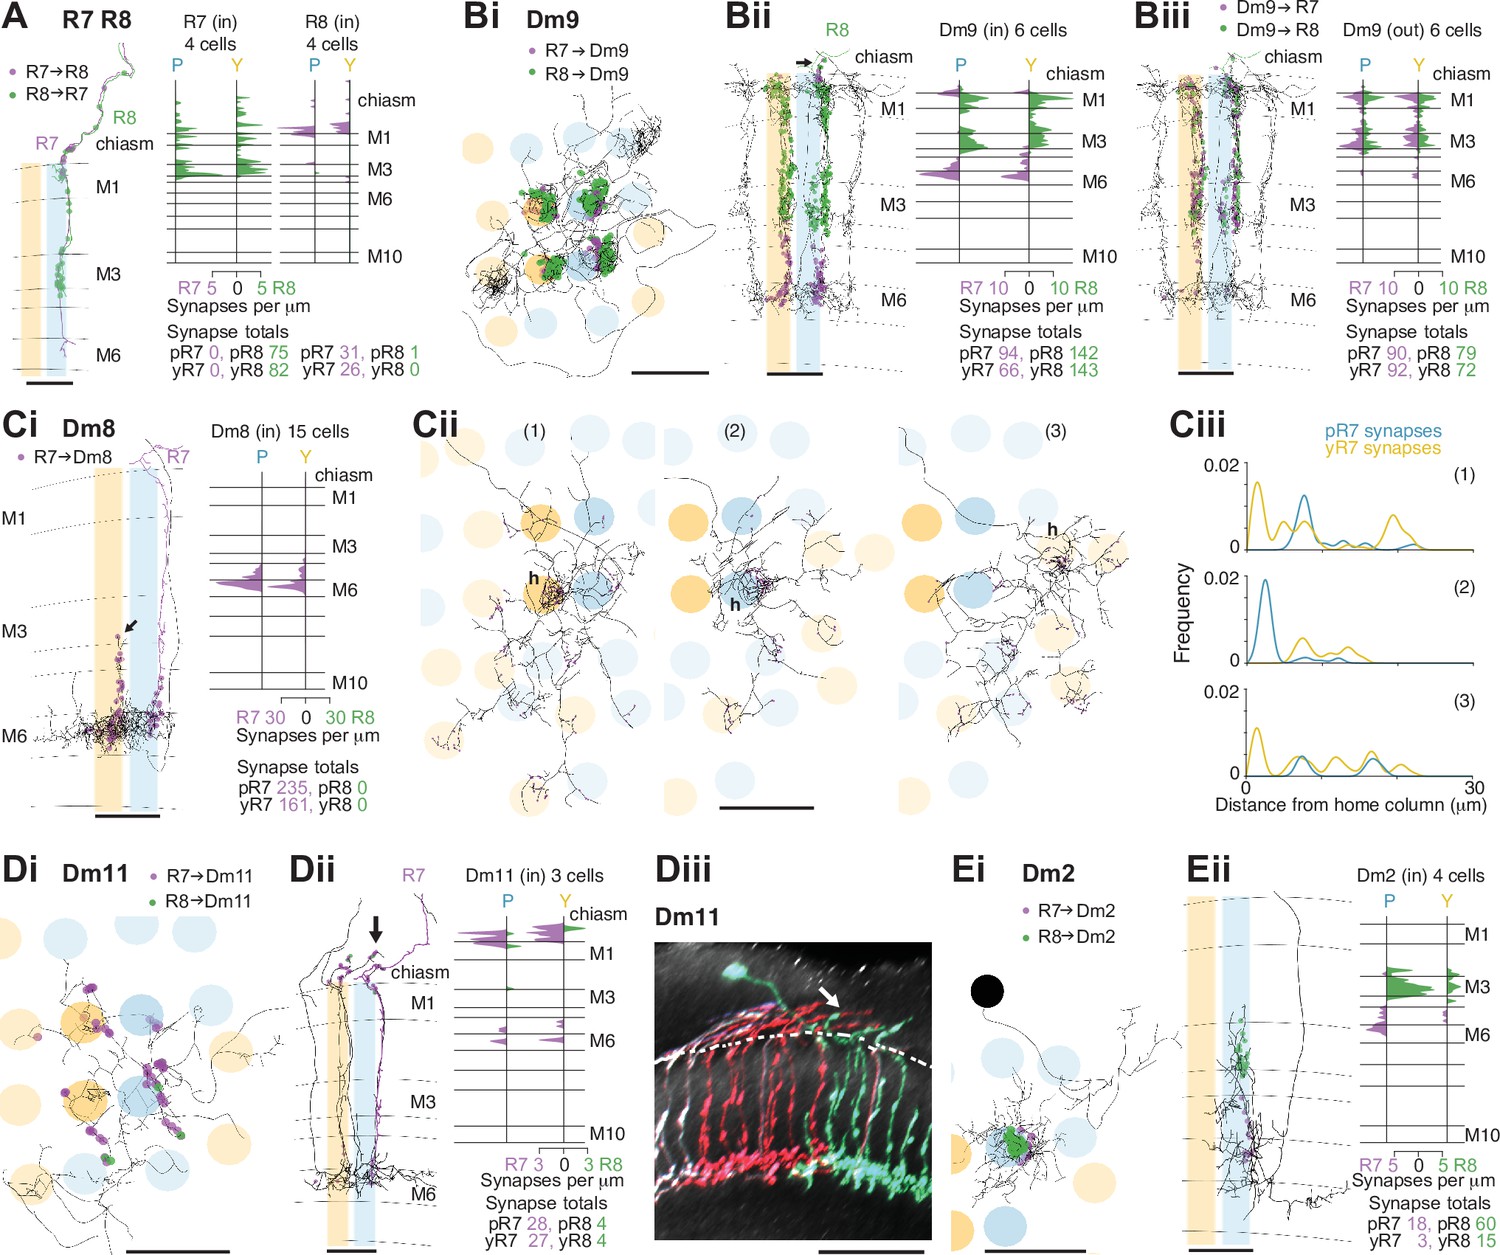
Synapses between R7 and R8, and with Dm neurons in the non-dorsal rim area (DRA) medulla.
(A) Synapses between central R7 and R8 cells. Left: Side view of R7 (purple) and R8 (green), with R7→R8 synapses (purple points) and R8→R7 synapses (green points). Note synapses outside the medulla neuropil (distal to layer M1). Scale bar: 10 μm. Right: Synapse distribution (in synapses/μm) in the yellow and pale seed columns. (B) Synapses between R7 and R8 and Dm9 cells. (Bi) Top view of a fully reconstructed Dm9 skeleton (gray) covering all four central seed columns (darker shading) with all R7 (purple) and R8 (green) inputs. (Bii) Left: Side view of R7 (purple) and R8 synapses (green) to the same Dm9 cell across medulla layers. Right: Layer distribution of photoreceptor inputs to six Dm9 cells. (Biii) Left: Side view of Dm9→ R7 (purple) and Dm9→R8 (green) feedback synapses from the same Dm9 cell. Right: Layer distribution of feedback synapses from six Dm9 occupying the seed columns. Most of these synapses are from the illustrated Dm9 cell with other Dm9 cells contributing a small number of connections in M1 and M6. (C) Synapses between R7 and Dm8 cells. (Ci): Left: Side view of R7 synapses (purple) to a fully reconstructed Dm8 cell, with one pale R7 cell is shown in purple. Note the characteristic vertical projections of Dm8 in its ‘home column’ (arrow; yellow R7 cell not shown). Right: Layer distribution of R7 inputs from 14 Dm8 cells innervating the four seed columns. (Cii) Full reconstructions of three Dm8 cells (labeled 1, 2, 3) innervating the four seed columns, with all R7 synapses (purple), including inputs beyond the seed columns. Individual Dm8 home columns (h) are marked. (Ci–ii) Scale bars: 10 μm. (Ciii) R7→Dm8 synapses/μm as a function of their distance from the home column, for the three Dm8 cells (1, 2, 3 above). The cells receive dense innervation in their home column and weaker inputs from both pale and yellow R7 cells in their periphery. (D) Synapses between R7 and Dm11 cells with R7 (purple) and R8 (green) synapses from seed columns. (Di) Top view of a reconstructed Dm11 skeleton. (Dii) Left: Side view of the layer distribution of photoreceptor synapses, including synapses outside the medulla (arrow). (Di–ii) Scale bars: 10 μm. Right: Layer distribution of R7 and R8 inputs to three Dm11 cells. (Diii) Rendering of a confocal image of MultiColor FlpOut (MCFO) labeled Dm11 cells. Note the characteristic vertical projections leaving the medulla neuropil (arrow). The dashed line marks the approximate boundary of the medulla neuropil. Scale bar: 20 μm. (E) Synapses between R7 and R8 and Dm2 cells. (Ei) Top view of a Dm2 skeleton, with R7 (purple) and R8 (green) synapses. (Eii) Left: Side view of layer distribution of photoreceptor synapses onto the same Dm2 cell. (Ei–ii) Scale bars: 10 μm. Right: Layer distribution of R7 and R8 inputs to four Dm2 cells.
Figure 2—figure supplement 1
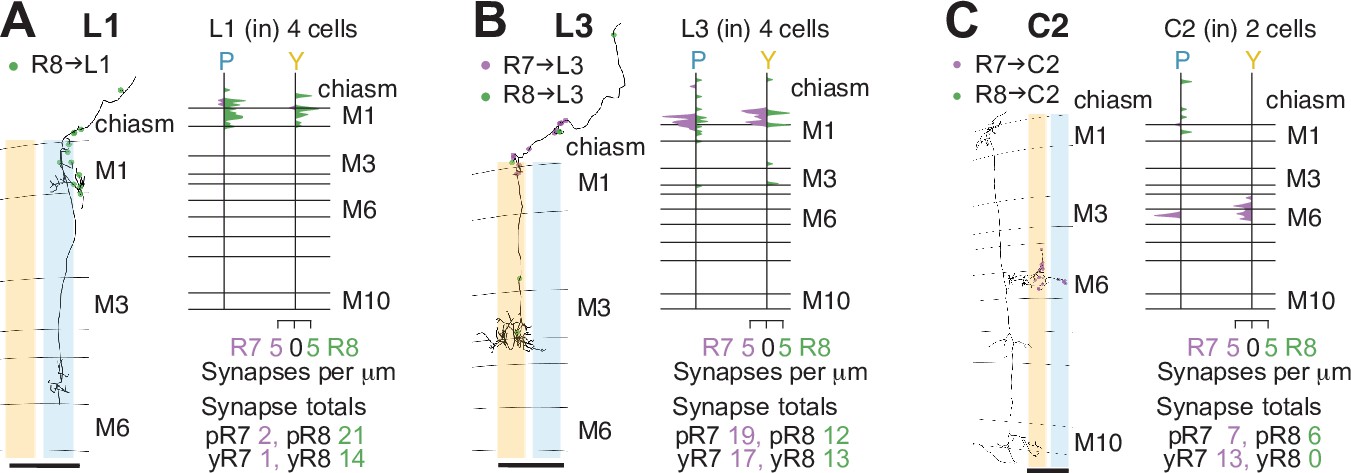
Lamina cell types targeted by central column R7–8.
(A) Left: Side view of a reconstructed L1 cell (gray) with R8→L1 synapses (green). Right: Layer distribution (in synapses/μm) of all R7 and R8 inputs to four L1 cells. (B) Left: Side view of a reconstructed L3 cell (gray), with R7→L3 (purple) and R8→L3 synapses (green). Right: Layer distribution (in synapses/μm) of all R7 and R8 inputs to four L3 cells.( C) Left: Side view of a reconstructed C2 cell (gray), with R7→C2 (purple) and R8→C2 synapses (green). Right: Layer distribution (in synapses/μm) of all R7 and R8 inputs to two C2 cells. (A–C) All scale bars: 10 μm.
Figure 3 with 1 supplement
R7–8 synapses with medulla intrinsic (Mi) and medulla tangential intrinsic (Mti) cell types.
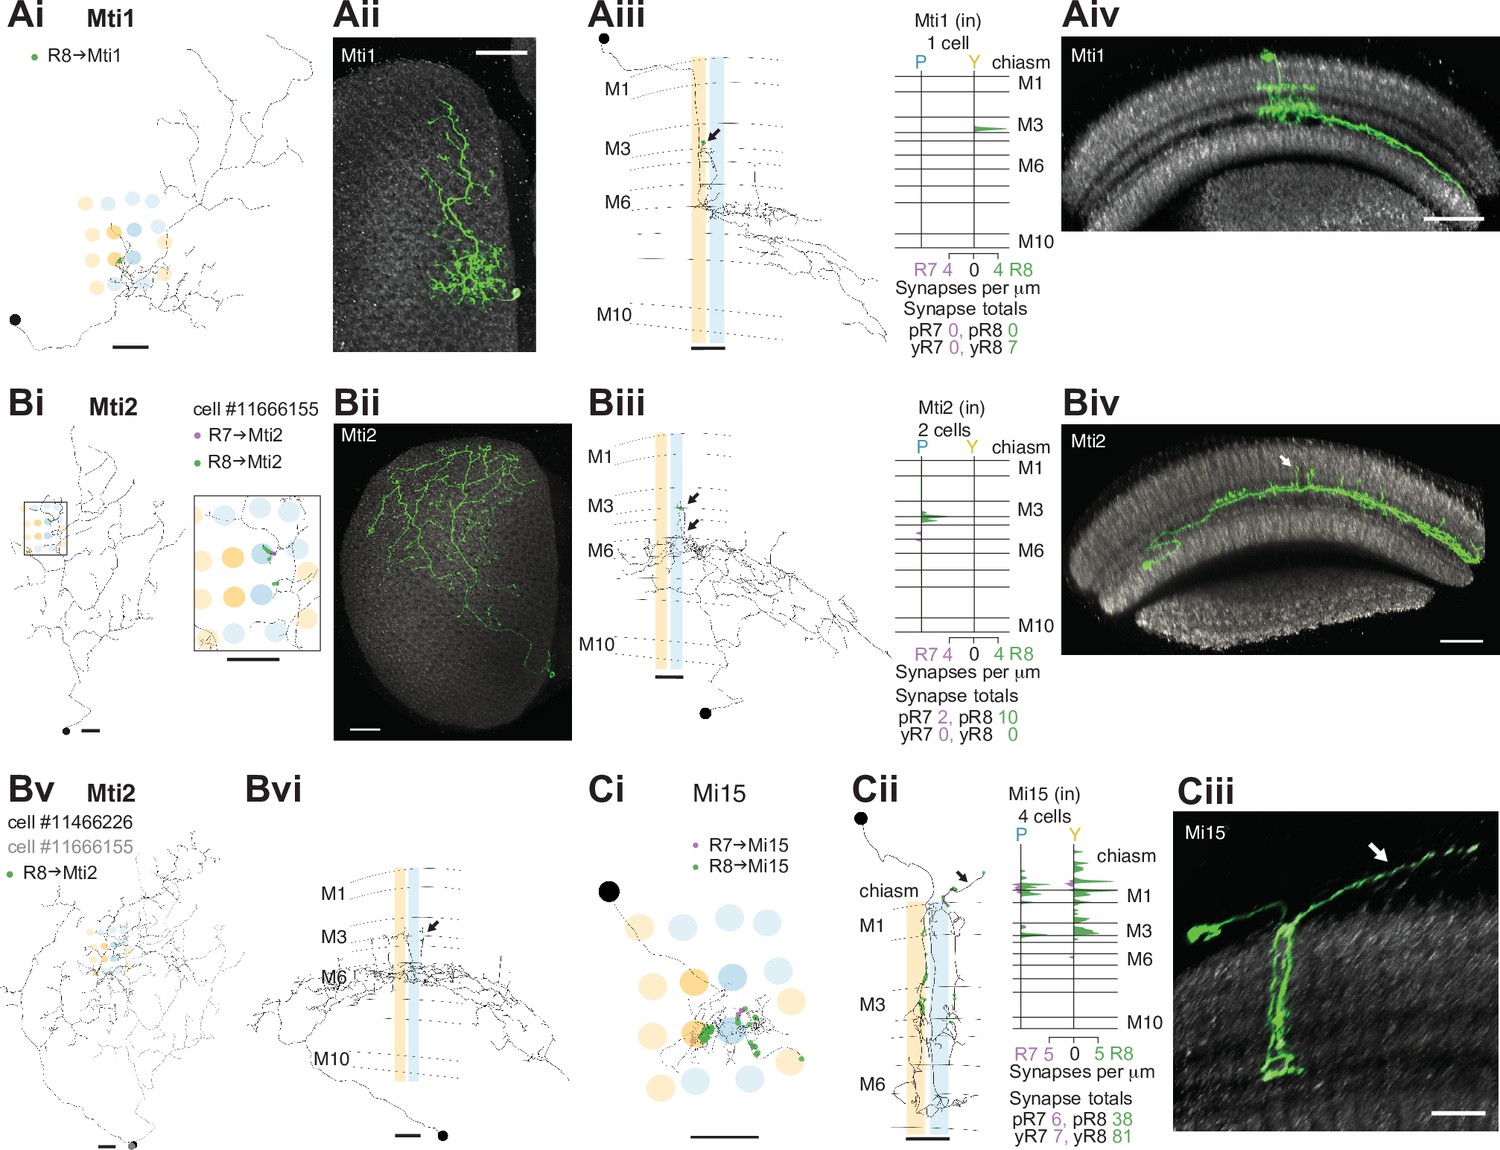
(A) Synapses of central R7 and R8 with Mti1 cells. (Ai) Top view of an Mti1 skeleton with synapses from seed column R8 cells (green). Scale bar: 10 μm. (Aii) Top view of an MCFO-labeled cell matching overall Mti1 morphology. Light microscopy images (Aii, Aiv, Bii, Biv, Ciii) were manually segmented to focus on the cells of interest. Scale bar: 20 μm. (Aiii) Side view of the same Mti1 cell as in Ai with R8 (green) synapses. Scale bar: 10 μm. (Aiv) Side view rendering of the same light microscopy Mti1 image (green). Scale bar: 20 μm. (B) Synapses from R7 and R8 to Mti2. (Bi) Top view of a reconstructed Mti2 cell, with R7 (purple) and R8 (green) synapses. Scale bar: 10 μm. (Bii) Top view of an MCFO-labeled cell matching overall Mti2 morphology. Scale bar: 20 μm. (Biii) Side view of the same Mti2 skeleton as in Bi with R7 (purple) and R8 (green) synapses on characteristic vertical projections (arrow). Scale bar: 10 μm. (Biv) Side view of the cell shown in Bii. Arrow indicates vertical projections. Scale bar: 20 μm. (Bv) Top view of a second reconstructed Mti2 cell (dark gray) overlayed on the first (light gray), with R8 (green) synapses. Bvi: Side view of the second Mti2 skeleton, with R8 (green) synapses again located on vertical projections (arrow). (Bv–vi) Scale bars: 10 μm. (C) Synapses of R7 and R8 with Mi15 cells. (Ci) Top view of a fully reconstructed Mi15 skeleton, with R7 (purple) and R8 (green) synapses. (Cii) Left: Side view depicting the layer distribution of photoreceptor synapses (same color code) onto the same Mi15 skeleton, with synapses outside the medulla (arrow). (Ci–ii) Scale bars: 10 μm. Right: Layer distribution of R7 and R8 inputs to four Mi15 cells. (Ciii) Side view rendering of a light microscopy image (MCFO) of an Mi15 cell. Note the long process leaving the medulla (arrow). Scale bar: 10 μm.
Figure 3—figure supplement 1
Mi cell types targeted by R7–8.
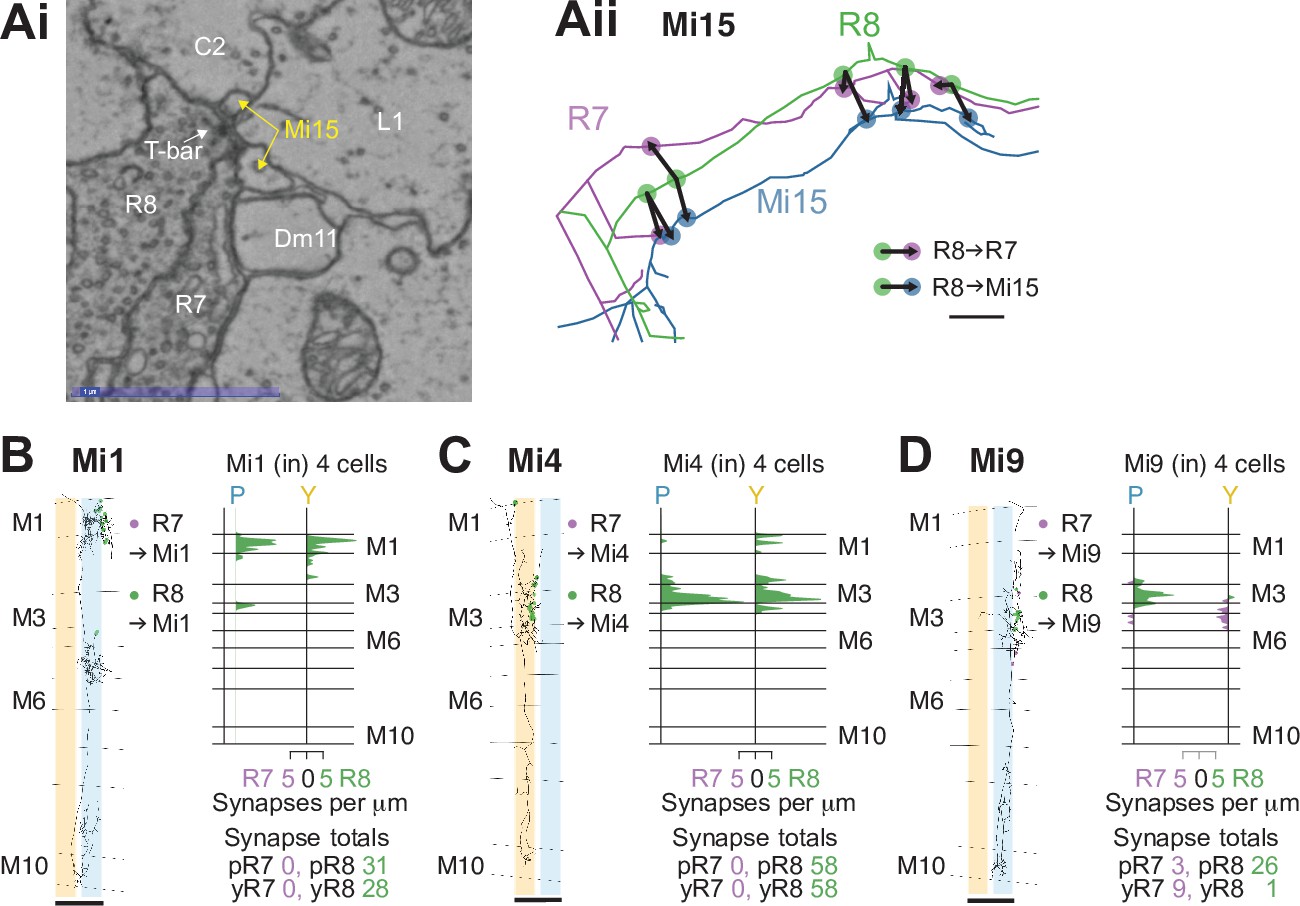
(A) Colocalization of R8→Mi15 synapses with R8→R7 synapses. (Ai) Example electron microscopy (EM) image of Mi15 and R7 cells as postsynaptic partners of the same R8 presynapse. Scale bar: 1 μm. (Aii) Magnified view of skeletons of R8, Mi15, and R7 cells in the optic chiasm, illustrating the colocalization of R8→Mi15 synapses with R8→R7 synapses at five successive locations. Scale bar: 1 μm.(B) Left: Side view of a reconstructed Mi1 cell (gray) with R7→Mi1 (purple) and R8→Mi1 synapses (green). Right: Layer distribution (in synapses/μm) of all R7 and R8 inputs to four Mi1 cells.(C) Left: Side view of a reconstructed Mi4 cell (gray) with R7→Mi4 (purple) and R8→Mi4 synapses (green). Right: Layer distribution (in synapses/μm) of all R7 and R8 inputs to four Mi4 cells.(D ) Left: Side view of a reconstructed Mi9 cell (gray) with R7→Mi9 (purple) and R8→Mi9 synapses (green). Right: Layer distribution (in synapses/μm) of all R7 and R8 inputs to four Mi9 cells. In the pale seed columns, Mi9 cells received many R8 synapses, but only received one R8 synapse in the yellow seed columns.( B–D) Scale bars: 10 μm.
Figure 4 with 2 supplements
R7–8 synapses with cell types projecting to the lobula.
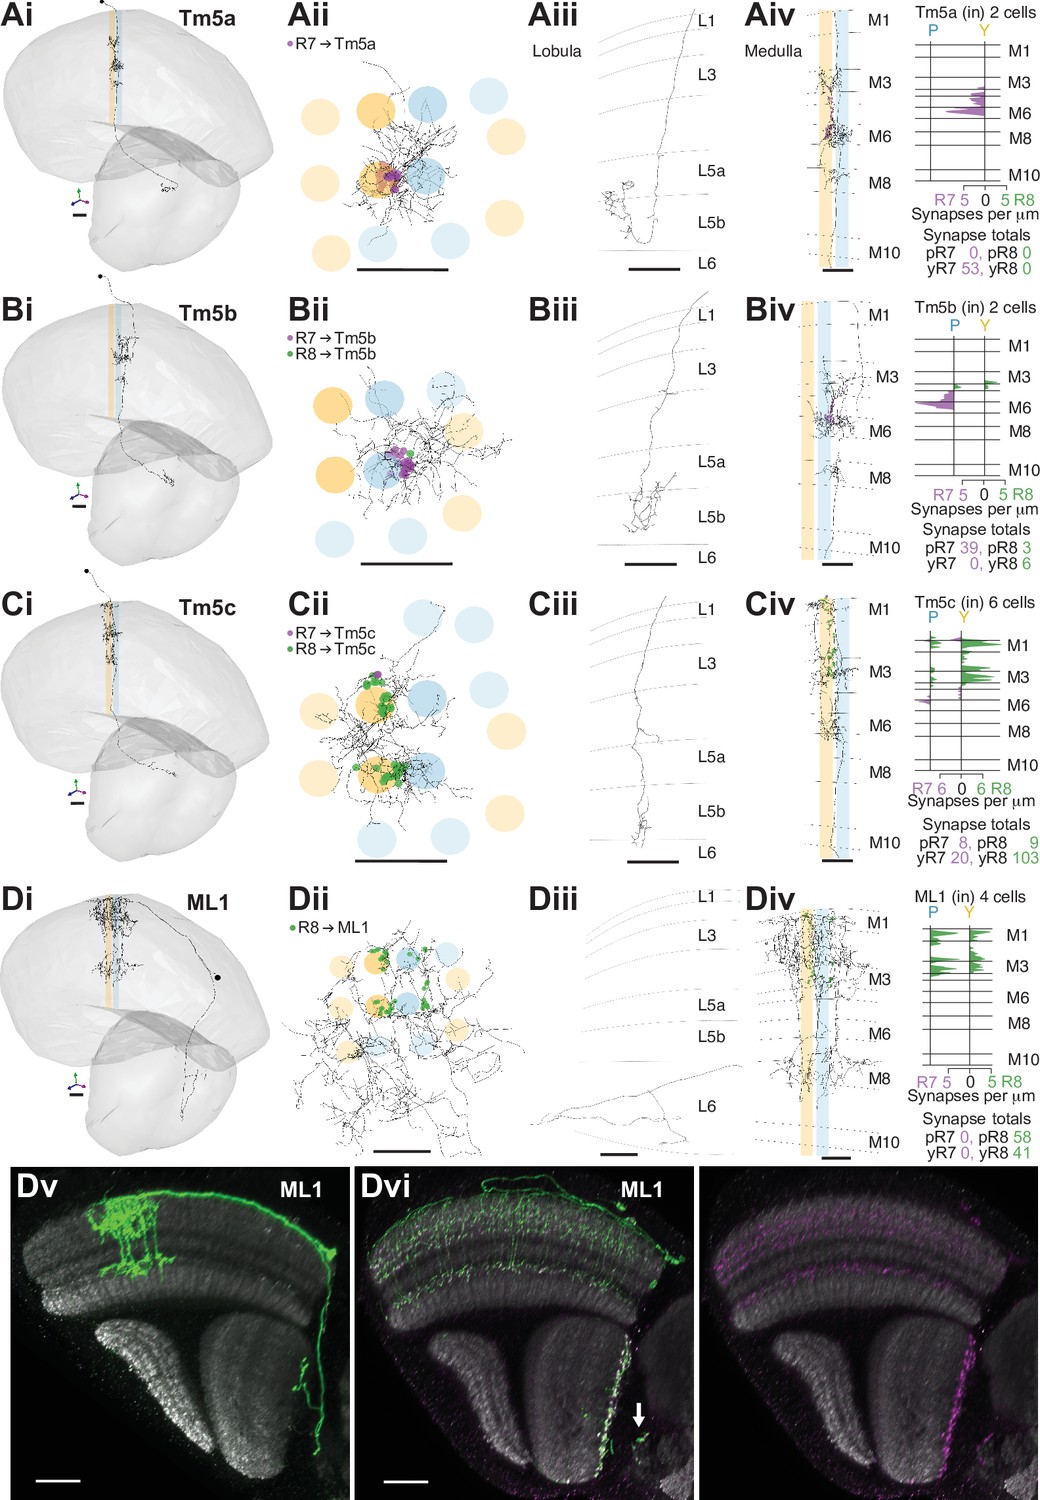
(A–D) Synapses between R7 and R8 and Tm5a (A), Tm5b (B), Tm5c, (C) and ML1 (D) cell types. R7 synapses are indicated in purple, R8 synapses in green. Scale bars: 10 µm. Panels i–iii: Anatomy of fully reconstructed cells. (i) Side view. (ii) Top view. (iii) Side view of axon terminals in the lobula. (iv) Left: Side view of medulla branches. Right: Layer distribution of R7 and R8 inputs. (A) Tm5a. Two Tm5a cells were exclusively targeted by yellow R7 cells.( B) Tm5b. The two Tm5b cells were highly biased to pale R7 inputs. (C) Tm5c. The five Tm5c cells were highly biased to yellow R8 inputs. (D) ML1. Scale bars: 20 µm. (Dv) Side view of a single MCFO-labeled ML1 cell (light microscopy). Note this cell has terminals both at the base of the deepest lobula layer and in the central brain; not all examined ML1 cells have terminals in the central brain. (Dvi) Side view showing the distribution of a membrane marker (green) and presynaptic marker (synaptotagmin-HA, purple) in ML1 cells imaged as a population. The combined patterns (left) and the presynaptic marker alone (right) are shown. Arrow indicates central brain terminals.
Figure 4—figure supplement 1
Additional connections of R7–8 to cell types projecting to the lobula.
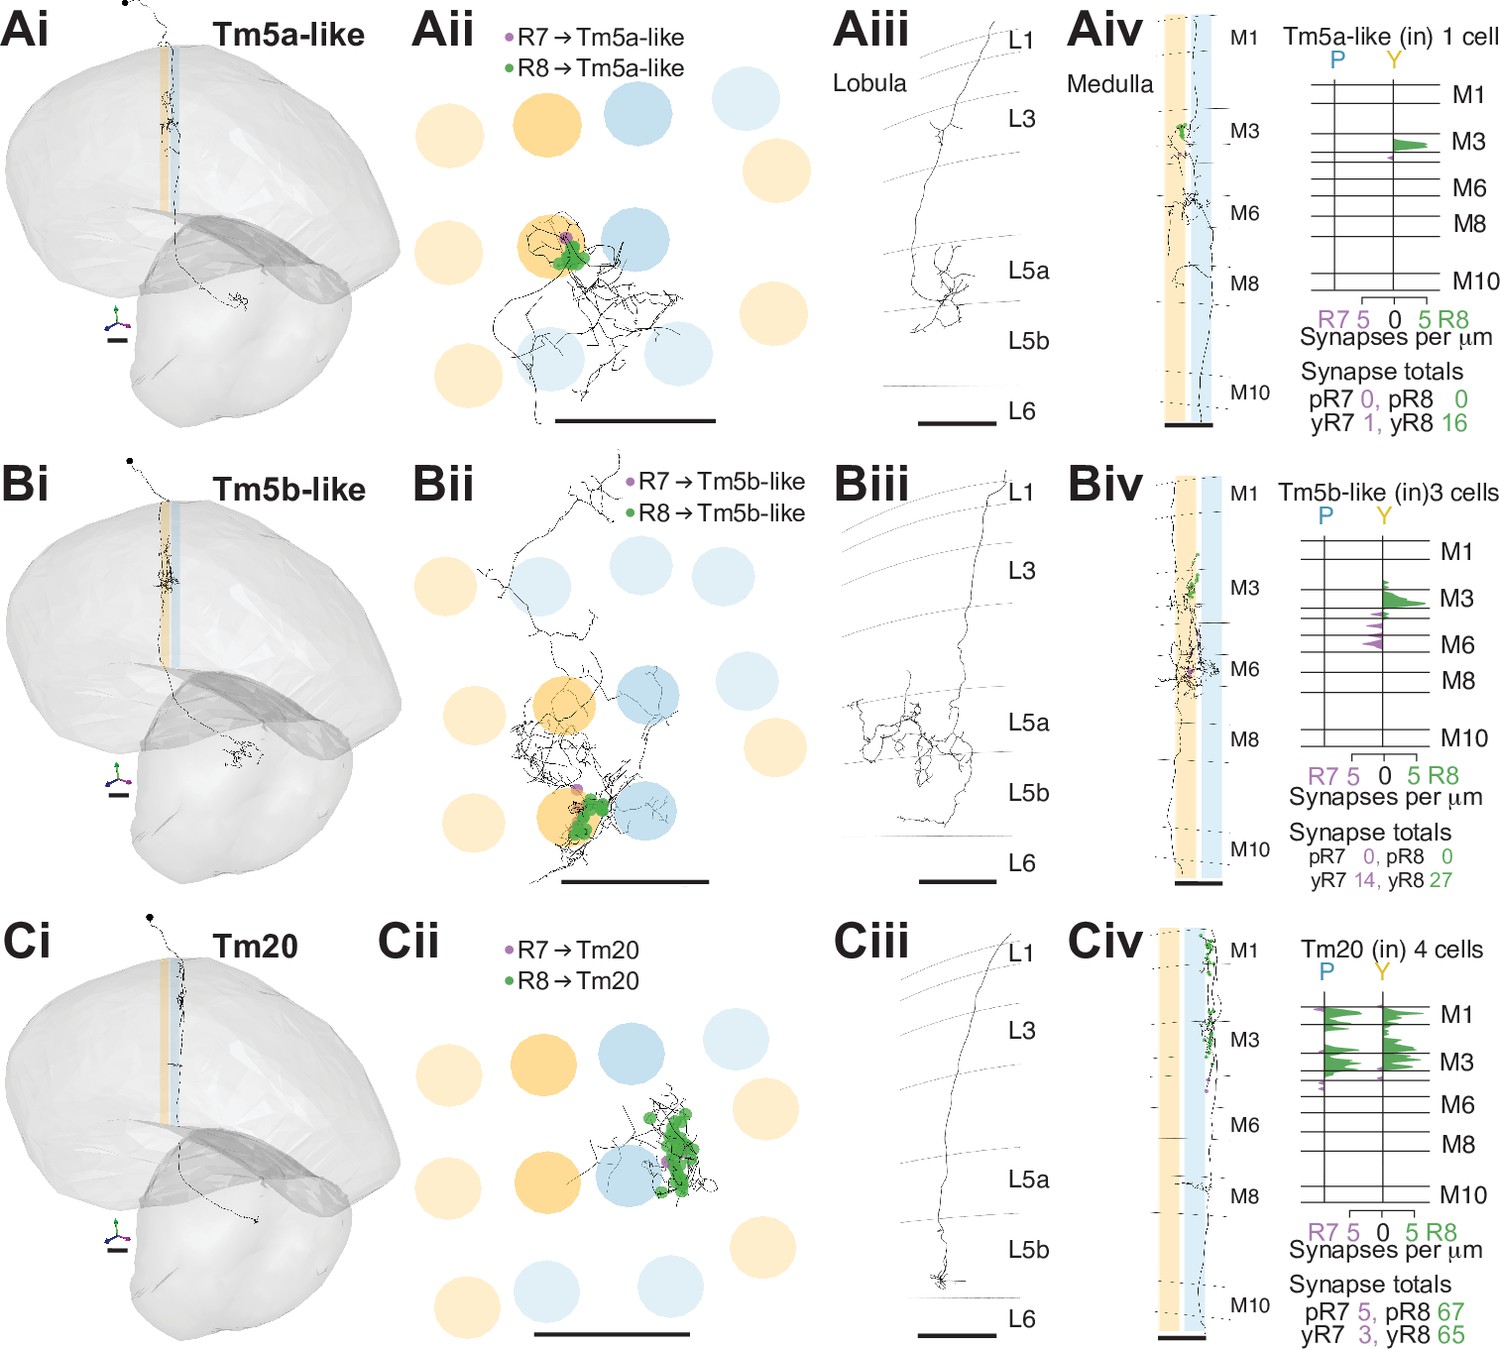
(A–D) Synapses between R7 and R8 and Tm5a-like (A), Tm5b-like (B), and Tm20 (C) cell types. R7 synapses are indicated in purple, R8 synapses in green. Scale bars: 10 µm. Panels i–iii: Anatomy of fully reconstructed cells. (i) Side view. (ii) Top view. (iii) Side view of axon terminals in the lobula. (iv) Left: Side view of medulla branches. Right: Layer distribution of R7 and R8 inputs. (A) R7 and R8 connections with the Tm5a-like cell, which has a morphology similar to a Tm5a cell, but a different pattern of connectivity. The same reconstructed cell is shown in Ai–iii. (B) R7 and R8 connections with three Tm5b-like cells, that each have a morphology similar to a Tm5b cell, but a different, shared pattern of connectivity. The same reconstructed Tm5b-like cell is shown in Bi–iii. (C) R7 and R8 connections with Tm20 cells. The same reconstructed Tm20 cell is shown in Ci–iii.
Figure 4—figure supplement 2
ML1 arbor distribution in the medulla and lobula.
Scale bars in (Ai,Aii) represent 20 µm. The other panels are shown at a similar scale. Images show views generated from image stacks (see Materials and methods). Images show a top view of the array of column in the lobula (top panels, lower part of each image) or the medulla (lower panels), respectively. (A) As a population, ML1 cells appear not to cover all visual columns in the lobula (Ai) but do cover the entire medulla (Aii). Note absence of the green ML1 membrane label near the dorsal and ventral margin of the lobula but not the medulla. (B,C) Lobula (Bi,Ci) and medulla (Bii,Cii) arbors of two groups of MCFO-labeled ML1 cells. The retinotopic array of ML1 cells in the medulla (Bii,Cii) is only partly reflected in the positions of their axon terminals (Bi,Ci) in or near the lobula. For example, cells near the medulla edge have terminals away from the margin of the lobula.
Figure 5 with 2 supplements
Visual projection neurons (VPN) connecting R7–8 with the central brain.
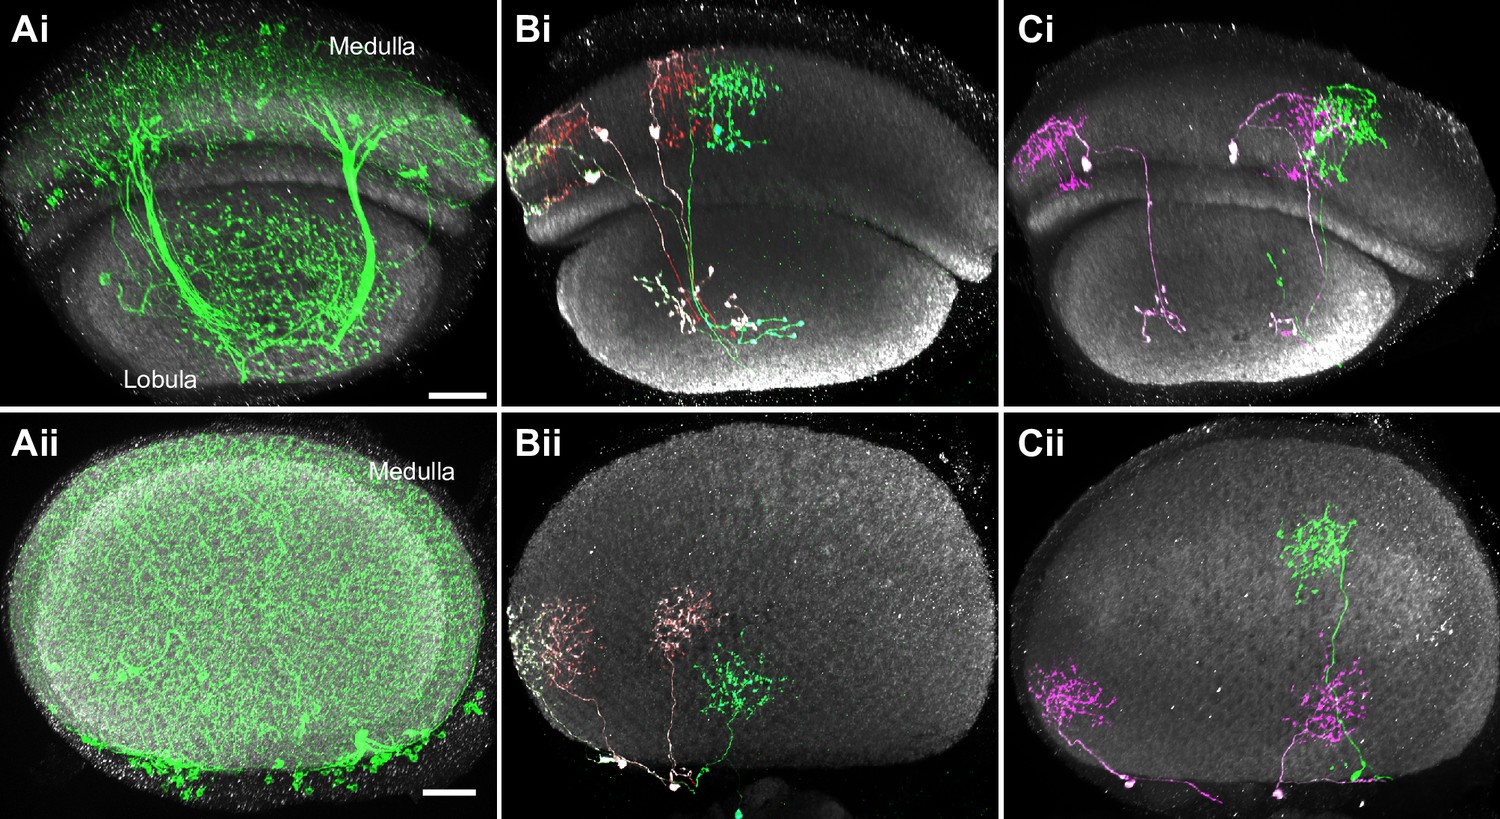
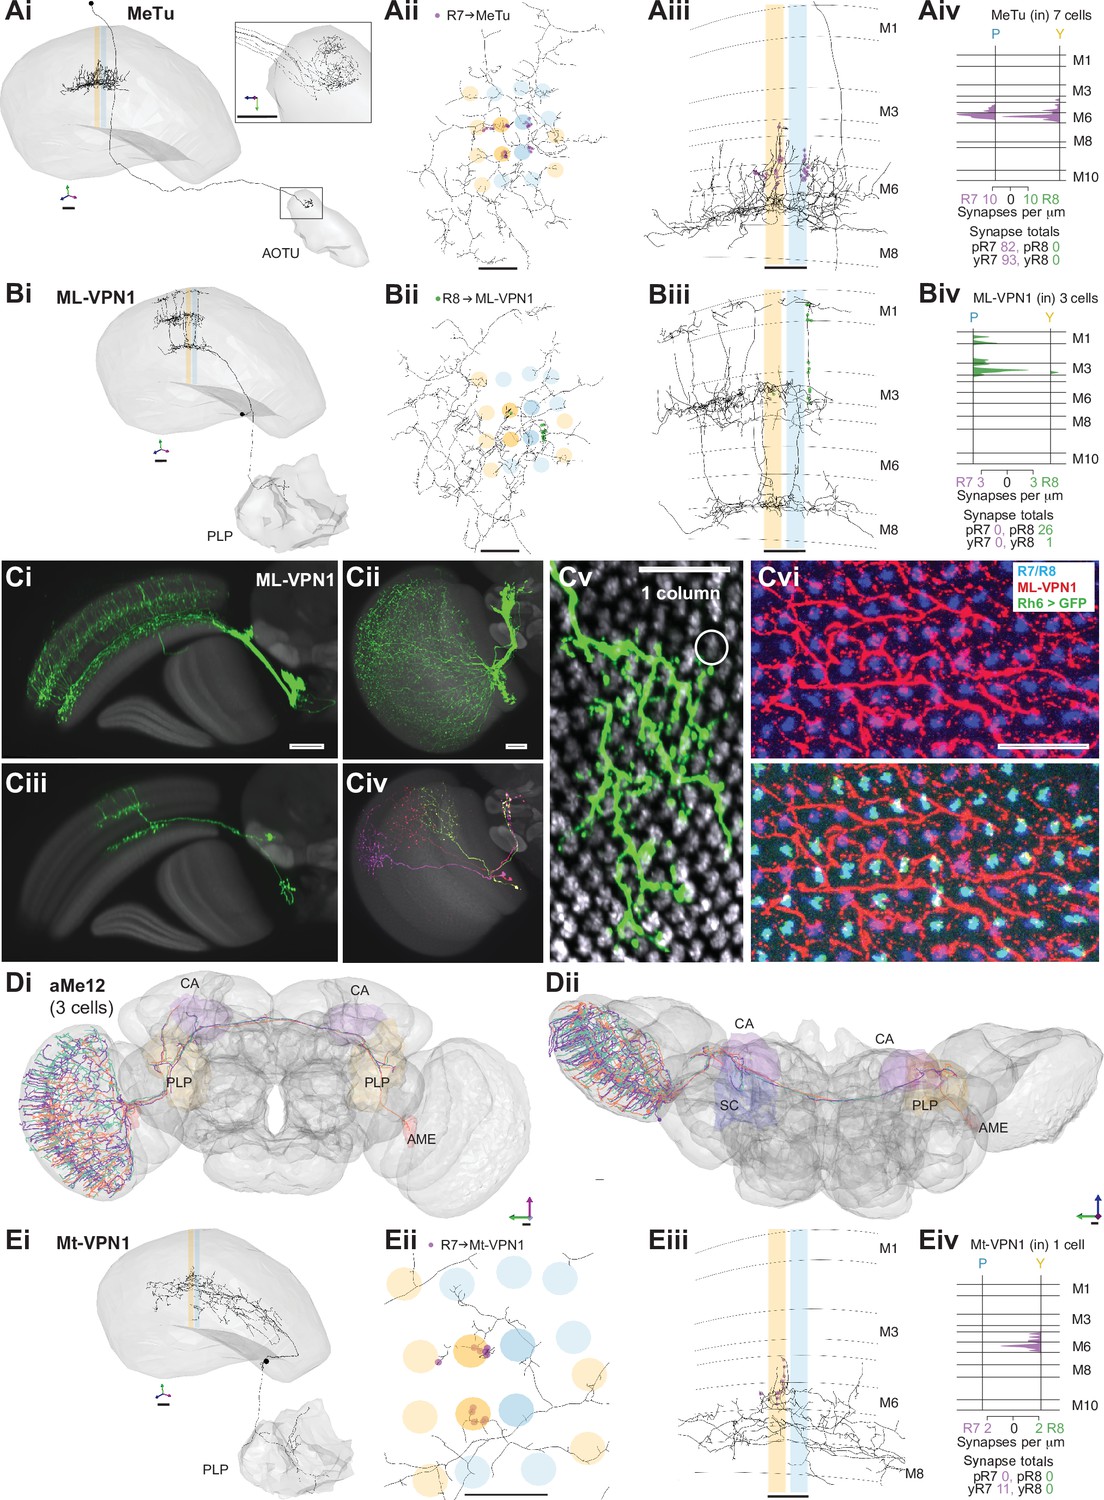
(A,B,E) Synapses between R7 and R8 and MeTu (A), ML-VPN1 (B), and Mt-VPN1 (E) cells. Panels i–iii: Anatomy of reconstructed cells. (i) Side view. (ii) Top view. (iii) Side view of medulla branches. R7 synapses are indicated in purple, R8 synapses in green in ii, iii. (iv) Layer distribution of R7 and R8 inputs. Scale bars: 10 µm. (A) The MeTu cell shown was fully reconstructed. (Ai) Inset shows a magnified view of axon projections to the anterior optic tubercle (AOTU). (Aiv) All seven MeTu cells were exclusively R7 targets. (B) The ML-VPN1 cell shown was fully reconstructed. (Bi) ML-VPN1 cells project to the PLP. (Biv) Both ML-VPN1 cells were pale R8 targets. (Ci–vi) Light microscopy of ML-VPN1 anatomy. (Ci,Cii) Side view (Ci) and top view (Cii) of the population of ML-VPN1 cells. (Ciii) Side view of a single MCFO-labeled ML-VPN1 cells. (Civ) Top view of multiple MCFO-labeled ML-VPN1 cells. (Cv) Overlay of arbors of a single cell ML-VPN1 cell with L2 terminals (gray) indicating medulla columns. Images in Ci–Cv show overlays of aligned confocal images with the standard brain used for registration (Ci–iv) or a second registered image showing L2 terminals (Cv). (Cvi) Confocal substack projection showing medulla columns at approximately the level of R8 terminals. ML-VPN1 (red) and photoreceptor axons (blue) are shown without (top) and with (bottom) labeling of yellow R8 axons (Rh6> green). Overlap between ML1 and photoreceptors is largely limited to pale columns (i.e. columns without the Rh6 marker). (Ci–vi) Scale bars: 20 µm. (D) Reconstructions of three aMe12 cells (orange, turquoise, purple) covering the entire medulla, with axons leaving via the accessory medulla and innervating the mushroom body calyces (CA) and the PLP and accessory medulla (AME) of both hemispheres. (Di) Frontal view. (Dii) Dorsal view. (E) Mt-VPN1 cells. (Eiv) Tracing of Mt-VPN1 photoreceptor synapses in 16 additional columns did not confirm yellow specificity found in the seed columns.
Figure 5—figure supplement 1

Pale-specificity of ML-VPN1.
(A) Side view of R7 and R8 photoreceptors (blue) and ML-VPN1 cells (red), without (Ai) and with (Aii) Rh5 expression (green), from confocal microscopy. (Ai) Four vertical processes that traverse layers 1–3 are labeled by arrows; in our electron microscopy (EM) reconstructions the photoreceptor synapses were largely located on such characteristic processes (Figure 5Biii). Most vertical processes that followed photoreceptors (long arrows, left) were in pale (Rh5-positive) columns; vertical processes that did not follow photoreceptors (short arrows, right) were frequently found in yellow (Rh5-negative) columns or could not be readily assigned to a column. (B) Projection through a few adjacent confocal slices showing ML-VPN1 and photoreceptor axons at approximately the level of R8 terminals, with color-coded image channels as in A, without (Bi) and with (Bii) pale R8 columns labeled by the Rh5 marker. Overlap between ML1 and R-cells is largely limited to pale columns. For example, out of 43 putative overlaps circled (Biii), only four did not overlap with pale R8 expression (Biv, yellow thick circles), indicating that 93% of putative innervated columns were pale in this image. (A–B) Scale bars: 20 μm.
Figure 5—figure supplement 2
All additional neurons connecting R7–8 to the central brain with ≥3 synapses.
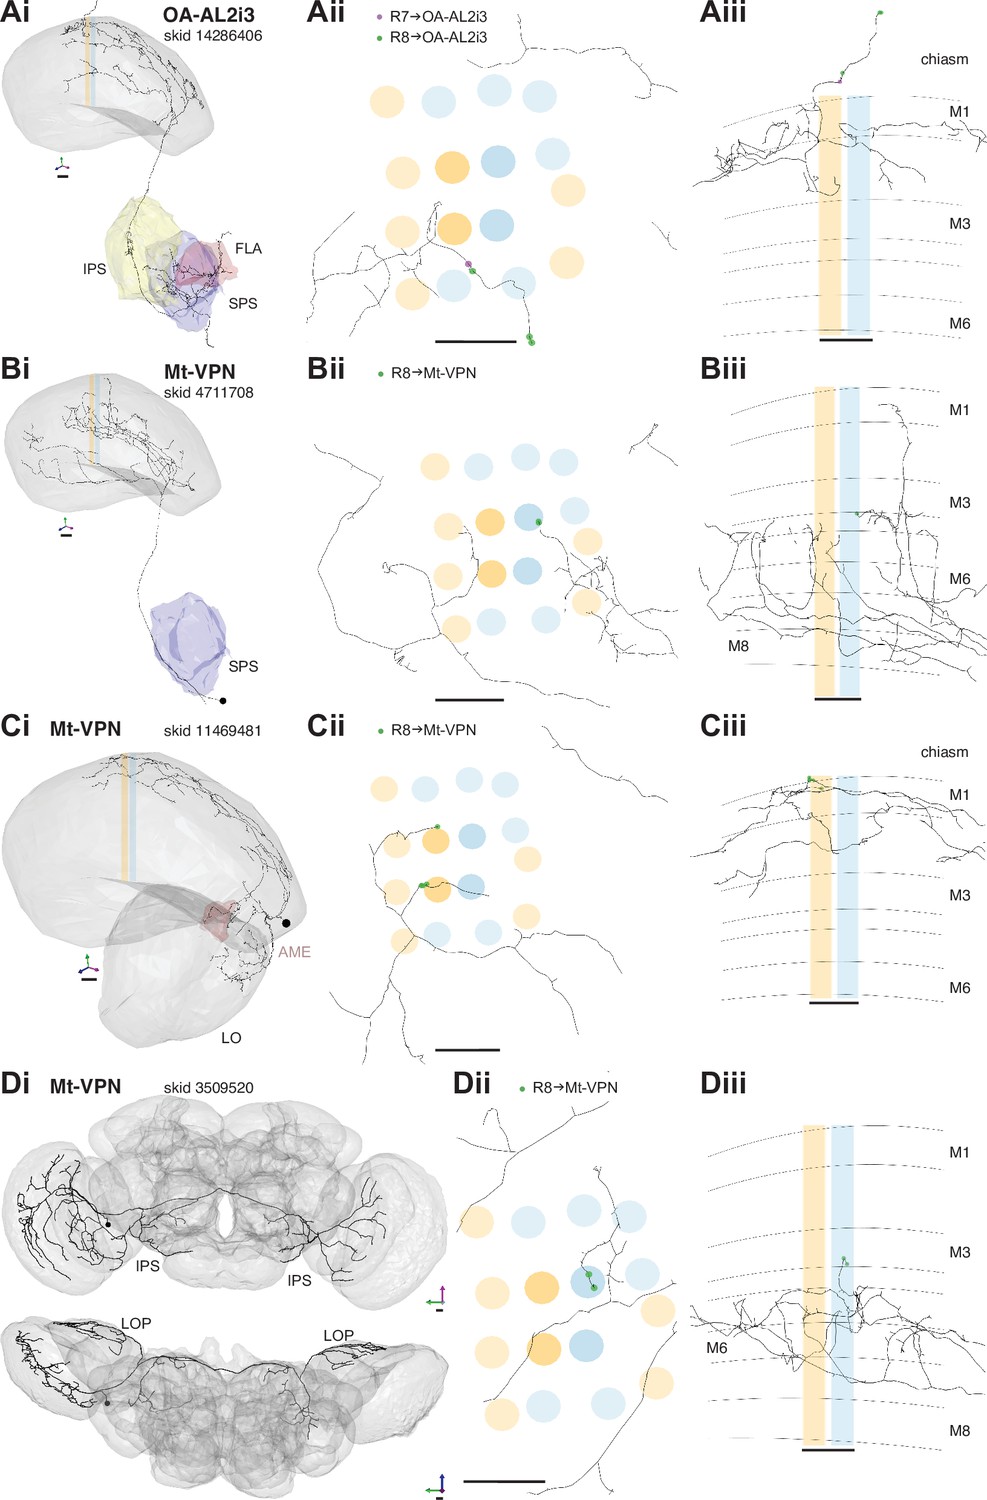
(A) R7 and R8 connections with a neuron matching the anatomy of a known octopaminergic cell type (OA-AL2i3, skid 14286406). The same reconstructed cell is shown in Ai–iii. (Ai) Side view, showing the projections to the flange (Fla), inferior posterior slope (IPS), and superior posterior slope (SPS). (Aii) Top view with R7 (purple) and R8 (green) synapses. (Aiii) Side view with R7 (purple) and R8 (green) synapses. The cell has processes leaving the medulla that track the photoreceptors, where it received synaptic input in our seed columns. Synapse totals: one yellow R7, three yellow R8. (B) R8 connections with the reconstructed Mt-VPN cell with skid 11453464. (Bi) Side view, showing the projection to the SPS. (Bii) Top view with R8 (green) synapses. (Biii) Side view with R8 (green) synapses. Synapse totals: 11 yellow R7. (C) R8 connections with the reconstructed Mt-VPN cell with skid 11469481l. (Ci) Side view, showing the projections to the lobula (Lob) and accessory medulla (aMe). (Cii) Top view with R8 (green) synapses. (Ciii) Side view with R8 (green) synapses. Synapse totals: five yellow R8. (D) R8 connections with the reconstructed Mt-VPN cell with skid 3509520, which is also a heterolateral lobula late tangential cell. (Di) Side view, showing the projections to the lobula plate (LP) and IPS in both hemispheres. (Dii) Top view with R8 (green) synapses. (Diii) Side view with R8 (green) synapses. Synapse totals: three pale R8. (A–D) Scale bars: 10 μm.
Figure 6 with 2 supplements
Synapses between R7-dorsal rim area (DRA) and R8-DRA, and with medulla cell types.
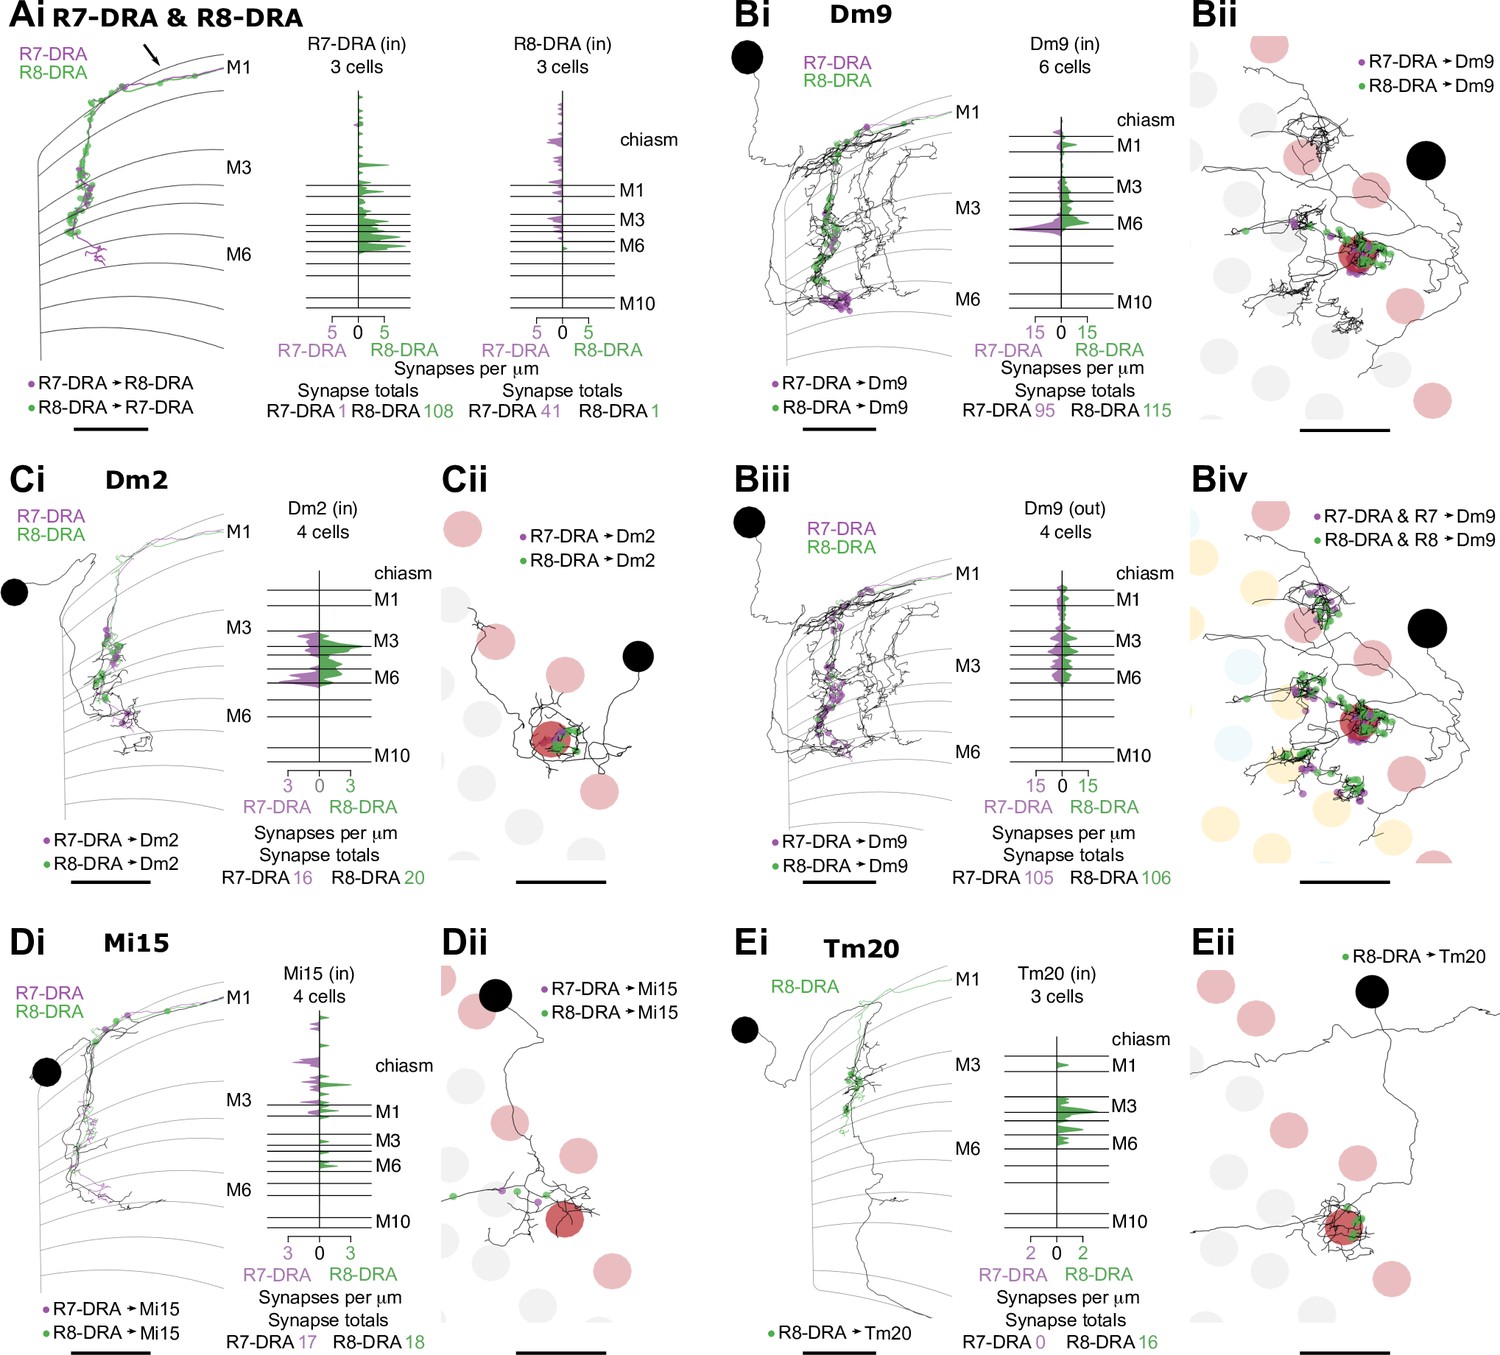
(A) Reciprocal synapses between R7-DRA and R8-DRA. Left: Side view of an R7- and R8-DRA cell with R7-DRA→R8-DRA (purple points) and R8-DRA→R7-DRA (green points). Right: Layer distribution of R7-DRA and R8-DRA reciprocal synapses in three columns. (B) Reciprocal synapses between Dm9 in the DRA region and R7-DRA and R8-DRA. (Bi) Left: Side view of a reconstructed Dm9 skeleton (gray) in the DRA region, with R7-DRA→Dm9 synapses (purple) and R8-DRA→Dm9 synapses (green). Right: Layer distribution of DRA photoreceptor inputs into Dm9. (Bii) Top view of Dm9 cell that connects to photoreceptors in both DRA (light red) and non-DRA columns (gray). (Biii) Left: Feedback synapses from Dm9 to R7-DRA (purple) and R8-DRA (green). Right: Layer distribution of Dm9 inputs into R7-DRA and R8-DRA. (Biv) DRA and non-DRA R7 (purple) and R8 (green) synapses to the same Dm9 cell. (C) Synapses between R7-DRA, R8-DRA, and Dm2. (Ci) Left: Side view of a Dm2 cell with synapses from R7-DRA (purple) and R8-DRA (green). Right: Layer distribution of R7-DRA and R8-DRA synapses onto four Dm2 cells. (Cii) Top view of Dm2 skeleton in the DRA region. (D) Synapses between R7-DRA, R8-DRA, and Mi15. (Di) Left: Side view of a reconstructed Mi15 cell with R7-DRA→Mi15 synapses (purple) and R8-DRA→Mi15 synapses (green). Right: Layer distribution of R7-DRA and R8-DRA synapses to four Mi15 cells. (Dii) Top view of Mi15 skeleton in the DRA region. (E) Synapses between R7-DRA, R8-DRA, and Tm20. (Ei) Left: Side view of a reconstructed Tm20 cell with R8-DRA→Tm20 synapses in green. Right: Layer distribution of R8-DRA input to three Tm20 cells. (Eii) Top view of Tm20 skeleton in the DRA region (all scale bars: 10 µm).
Figure 6—figure supplement 1
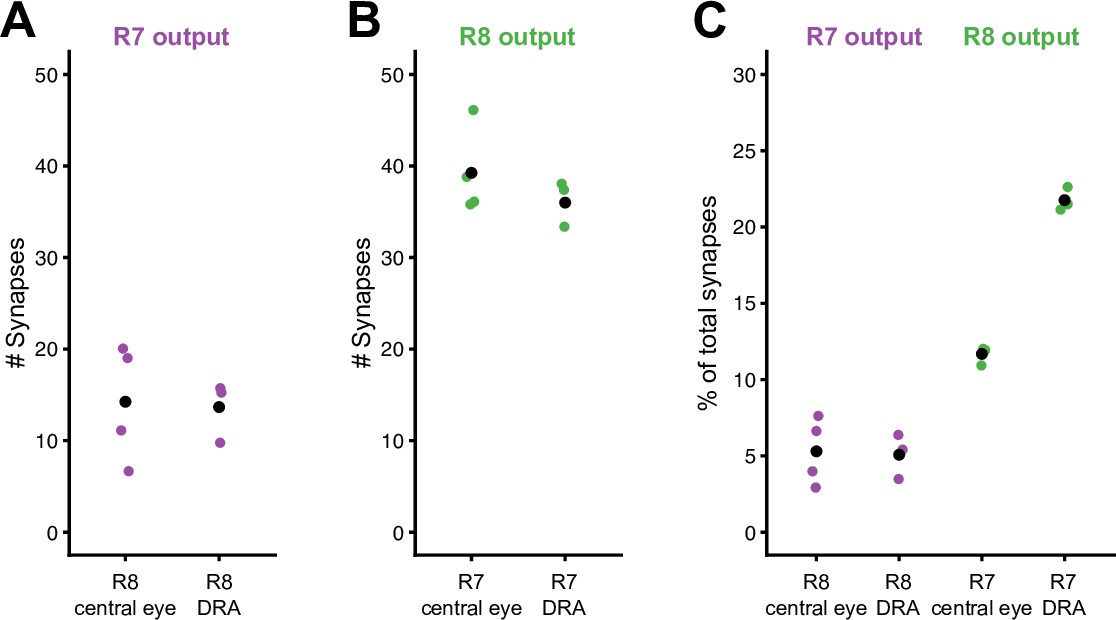
Synapses between inner photoreceptors in both the central and dorsal rim area (DRA) columns.
(A) Total number of R7 synapses onto R8 for all full reconstructed cells in the central columns (4) and R7-DRA onto R8-DRA in the DRA columns (3). (B) Total number of R8 synapses onto R7 for all full reconstructed cells in the central columns (4) and R8-DRA onto R7-DRA in the DRA columns (3). (C) Fraction of photoreceptor-to-photoreceptor synapses of the total output of R7 and R8 in the central columns, and of R7-DRA and R8-DRA in the DRA columns. Individual counts in colored circles mean for each group in black circle.
Figure 6—figure supplement 2

Additional cell types connected to R7-dorsal rim area (DRA) and R8-DRA.
(A) Synapses between R7-DRA, R8-DRA, and L1. (Ai) Left: Side view of a reconstructed L1 skeleton (dark gray), together with R7-DRA (purple) and R8-DRA (green) from the same column plus R7-DRA→L1 synapses (purple) and R8-DRA→L1 synapses (green). Right: Synapse distribution (in synapses/μm) of all three reconstructed L1 cells from the three DRA seed columns across medulla layers. (Aii) Top view of the same L1 cell with R7-DRA→L1 synapses (purple) and R8-DRA→L1 synapses (green). (B) Synapses between R7-DRA, R8-DRA, and L3. (Bi) Left: Side view of a reconstructed L3 skeleton (dark gray), together with R7-DRA (purple) and R8-DRA (green) from the same column plus R7-DRA→L3 synapses (purple) and R8-DRA→L3 synapses (green). Right: Synapse distribution (in synapses/μm) of all three reconstructed L3 cells from the three DRA seed columns across medulla layers. (Bii) Top view of the same L3 cell with R7-DRA→L3 synapses (purple) and R8-DRA→L3 synapses (green). (C) Synapses between R7-DRA, R8-DRA, and Mi1. (Ci) Left: Side view of a reconstructed Mi1 skeleton (dark gray), together with R7-DRA (purple) and R8-DRA (green) from the same column plus R7-DRA→Mi1 synapses (purple) and R8-DRA→Mi1 synapses (green). Right: Synapse distribution (in synapses/μm) of all three reconstructed Mi1 cells from the three DRA seed columns across medulla layers. (Cii) Top view of the same Mi1 cell with R7-DRA→Mi1 synapses (purple) and R8-DRA→Mi1 synapses (green). (D) Synapses between R7-DRA, R8-DRA, and Dm11. (Di) Left: Side view of a reconstructed Dm11 skeleton (dark gray), together with R7-DRA (purple) and R8-DRA (green) plus R7-DRA→Dm11 synapses (purple) and R8-DRA→Dm11 synapses (green). Right: Synapse distribution (in synapses/μm) of one reconstructed Dm11 cell across medulla layers. Note that synapses between R7-DRA and R8-DRA→Dm11 were only found in one of the three DRA seed columns. (Dii) Top view of the same Dm11 cell with R7-DRA→Dm11 synapses (purple) and R8-DRA→Dm11 synapses (green). (E) Synapses between R8-DRA and Mi9. (Ei) Left: Side view of a reconstructed Mi9 skeleton (dark gray), together with R8-DRA (green) from the same column plus R8-DRA→Mi9 synapses (green). Right: Synapse distribution (in synapses/μm) of two reconstructed Mi9 cells across medulla layers. Note that only in two of the three DRA seed columns R8-DRA→Mi9 synapses were found. (Eii) Top view of the same Mi9 cell with R8-DRA→Mi9 synapses (green). (F) Synapses between R8-DRA and a Tm5-like cell. (Fi) Left: Side view of a reconstructed Tm5-like skeleton (dark gray), together with R8-DRA (green) plus R8-DRA→ Tm5-like synapses (green). Right: Synapse distribution (in synapses/μm) of one Tm5-like cell across medulla layers. Note that in only one of the three DRA seed columns was such a cell found. (Fii) Top view of the same Tm5-like cell with R8-DRA→Tm5-like synapses (green). (Fiii) Lobula innervation of the Tm5-like cell.
Figure 7 with 3 supplements

Dm8-like photoreceptor targets in the dorsal rim area (DRA) region.
(A) Synapses between photoreceptors and Dm-DRA1 cells. (Ai) Left: Side view of a reconstructed Dm-DRA1 (gray) innervated by R7-DRA (purple). Right: Distribution of R7-DRA synapses (purple) onto 20 Dm-DRA1 cells, plotted across medulla layers. (Aii) Top view of the same fully reconstructed Dm-DRA1 skeleton and R7-DRA inputs from the (polar) seed column. (Aiii) Top view of a light microscopic Dm-DRA1 single cell clone with processes leaving the DRA region. (B) R7-DRA inputs into Dm-DRA1 cells. (Bi–iii) Three skeletons of fully reconstructed Dm-DRA1 cells (gray) at different positions along the DRA (posterior, polar, and anterior) with all R7-DRA synapses (purple) originating from an average of 11 columns. (Biv) Distribution of R7-DRA synapses onto the three Dm-DRA1 cells from Bi–iii along the DRA region. (C) Synapses between photoreceptors and Dm-DRA2 cells. (Ci) Left: Side view of one reconstructed Dm-DRA2 skeleton (gray) innervated by R8-DRA (green). Right: Layer distribution of DRA photoreceptor synapses onto 9 Dm-DRA2 cells. (Cii) Top view of the same fully reconstructed Dm-DRA2 skeleton and photoreceptor inputs from the (polar) seed column. (Ciii) Side view of a light microscopic Dm-DRA2 single cell clone with vertical processes (arrows in Ci and Ciii indicate vertical projections). (D) Photoreceptor inputs to Dm-DRA2 cells. (Di–iii) Three skeletons of fully reconstructed Dm-DRA2 cells (gray) at different positions along the DRA (posterior, polar, and anterior) with all R8-DRA (green) synapses originating from an average of 11 columns. (Div) Distribution of R8-DRA (and few R7-DRA) synapses onto the three Dm-DRA2 cells from Di–iii along the DRA region. (E) Comparison of Dm-DRA1 and Dm-DRA2 connectivity. All reconstructed Dm-DRA1 skeletons connected to R7-DRA in the polar seed column (circled column, arrow). The saturation of blue color indicates strength of connectivity (from 3 to 15 synapses). (Eii) All Dm-DRA2 skeletons connected to R8-DRA in the polar seed column (circled column, arrow), blue color indicates the strength of connectivity (from 2 to 19 synapses). (Eiii) Side views of overlapping Dm-DRA1 and Dm-DRA2 cell skeletons with all R7-DRA and R8-DRA synapses (same cells as in Bii and Dii) (all scale bars: 10 µm).
Figure 7—figure supplement 1
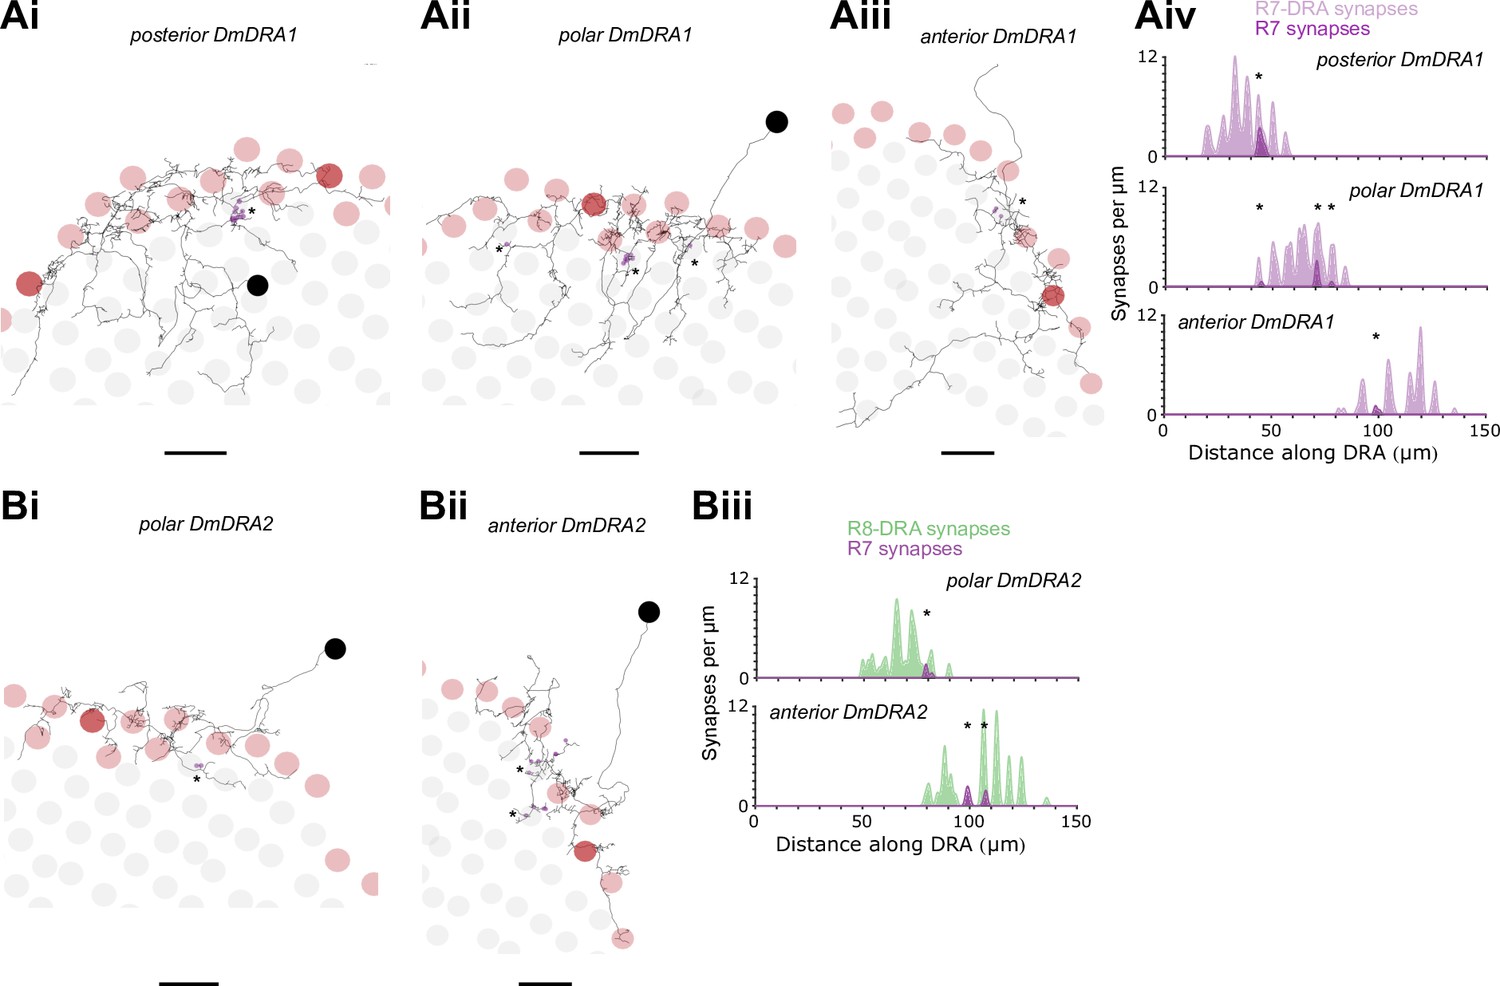
Non-dorsal rim area (DRA) photoreceptor inputs to Dm-DRA cells.
(A) Top view (Ai–Aiii) of three fully reconstructed Dm-DRA1 cells (same as in Figure 7B) with all non-DRA R7 inputs marked (purple dots), as well as distribution of synapses along the DRA region (Aiv). Note the strong inputs into the posterior Dm-DRA1 cell, originating from an R7 cell at the DRA/non-DRA boundary, with a putative ‘mixed’ fate (Ai). (B) Top view (Bi–Bii) of two fully reconstructed Dm-DRA2 cells (same as in Figure 7D) with all non-DRA R7 inputs marked (purple dots), as well as distribution of synapses along the DRA region (Biii). Note that no non-DRA R7 synapses were found for the posterior Dm-DRA2.
Figure 7—figure supplement 2

Deep projections of Dm-DRA1 cells.
(A) Top view (Ai–Aiii) of three fully traced Dm-DRA1 cells (same as in Figure 7B) with pale and yellow fates of all non-DRA columns indicated. Deep projections of Dm-DRA1 cells do not seem to show any obvious preference for pale or yellow columns (all scale bars: 10 µm).
Figure 7—figure supplement 3
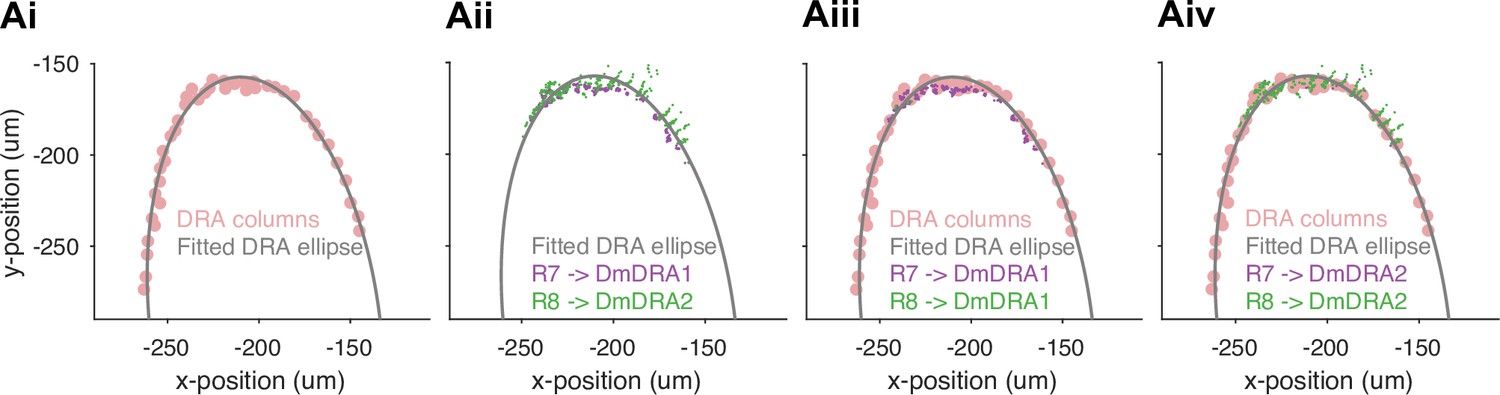
Fitting a linear distance of synapses along the dorsal rim area (DRA) region.
(Ai) The lateral locations of the 42 DRA columns (pink circles) were used to fit an ellipse (black line) along the DRA, where the lateral x- and y-coordinates are points in a plane that is approximately parallel to the medulla layers, and this plane does not take into account the curvature of the medulla. At the dorsal pole, there are DRA columns in two rows, and the ellipse passes between these. (Aii) The alignment of R7 (purple) synapses to Dm-DRA1 cells and R8 (green) synapses to Dm-DRA2 vary along an axis that is approximately perpendicular to the ellipse, partly due to differences in the locations of the synapses, and partly an effect of the curvature of the medulla. For all the synapses, the projection onto the fitted DRA ellipse provides a good description of the location along the DRA region. (Aiii) Synapses from R7 (purple) to Dm-DRA1 cells shown with the Mi1 columns (pink circles) to appreciate their locations in the columns. The synapses are concentrated around layer 6, and this narrow depth profile generates tightly clustered synaptic locations in columns. (Aiv) Synapses from R8 (green) to Dm-DRA2 cells shown with the DRA columns (pink circles) to appreciate their locations in the columns. The synapses are spread between the chiasm and layer 6, and this diffuse depth profile contributes to the wide, linear clusters of synapses as the medulla curves away from the plane containing the fitted DRA ellipse.
Figure 8 with 1 supplement
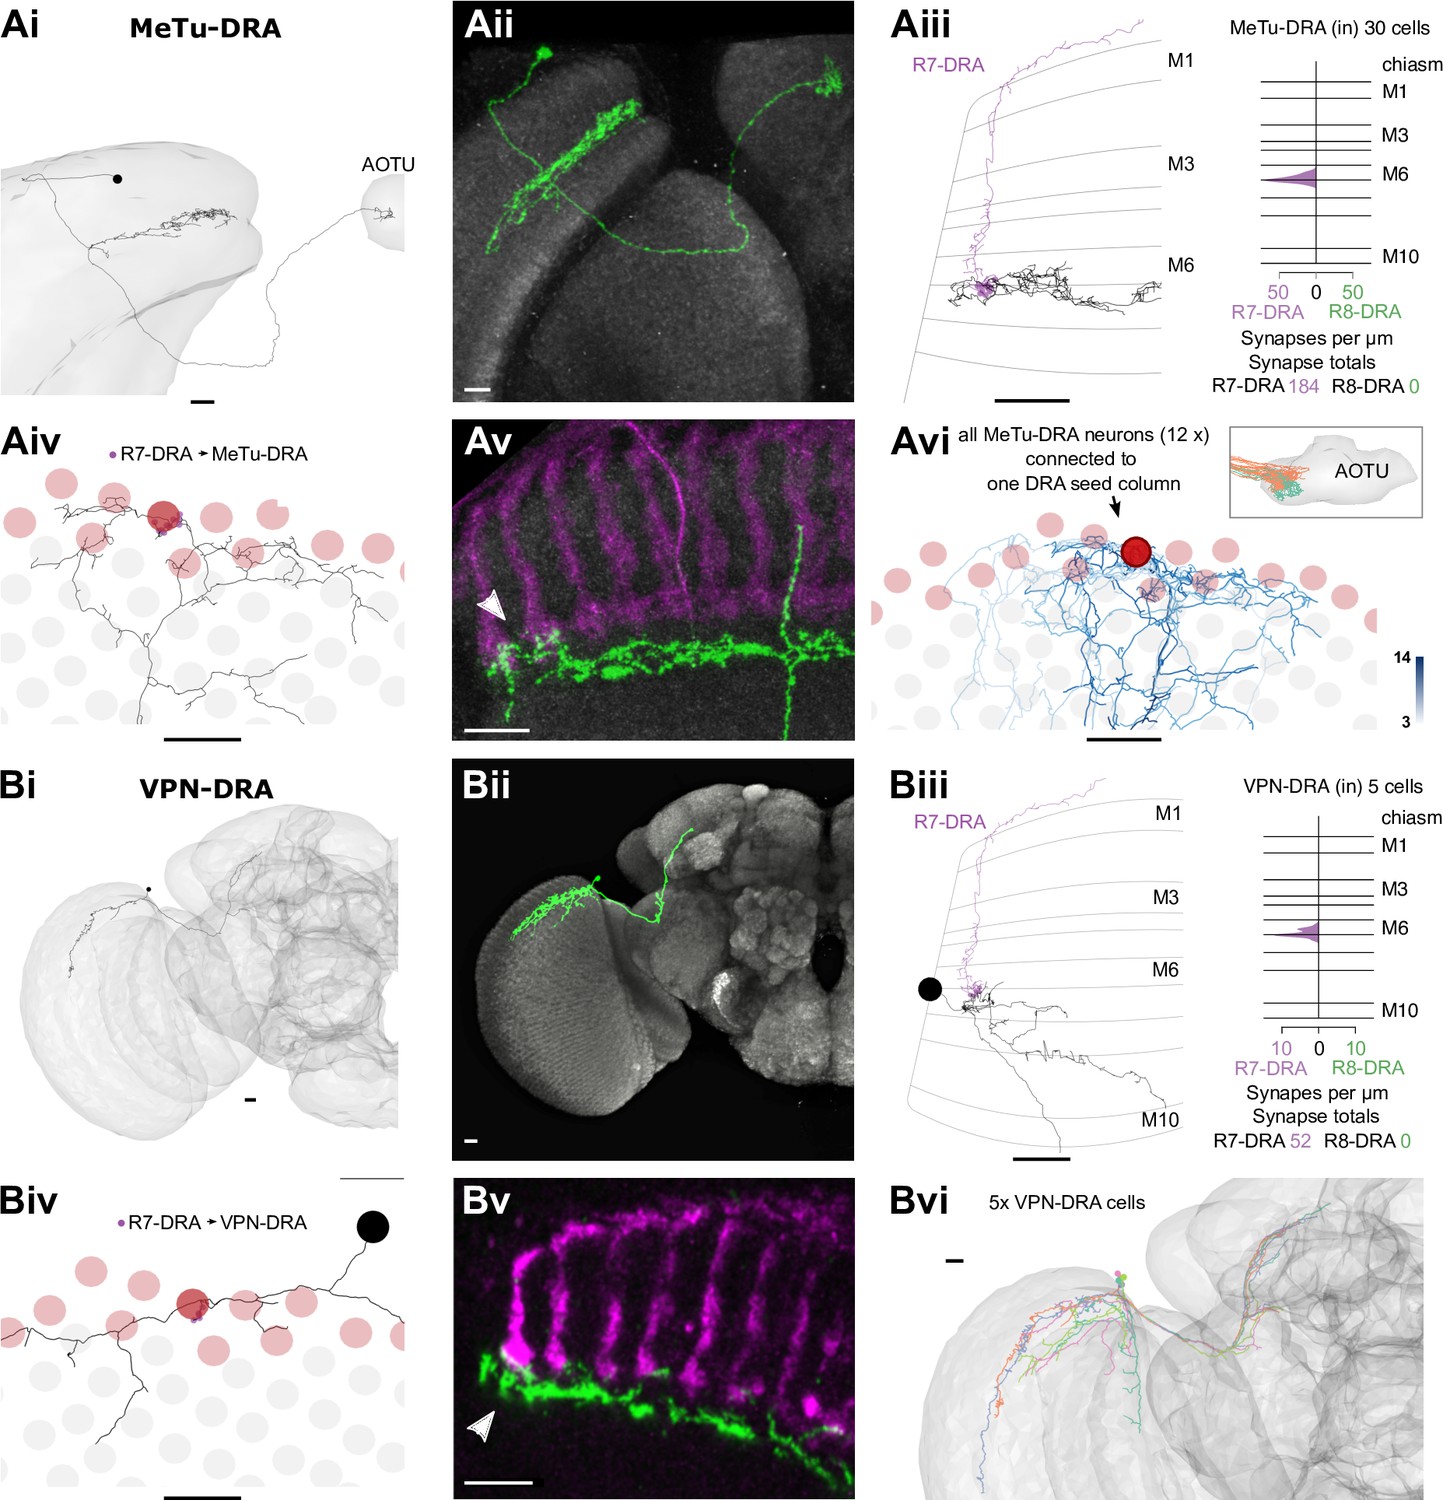
Visual projection neurons (VPNs) connecting R7-dorsal rim area (DRA) with the central brain.
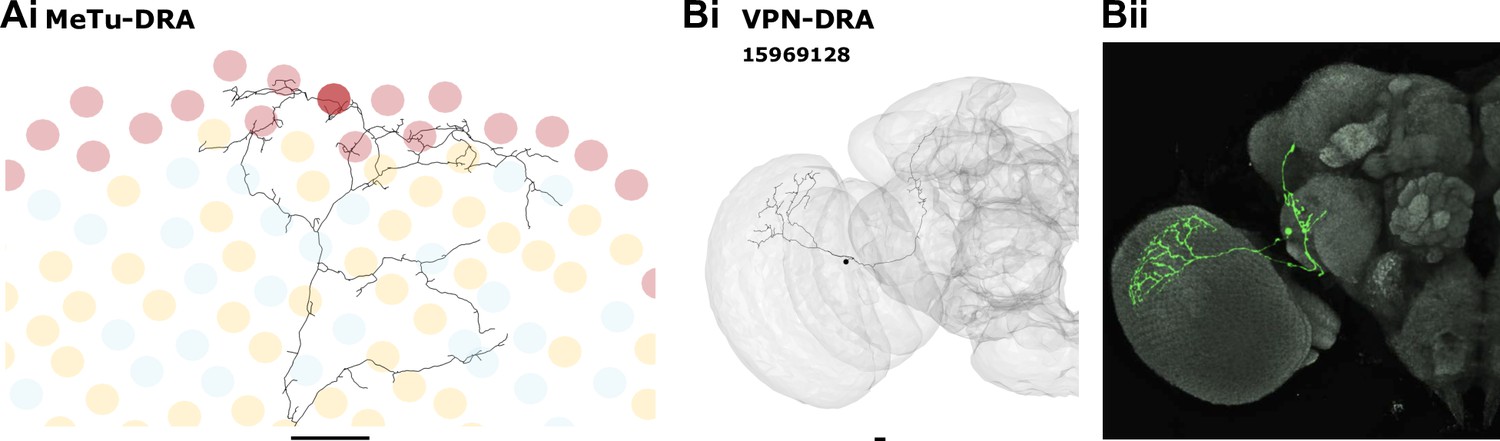
(A) Synapses of R7-DRA onto MeTu-DRA cells. (Ai) The complete skeleton of a fully reconstructed MeTu-DRA cell with an axon projecting to the anterior optic tubercle (AOTU). (Aii) Light microscopic single cell clone of an MeTu-DRA cell. (Aiii) Left: Side view of the same MeTu-DRA skeleton (gray) as in Ai innervated by R7-DRA (purple). Right: Layer distribution of R7-DRA synapses (purple) onto 30 MeTu-DRA cells. (Aiv) Top view of the MeTu-DRA skeleton depicting its medulla processes innervating both DRA (red circles) and non-DRA columns. (Avi) Light microscopic side view of an MeTu-DRA single cell clone (green) with exclusive contacts to DRA photoreceptor terminals (white arrowhead). (Avi) All MeTu-DRA skeletons connected to R7-DRA in the polar seed column (circled column, arrow). The saturation of blue color indicates the strength of connectivity (from 3 to 14 synapses). Inset: MeTu-DRA axon terminations in the AOTU in orange and reconstructed MeTu cells from the central columns in cyan. (B) Synapses between R7-DRA and VPN-DRA. (Bi) The entire skeleton of a reconstructed VPN-DRA cell with its axon projecting to the PLP. (Bii) Light microscopic image of a VPN-DRA single cell clone shown in green and neuropil reference in gray (Nc82). (Biii) Left: Side view of one VPN-DRA skeleton (gray) innervated by R7-DRA (purple). Right: Layer distribution of R7-DRA synapses onto fiveVPN-DRA cells. (Biv) Top view of medulla processes formed by one reconstructed VPN-DRA skeleton (gray) with all R7-DRA synapses from the seed column (purple). (Bv) Double labeling of several VPN-DRA cells (green) with R7 and R8 photoreceptors (purple, anti-Chaoptin). VPN-DRA processes overlap with DRA photoreceptors (white arrowhead) but also appear to show some contacts to non-DRA photoreceptors. (Bvi) Skeletons of all reconstructed VPN-DRA cells covering the dorsal medulla (all scale bars: 10 µm).
Figure 8—figure supplement 1
Visual projection neuron (VPN) morphology in the dorsal rim area (DRA) region.
(A) Top view of the fully traced MeTu-DRA cell (same as in Figure 7A) with pale and yellow fates of all non-DRA ommatidia indicated. Medulla processes of MeTu-DRA do not seem to show any obvious preference for pale or yellow columns. Scale bar: 10 µm. (B) Reconstructed skeleton (Bi) of an unusual VPN-DRA cell with additional processes in the central brain (putative VPN-DRA2). Light microscopic image of a cell with similar morphology (Bii).
Figure 9 with 1 supplement
Other newly identified photoreceptor targets in the dorsal rim area (DRA) region.
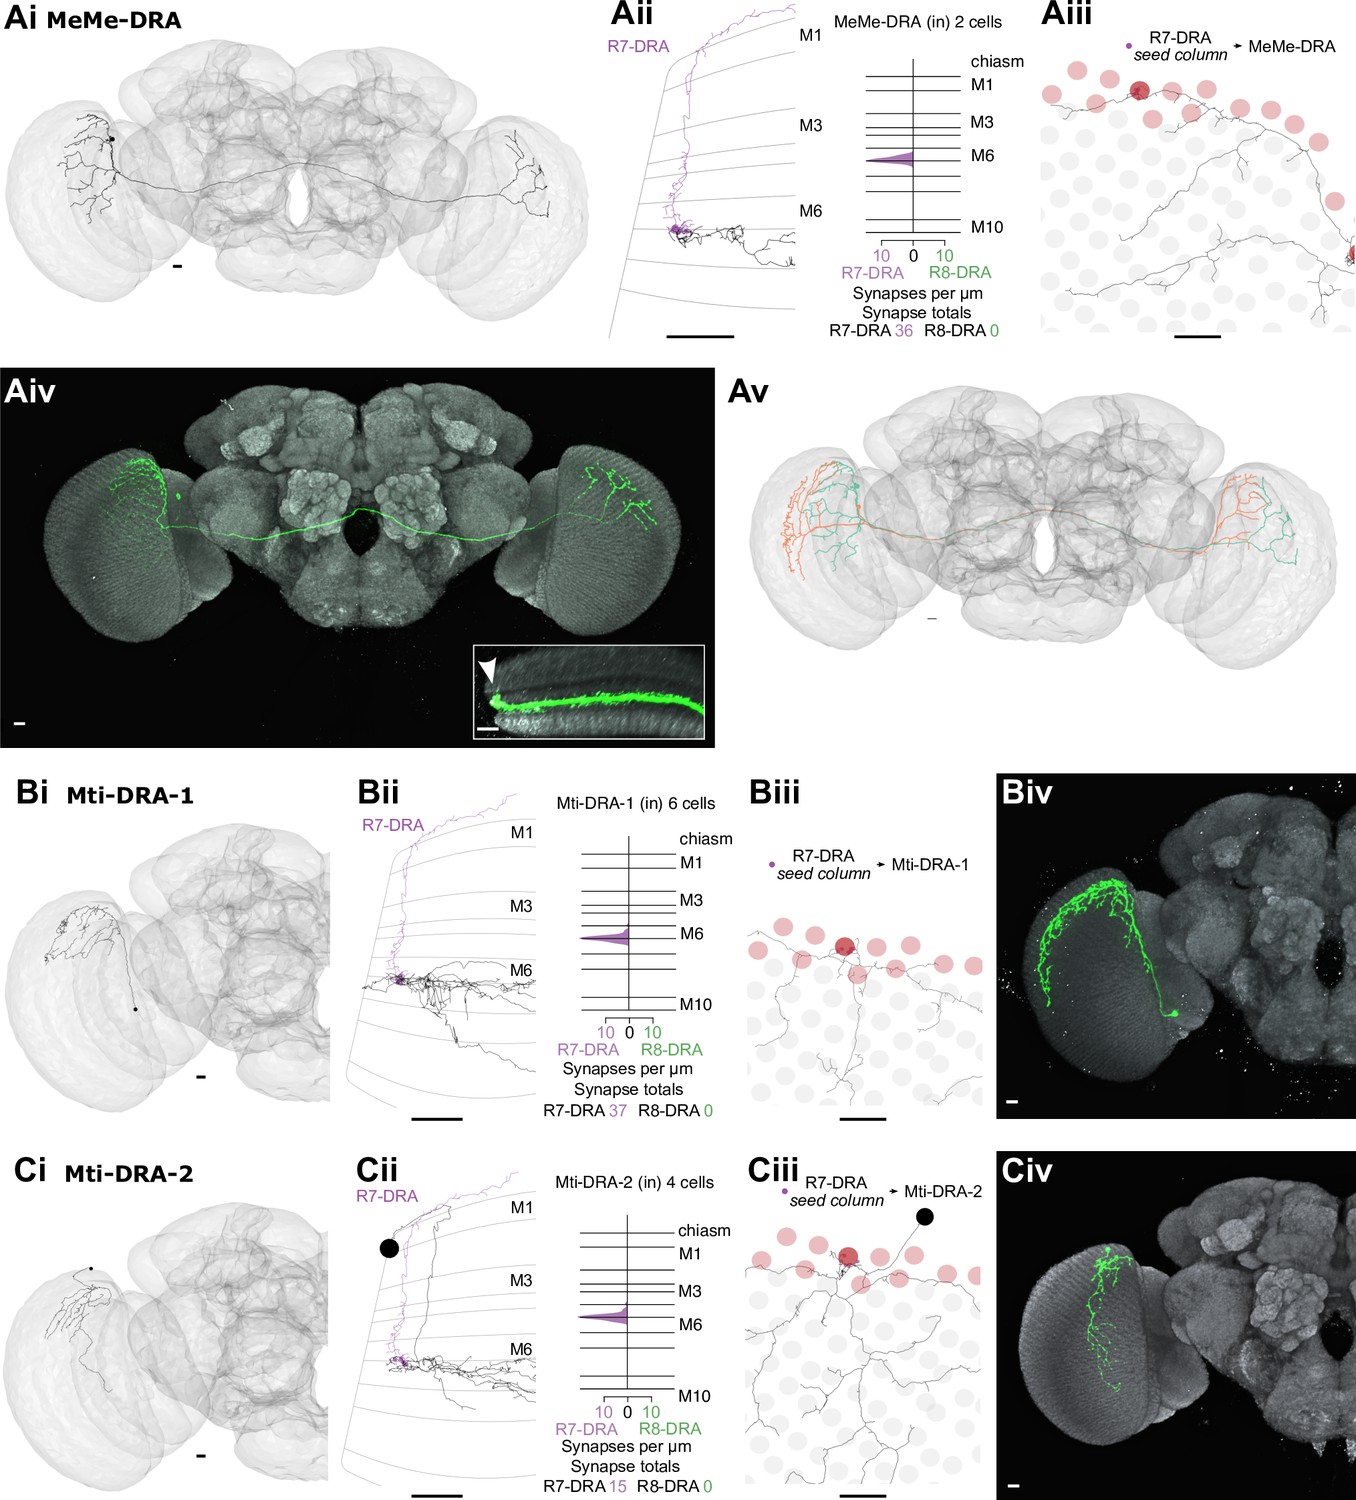
(A) Synapses from R7-DRA to bilaterally projecting MeMe-DRA neurons. (Ai) A reconstructed MeMe-DRA cell with projections to the dorsal periphery of the contralateral medulla. (Aii) Left: Side view of one MeMe-DRA skeleton (gray) innervated by R7-DRA (purple). Right: Layer distribution of R7-DRA synapses onto two MeMe-DRA cells. (Aiii) Top view of medulla processes of the MeMe-DRA skeleton (gray) with all R7-DRA synapses from the seed columns (purple). (Aiv) Light microscopic image of a MeMe-DRA single cell clone shown (in green) with processes to the contralateral medulla (neuropil reference in gray, Nc82). Inset: Medulla cross section showing branches of a MeMe-DRA cell. Note that the most dorsal arbors innervate the distal medulla (arrowhead). (Av) Two reconstructed MeMe-DRA skeletons, both with cell bodies on the left side (cyan and orange), connecting both medullas in a reciprocal manner, innervating opposite DRA regions along the anterior-posterior axis. (B) Synapses from R7-DRA onto Mti-DRA-1. (Bi) A reconstructed Mti-DRA-1 cell with processes covering the dorsal periphery of the medulla. (Bii) Left: Side view of one Mti-DRA-1 skeleton (gray) innervated by R7-DRA (purple). Right: Layer distribution of R7-DRA synapses onto six Mti-DRA-1 cells. (Biii) Top view of medulla processes of one reconstructed Mti-DRA-1 cell (gray) with all R7-DRA synapses from the (polar) seed column (purple). (Biv) Light microscopic image of a putative morphological single cell match of Mti-DRA-1 shown in green. (C) Synapses from R7-DRA onto Mti-DRA-2. (Ci) A reconstructed Mti-DRA-2 cell with processes covering dorsal parts of the medulla. (Cii) Left: Side view of one Mti-DRA-2 skeleton (gray) innervated by R7-DRA (purple). Right: Layer distribution of R7-DRA synapses onto four Mti-DRA-2 cells. (Ciii) Top view of medulla processes formed by one reconstructed Mti-DRA-2 cell (gray) with all R7-DRA synapses from the (polar) seed columns (purple). (Cv) Light microscopic image of a putative morphological single cell match of Mti-DRA-2 shown in green (all scale bars: 10 µm).
Figure 9—figure supplement 1

Mti cells in the dorsal rim area (DRA) region.
(A) All Mti-DRA-1 skeletons (6×) covering the dorsal medulla. (B) All Mti-DRA-2 skeletons (4×) covering the dorsal medulla. (C) Separation of putative Mti-DRA subtypes. One population with cell bodies located ventrally (putative cell type Mti-DRA-1, cyan, arrow), and several cells with dorsally located cell bodies (putative Mti-DRA-2, orange, arrow) (all scale bars: 10 µm).
Figure 10
Summary of inner photoreceptor connectivity of central and the dorsal rim area (DRA) columns.
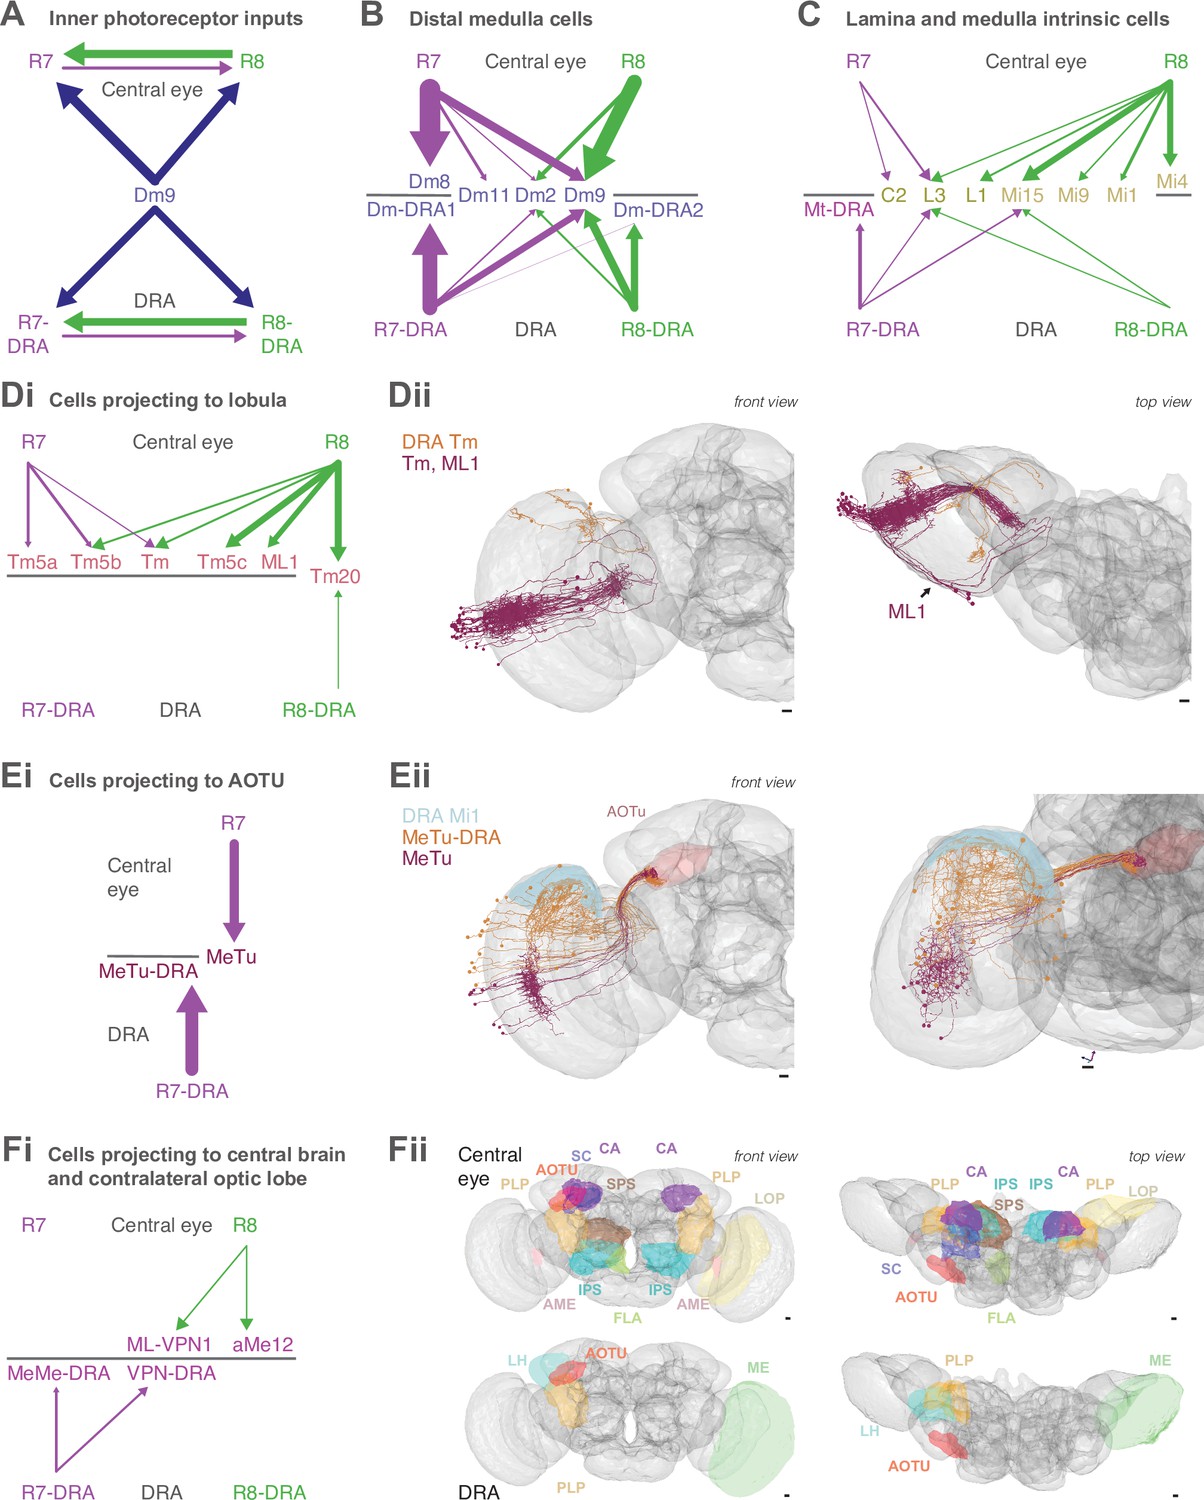
(A) Schematic summary of synaptic connections between central R7–8 or R7-DRA and R8-DRA, as well as other cell types providing synaptic feedback to them (blue). In all panels of this figure, arrow widths are proportional to the numbers of synapses per seed column, and weak connections were excluded for clarity by a threshold of >4 synapses per column per photoreceptor type. Despite the differences in modality, the circuit organization of inputs to R7–8 cells is conserved in the inputs to R7-DRA and R8-DRA. (B) Synapses between R7–8 and Dm cell types in central and DRA columns. Note the presence of a second Dm8-like cell type downstream of R8 only in the DRA (Dm-DRA2). (C) Summary of inner photoreceptor connections with lamina, Mi and Mti cells in central and DRA columns; in the central columns, the Mti connections were below the threshold of 4 synapses per column and are not shown. The connections from R8 to these cells were very reduced in the DRA. (D) Summary of lobula connections. (Di) Schematic of R7–8 versus R7-DRA and R8-DRA connections with Tm5a, Tm5b, Tm5c, Tm20, ML1 cells, and cells we identified as belonging to the Tm cell class (Tm). Note the virtual absence of lobula connectivity in the DRA region. (Dii) Front view (left) and top view (right) of all reconstructed central Tm and ML1 skeletons (claret) and Tm skeletons from the DRA (orange). (E) Summary of MeTu cell connections. (Ei) Schematic of R7 and R7-DRA cells targeting different MeTu populations. (Eii) Front view (left) and DRA view (right) of all central MeTu skeletons (claret) and MeTu-DRA skeletons (orange), with axons following the same tract but terminating with spatially separated axon target areas in the anterior optic tubercle (AOTU). (F) Summary of other visual projection neurons. (Fi) Diagram summarizing VPN connectivity in central and DRA columns. While R8 input dominates in central columns, R7 input dominates in the DRA region. (Fii) Front view (left) and top view (right) of VPN target areas in the central brain. VPNs from both central and DRA columns project to the posterior lateral protocerebrum (PLP, golden yellow) and the AOTU (red). The central column VPNs additionally project ipsilaterally to the mushroom body calyx (mauve), accessory medulla (aMe, pink), superior clamp (SC, dark blue), flange (FLA, green), superior posterior slope (SPS, brown), inferior posterior slope (IPS, cyan), and contralaterally to the PLP, mushroom body calyx (CA), AME, and lobula plate (LOP, cream). The DRA VPNs project ipsilaterally to the AOTU, PLP, and lateral horn (LH, turquoise), and contralaterally to the medulla (ME, lime green).
Figure 11
Comparison of central versus dorsal rim area (DRA), and pale versus yellow pathways.
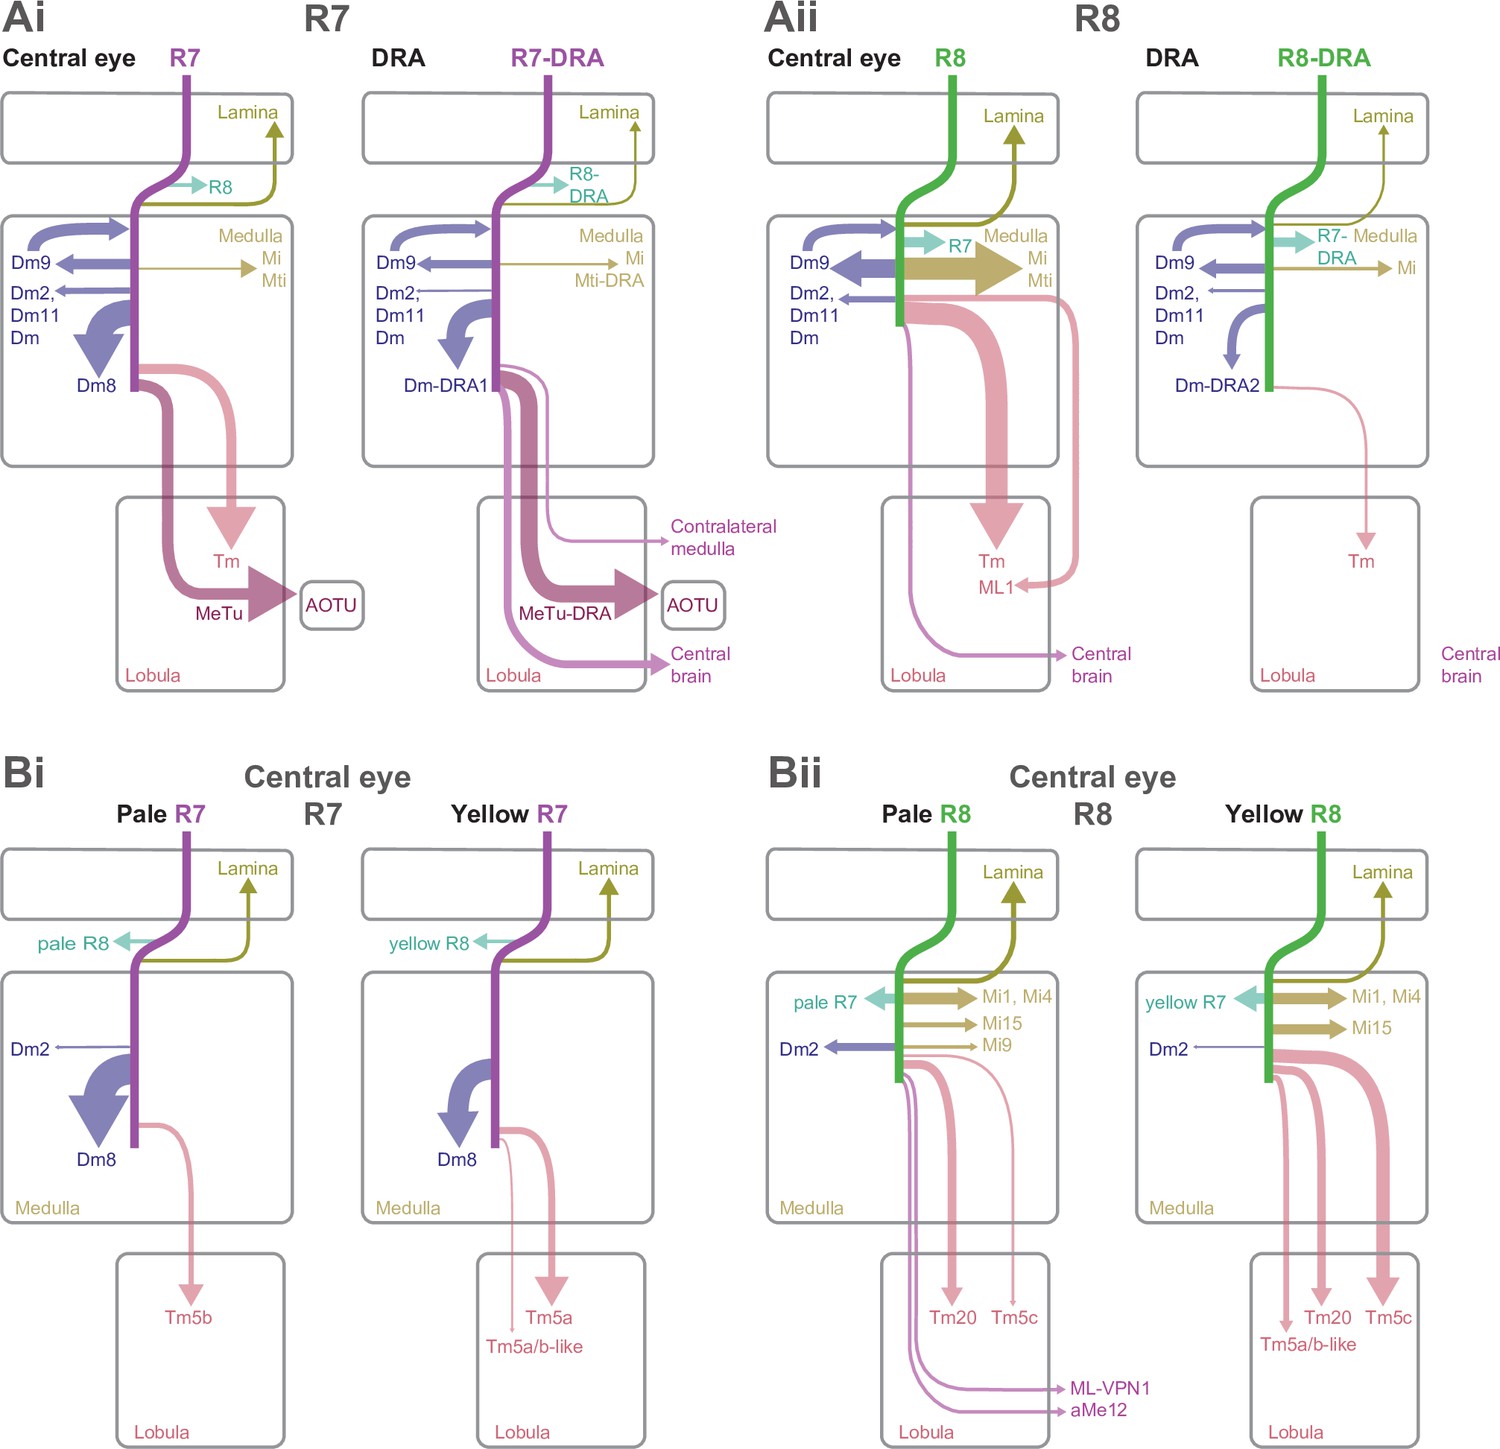
(A) Graphical comparison of central and DRA synaptic pathways. In all panels, the arrow widths are proportional to the numbers of synapses per seed column, and weak connections were excluded for clarity by a threshold of >4 synapses per column. (Ai) Arrows indicating the relative weight of R7 connections (cell types postsynaptic to pale and yellow R7) and R7-DRA. (Aii) Arrows indicating the relative weight of R8 connections (sum of pale and yellow R8) and R8-DRA region. Connections to the lobula neuropil are dominated by R8 targets in the central columns. Lobula connections are virtually absent in the DRA region (synapse numbers below 1% of total synapse count), where connectivity of R8-DRA is dramatically reduced, limited to local computations in the medulla. The projections to the central brain that are not to the anterior optic tubercle (AOTU) are driven by R8 in the central columns, but by R7-DRA in the DRA region. (B) Graphical comparison of central pale and yellow-specific synaptic pathways. (Bi) Arrows indicating the relative weight of pale R7 versus yellow R7 connections in central seed columns. Columnar cell types such as lamina cells have the capacity to preserve pale and yellow information, and Dm8 cells are most densely innervated by their home column input. Tm5a cells were selective for yellow R7, Tm5b cells were selective for pale R7, and the Tm5a-like and Tm5b-like cells were selective for yellow R8, but also received yellow R7 synapses. These diagrams omit cells such as the MeTu neurons since they receive nearly balanced input from pale and yellow R7s. (Bii) Arrows indicating the relative weight of pale R8 versus yellow R8 connections in central seed columns. Columnar medulla cells that have the capacity to preserve pale and yellow information were targets of R8 cells. The aMe12 and ML-VPN1 cell types were specific for pale R8 input, while Tm5c had a strong bias for yellow R8, along with the Tm5a-like and Tm5b-like cells. ML1s are omitted from these diagrams since they received nearly balanced input from pale and yellow R8s.
Tables
Table 1
Abbreviations used.
| Abbreviations used: | ||
|---|---|---|
| EM | Electron microscopy | |
| FAFB | Drosophila Full Adult Fly Brain data set (Zheng et al., 2018) | |
| FIB-SEM | Focused ion-bean serial electron microscopy | |
| Medulla-7-column connectome | FIB-SEM data set of Takemura et al., 2017; Takemura et al., 2015. Connectivity accessible through Clements et al., 2020. | |
| UV | Ultraviolet | |
| P | Pale, for example, pR7 are R7 photoreceptors of pale ommatidia | |
| Y | Yellow, for example, yR8 are R8 photoreceptors of yellow ommatidia | |
| Brain regions: | ||
| AME | Accessory medulla | |
| AOTU | Anterior optic tubercle | |
| DRA | Dorsal rim area | |
| FLA | Flange | |
| LO | Lobula | |
| IPS | Inferior posterior slope | |
| LOP | Lobula plate | |
| SPS | Superior posterior slope | |
| PLP | Posterior lateral protocerebrum | |
| L1-6 | Lobula layers 1–6 | |
| M1-10 | Medulla layers 1–10 | |
| ME | Medulla | |
| CA | Mushroom body calyx | |
| Cell type names or part of cell type names: | ||
| aMe12 | Accessory medulla 12 | |
| C2-3 | Lamina centrifugal cell types | |
| Dm | Distal medulla cell class | |
| -DRA | Suffix indicating the cell type is located in the DRA | |
| L1-5 | Lamina monopolar cell types | |
| MeMe-DRA | Cell type connecting ipsilateral medulla and contralateral medulla | |
| MeTu | Medulla to anterior optic tubercle cell class | |
| Mi | Medulla intrinsic cell class | |
| ML | Medulla to lobula cell class | |
| ML-VPN | Medulla to lobula visual projection neuron (named for similarity to ML cells) | |
| Mti | Medulla tangential intrinsic cell class | |
| Mt-VPN | Medulla tangential visual projection neuron | |
| OA-AL2i3 | Octopaminergic neuron named by Busch et al. (2007) | |
| R1-8 | Photoreceptor cell types | |
| Tm | Transmedullary cell class (neurons connecting medulla and lobula) | |
| TmY | Transmedullary Y cell class (neurons connecting medulla, lobula, lobula plate) | |
| VPN | Visual projection neuron (cell connecting optic lobe and central brain) | |
Table 2
Synaptic targets of seed columns R7 and R8.
| Type | No. | pR7 | yR7 | pR8 | yR8 | Sum | %R7 | %R8 | %p | %y | %Total | %Total_R7 | %Total_R8 |
|---|---|---|---|---|---|---|---|---|---|---|---|---|---|
| Dm9 | 6 | 94 | 66 | 142 | 143 | 445 | 36.0 | 64.0 | 53.0 | 47.0 | 16.4 | 13.5 | 18.8 |
| Dm8 | 15 | 235 | 161 | 0 | 0 | 396 | 100.0 | 0.0 | 59.3 | 40.7 | 14.6 | 33.4 | 0.0 |
| MeTu | 7 | 82 | 93 | 0 | 0 | 175 | 100.0 | 0.0 | 46.9 | 53.1 | 6.5 | 14.7 | 0.0 |
| R7 | 5 | 0 | 3 | 75 | 82 | 160 | 1.9 | 98.1 | 46.9 | 53.1 | 5.9 | 0.3 | 10.3 |
| Tm5c | 6 | 8 | 9 | 20 | 103 | 140 | 12.1 | 87.9 | 20.0 | 80.0 | 5.2 | 1.4 | 8.1 |
| Tm20 | 4 | 5 | 3 | 67 | 65 | 140 | 5.7 | 94.3 | 51.4 | 48.6 | 5.2 | 0.7 | 8.7 |
| Mi15 | 4 | 6 | 7 | 38 | 81 | 132 | 9.8 | 90.2 | 33.3 | 66.7 | 4.9 | 1.1 | 7.8 |
| Mi4 | 4 | 0 | 0 | 58 | 58 | 116 | 0.0 | 100.0 | 50.0 | 50.0 | 4.3 | 0.0 | 7.6 |
| ML1 | 4 | 0 | 0 | 58 | 41 | 99 | 0.0 | 100.0 | 58.6 | 41.4 | 3.7 | 0.0 | 6.5 |
| Dm2 | 4 | 18 | 3 | 60 | 15 | 96 | 21.9 | 78.1 | 81.2 | 18.8 | 3.5 | 1.8 | 4.9 |
| Dm11 | 2 | 28 | 27 | 4 | 4 | 63 | 87.3 | 12.7 | 50.8 | 49.2 | 2.3 | 4.6 | 0.5 |
| L3 | 4 | 19 | 17 | 12 | 13 | 61 | 59.0 | 41.0 | 50.8 | 49.2 | 2.3 | 3.0 | 1.6 |
| Mi1 | 4 | 0 | 0 | 31 | 28 | 59 | 0.0 | 100.0 | 52.5 | 47.5 | 2.2 | 0.0 | 3.9 |
| R8 | 4 | 31 | 26 | 1 | 0 | 58 | 98.3 | 1.7 | 55.2 | 44.8 | 2.1 | 4.8 | 0.1 |
| Tm5a | 2 | 0 | 53 | 0 | 0 | 53 | 100.0 | 0.0 | 0.0 | 100.0 | 2.0 | 4.5 | 0.0 |
| Tm5b | 2 | 39 | 0 | 3 | 6 | 48 | 81.2 | 18.8 | 87.5 | 12.5 | 1.8 | 3.3 | 0.6 |
| Tm | 9 | 17 | 4 | 7 | 16 | 44 | 47.7 | 52.3 | 54.5 | 45.5 | 1.6 | 1.8 | 1.5 |
| Tm5b-like | 3 | 0 | 14 | 0 | 27 | 41 | 34.1 | 65.9 | 0.0 | 100.0 | 1.5 | 1.2 | 1.8 |
| Mi9 | 4 | 3 | 9 | 26 | 1 | 39 | 30.8 | 69.2 | 74.4 | 25.6 | 1.4 | 1.0 | 1.8 |
| L1 | 4 | 2 | 1 | 21 | 14 | 38 | 7.9 | 92.1 | 60.5 | 39.5 | 1.4 | 0.3 | 2.3 |
| aMe12 | 2 | 4 | 0 | 26 | 0 | 30 | 13.3 | 86.7 | 100.0 | 0.0 | 1.1 | 0.3 | 1.7 |
| Dm | 5 | 11 | 7 | 6 | 5 | 29 | 62.1 | 37.9 | 58.6 | 41.4 | 1.1 | 1.5 | 0.7 |
| ML_VPN1 | 3 | 0 | 0 | 26 | 1 | 27 | 0.0 | 100.0 | 96.3 | 3.7 | 1.0 | 0.0 | 1.8 |
| C2 | 2 | 7 | 13 | 6 | 0 | 26 | 76.9 | 23.1 | 50.0 | 50.0 | 1.0 | 1.7 | 0.4 |
| Mt_VPN | 4 | 0 | 12 | 3 | 8 | 23 | 52.2 | 47.8 | 13.0 | 87.0 | 0.8 | 1.0 | 0.7 |
| Mti | 3 | 2 | 0 | 10 | 7 | 19 | 10.5 | 89.5 | 63.2 | 36.8 | 0.7 | 0.2 | 1.1 |
| Tm5a-like | 1 | 0 | 1 | 0 | 16 | 17 | 5.9 | 94.1 | 0.0 | 100.0 | 0.6 | 0.1 | 1.1 |
| TmY10 | 1 | 1 | 0 | 6 | 0 | 7 | 14.3 | 85.7 | 100.0 | 0.0 | 0.3 | 0.1 | 0.4 |
| Mi10 | 1 | 0 | 0 | 0 | 5 | 5 | 0.0 | 100.0 | 0.0 | 100.0 | 0.2 | 0.0 | 0.3 |
| Mi | 1 | 2 | 1 | 0 | 0 | 3 | 100.0 | 0.0 | 66.7 | 33.3 | 0.1 | 0.3 | 0.0 |
| C3 | 1 | 0 | 0 | 0 | 3 | 3 | 0.0 | 100.0 | 0.0 | 100.0 | 0.1 | 0.0 | 0.2 |
| Identified_ < 3 | 26 | 5 | 14 | 14 | 4 | 37 | 51.4 | 48.6 | 51.4 | 48.6 | 1.4 | 1.6 | 1.2 |
| Unidentified_ ≥ 3 | 2 | 0 | 0 | 5 | 3 | 8 | 0.0 | 100.0 | 62.5 | 37.5 | 0.3 | 0.0 | 0.5 |
| Unidentified_ < 3 | 62 | 9 | 15 | 22 | 24 | 70 | 34.3 | 65.7 | 44.3 | 55.7 | 2.6 | 2.0 | 3.0 |
| Total | 211 | 628 | 559 | 747 | 773 | 2,707 | 43.8 | 56.2 | 50.8 | 49.2 | 100.0 | 100.0 | 100.0 |
Table 3
Cells that synapse onto seed columns R7 and R8.
| Type | No. | pR7 | yR7 | pR8 | yR8 | Sum | %R7 | %R8 | %p | %y | %Total | %Total_R7 | %Total_R8 |
|---|---|---|---|---|---|---|---|---|---|---|---|---|---|
| Dm9 | 6 | 90 | 92 | 79 | 72 | 333 | 54.7 | 45.3 | 50.8 | 49.2 | 57.0 | 51.3 | 65.9 |
| R8 | 4 | 75 | 82 | 1 | 0 | 158 | 99.4 | 0.6 | 48.1 | 51.9 | 27.1 | 44.2 | 0.4 |
| R7 | 4 | 0 | 0 | 31 | 26 | 57 | 0.0 | 100.0 | 54.4 | 45.6 | 9.8 | 0.0 | 24.9 |
| Mt_VPN | 1 | 0 | 2 | 0 | 3 | 5 | 40.0 | 60.0 | 0.0 | 100.0 | 0.9 | 0.6 | 1.3 |
| C2 | 1 | 2 | 3 | 0 | 0 | 5 | 100.0 | 0.0 | 40.0 | 60.0 | 0.9 | 1.4 | 0.0 |
| L3 | 1 | 0 | 0 | 4 | 0 | 4 | 0.0 | 100.0 | 100.0 | 0.0 | 0.7 | 0.0 | 1.7 |
| Identified_ < 3 | 11 | 4 | 2 | 4 | 8 | 18 | 33.3 | 66.7 | 44.4 | 55.6 | 3.1 | 1.7 | 5.2 |
| Unidentified_ ≥ 3 | 0 | 0 | 0 | 0 | 0 | 0 | 0.0 | 0.0 | 0.0 | 0.0 | 0.0 | 0.0 | 0.0 |
| Unidentified_ < 3 | 4 | 1 | 2 | 1 | 0 | 4 | 75.0 | 25.0 | 50.0 | 50.0 | 0.7 | 0.8 | 0.4 |
| Total | 32 | 172 | 183 | 120 | 109 | 584 | 60.8 | 39.2 | 50.0 | 50.0 | 100.0 | 100.0 | 100.0 |
Table 4
Synaptic targets of seed column R7-dorsal rim area (DRA) and R8-DRA.
| Type | No. | DRAR7 | DRAR8 | Sum | %R7 | %R8 | %Total | %Total_R7 | %Total_R8 |
|---|---|---|---|---|---|---|---|---|---|
| Dm-DRA1 | 20 | 212 | 0 | 212 | 100.0 | 0.0 | 15.9 | 25.3 | 0.0 |
| Dm9 | 6 | 95 | 115 | 210 | 45.2 | 54.8 | 15.7 | 11.3 | 23.0 |
| MeTu_DRA | 29 | 181 | 0 | 181 | 100.0 | 0.0 | 13.5 | 21.6 | 0.0 |
| R7_DRA | 3 | 1 | 108 | 109 | 0.9 | 99.1 | 8.2 | 0.1 | 21.6 |
| Dm-DRA2 | 9 | 3 | 103 | 106 | 2.8 | 97.2 | 7.9 | 0.4 | 20.6 |
| Dm2 | 4 | 21 | 27 | 48 | 43.8 | 56.2 | 3.6 | 2.5 | 5.4 |
| R8_DRA | 3 | 41 | 1 | 42 | 97.6 | 2.4 | 3.1 | 4.9 | 0.2 |
| Mi15 | 4 | 21 | 18 | 39 | 53.8 | 46.2 | 2.9 | 2.5 | 3.6 |
| Mti_DRA_1 | 6 | 37 | 0 | 37 | 100.0 | 0.0 | 2.8 | 4.4 | 0.0 |
| MeMe_DRA | 2 | 36 | 0 | 36 | 100.0 | 0.0 | 2.7 | 4.3 | 0.0 |
| L3 | 3 | 16 | 16 | 32 | 50.0 | 50.0 | 2.4 | 1.9 | 3.2 |
| VPN_DRA | 6 | 30 | 0 | 30 | 100.0 | 0.0 | 2.2 | 3.6 | 0.0 |
| L1 | 3 | 9 | 9 | 18 | 50.0 | 50.0 | 1.3 | 1.1 | 1.8 |
| Tm20 | 3 | 0 | 16 | 16 | 0.0 | 100.0 | 1.2 | 0.0 | 3.2 |
| Mti_DRA_2 | 4 | 15 | 0 | 15 | 100.0 | 0.0 | 1.1 | 1.8 | 0.0 |
| Mi1 | 3 | 6 | 9 | 15 | 40.0 | 60.0 | 1.1 | 0.7 | 1.8 |
| Tm5-like | 1 | 0 | 12 | 12 | 0.0 | 100.0 | 0.9 | 0.0 | 2.4 |
| Mi9 | 2 | 0 | 12 | 12 | 0.0 | 100.0 | 0.9 | 0.0 | 2.4 |
| MeTu | 2 | 12 | 0 | 12 | 100.0 | 0.0 | 0.9 | 1.4 | 0.0 |
| Dm11 | 1 | 4 | 8 | 12 | 33.3 | 66.7 | 0.9 | 0.5 | 1.6 |
| MeTu_unknown | 1 | 4 | 0 | 4 | 100.0 | 0.0 | 0.3 | 0.5 | 0.0 |
| aMe12 | 1 | 3 | 1 | 4 | 75.0 | 25.0 | 0.3 | 0.4 | 0.2 |
| TmY | 1 | 0 | 3 | 3 | 0.0 | 100.0 | 0.2 | 0.0 | 0.6 |
| ML_VPN2 | 1 | 3 | 0 | 3 | 100.0 | 0.0 | 0.2 | 0.4 | 0.0 |
| C2 | 1 | 2 | 1 | 3 | 66.7 | 33.3 | 0.2 | 0.2 | 0.2 |
| Identified_ < 3 | 33 | 34 | 14 | 48 | 70.8 | 29.2 | 3.6 | 4.1 | 2.8 |
| Unidentified_ ≥ 3 | 2 | 5 | 5 | 10 | 50.0 | 50.0 | 0.7 | 0.6 | 1.0 |
| Unidentified_ < 3 | 57 | 46 | 21 | 67 | 68.7 | 31.3 | 5.0 | 5.5 | 4.2 |
| Total | 211 | 837 | 499 | 1,336 | 62.6 | 37.4 | 100.0 | 100.0 | 100.0 |
Table 5
Cells that synapse onto seed column R7-dorsal rim area (DRA) and R8-DRA.
| Type | No. | DRAR7 | DRAR8 | Sum | %R7 | %R8 | %Total | %Total_R7 | %Total_R8 |
|---|---|---|---|---|---|---|---|---|---|
| Dm9 | 4 | 105 | 106 | 211 | 49.8 | 50.2 | 54.7 | 46.1 | 67.1 |
| R8_DRA | 3 | 108 | 1 | 109 | 99.1 | 0.9 | 28.2 | 47.4 | 0.6 |
| R7_DRA | 3 | 1 | 41 | 42 | 2.4 | 97.6 | 10.9 | 0.4 | 25.9 |
| C2 | 2 | 4 | 4 | 8 | 50.0 | 50.0 | 2.1 | 1.8 | 2.5 |
| Mi15 | 1 | 2 | 2 | 4 | 50.0 | 50.0 | 1.0 | 0.9 | 1.3 |
| Identified_ < 3 | 9 | 6 | 3 | 9 | 66.7 | 33.3 | 2.3 | 2.6 | 1.9 |
| Unidentified_ ≥ 3 | 0 | 0 | 0 | 0 | 0.0 | 0.0 | 0.0 | 0.0 | 0.0 |
| Unidentified_ < 3 | 2 | 2 | 1 | 3 | 66.7 | 33.3 | 0.8 | 0.9 | 0.6 |
| Total | 24 | 228 | 158 | 386 | 59.1 | 40.9 | 100.0 | 100.0 | 100.0 |
Key resources table
| Reagent type (species) or resource | Designation | Source or reference | Identifiers | Additional information |
|---|---|---|---|---|
| Genetic reagent(Drosophila melanogaster) | MCFO-1; ”pBPhsFlp2::PEST in attP3;;pJFRC201-10XUAS-FRT> STOP > FRT-myr::smGFP-HA in VK0005, pJFRC240-10X-UAS-FRT> STOP > FRT-myr::smGFP-V5-THS-10XUAS-FRT> STOP > FRT-myr::smGFP-FLAG in su(Hw)attP1” | https://doi.org/10.1073/pnas.1506763112 | RRID:BDSC_64085 | |
| Genetic reagent(Drosophila melanogaster) | pJFRC51-3XUAS-IVS-Syt::smHA in su(Hw)attP1, pJFRC225-5XUAS-IVS-myr::smFLAG in VK00005 | https://doi.org/10.1073/pnas.1506763112 | ||
| Genetic reagent(Drosophila melanogaster) | SS02978(w; 42E06-p65ADZp in attP40; VT064564-ZpGdbd in attP2/TM6B) | This study | SS02978 | Split-GAL4 lines are available via https://www.janelia.org/split-GAL4 |
| Genetic reagent(Drosophila melanogaster) | SS01015(w; 21B12-p65ADZp in attP40; 20E07-ZpGdbd in attP2) | This study | SS01015 | Split-GAL4 lines are available via https://splitgal4.janelia.org/cgi-bin/splitgal4.cgi |
| Genetic reagent(Drosophila melanogaster) | SS28175 (w; 51E06-p65ADZp in attP40/CyO,Tb; 15D05-ZpGdbd in attP2/TM6B) | This study | SS28175 | Split-GAL4 lines are available via https://www.janelia.org/split-GAL4 |
| Genetic reagent(Drosophila melanogaster) | R56F07 | Bloomington Drosophila Stock Center | RRID:BDSC_39160 | |
| Genetic reagent(Drosophila melanogaster) | ortc2b-Gal4 | https://doi.org/10.1016/j.neuron.2013.12.010 | ||
| Genetic reagent(Drosophila melanogaster) | 20XUAS-CsChrimson-mVenus in attP18 | https://doi.org/10.1038/nmeth.2836 | RRID:BDSC_55134 | |
| Antibody | Anti-chaoptin mouse monoclonal 24B10 | DSHB | RRID:AB_528161 | (1:20) |
| Antibody | Anti-Brp mouse monoclonal nc82 | DSHB | RRID:AB_2314866 | (1:30) |
| Antibody | Anti-dsRed rabbit polyclonal | Clontech Laboratories, Inc: 632,496 | RRID:AB_10013483 | (1:1000) |
| Antibody | Rat cadherin, DN-Ex #8 (extracellular domain) | Developmental Studies Hybridoma Bank | RRID: AB_528121 | (1:100) |
| Antibody | Anti-HA rabbit monoclonal C29F4 | Cell Signaling Technologies: 3724S | RRID:AB_1549585 | (1:300) |
| Antibody | Anti-FLAG rat monoclonal DYKDDDDK Epitope Tag Antibody [L5], | Novus Biologicals: NBP1-06712 | RRID:AB_1625981 | (1:200) |
| Antibody | DyLight 550 conjugated anti-V5 mouse monoclonal | AbD Serotec: MCA1360D550GA | RRID:AB_2687576 | (1:500) |
| Antibody | DyLight 549 conjugated anti-V5 mouse monoclonal | AbD Serotec: MCA1360D549GA | RRID:AB_10850329 | (1:500) |
| Antibody | Anti-GFP rabbit polyclonal | ThermoFisher: A-11122 | RRID:AB_221569 | (1:1000) |
| Antibody | Anti-GFP mouse monoclonal 3E6 | ThermoFisher: A-11120 | RRID:AB_221568 | (1:100) |
| Software, algorithms | FluoRender | http://www.sci.utah.edu/software/fluorender.html | RRID:SCR_014303 | |
| Software, algorithms | VVDviewer | https://github.com/takashi310/VVD_Viewer (Kawase, 2021) | ||
| Software, algorithm | Python 3 | http://www.python.org | RRID:SCR_008394 | |
| Software, algorithm | pymaid | https://github.com/schlegelp/PyMaid (Neuron Analysis & Visualization, 2021a) | DOI https://doi.org/10.5281/zenodo.4724558 | Python library |
| Software, algorithm | FAFBseg | https://github.com/flyconnectome/fafbseg-py (Neuron Analysis & Visualization, 2021b) | DOI https://doi.org/10.5281/zenodo.496660 | Python library |
| Software, algorithm | R | https://www.r-project.org/ | RRID:SCR_001905 | |
| Software, algorithm | R Studio | https://www.rstudio.com/ | RRID:SCR_000432 | |
| Software, algorithm | Natverse | https://natverse.org | DOI:10.7554/eLife.53350 | Collection of R packages for neuroanatomical analysis |
| Software, algorithm | Tidyverse | https://www.tidyverse.org/ | RRID:SCR_019186 | R package |
| Software, algorithm | knitr | https://cran.r-project.org/package=knitr | R package | |
| Software, algorithm | kableExtra | https://cran.r-project.org/package=kableExtra | R package | |
| Software, algorithm | gridExtra | https://cran.r-project.org/package=gridExtra | R package | |
| Software, algorithm | png | https://cran.r-project.org/package=png | R package | |
| Software, algorithm | RColorBrewer | https://cran.r-project.org/package=RColorBrewer | R package | |
| Software, algorithm | alphashape3d | https://CRAN.R-project.org/package=alphashape3d | R package | |
| Software, algorithm | Fiji | http://fiji.sc | RRID:SCR_002285 | |
| Software, algorithm | MATLAB | RRID:SCR_001622 | ||
| Software, algorithm | CATMAID | http://www.catmaid.org/ | Neuron reconstruction | |
| Other | FAFB | Zheng et al., 2018; https://v2.virtualflybrain.org/ | EM data set | |
| Other | FAFB-FFN1 | Li et al., 2020; http://fafb-ffn1.storage.googleapis.com/data.html | EM auto-segmentation | |
| Other | FlyWire | Dorkenwald et al., 2020; https://flywire.ai/ | EM auto-segmentation | |
| Sequence-based reagent | Rh3 F | This paper | PCR primer | CACC GGT ACG CTT ATG ATA ACC TTC G |
| Sequence-based reagent | Rh3 R | This paper | PCR primer | GCT CCG GTC TGC GGG CCA AGA |
| Sequence-based reagent | Rh5 F | This paper | PCR primer | CACC GGT GAT TAA TGC GAA TGT AGC TGC |
| Sequence-based reagent | Rh5 R | This paper | PCR primer | ACT GCT TGA TCC GCT CCA AAA TC |
| Sequence-based reagent | Rh6 F | This paper | PCR primer | CA CCA ACA TGA TGG CGG ACA TCA C |
| Sequence-based reagent | Rh6 R | This paper | PCR primer | TTC GAA TGG CTG GTA CTG GTG |
Additional files
-
Supplementary file 1
Tables of all seed column R7, R8, R7-DRA, and R8-DRA target cells by type.
- https://cdn.elifesciences.org/articles/71858/elife-71858-supp1-v3.pdf
-
Supplementary file 2
Gallery plots of all seed column R7, R8, R7-DRA, and R8-DRA target cells by type.
- https://cdn.elifesciences.org/articles/71858/elife-71858-supp2-v3.pdf
-
Supplementary file 3
Tables of seed column synapses outside the medulla.
- https://cdn.elifesciences.org/articles/71858/elife-71858-supp3-v3.pdf
-
Supplementary file 4
Fly genotypes organized by figure panel.
- https://cdn.elifesciences.org/articles/71858/elife-71858-supp4-v3.pdf
-
Transparent reporting form
- https://cdn.elifesciences.org/articles/71858/elife-71858-transrepform1-v3.pdf
Download links
A two-part list of links to download the article, or parts of the article, in various formats.
Downloads (link to download the article as PDF)
Open citations (links to open the citations from this article in various online reference manager services)
Cite this article (links to download the citations from this article in formats compatible with various reference manager tools)
Synaptic targets of photoreceptors specialized to detect color and skylight polarization in Drosophila
eLife 10:e71858.
https://doi.org/10.7554/eLife.71858


