Coupling of pupil- and neuronal population dynamics reveals diverse influences of arousal on cortical processing
- Universitat Pompeu Fabra, Center for Brain and Cognition, Computational Neuroscience Group, Spain
- University Medical Center Hamburg-Eppendorf, Department of Neurophysiology and Pathophysiology, Germany
- University of Stirling, Psychology, United Kingdom
- Centre for Cognitive Neuroimaging, Institute of Neuroscience and Psychology, University of Glasgow, United Kingdom
- Institute for Biomagnetism and Biosignal Analysis, University of Münster, Malmedyweg, Germany
- Otto Creutzfeldt Center for Cognitive and Behavioral Neuroscience, University of Münster, Germany
- University of Dundee, Psychology, United Kingdom
Figures
Figure 1 with 2 supplements
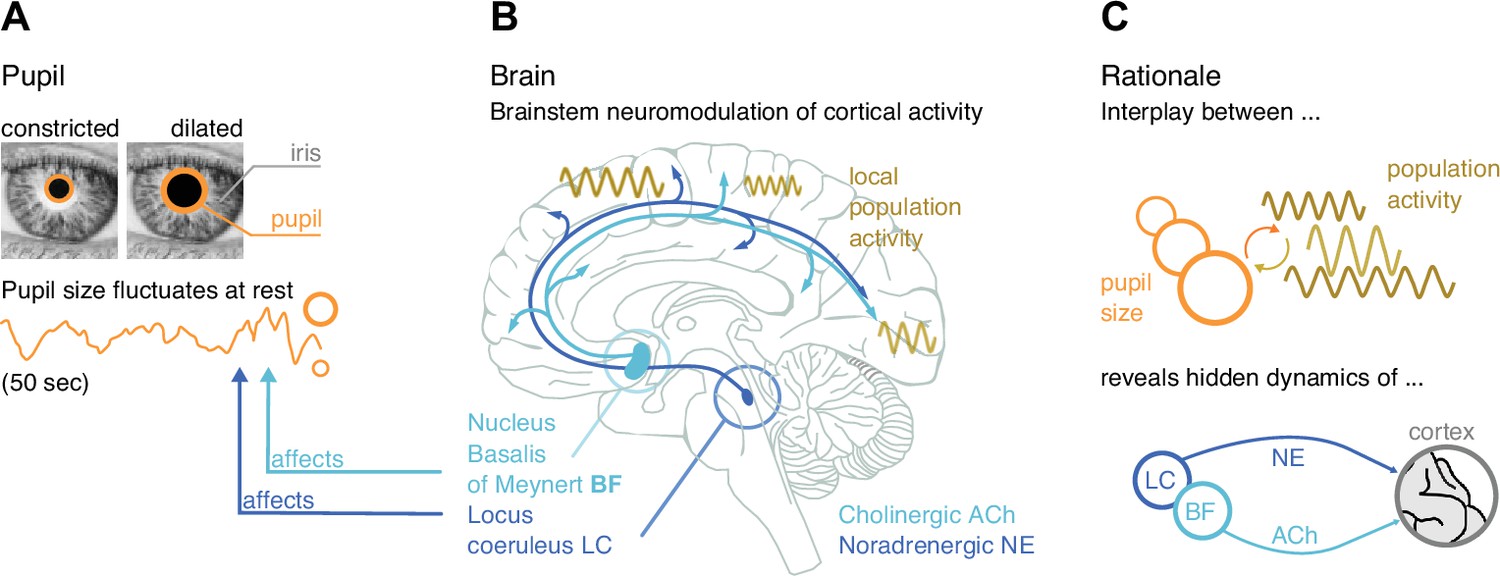
Rationale of our approach and summary results.
(A) Even at rest and under constant illumination, pupil size (diameter) fluctuates spontaneously. (B) The locus coeruleus (LC) in the brainstem and the nucleus basalis of Meynert in the basal forebrain (BF) affect pupil size. LC releases the neuromodulator noradrenaline (NE) to the cortex, BF releases acetylcholine (ACh). Synchronous local neuronal population activity across the brain can be measured with magnetoencephalography (MEG). (C) Rationale: Studying the coupling of pupil size and local population activity recorded with MEG provides insights into the functional influences of deep-brain structures in brainstem (LC) and BF. Panel B modified from van den Brink et al., 2019.
Figure 1—figure supplement 1

MEG power spectra across recording sites.
(A) Power spectra, separately shown for all three magnetoencephalographic (MEG) laboratories (Glasgow, Hamburg, and Münster; starting from the top), and pooled across all laboratories (bottom). Shaded areas show standard error of the mean. (B) The individual power spectra, across all 81 included participants, are highly correlated.
Figure 1—figure supplement 2

Power spectra and signal components of pupil time series, for all magnetoencephalographic (MEG) laboratories.
(A) Grand-average pupil power spectra for each center. From top to bottom: Glasgow (red), Hamburg (blue), Münster (yellow). Shaded areas show standard error of the mean. (B) Scatter plot of two aperiodic parameters of individual pupil spectra, the spectral slope characterized by its 1/f exponent (y-axis) and the spectral offset (x-axis) as extracted with the FOOOF algorithm (Donoghue et al., 2020). Dots use the same color-coding for labs as in A. (C) Scatter plot of the center frequency (x-axis) and power (y-axis) of the prominent rhythmic component between 0.1 and 0.4 Hz in individual power spectra (see A), the so-called Hippus (Bouma and Baghuis, 1971), as extracted with FOOOF (Donoghue et al., 2020). Dots use the same color-coding for labs as in A. (D) Within- and cross-laboratory correlations between individual pupil power spectra show high similarity.
Figure 2 with 1 supplement
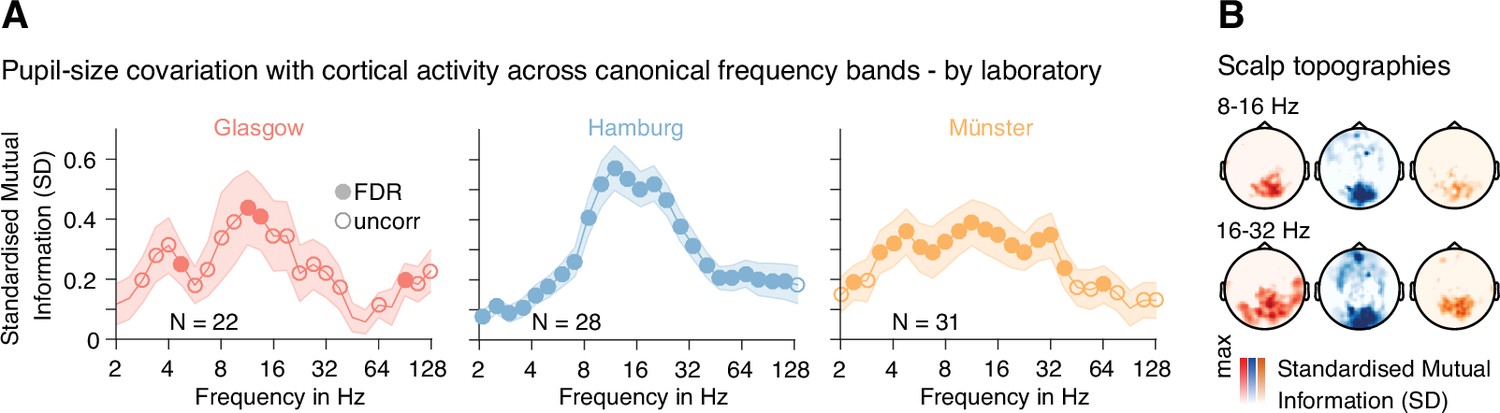
Mutual information between MEG and pupil time series.
(A) Mutual information (MI) spectra demonstrate the covariation between pupil size and power fluctuations across canonical frequency bands from 2 to 128 Hz (note the log-spaced frequency axis). MI values are standardized against individual permutation distributions based on a temporal re-shuffling of pupil size and power time courses (for details, see Materials and methods). Filled/open markers in plots signify frequency-specific t-tests of individual standardized MI values against zero (two-tailed) at FDR-corrected thresholds (αGlasgow = 0.002; αHamburg = 0.008; αMünster = 0.003), and an uncorrected threshold of p < 0.05. Data pooled across all magnetoencephalographic (MEG) sensors. Shaded areas depict the standard error of the mean across subjects. Color-coding refers to the recording site; left: Glasgow data in red; center: Hamburg data in blue; right: Münster data in yellow. N denotes the number of samples recorded at each site. (B) Scalp topographies illustrate the commonalities of the spatial distribution of pupil size power covariations for two prominent frequency ranges. As in A, colors code the recording site – from left to right: Glasgow, Hamburg, Münster.
Figure 2—figure supplement 1
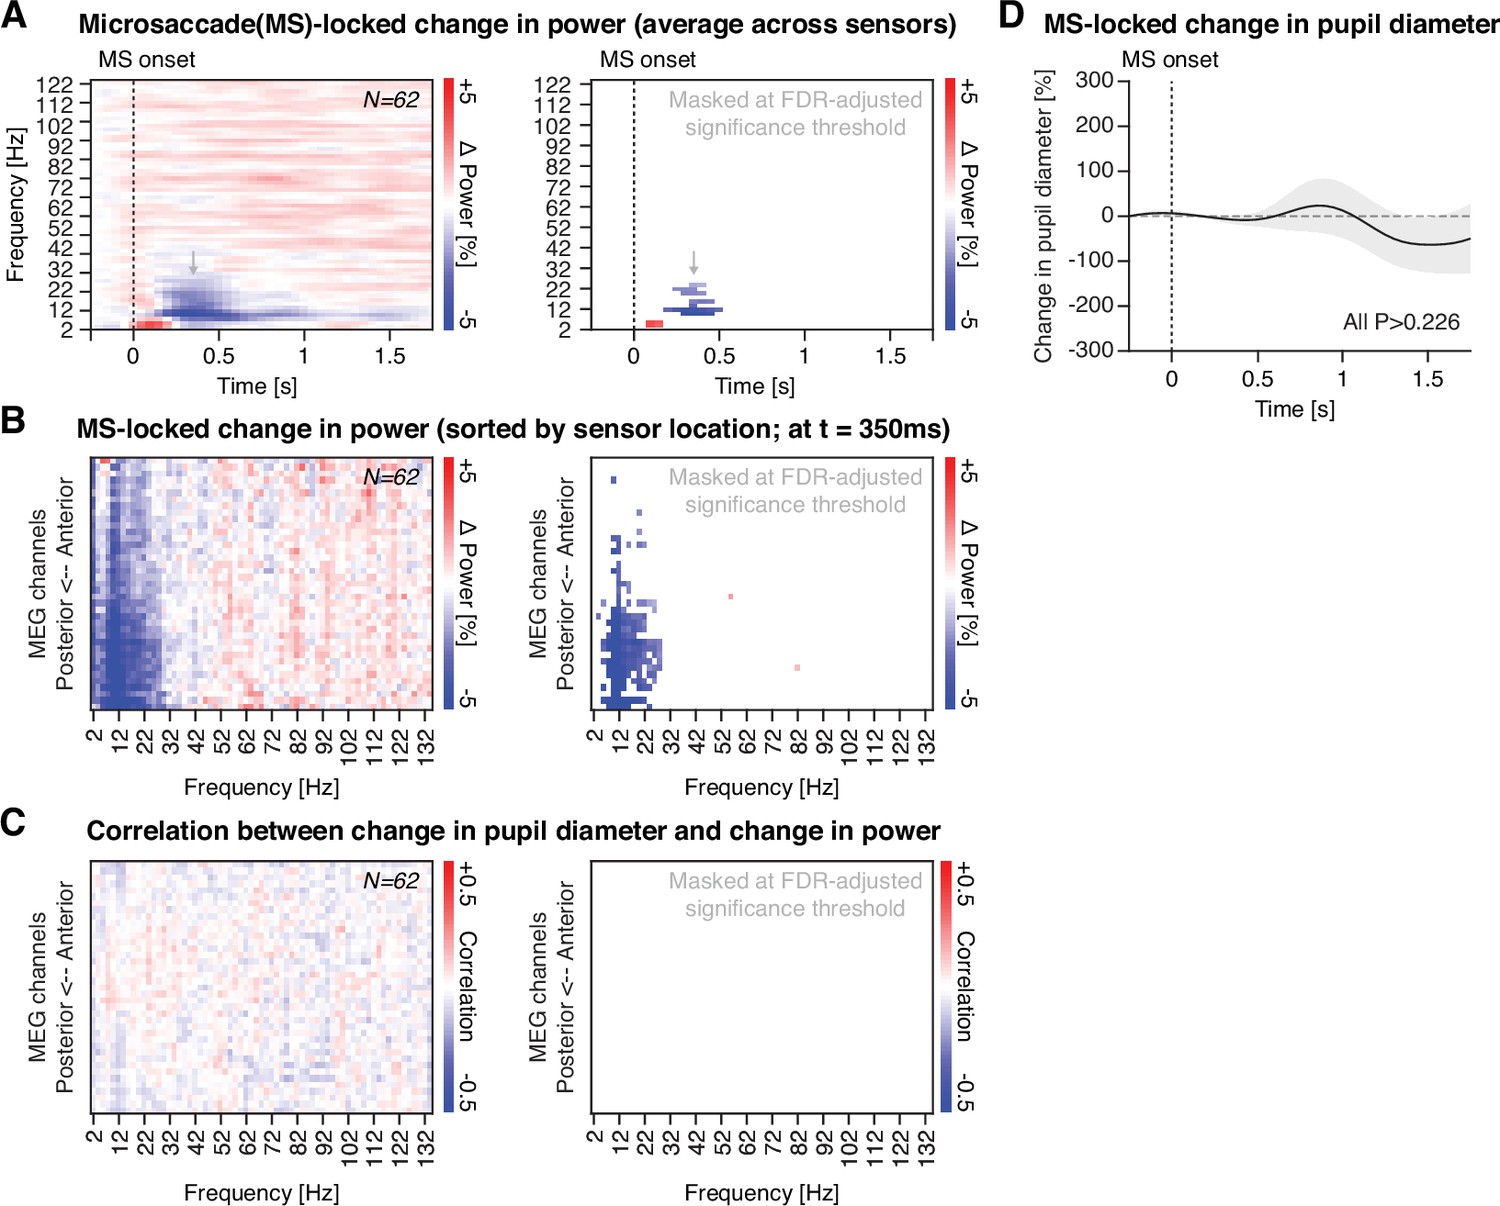
Analyses of microsaccade-locked cortical activity and pupil diameter.
(A) Left: Time-frequency representations following microsaccade onset (dashed vertical line). Shown is the average across all sensors. Right: Same as left, but thresholded at the FDR-adjusted significance threshold (with q = 0.1). (B) Left: Unmasked spatial distribution of microsaccade-related change in power at t = 350 ms, with sensors spatially ordered from anterior to posterior. Right: Same as left, but thresholded at the FDR-adjusted significance threshold (with q = 0.1). (C) Correlation between changes in pupil diameter and changes in power following microsaccades, with sensors spatially ordered from anterior to posterior. Right: Same as left, but thresholded at the FDR-adjusted significance threshold (with q = 0.1). All p-values were obtained from a two-tailed paired t-test. (D) Changes in pupil diameter time-locked to microsaccade onsets. Shaded area illustrates standard error of the mean. Systematic changes absent (all p-values > 0.226, two-tailed contrasts against zero).
Figure 3 with 2 supplements
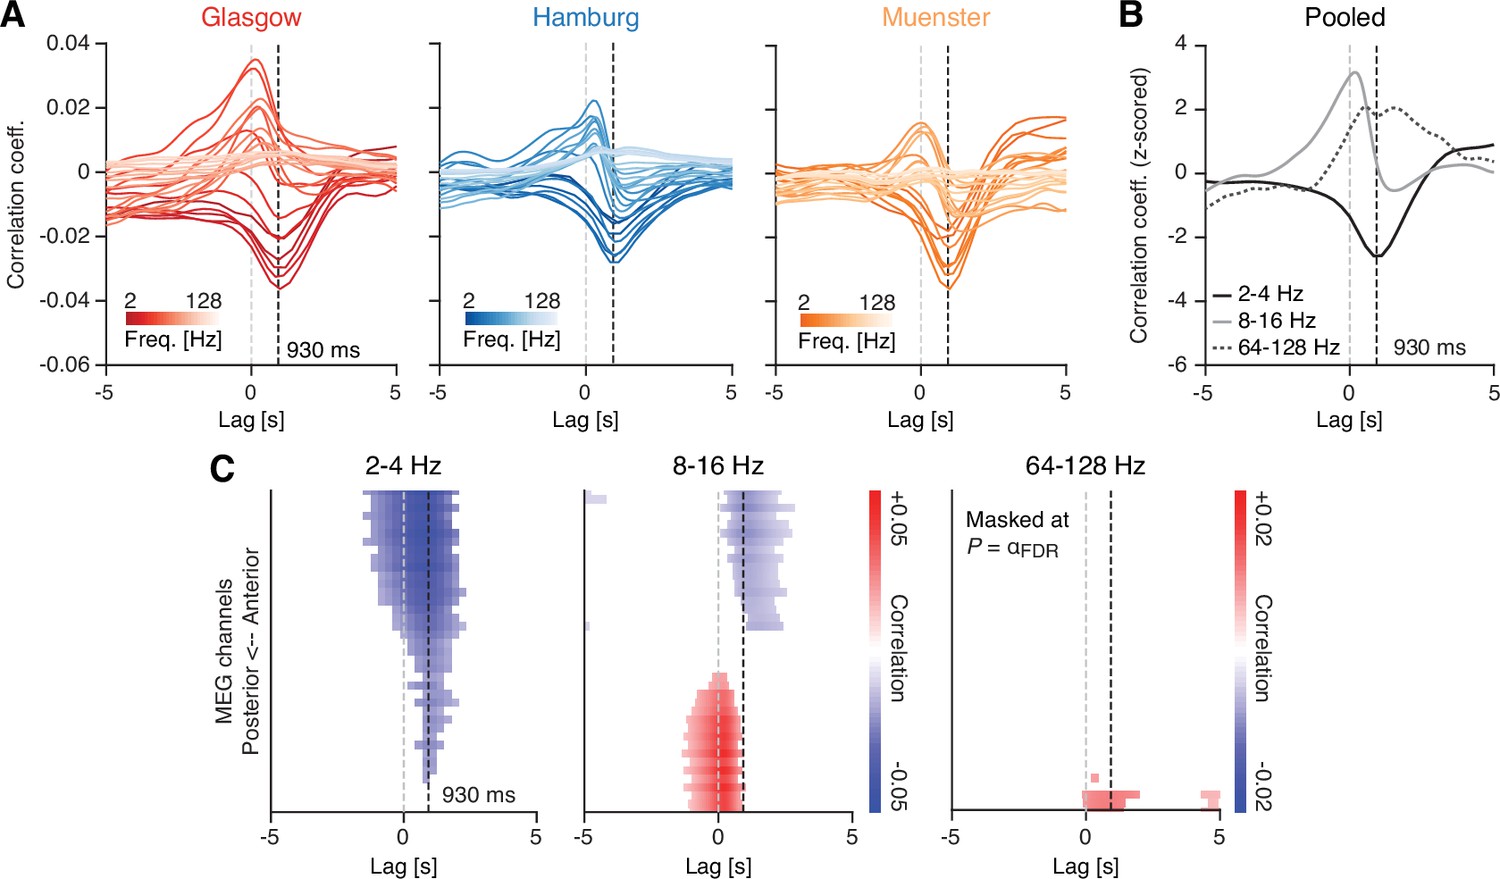
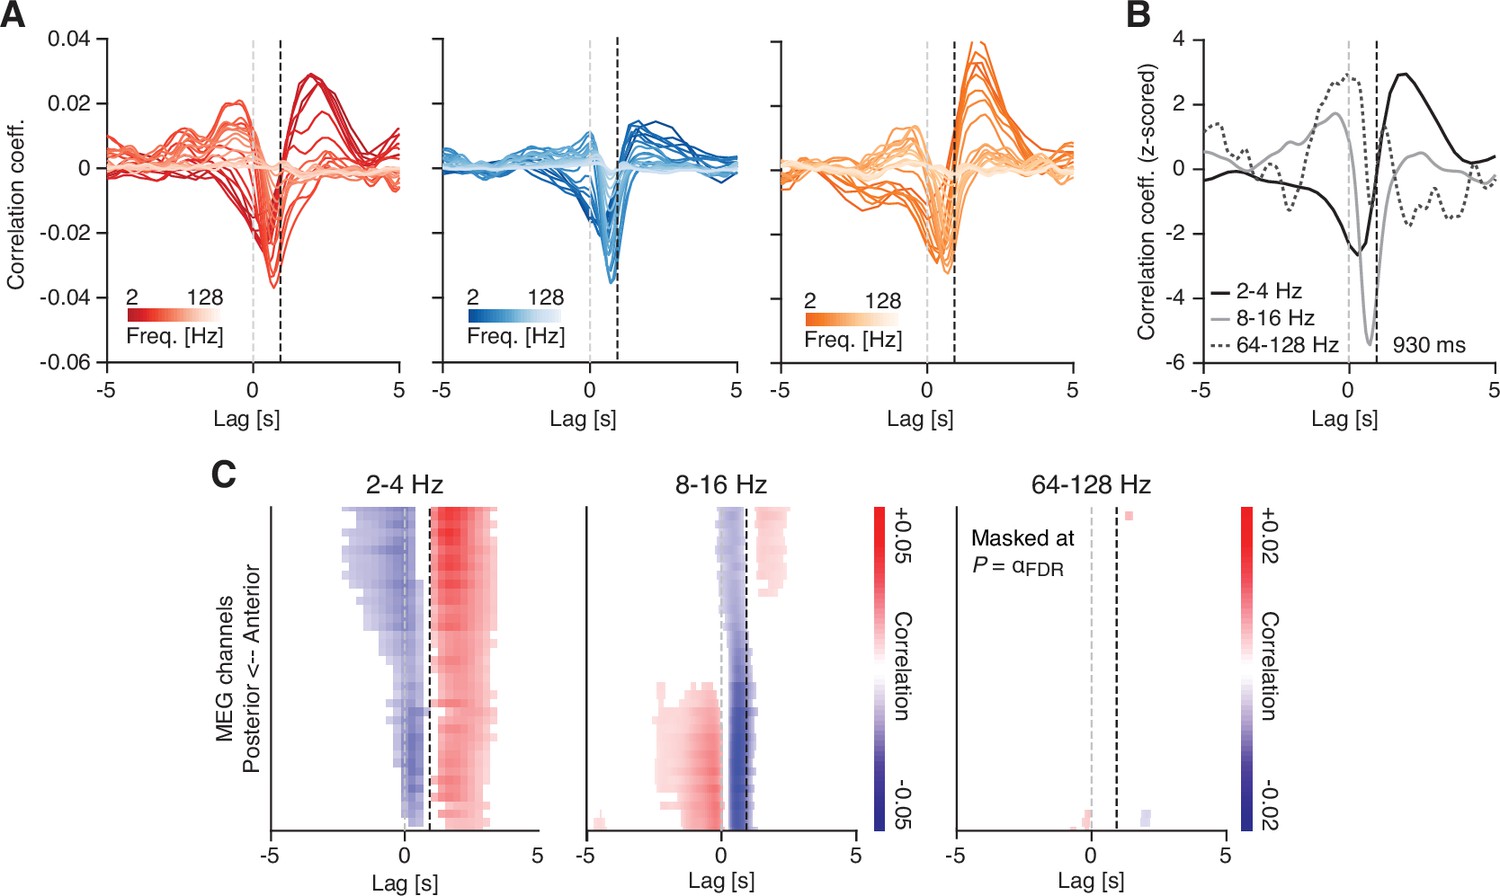
Sensor-level cross-correlations between fluctuations in pupil diameter and band-limited power fluctuations.
(A) Correlation between fluctuations in pupil diameter and band-limited power fluctuations across lags, ranging from –5 to 5 s and for all three recording sites (left: Glasgow; center: Hamburg; right: Muenster). Colors indicate the magnetoencephalographic (MEG) frequency band, with darker colors representing lower frequencies and lighter colors representing higher frequencies. Negative lags are indicative of ‘pupil preceding MEG’, whereas positive lags are indicative of the opposite. The vertical dashed black line denotes a lag of 930 ms (Hoeks and Levelt, 1993) and the dashed light gray line a lag of 0 ms. (B) Same as in (A), but averaged across the three recording sites and for three frequency bands of interest: 2–4 Hz (black), 8–16 Hz (dark gray), and 64–128 Hz (gray dashed). (C) Correlation values across all channel groups, sorted from anterior to posterior, and for lags ranging from –5 to +5 s. The dashed gray line depicts a lag of 0 ms and the dashed black line shows a lag of 930 ms (Hoeks and Levelt, 1993). Correlation values were averaged within three frequency bands of interest: 2–4 Hz (left), 8–16 Hz (center), and 64–128 Hz (right). Masked at the corresponding FDR-adjusted significance thresholds (q = 0.1): α = 0.00122 (2–4 Hz), α = 0.0029 (8–16 Hz), and α = 0.0001 (64–128 Hz). p-Values were obtained from a two-tailed paired t-test.
Figure 3—figure supplement 1
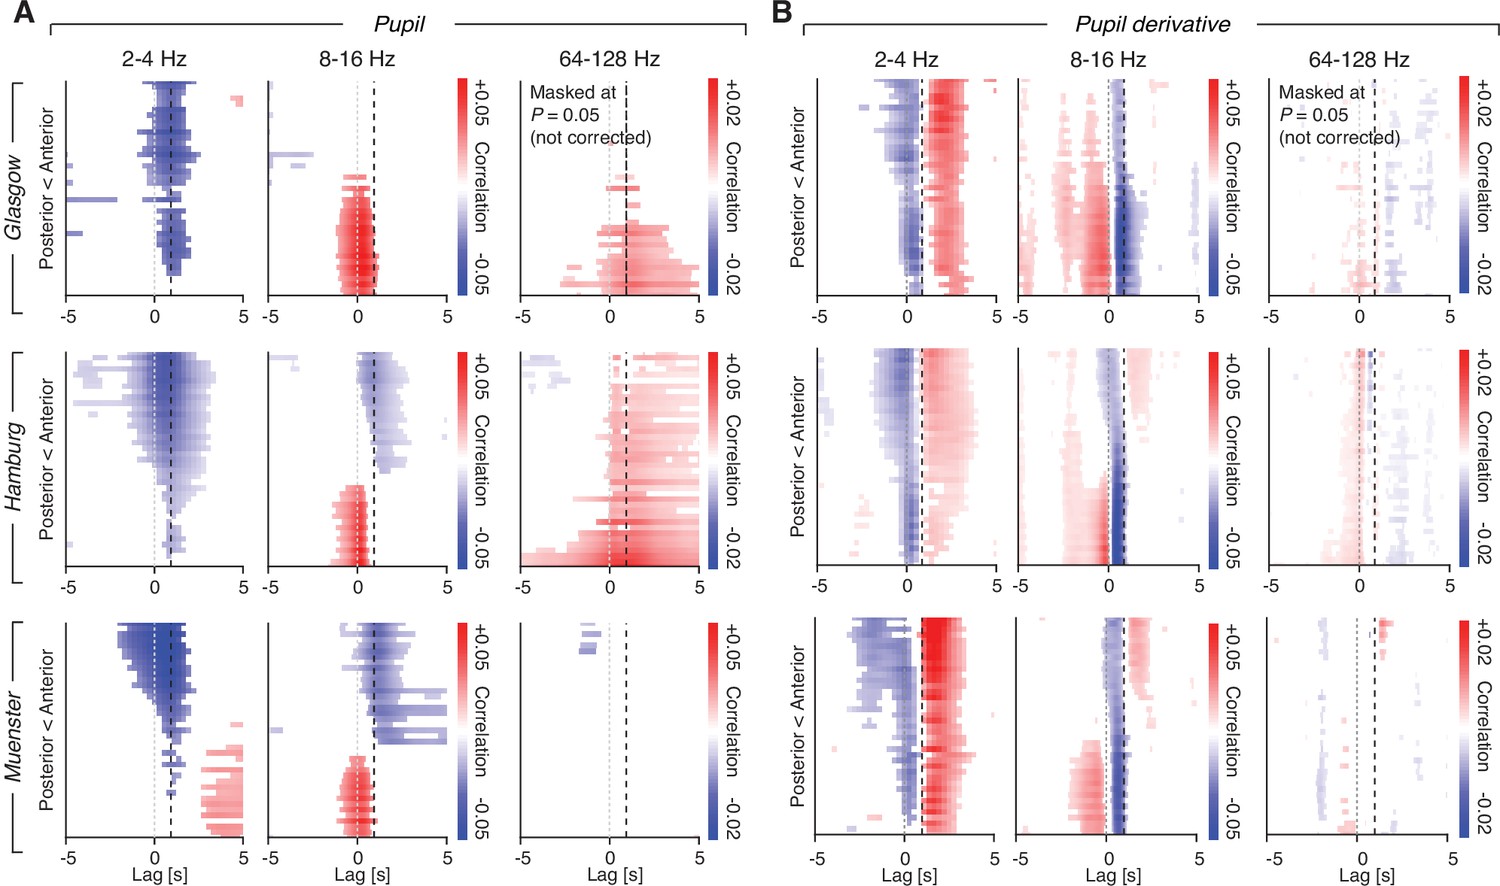
Sensor-level cross-correlations between the temporal derivative of fluctuations in pupil diameter (pupil derivative) and band-limited power fluctuations.
(A) Correlation between the pupil derivative and band-limited power fluctuations across lags, ranging from –5 to 5 s and for all three recording sites (left: Glasgow; center: Hamburg; right: Muenster). Colors indicate the magnetoencephalographic (MEG) frequency band, with darker colors representing lower frequencies and lighter colors representing higher frequencies. Negative lags are indicative of ‘pupil derivative preceding MEG’, whereas positive lags are indicative of the opposite. The vertical dashed black line denotes a lag of 930 ms (Hoeks and Levelt, 1993) and the dashed light gray line a lag of 0 ms. (B) Same as in (A), but averaged across the three recording sites and for three frequency bands of interest: 2–4 Hz (black), 8–16 Hz (dark gray), and 64–128 Hz (gray dashed). (C) Correlation values across all channel groups, sorted from anterior to posterior, and for lags ranging from –5 to +5 s. The dashed gray line depicts a lag of 0 ms and the dashed black line shows a lag of 930 ms (Hoeks and Levelt, 1993). Correlation values were averaged within three frequency bands of interest: 2–4 Hz (left), 8–16 Hz (center), and 64–128 Hz (right). Masked at the corresponding FDR-adjusted significance threshold: α = 0.00221 (2–4 Hz), α = 0.00115 (8–16 Hz), and α = 0.00002 (64–128 Hz). p-Values were obtained from a two-tailed paired t-test.
Figure 3—figure supplement 2
Spatial distribution of cross-correlations, separately for each magnetoencephalographic (MEG) site.
(A) Cross-correlation between spontaneous fluctuations in pupil diameter and band-limited power, across various temporal lags (from –5 s to 5 s), separately for the Glasgow (top), the Hamburg (middle), and the Münster (bottom) datasets, and averaged across three frequency ranges of interest (2–4, 8–16, and 64–128 Hz, from left to right). (B) Same as (A), but for pupil derivative. All masked at p = 0.05 (two-tailed paired t-test). Note that, compared to Figure 3, the p-values were not FDR-adjusted.
Figure 4 with 2 supplements
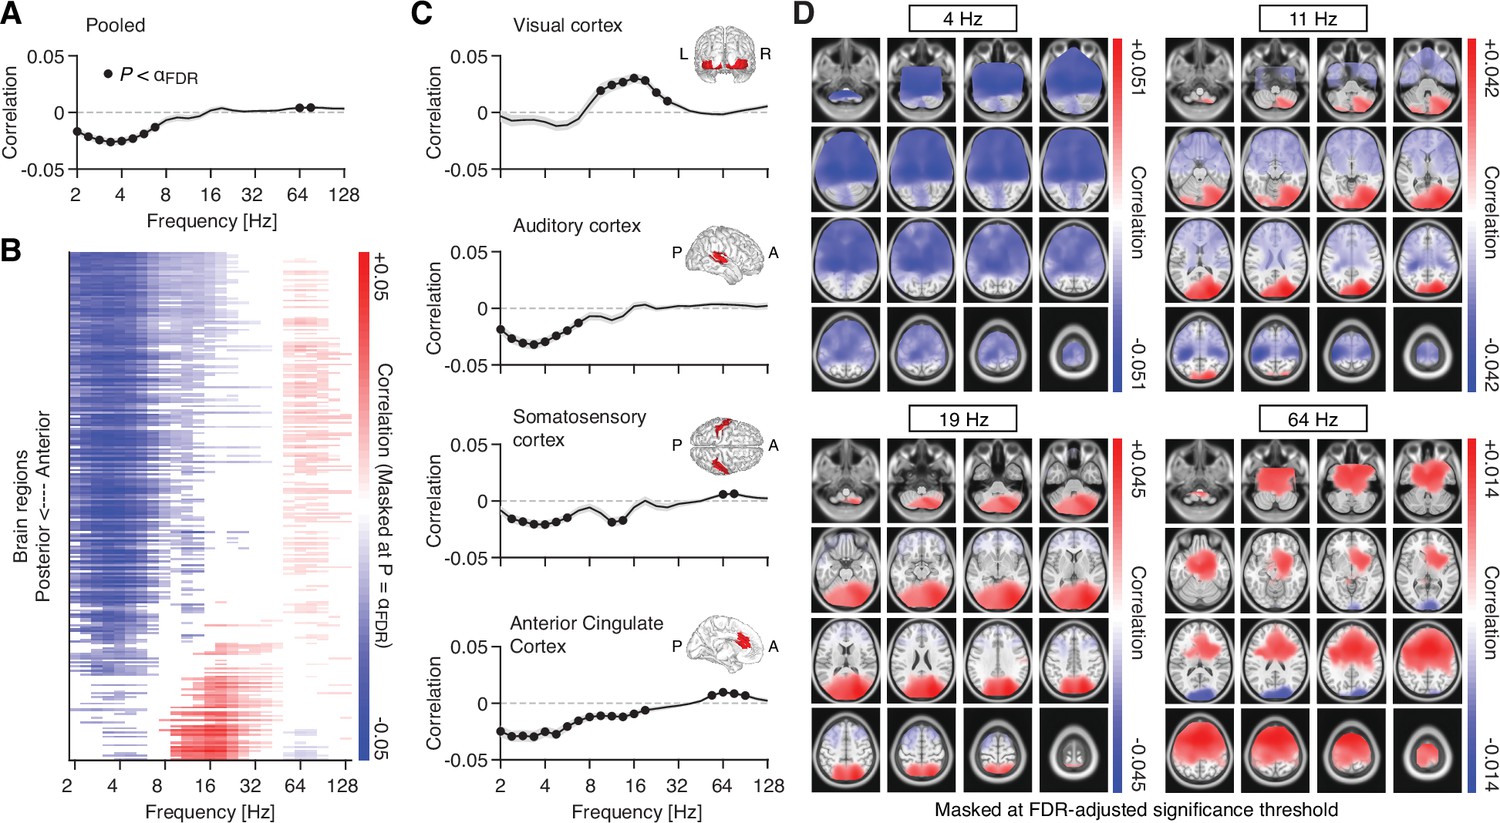
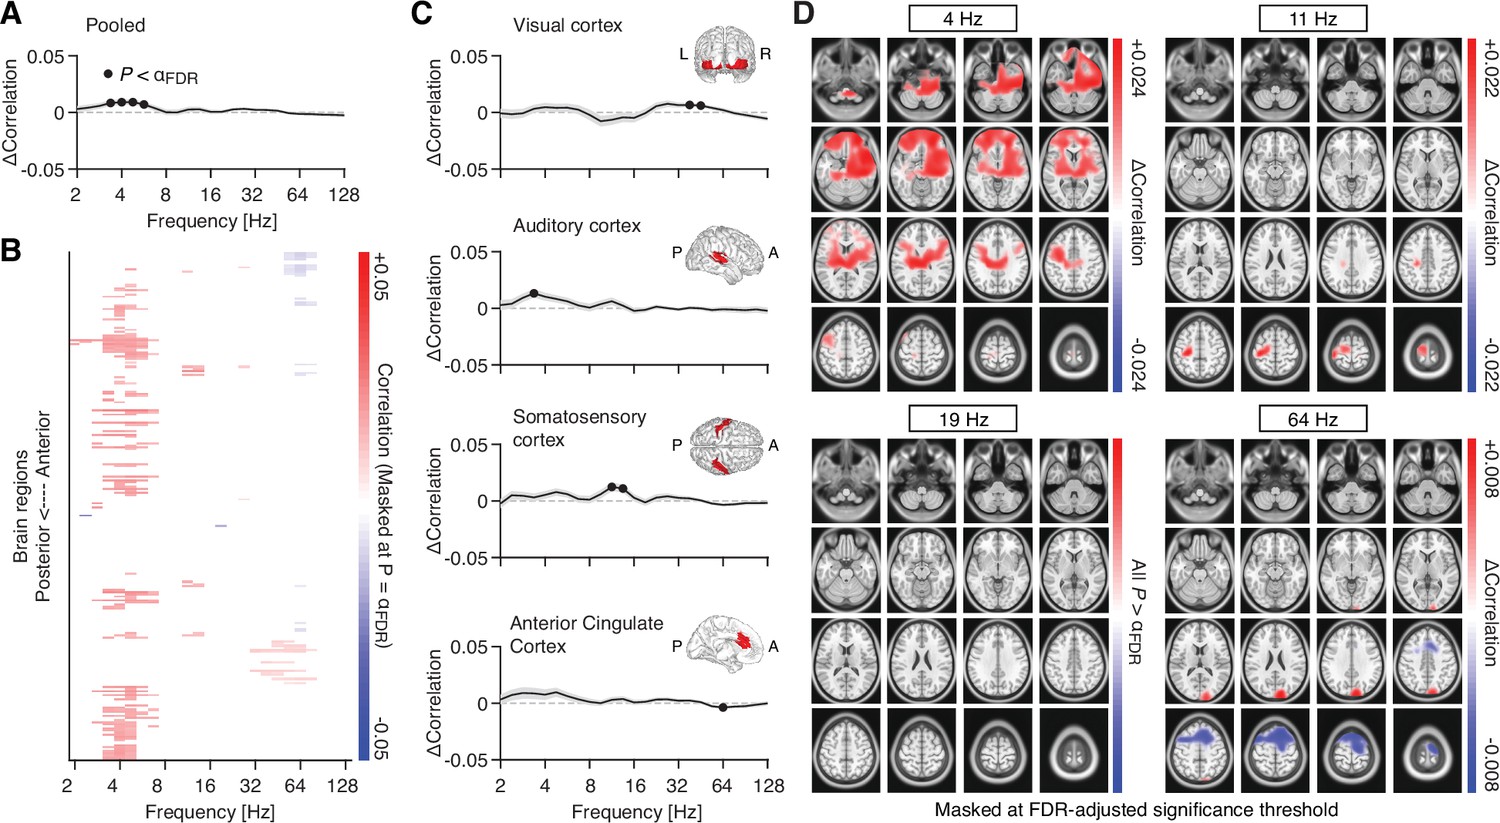
Source space pupil-power correlations.
(A) Spectrum of pupil-power correlations, averaged across all 8799 source locations. Filled black circles denote significant correlations after FDR adjustment (two-tailed paired t-test; FDR-adjusted α = 0.008; with q = 0.1). The gray shaded area depicts the standard error of the mean across subjects. (B) Pupil-power correlations across the 246 regions of the Brainnetome atlas and sorted from anterior to posterior regions. Masked at FDR-adjusted significance threshold (two-tailed paired t-test; FDR-adjusted α = 0.0053; with q = 0.1). (C) Pupil-power correlations across four selected regions of interest (see Materials and methods for details; filled black circles denote significant correlations after FDR adjustment with q = 0.1): visual cortex (α = 0.007), auditory cortex (α = 0.007), somatosensory cortex (α = 0.011), and anterior cingulate cortex (α = 0.018; from top to bottom). Insets depict the spatial extent of the respective region of interest. (D) Spatial distribution of pupil-power correlations, across four frequency bands of interest. Correlations between pupil and power (in clockwise direction, starting from the top left) at center frequencies 4, 11.3, 19.0, and 64 Hz. All maps are masked at the FDR-adjusted significance thresholds with q = 0.1 (4 Hz: α = 0.0086; 11.3 Hz: α = 0.0069; 19 Hz: α = 0.0044; 64 Hz: α = 0.0039; all p-values were obtained from a two-tailed paired t-test).
Figure 4—figure supplement 1
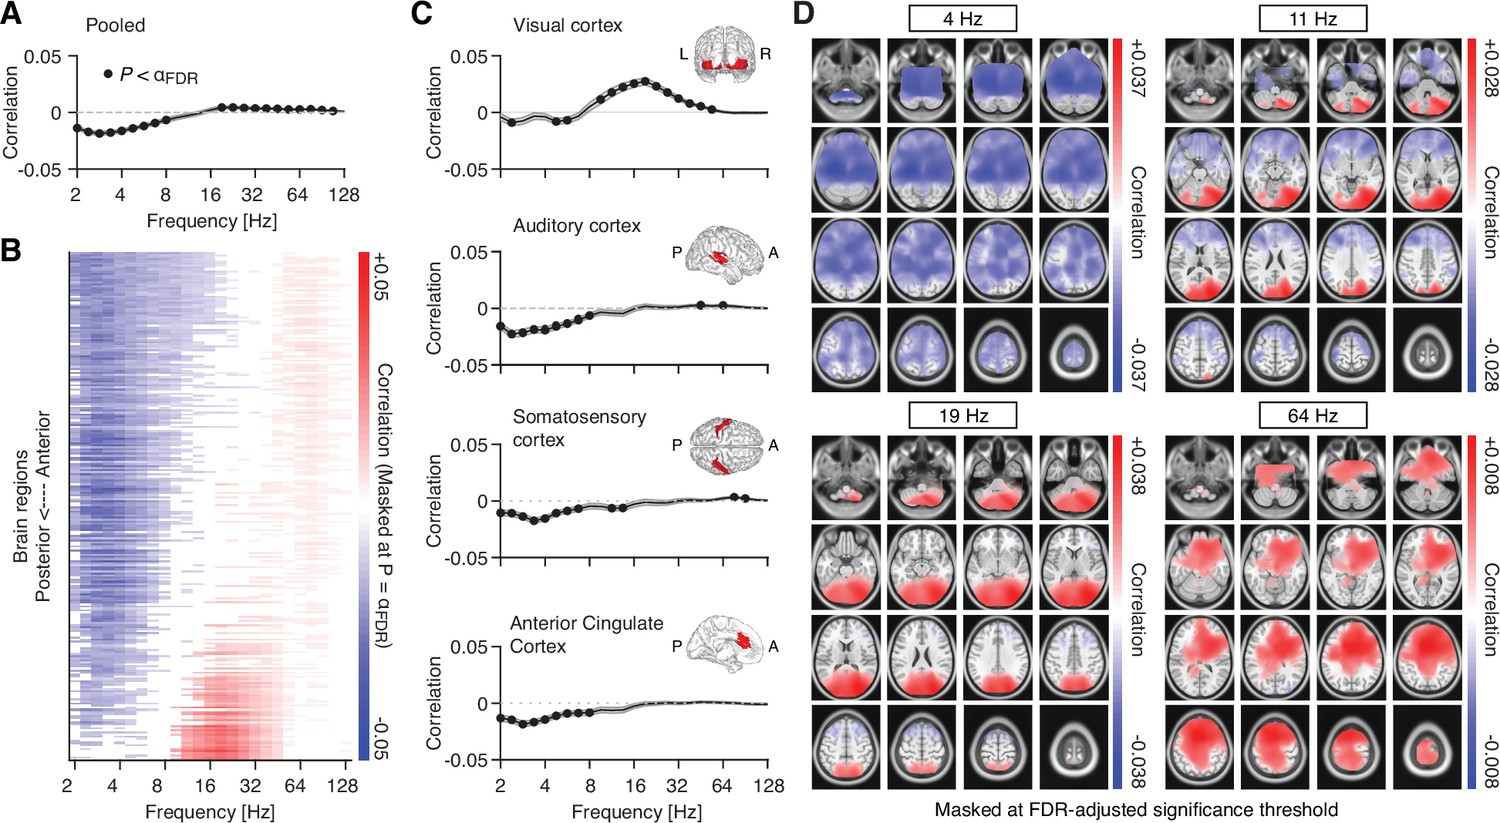
Source space pupil-derivative-power correlations.
(A) Spectrum of pupil-derivative-power correlations, averaged across all 8799 source locations. Filled black circles denote significant correlations after FDR adjustment (two-tailed paired t-test; FDR-adjusted α = 0.013, with q = 0.1). The gray shaded area depicts the standard error of the mean across subjects. (B) Pupil-power correlations, averaged across the 246 regions of the Brainnetome atlas and sorted from anterior to posterior regions. Masked at FDR-adjusted significance threshold (two-tailed paired t-test; FDR-adjusted α = 0.006, with q = 0.1). (C) Pupil-power correlations across four selected regions of interest (filled black circles denote significant correlations after FDR adjustment with q = 0.1): visual cortex (α = 0.011), auditory cortex (α = 0.004), somatosensory cortex (α = 0.009), and anterior cingulate cortex (α = 0.004; from top to bottom). Insets depict the spatial extent of the respective region of interest. (D) Spatial distribution of pupil-power correlations, across four frequency bands of interest. Correlations between pupil and power (in clockwise direction, starting from the top left) at 4, 11.3, 19.0, and 64 Hz. All maps are masked at the FDR-adjusted significance thresholds with q = 0.1 (4 Hz: α = 0.0087; 11 Hz: α = 0.0048; 19 Hz: α = 0.0038; 64 Hz: α = 0.0050; all p-values were obtained from a two-tailed paired t-test).
Figure 4—figure supplement 2
Difference between pupil-derivative-power (Figure 4—figure supplement 1) and pupil-power correlations (Figure 4).
(A) Differences, pooled across all 8799 source locations (black dots indicate significant correlations after FDR adjustment [two-tailed paired t-test; FDR-adjusted α = 0.004, with q = 0.1]). (B) Differences, averaged across the 246 regions of the Brainnetome atlas, and sorted from anterior to posterior regions. Masked at FDR-adjusted significance threshold (two-tailed paired t-test; FDR-adjusted α = 6.5*10–4, with q = 0.1). (C) Differences across four regions of interest (filled black circles denote significant correlations after FDR adjustment with q = 0.1; from top to bottom): visual cortex, auditory cortex, somatosensory cortex, and anterior cingulate cortex (all α = 0.004). (D) Spatial distribution of difference in pupil-power and pupil-derivative-power correlations, across four frequency bands of interest. All maps are masked at the FDR-adjusted significance thresholds with q = 0.1 (4 Hz: α = 0.0022; 11 Hz: α = 0.0001; 64 Hz: α = 0.0005; all p-values were obtained from a two-tailed paired t-test).
Figure 5 with 1 supplement
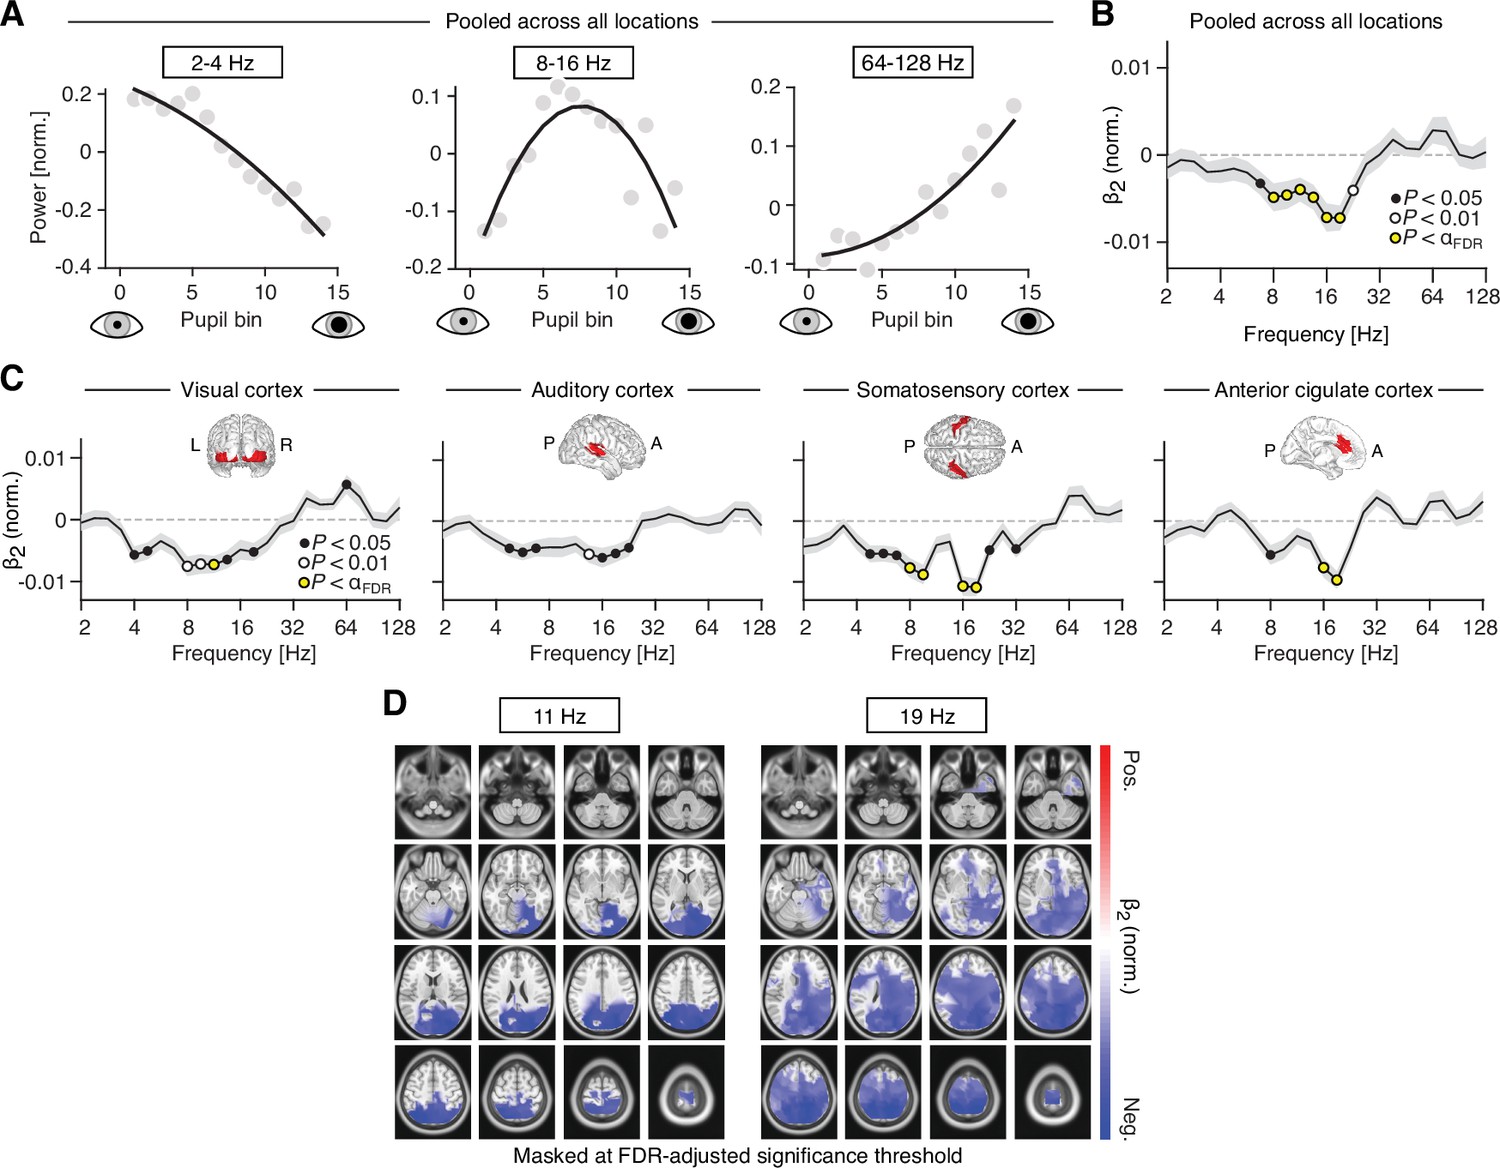
Nonlinear relations between pupil-linked arousal and band-limited power fluctuations.
(A) Normalized spectral power, averaged across three frequency ranges (2–4, 8–16, and 64–128 Hz; from left to right), as a function of mean pupil diameter. (B) Normalized coefficient of the quadratic term (β2; see Materials and methods for details), averaged across all subjects and atlas regions. Black dots denote p < 0.05, white dots denote p < 0.01 and yellow dots denote p < 0.005 (FDR-adjusted significance threshold with q = 0.1). The gray shaded area depicts the standard error of the mean across subjects. Positive and negative values are indicative of a U-shaped and inverted U-shaped relationship, respectively. (C) Normalized β2 coefficient, averaged across all subjects, separately for four regions of interest: visual cortex, auditory cortex, somatosensory cortex, and anterior cingulate cortex (from left to right). Insets show the approximate extent of the regions of interest. Yellow dots denote p < 0.004 (FDR-adjusted significance threshold with q = 0.1). (D) Spatial distribution of the coefficient of the quadratic term (see Materials and methods for details), at center frequencies 11 Hz (left) and 19 Hz (right). Masked at the FDR-adjusted significance threshold with q = 0.1 (11 Hz: α = 0.003; 19 Hz: α = 0.0081). All p-values were obtained from two-tailed t-tests.
Figure 5—figure supplement 1
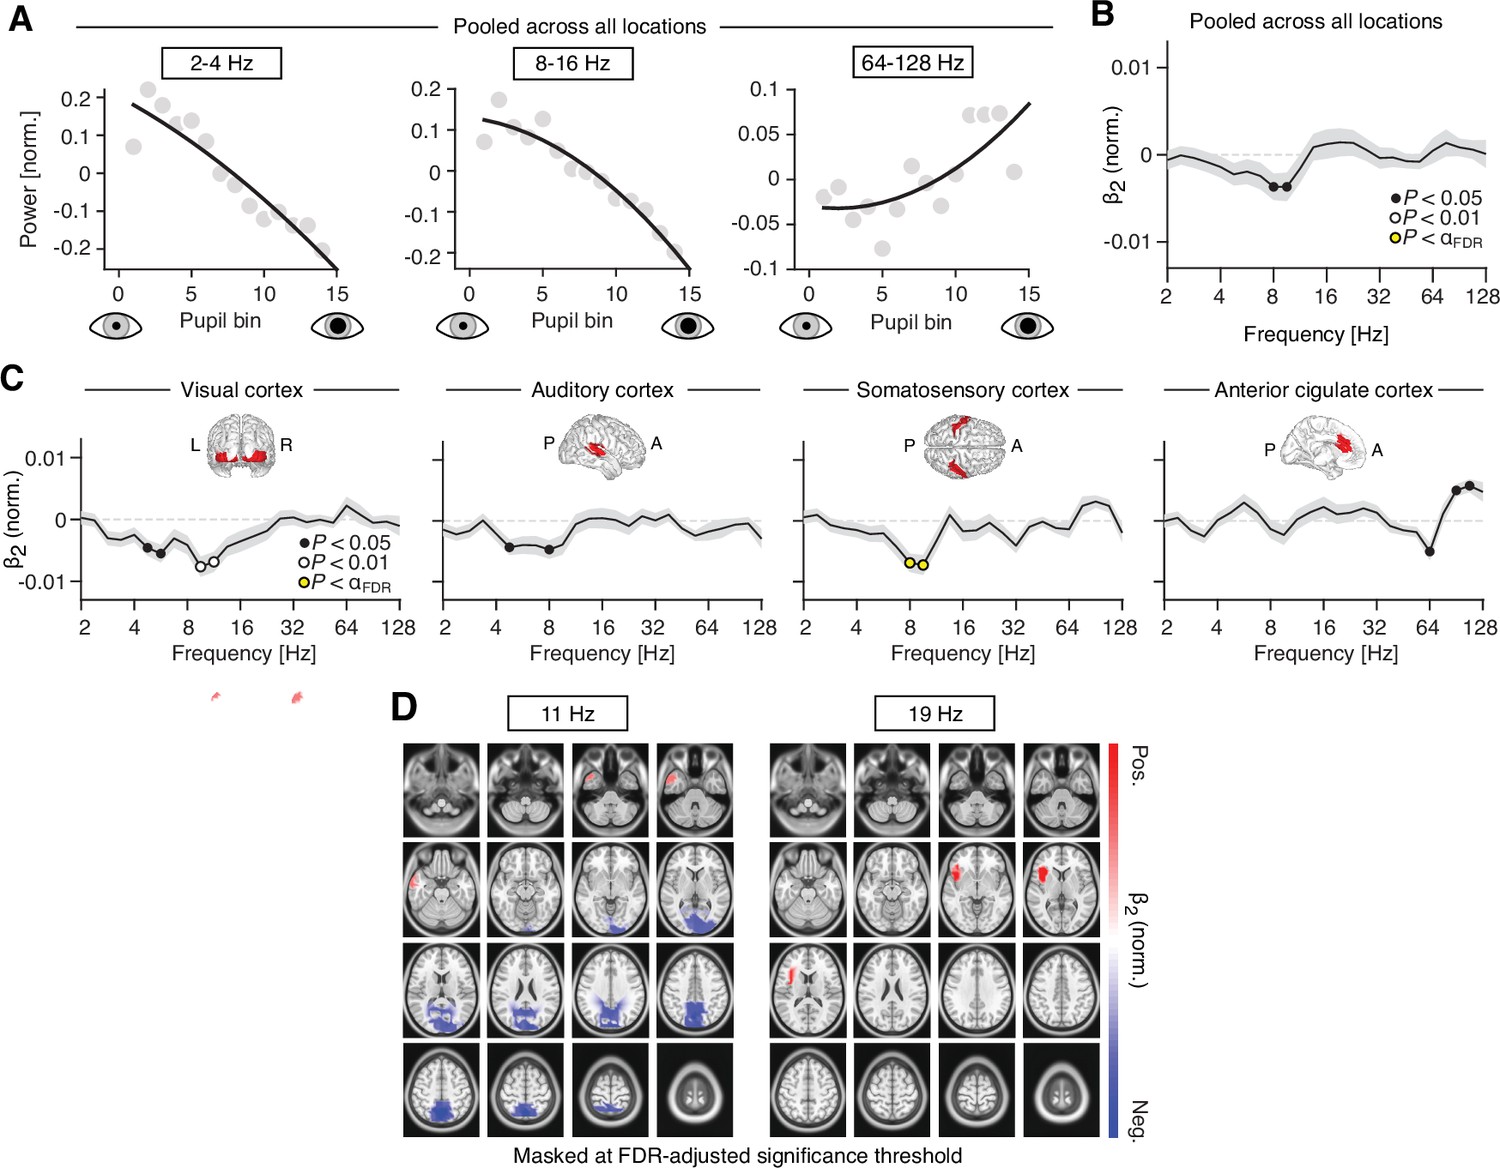
Nonlinear relations between pupil-derivative and band-limited power fluctuations.
(A) Normalized spectral power, averaged across three frequency ranges (2–4, 8–16, and 64–128 Hz; from left to right), as a function of mean pupil diameter. (B) Normalized coefficient of the quadratic term (β2; see Materials and methods for details), averaged across all subjects and atlas regions. Black dots denote p < 0.05, red dots denote p < 0.01, and yellow dots denote p < 0.005 (FDR-adjusted significance threshold with q = 0.1). The gray shaded area depicts the standard error of the mean across subjects. Positive and negative values are indicative of a U-shaped and inverted U-shaped relationship, respectively. (C) Normalized β2 coefficient, averaged across all subjects, separately for four regions of interest: visual cortex, auditory cortex, somatosensory cortex, and anterior cingulate cortex (from left to right). Insets show the approximate extent of the regions of interest. Yellow dots denote p < 0.004 (FDR-adjusted significance threshold with q = 0.1). (D) Spatial distribution of the coefficient of the quadratic term (see Materials and methods for details), at center frequencies 11 Hz (left) and 19 Hz (right). Masked at the FDR- adjusted significance threshold with q = 0.1 (11 Hz: α = 0.003; 19 Hz: α = 0.0081). All p-values were obtained from two-tailed paired t-tests.
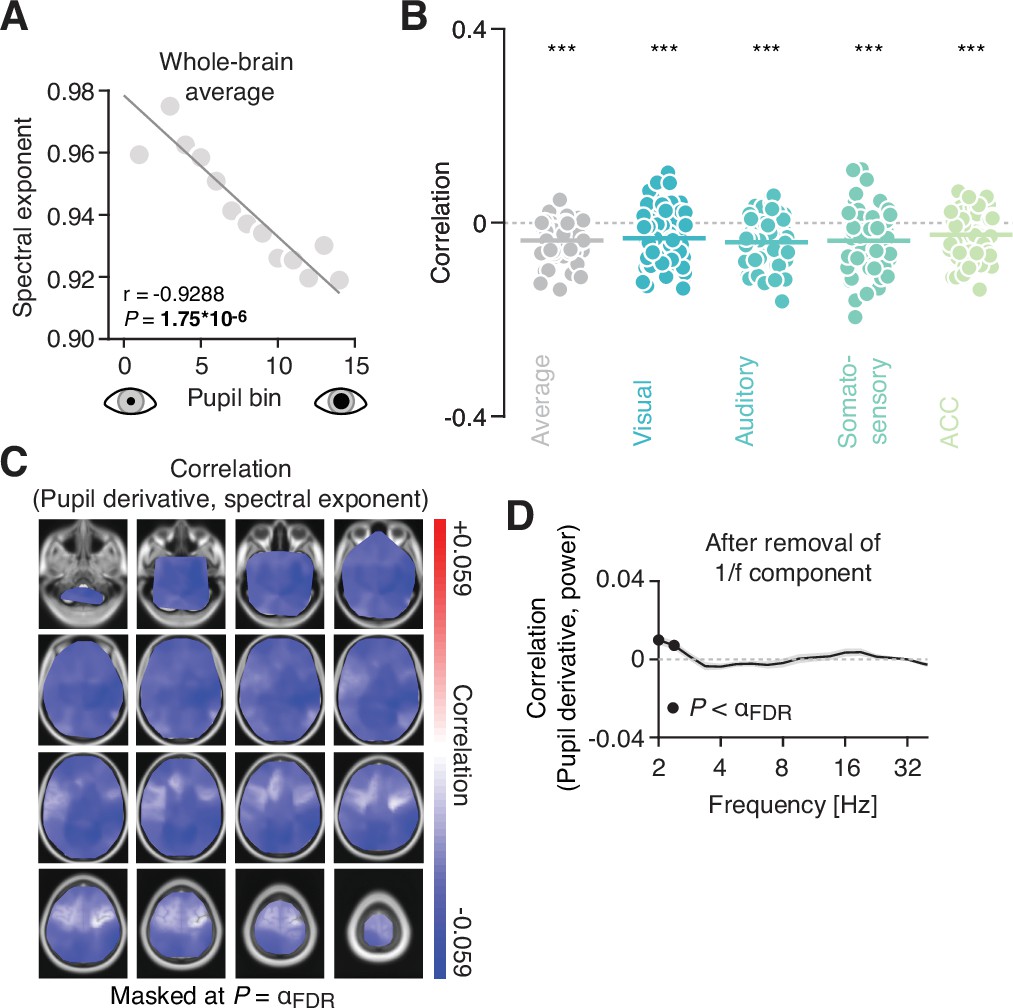
Figure 6 with 1 supplement
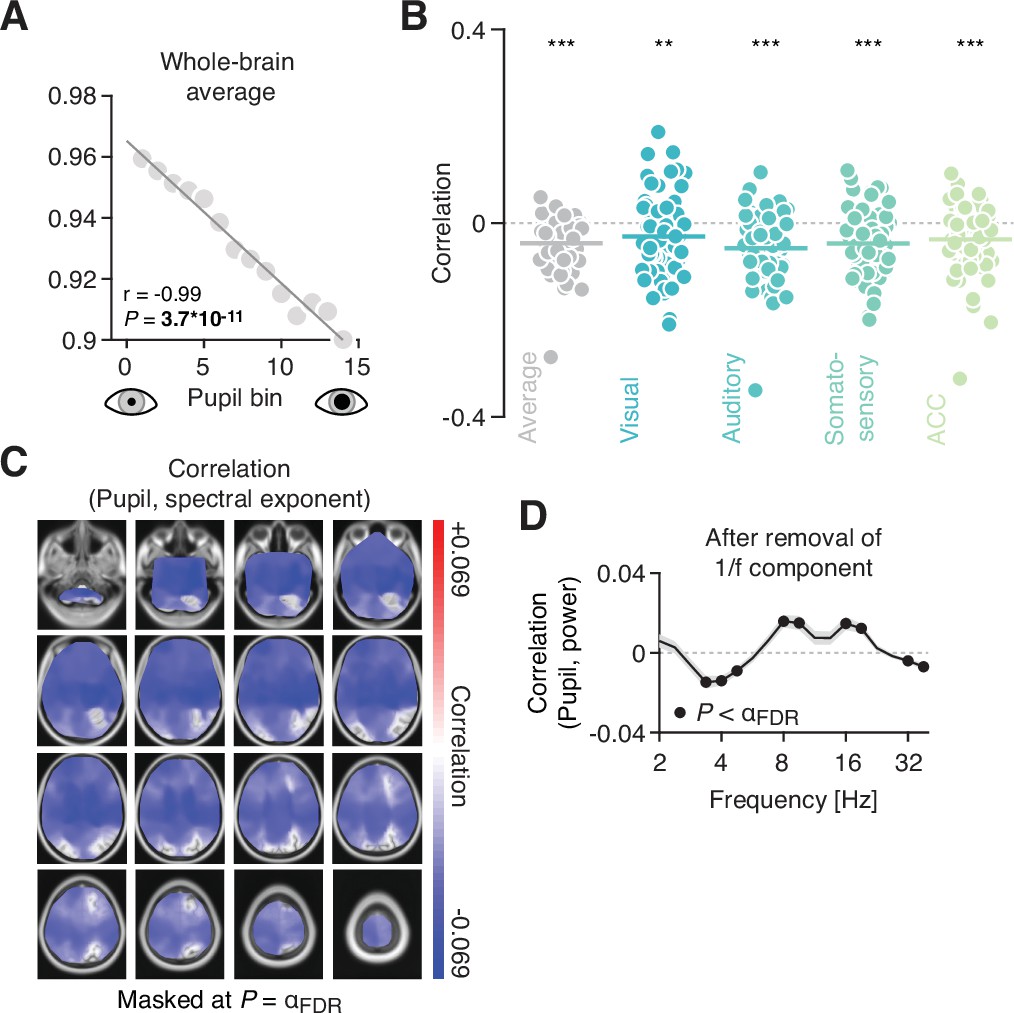
Pupil-linked arousal correlates with slope of the aperiodic component of the power spectrum.
(A) Spectral exponent (i.e., the slope of the aperiodic component) for 14 pupil bins (sorted from small to large pupil diameter). (B) Coefficients of the correlation between the spectral exponent and pupil diameter fluctuations, averaged across space (black dots, showing the individual subjects) and for the four regions of interest: visual cortex, auditory cortex, somatosensory cortex, and anterior cingulate cortex. The horizontal lines highlight the mean correlation coefficient (***p < 0.001, **p < 0.01; two-tailed paired t-tests). (C) Spatial map of the correlation between the slope of the aperiodic component and intrinsic fluctuations in pupil diameter. Spatial maps are masked at the FDR-adjusted significance threshold of α = 0.009 (with q = 0.1); p-values were obtained from a two-tailed paired t-test. (D) Correlations between fluctuations in pupil diameter and band-limited power, after removing the aperiodic component. The frequency axis is truncated, due to fitting the slope of the power spectrum only in the 3–40 Hz range. Black dots denote significant values (filled circles p < 0.012; FDR-adjusted significance threshold with q = 0.1; two-tailed paired t-test).
Figure 6—figure supplement 1
Pupil derivative correlates with aperiodic component of the power spectrum.
(A) Spectral exponent (i.e., the slope of the aperiodic component) for 14 pupil bins (sorted from small to large). (B) Correlation coefficients of the correlation between the spectral exponent and pupil diameter fluctuations, averaged across space (black dots, showing the individual subjects) and for the four regions of interest: visual cortex, auditory cortex, somatosensory cortex, and anterior cingulate cortex. The horizontal lines highlight the mean correlation coefficient (***p < 0.001; two-tailed paired t-tests). (C) Spatial map of the correlation between the slope of the aperiodic component and intrinsic fluctuations in pupil derivative. Spatial maps are masked at the FDR-adjusted significance threshold of α = 0.01 (with q = 0.1). (D) Correlations between fluctuations in pupil derivative and band-limited power, after removing the aperiodic component. Black dots denote significant values (filled circles p < 0.0041; FDR-adjusted significance threshold with q = 0.1). All p-values were obtained from two-tailed paired t-tests.
Author response image 1
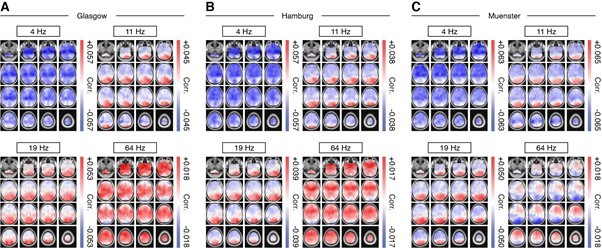
Source maps of pupil-power correlations for four frequency bands of interest.
Similar to Figure 4D, but separately for each site. (A) Glasgow (B) Hamburg and (C) Muenster. Shown are unthresholded maps.
Author response image 2

Spectral exponent as a function of mean pupil diameter, separated by MEG site.
Author response image 3
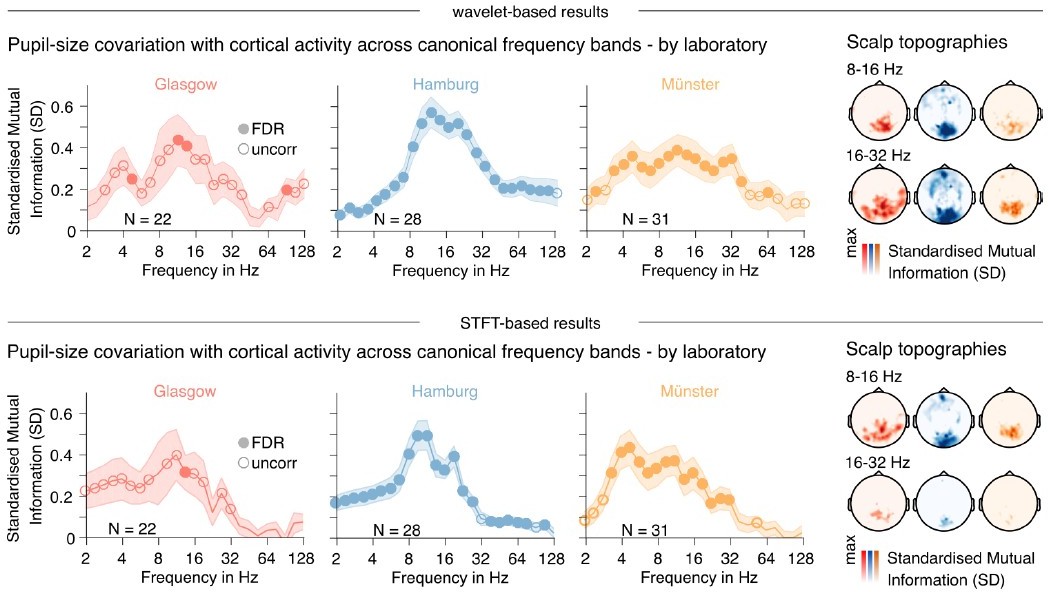
Comparison of results presented in Figure 2, obtained via different spectral decomposition approaches.
Upper panel: Wavelet-based approach as used in the paper. Lower panel: Short-term Fourier transform (STFT) based approach using Welch’s method (0.5 sec window length). Note that the STFT approach seems to impose a 1/f effect onto the results, while also reducing sensitivity in the higher frequency ranges.
Author response image 4
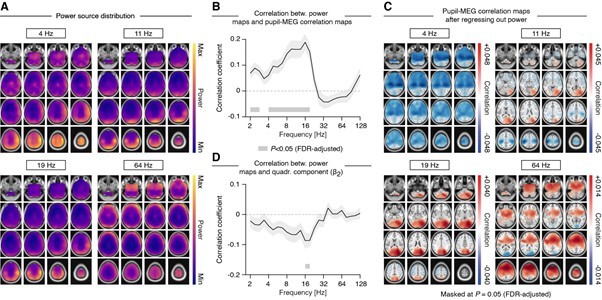
Comparison of the spatial distribution of power and the pupil-MEG correlation maps across four frequency bands of interest.
(A) Distribution of source power. Power estimates were adjusted in order to correct for the “center of the head” bias inherent to beamformer source estimates. (B) Correlation between spatial maps of (normalized) power and the spatial maps of pupil-MEG correlations (as shown in Figure 4D). Shaded area depicts the standard error of the mean and gray horizontal lines indicate correlations significantly different from zero after adjusting for the family-wise error (q=0.1). (C) Pupil-MEG correlation maps after regressing out the spatial distribution of power (separately for each participant). (D) Correlation between spatial maps of (normalized) power and ß2 (i.e., the estimated strength of the quadratic relation between pupil and MEG power).
Author response image 5
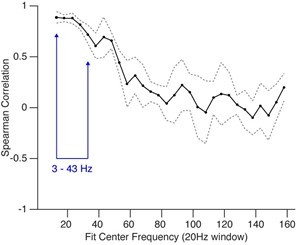
Spearman correlation between changes in excitation-inhibition ratio and PSD slope.
Shown are center frequencies (+/- 10 Hz). Gray dotted lines show the standard deviation across five model runs.
Author response image 6
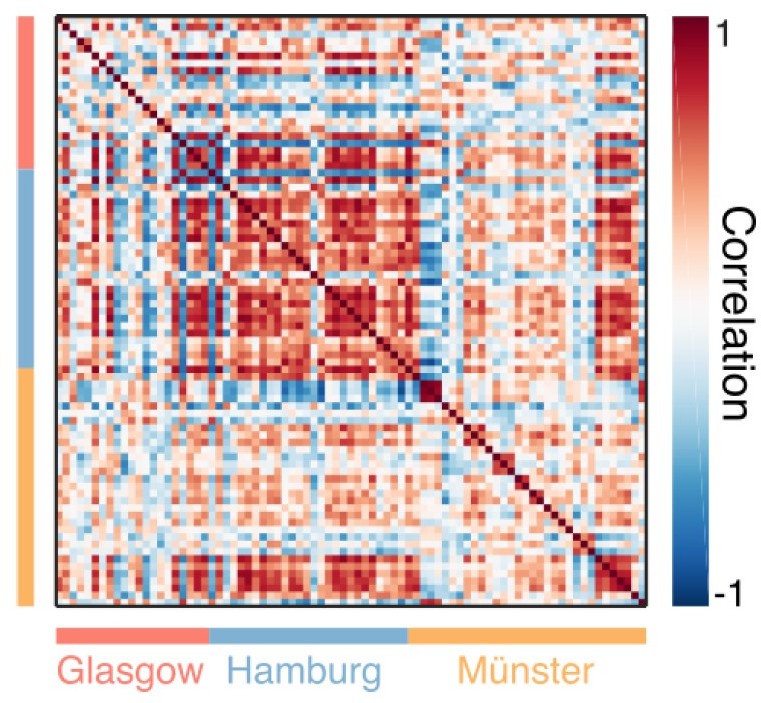
Participant-by-participant correlation of standardised Mutual Information (MI) spectra.
Colour coding along x and y-axes indicate the recording laboratories.
Additional files
Download links
A two-part list of links to download the article, or parts of the article, in various formats.
Downloads (link to download the article as PDF)
Open citations (links to open the citations from this article in various online reference manager services)
Cite this article (links to download the citations from this article in formats compatible with various reference manager tools)
Coupling of pupil- and neuronal population dynamics reveals diverse influences of arousal on cortical processing
eLife 11:e71890.
https://doi.org/10.7554/eLife.71890


