Phylogenomic and mitogenomic data can accelerate inventorying of tropical beetles during the current biodiversity crisis
- Czech Advanced Science and Technology Institute, Palacký University, Czech Republic
Figures
Figure 1
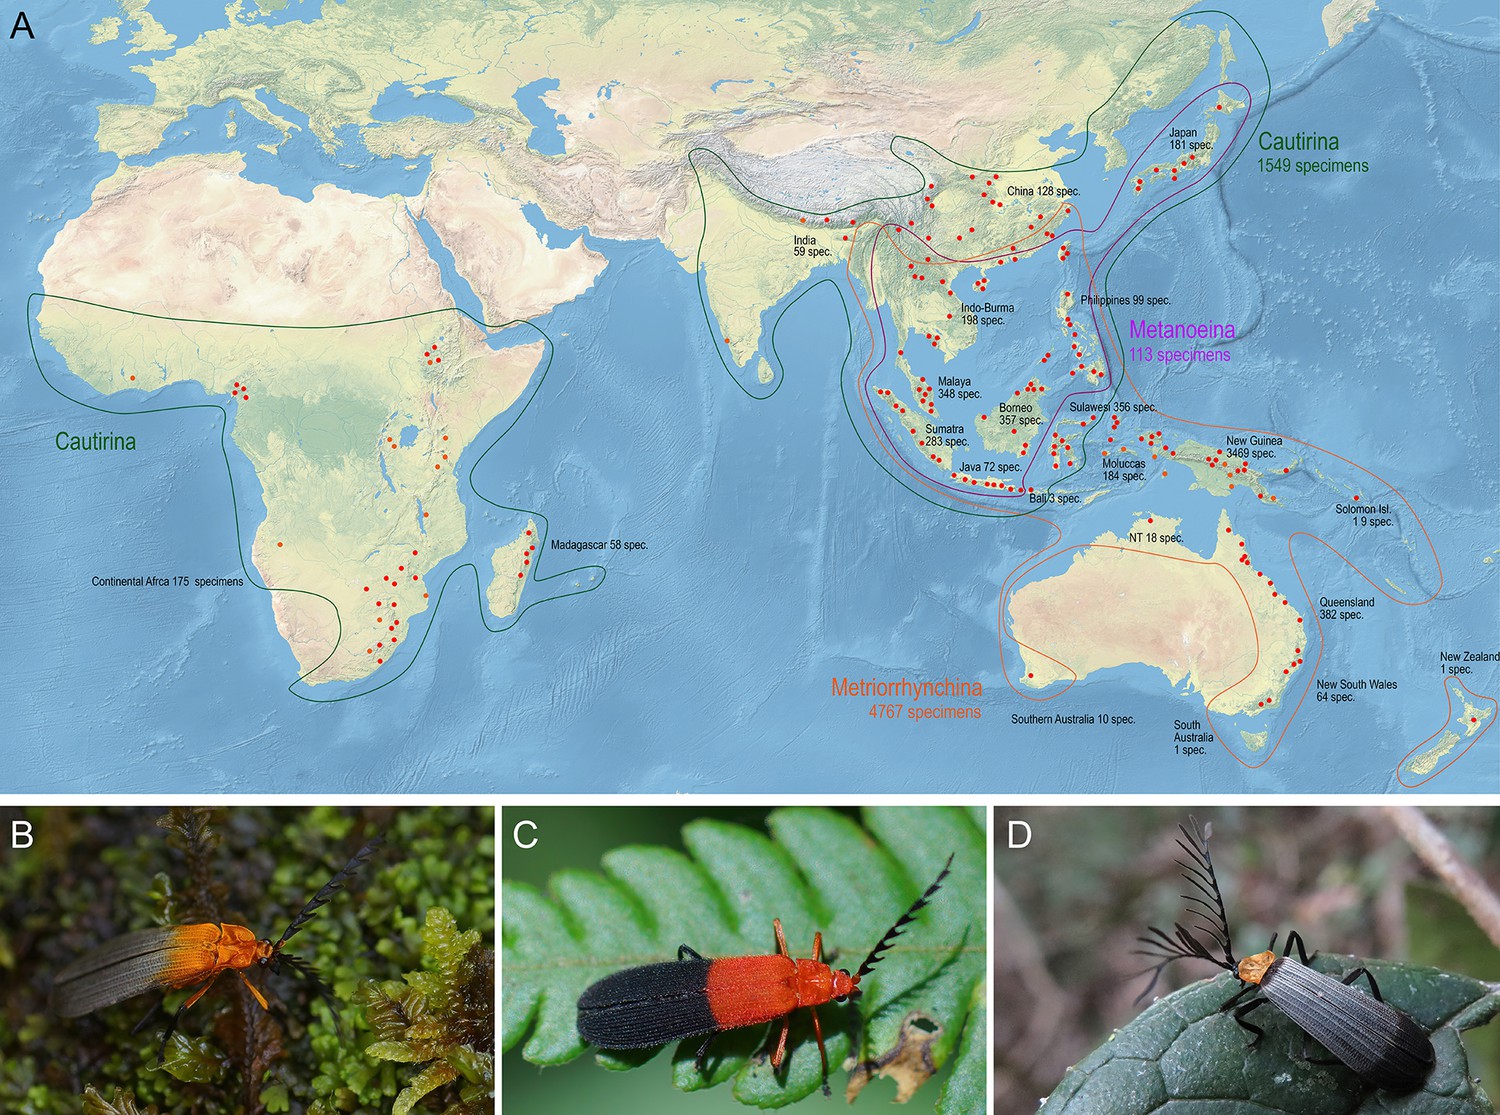
Distribution and appearance of metriorrhynchine net-winged beetles.
(A) Distribution of Metriorrhynchini with major sampled localities designated by red dots. The numbers of analyzed specimens from individual regions are shown for regions and subtribes. (B–D) – General appearance of Metriorrhynchini.
Figure 2
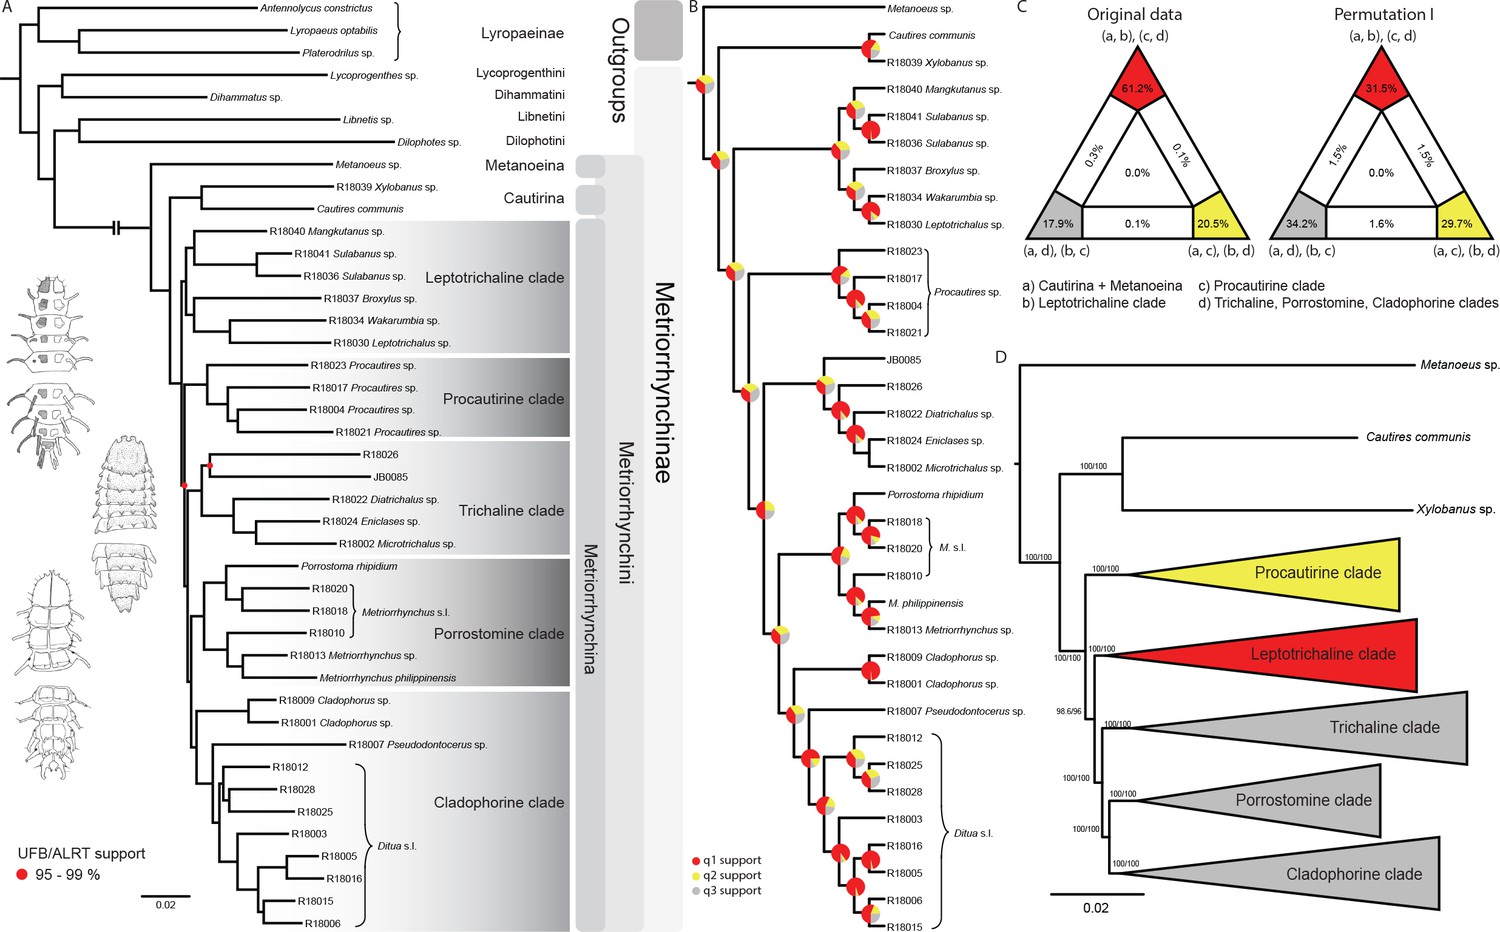
Topologies recovered by phylogenomic analyses.
(A) Phylogenetic relationships of Metriorrhynchinae based on the ML analyses of the concatenated amino-acid sequence data of supermatrix F-1490-AA-Bacoca-decisive. Unmarked branches are supported by 100/100 UFB/alrt; red circles depict lower phylogenetic branch support. (B) Phylogenetic relationships of Metriorrhynchini recovered by the coalescent phylogenetic analysis with ASTRAL when analysing the full set of gene trees (4109 gene trees inferred at the nucleotide level). Pie charts on branches show ASTRAL quartet support (quartet-based frequencies of alternative quadripartition topologies around a given internode). Outgroups taxa are not shown. (C) Results of FcLM analyses for selected phylogenetic hypotheses applied at the amino-acid sequence level (supermatrix F). (D) Alternative phylogenetic relationships of Metriorrhynchinae based on the ML analyses of the concatenated amino-acid sequence data of supermatrix A-4109-AA. Numbers depict phylogenetic branch support values based on 5000 ultrafast bootstrap replicates.
Figure 3
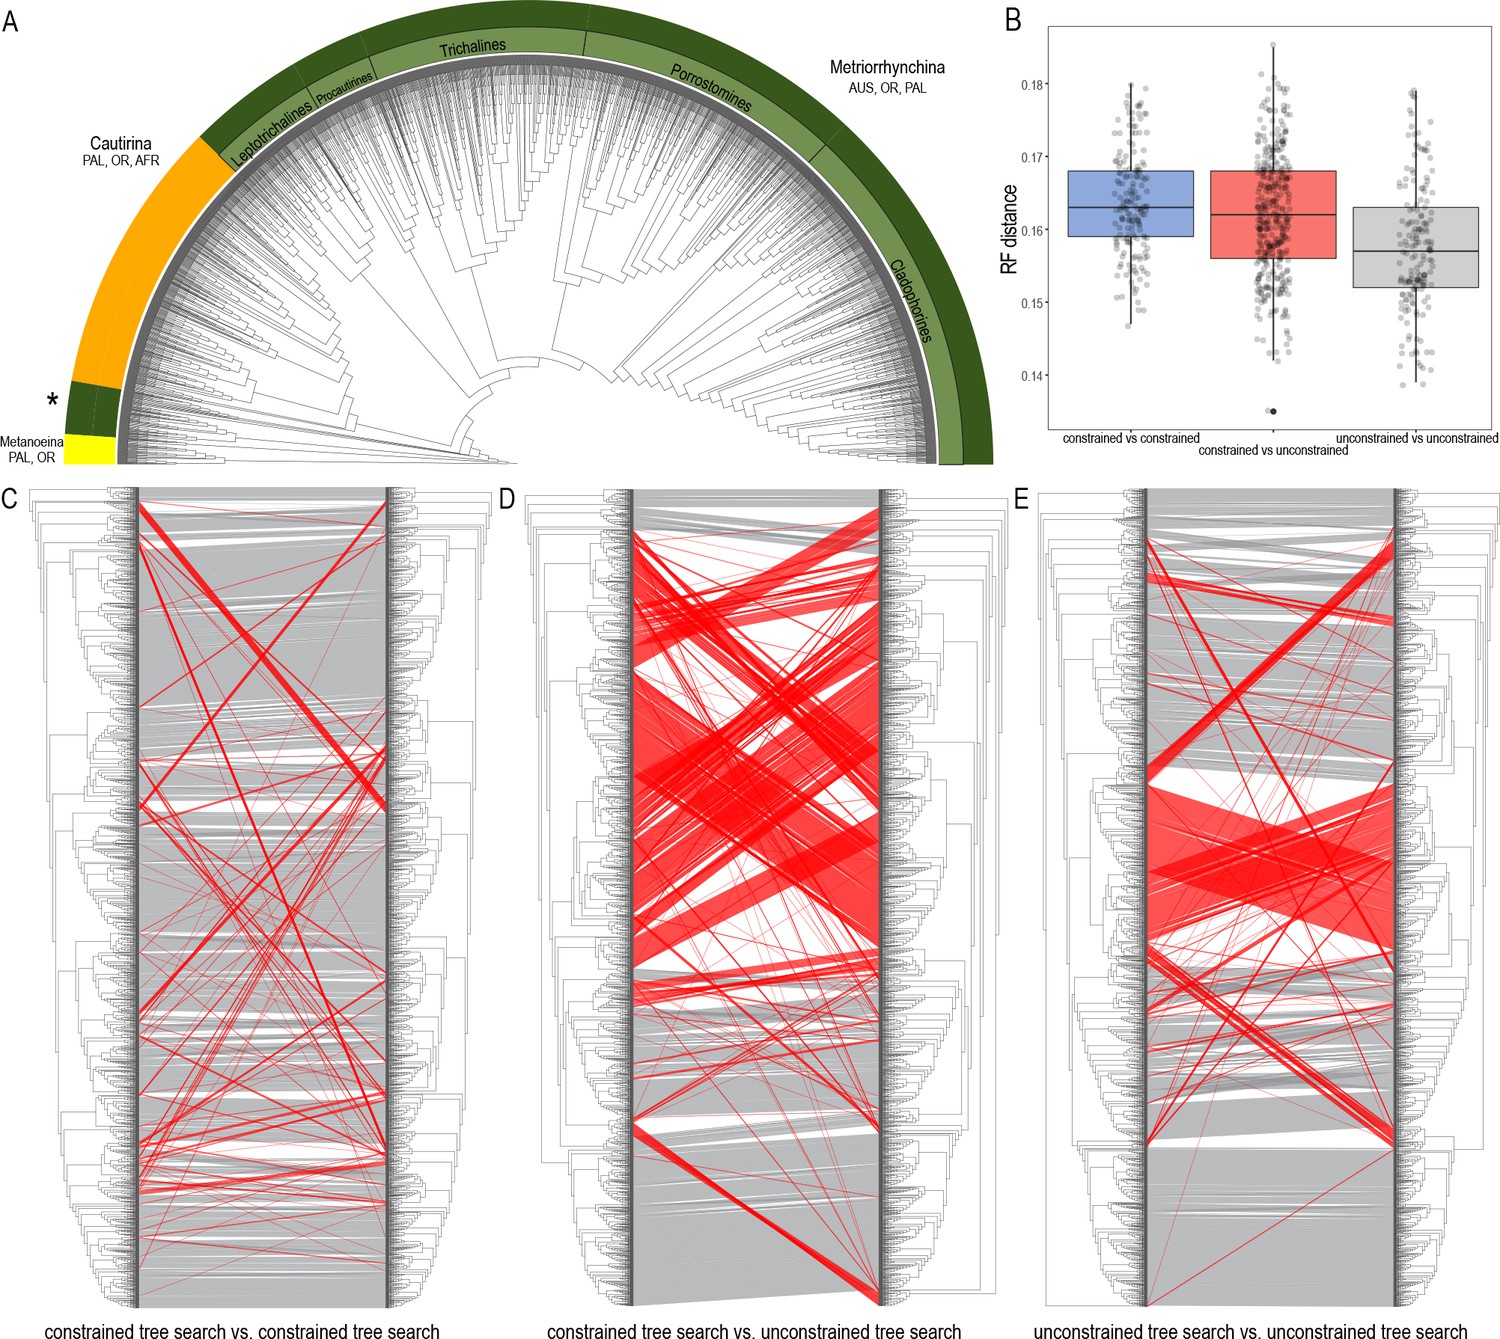
Topologies recovered by mitogenomic analyses.
(A) Relationships of Metriorrhynchini recovered by the constrained analysis of the pruned dataset at 2% distance. (The full resolution tree is shown in Source data 2 along with a tree recovered from the analysis of a complete dataset of 6429 terminals in Source data 1), asterisk designates a grade of Metriorrhynchina-like taxa found in a position in conflict with their morphology; (B) A chart of Robinson-Foulds distances among topologies inferred by repeated runs of the constrained and unconstrained analyses; (C) A comparison of the results obtained by two runs of the constrained analysis; (D) A comparison of trees inferred with/without the phylogenomic backbone; (E) A comparison of results obtained by two runs of the unconstrained analysis. The red lines designate terminals with conflicting positions in compared trees.
Figure 4
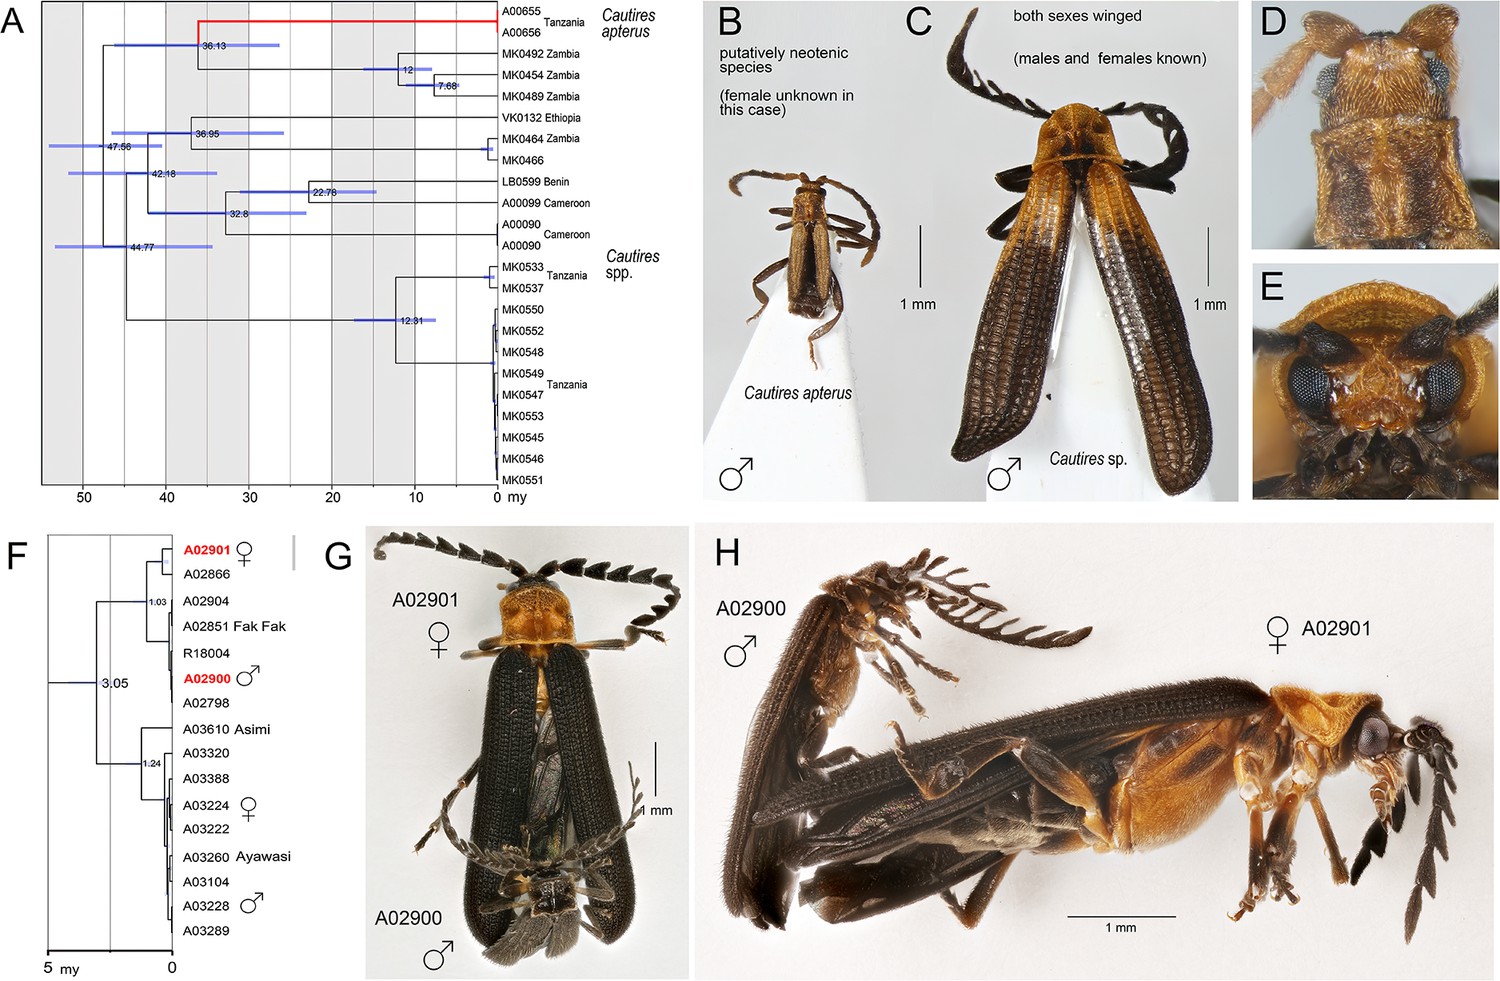
Identification of sexual dimorphism by large-scale biodiversity inventory.
(A) Relationships of lineages with modified ontogeny, the dated tree; (B, D) General appearance and head of Cautires apterus, a putative neotenic species; (C, E) ditto of the close relative with both sexes winged. Mimetic sexual dimorphism identified during diversity survey. (F) The dated tree, red colored terminal labels designate the individuals shown in G and H; (G) Dorsal view of individuals in copula; (H) Ditto, lateral view. Except of collecting individuals in copula, DNA-based assessment of relationships is the only option as the species are sexually dimorphic and no morphological traits indicate their conspecifity.
Figure 5
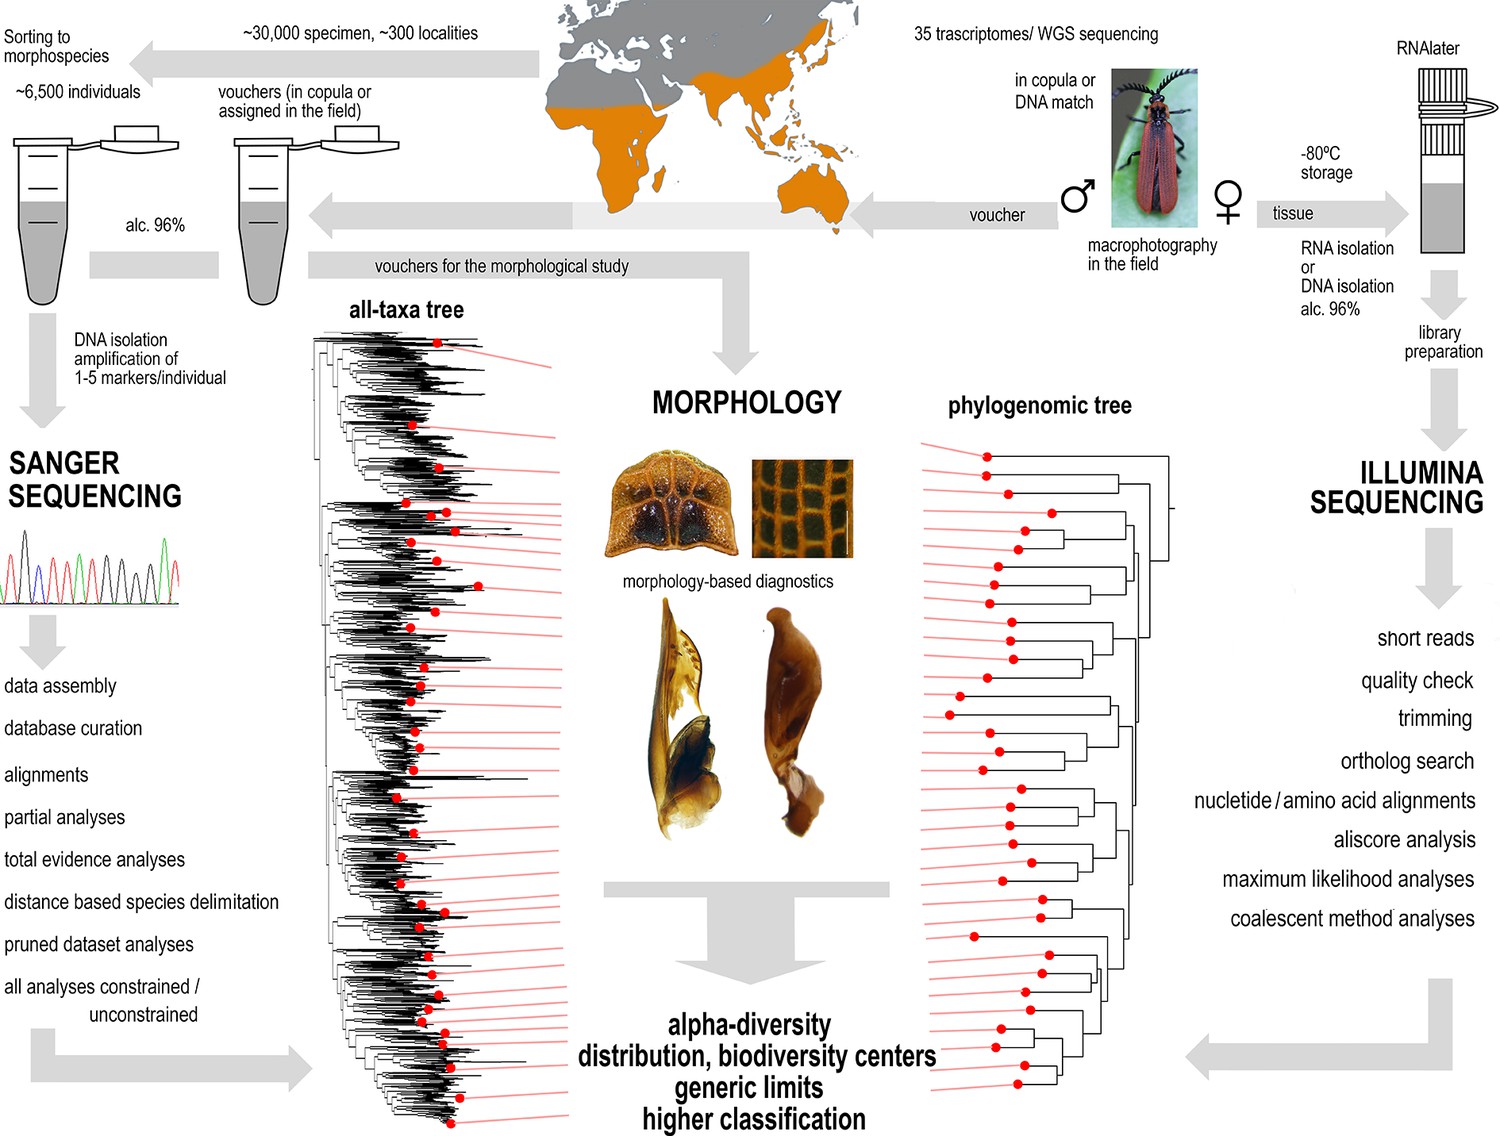
A sequence of applied methods from sampling to hypotheses.
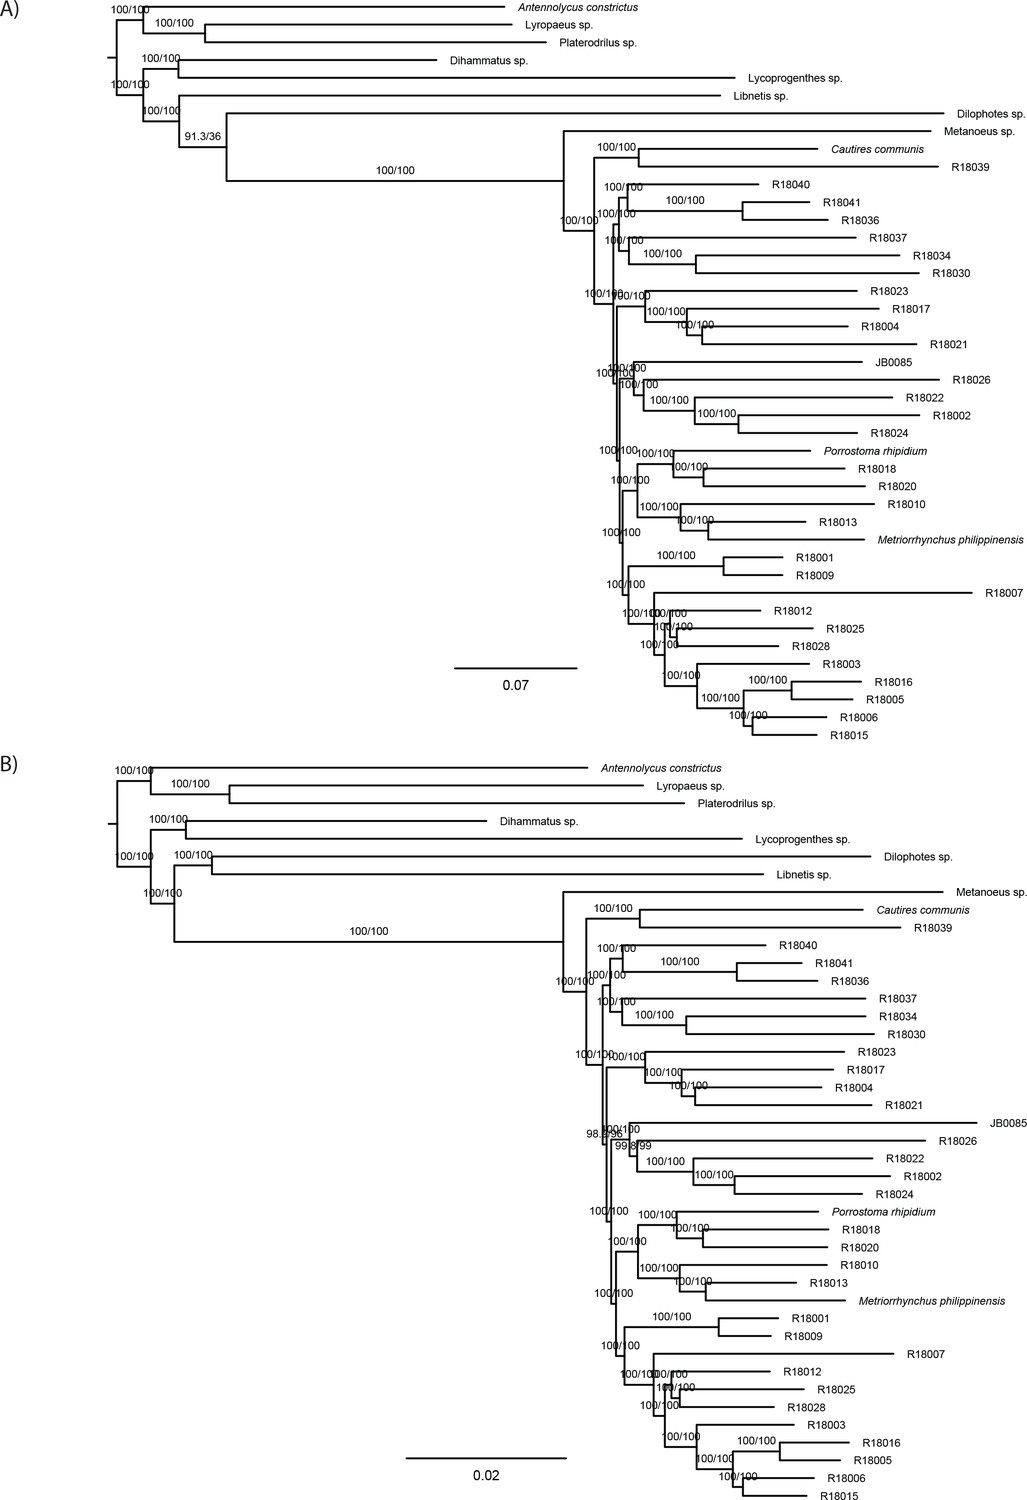
Appendix 1—figure 1
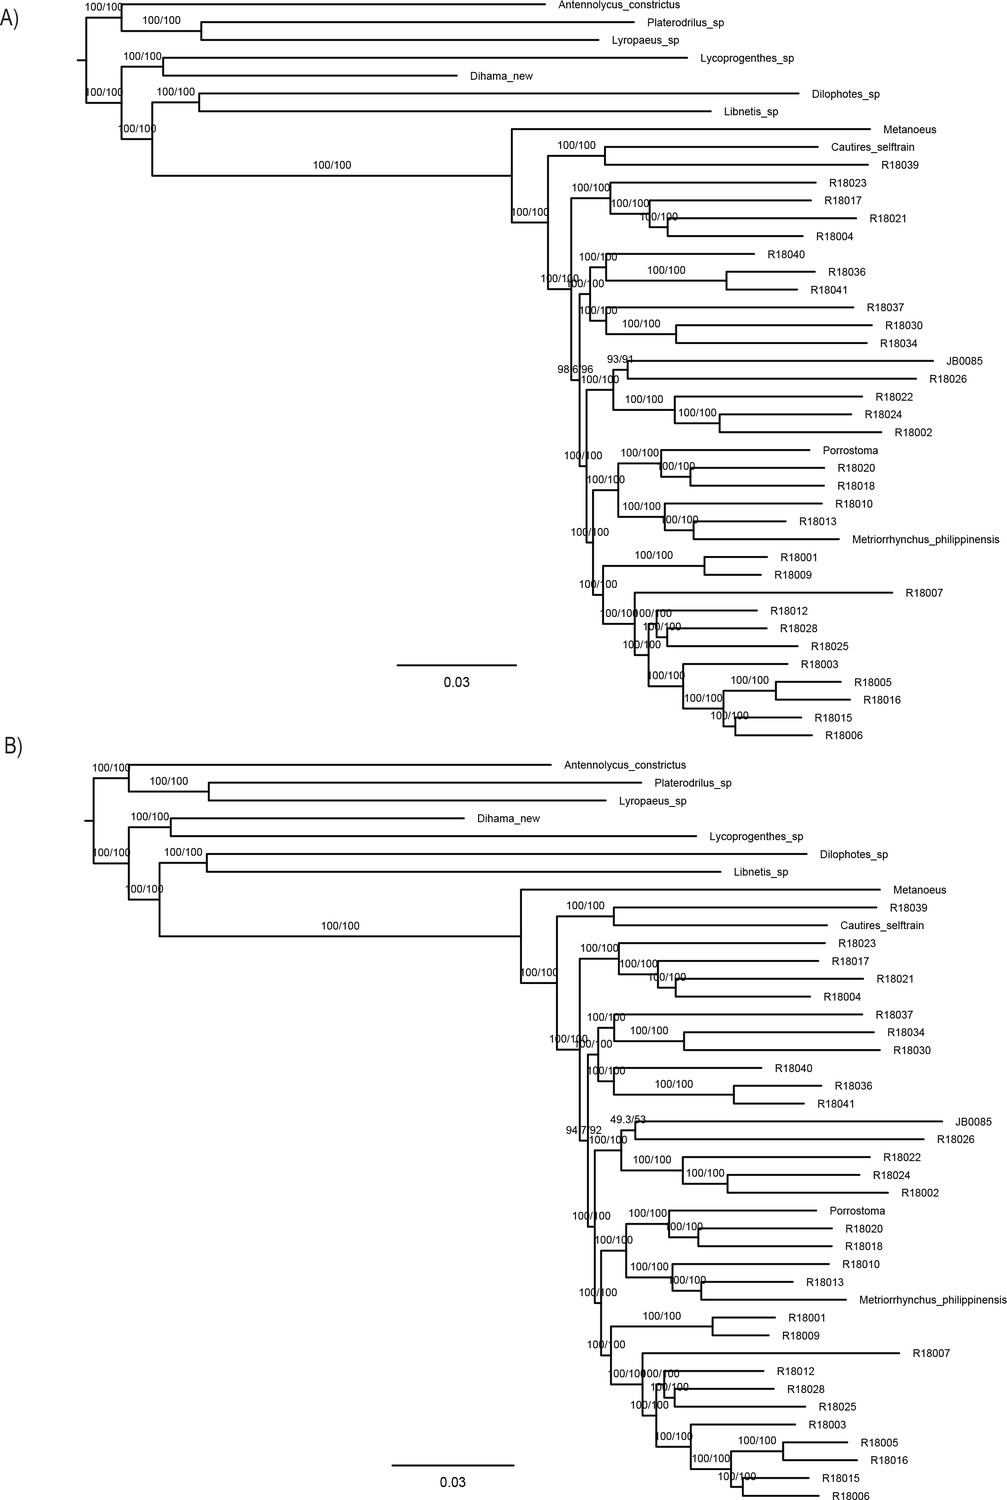
Maximum likelihood trees from IQ-TREE amino acid analysis of dataset A –4109-AA.
(A) With partitioning by gene and (B) without partitioning. The depicted branch support values represent SH-aLRT and ultrafast bootstrap.
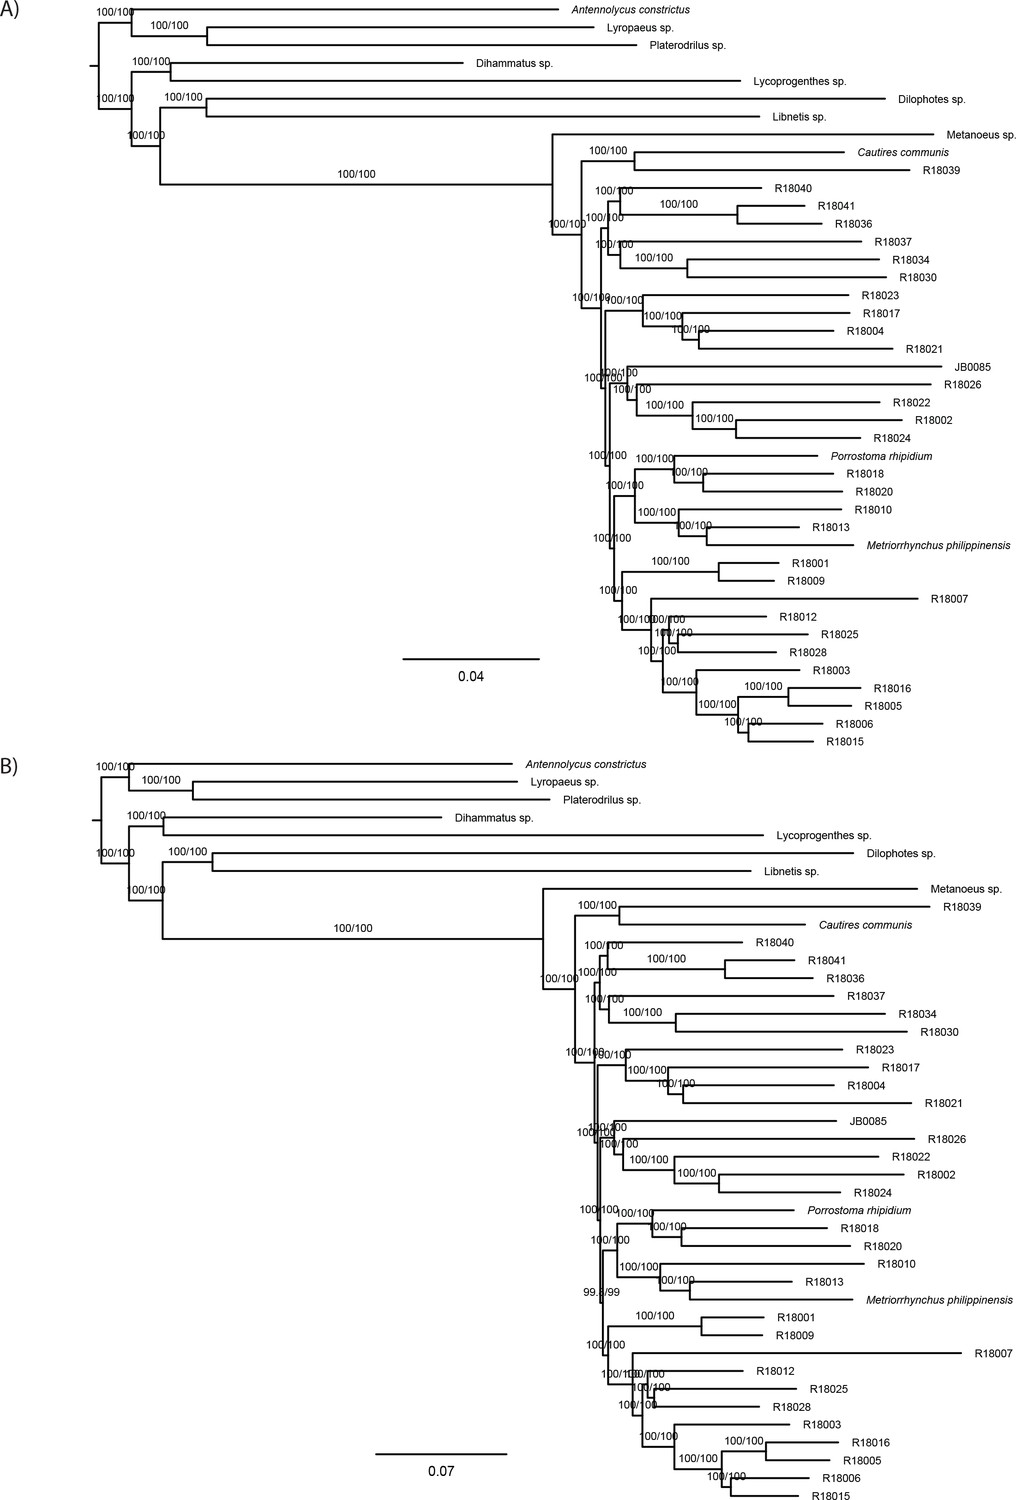
Appendix 1—figure 2
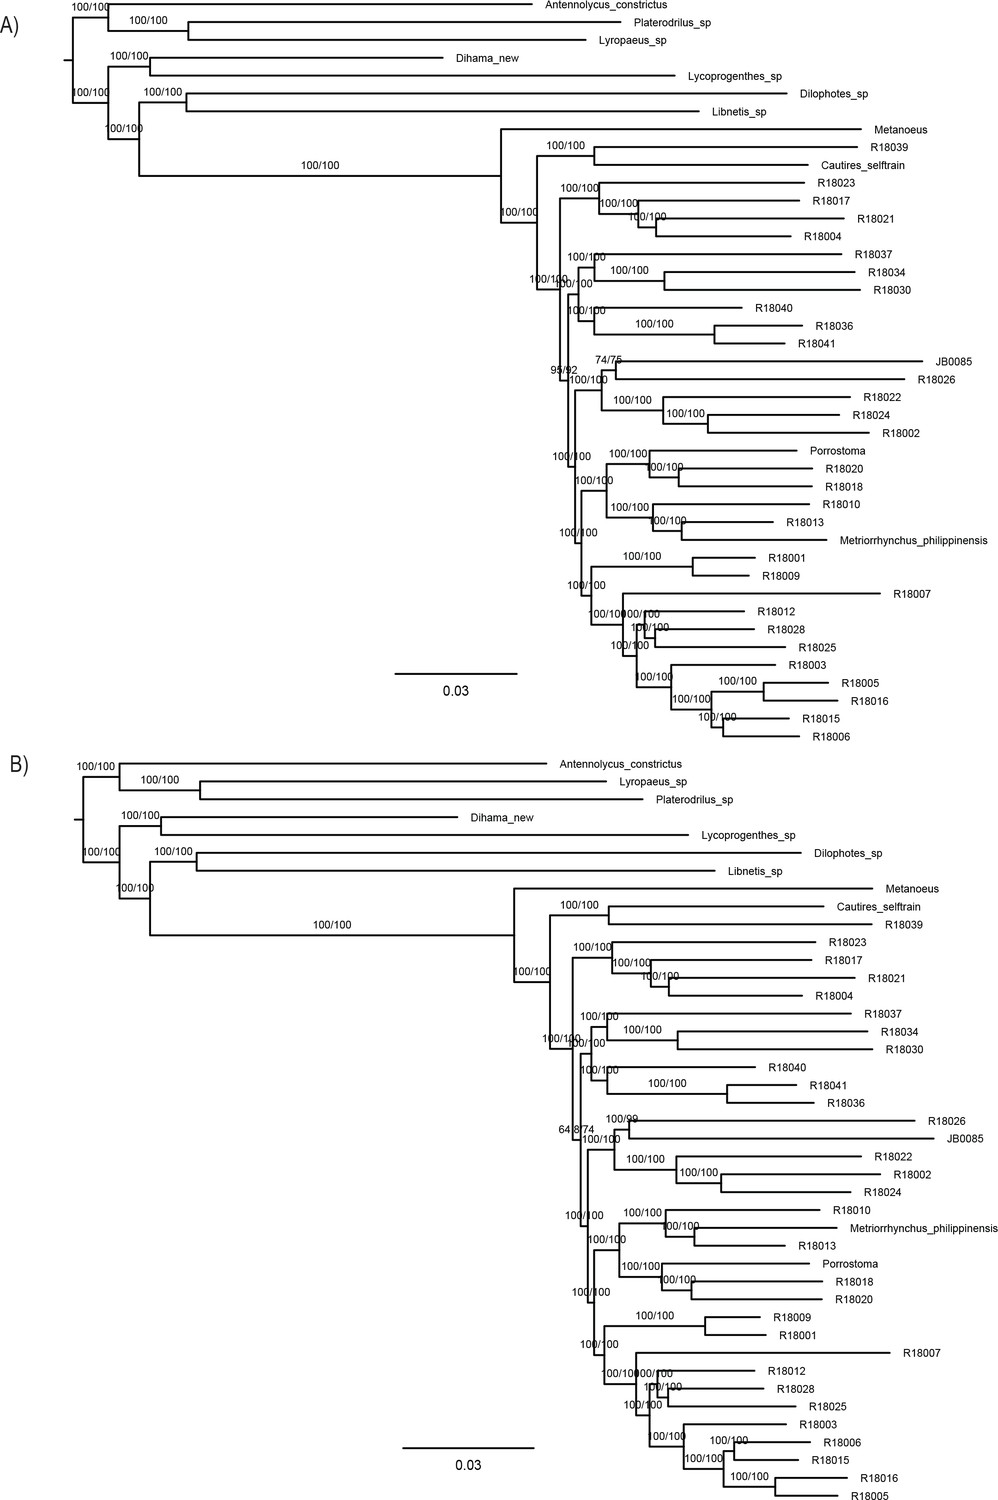
Maximum likelihood trees from IQ-TREE amino acid analysis.
(A) Analysis of the dataset A-4109-AA with optimization of the partitioning scheme and (B) analysis of the dataset D-3370-AA_Bacoca with partitioning by gene. The depicted branch support values represent SH-aLRT and ultrafast bootstrap.
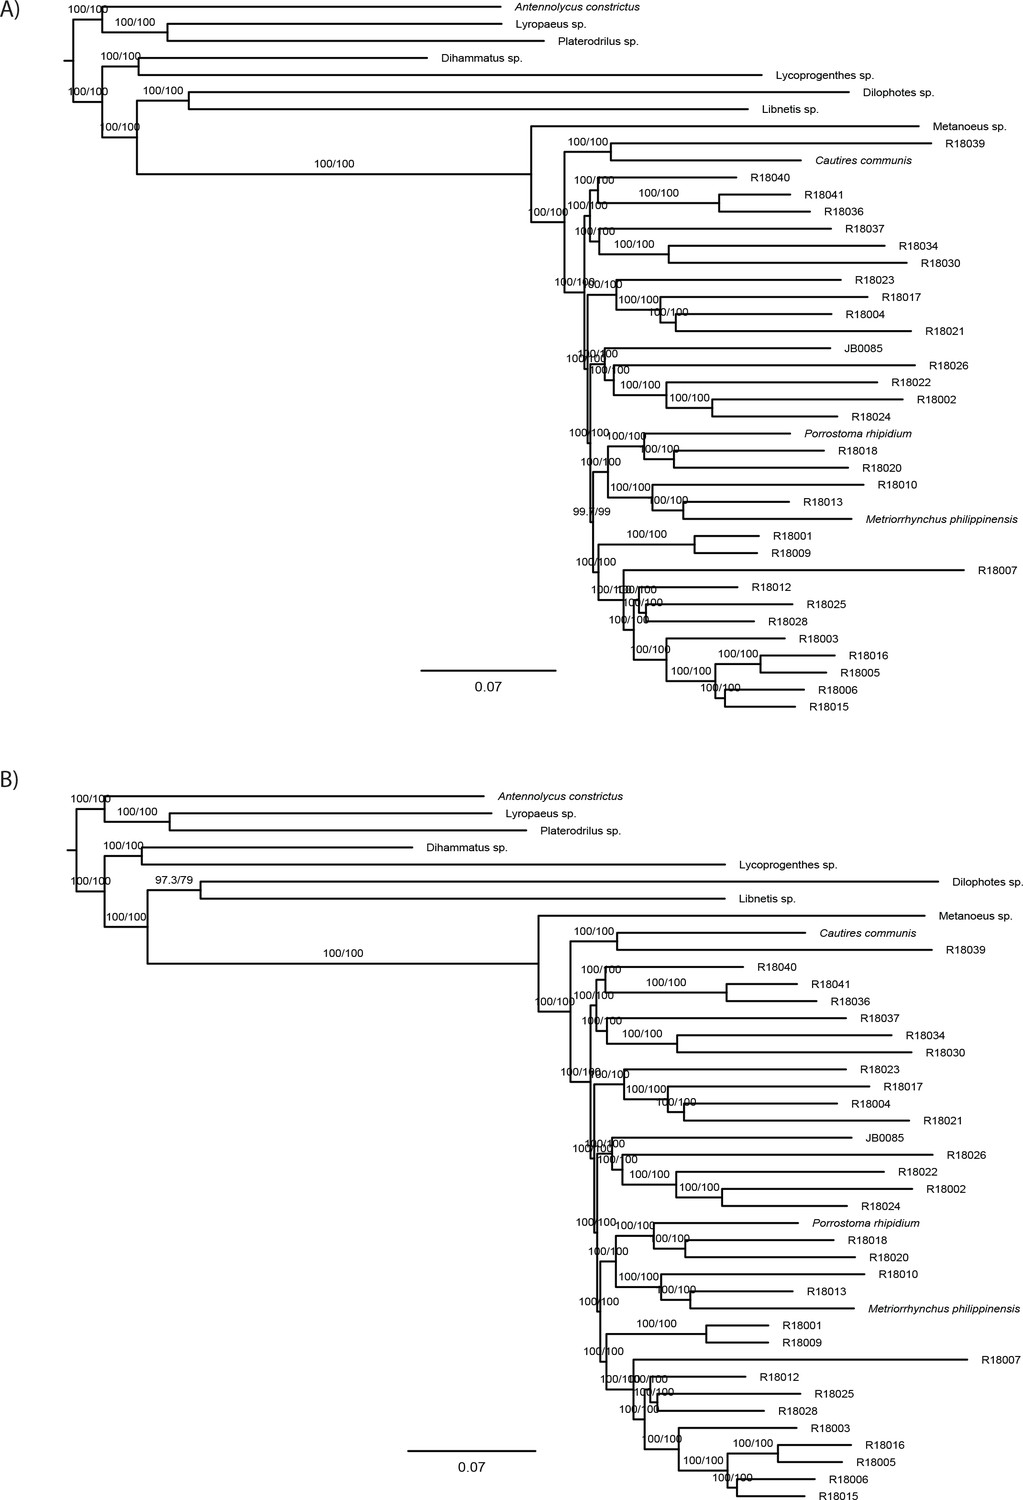
Appendix 1—figure 3
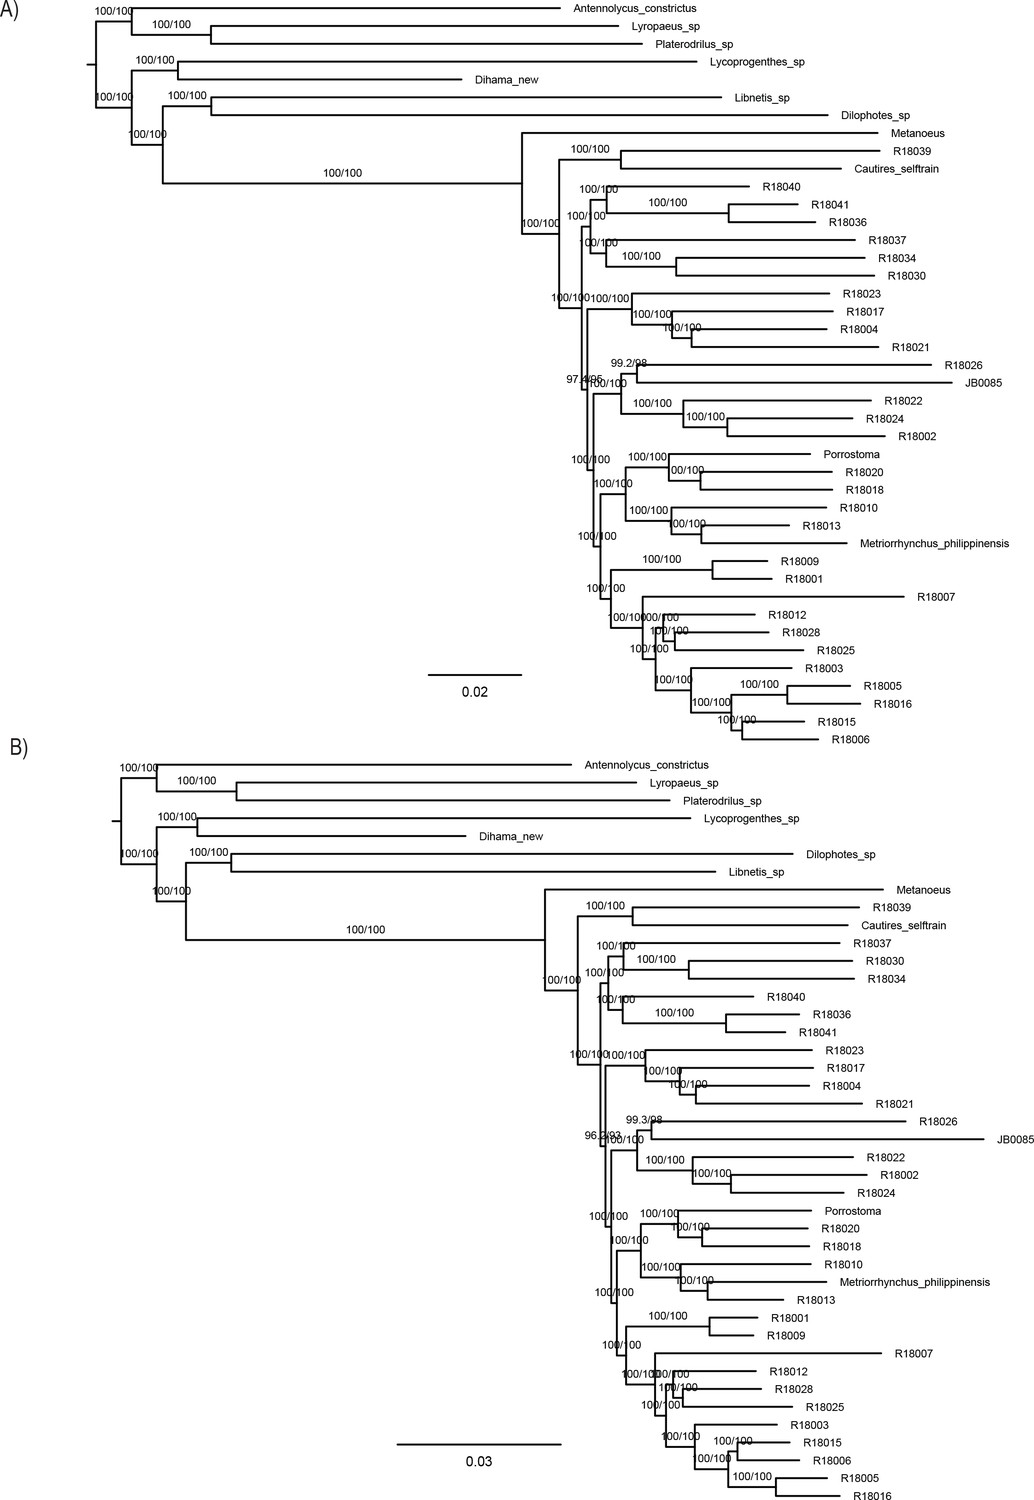
Maximum likelihood trees from IQ-TREE amino acid analysis.
(A) analysis of the dataset A –F-1490-AA_Bacoca_decisive and (B)analysis of the dataset J-2129-AA_MARE. Both datasets were partitioned by gene. The depicted branch support values represent SH-aLRT and ultrafast bootstrap.
Appendix 1—figure 4
Maximum likelihood trees from IQ-TREE nucleotide analysis.
(A) Analysis of the dataset B-4109-NT and (B)analysis of the dataset E-4109-NT2 using only second codon positions. Both datasets were partitioned by gene. The depicted branch support values represent SH-aLRT and ultrafast bootstrap.
Appendix 1—figure 5
Maximum likelihood trees from IQ-TREE nucleotide analysis.
(A) analysis of the datasetC-4109-NT12 using codon positions 1 + 2 and (B) analysis of the dataset G-NT-1767_MaxSymTest. Both datasets were partitioned by gene. The depicted branch support values represent SH-aLRT and ultrafast bootstrap.
Appendix 1—figure 6
Maximum likelihood trees from IQ-TREE nucleotide analysis.
(A) analysis of the dataset H-NT-1645_MaxSymTestmarginal and (B) analysis of the dataset I-NT-3905_MaxSymTestInternal. Both datasets were partitioned by gene. The depicted branch support values represent SH-aLRT and ultrafast bootstrap.
Appendix 1—figure 7
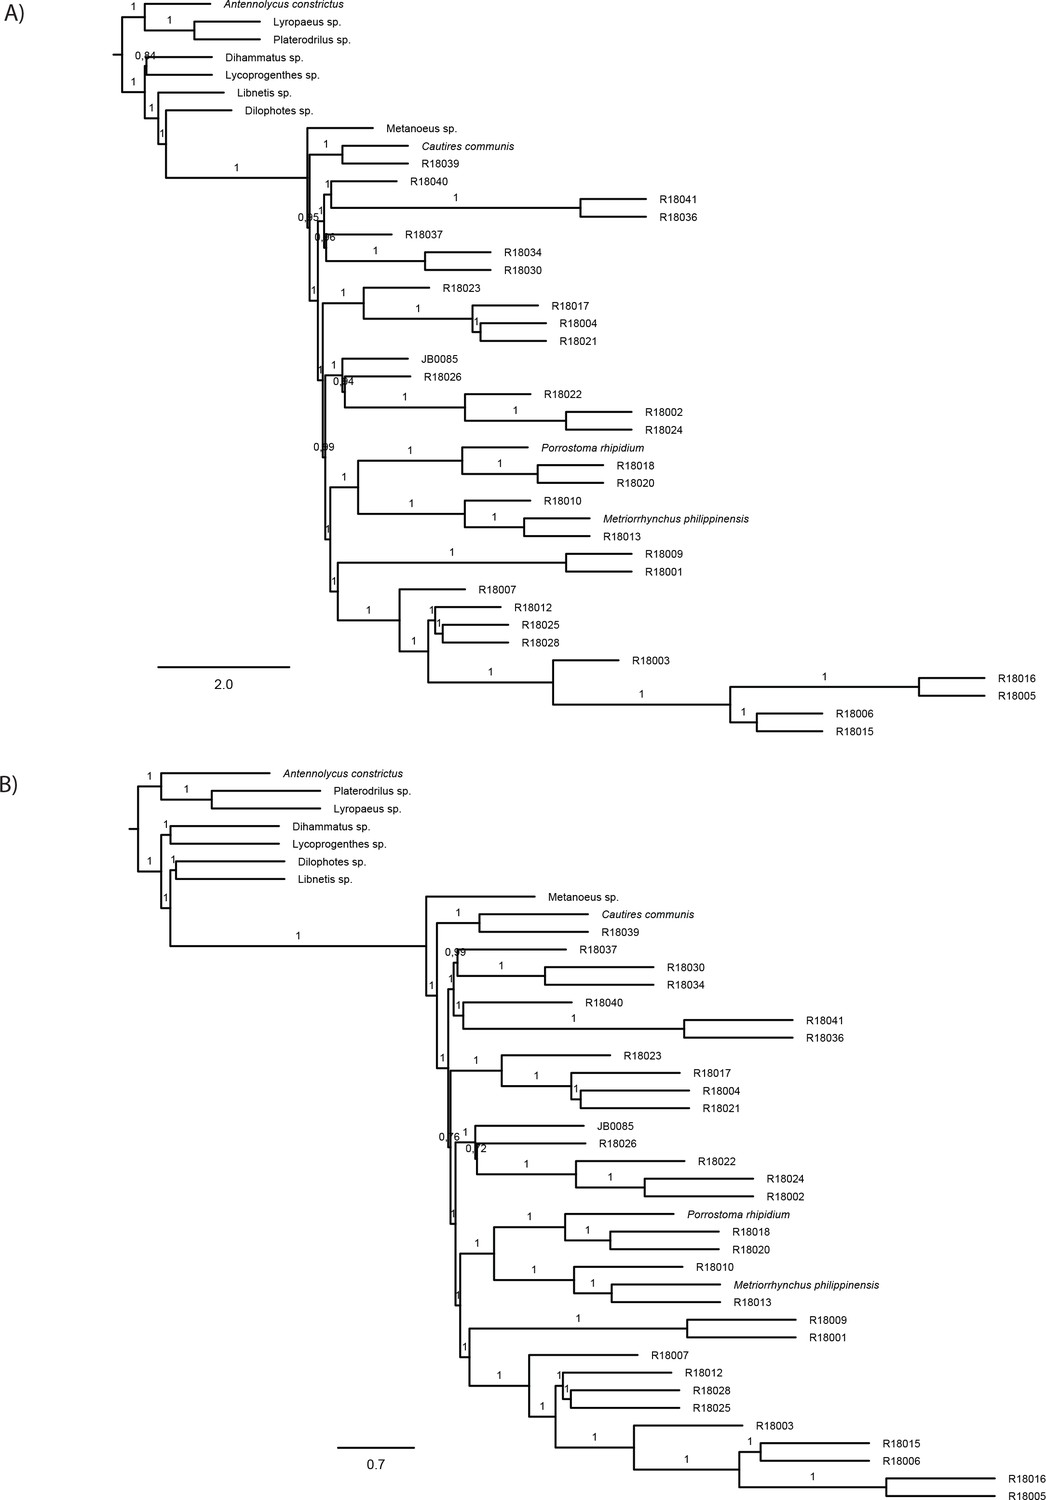
Topologies recovered by Astral analyses.
(A) ASTRAL species trees with branch lengths in coalescent units as resulted from the analyses of individual IQ-TREE maximum likelihood gene trees of nucleotide dataset B-4109-NT and (B) ASTRAL species trees with branch lengths in coalescent units as resulted from the analyses of individual IQ-TREE maximum likelihood gene trees of amino acid dataset A-4199-AA. Numbers on nodes show local posterior probabilities (pp1). Quartet support for the alternative topologies (q1, q2, and q3), total number of induced quartet trees in the gene trees that support the alternative topologies (f1, f2, f3) and local posterior probabilities (pp1, pp2, pp3) are available at Dryad repository.
Appendix 1—figure 8
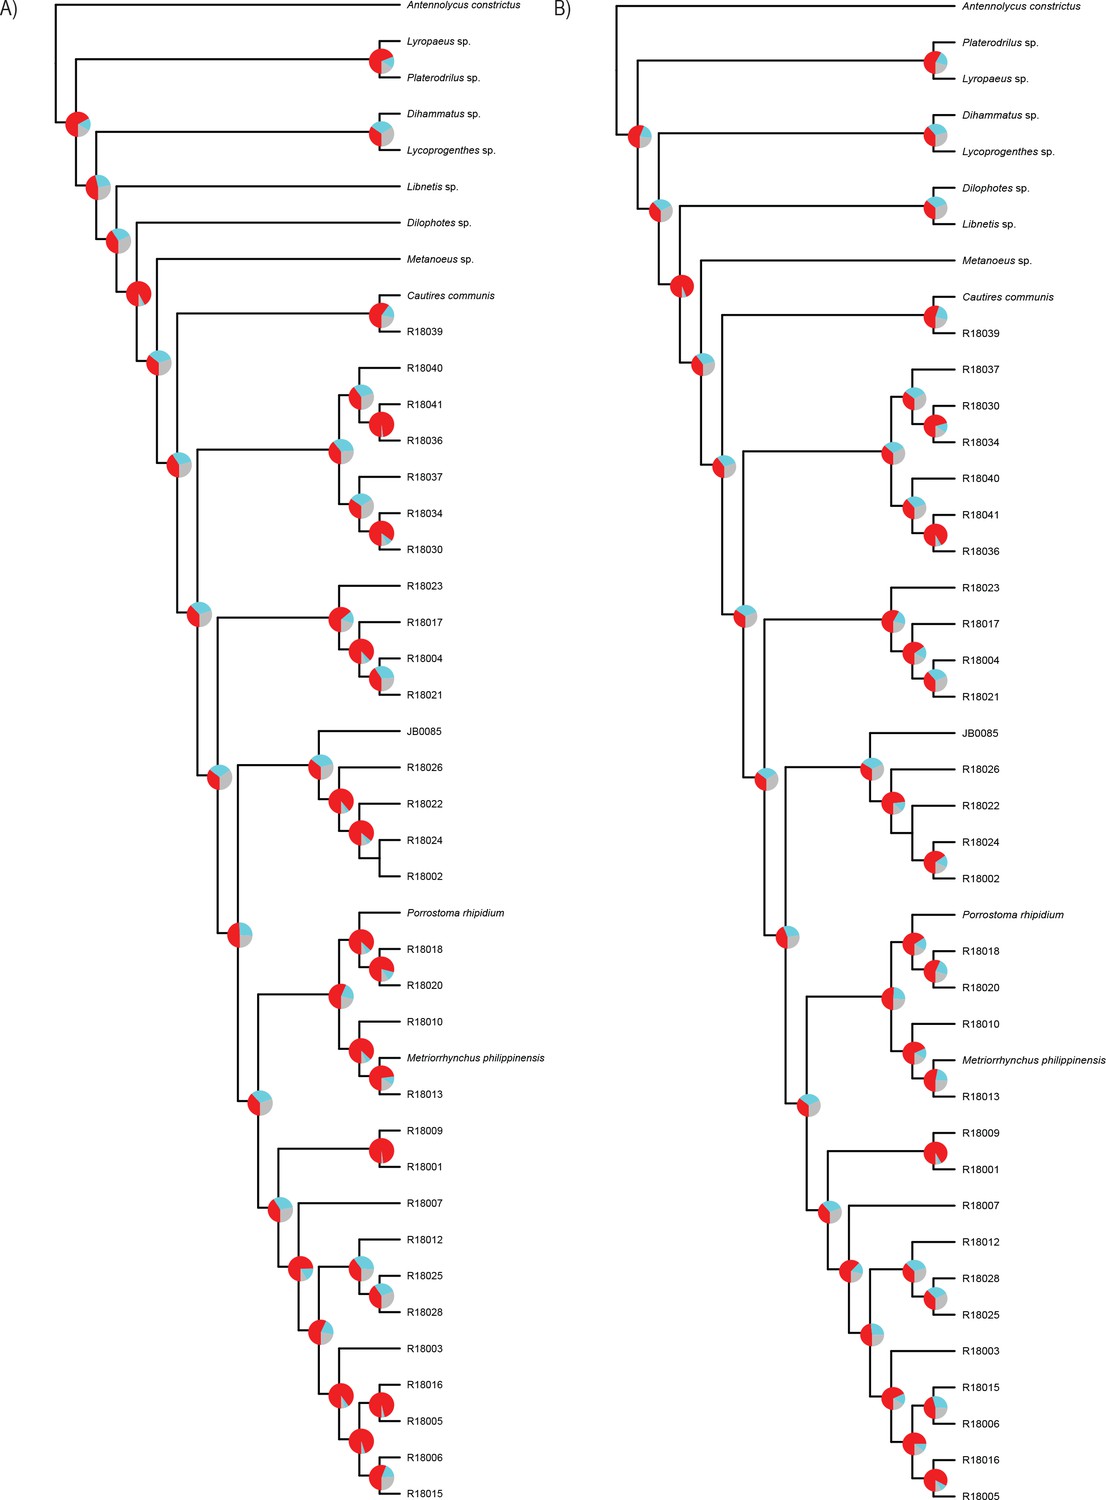
Phylogenomic topologies.
(A) Phylogenetic relationships of Metriorrhynchini, resulted from the summary coalescent phylogenetic analysis with ASTRAL, when analyzing the full set of gene trees (4109 gene trees) inferred at the nucleotide level. (B) doitto at amino acids level. Pie charts on branches show ASTRAL quartet supports q1,q2,q3 (quartet-based frequencies of alternative quadripartition topologies around a given internode).Tree topologies correspond with Appendix 1—figure 7.
Appendix 1—figure 9
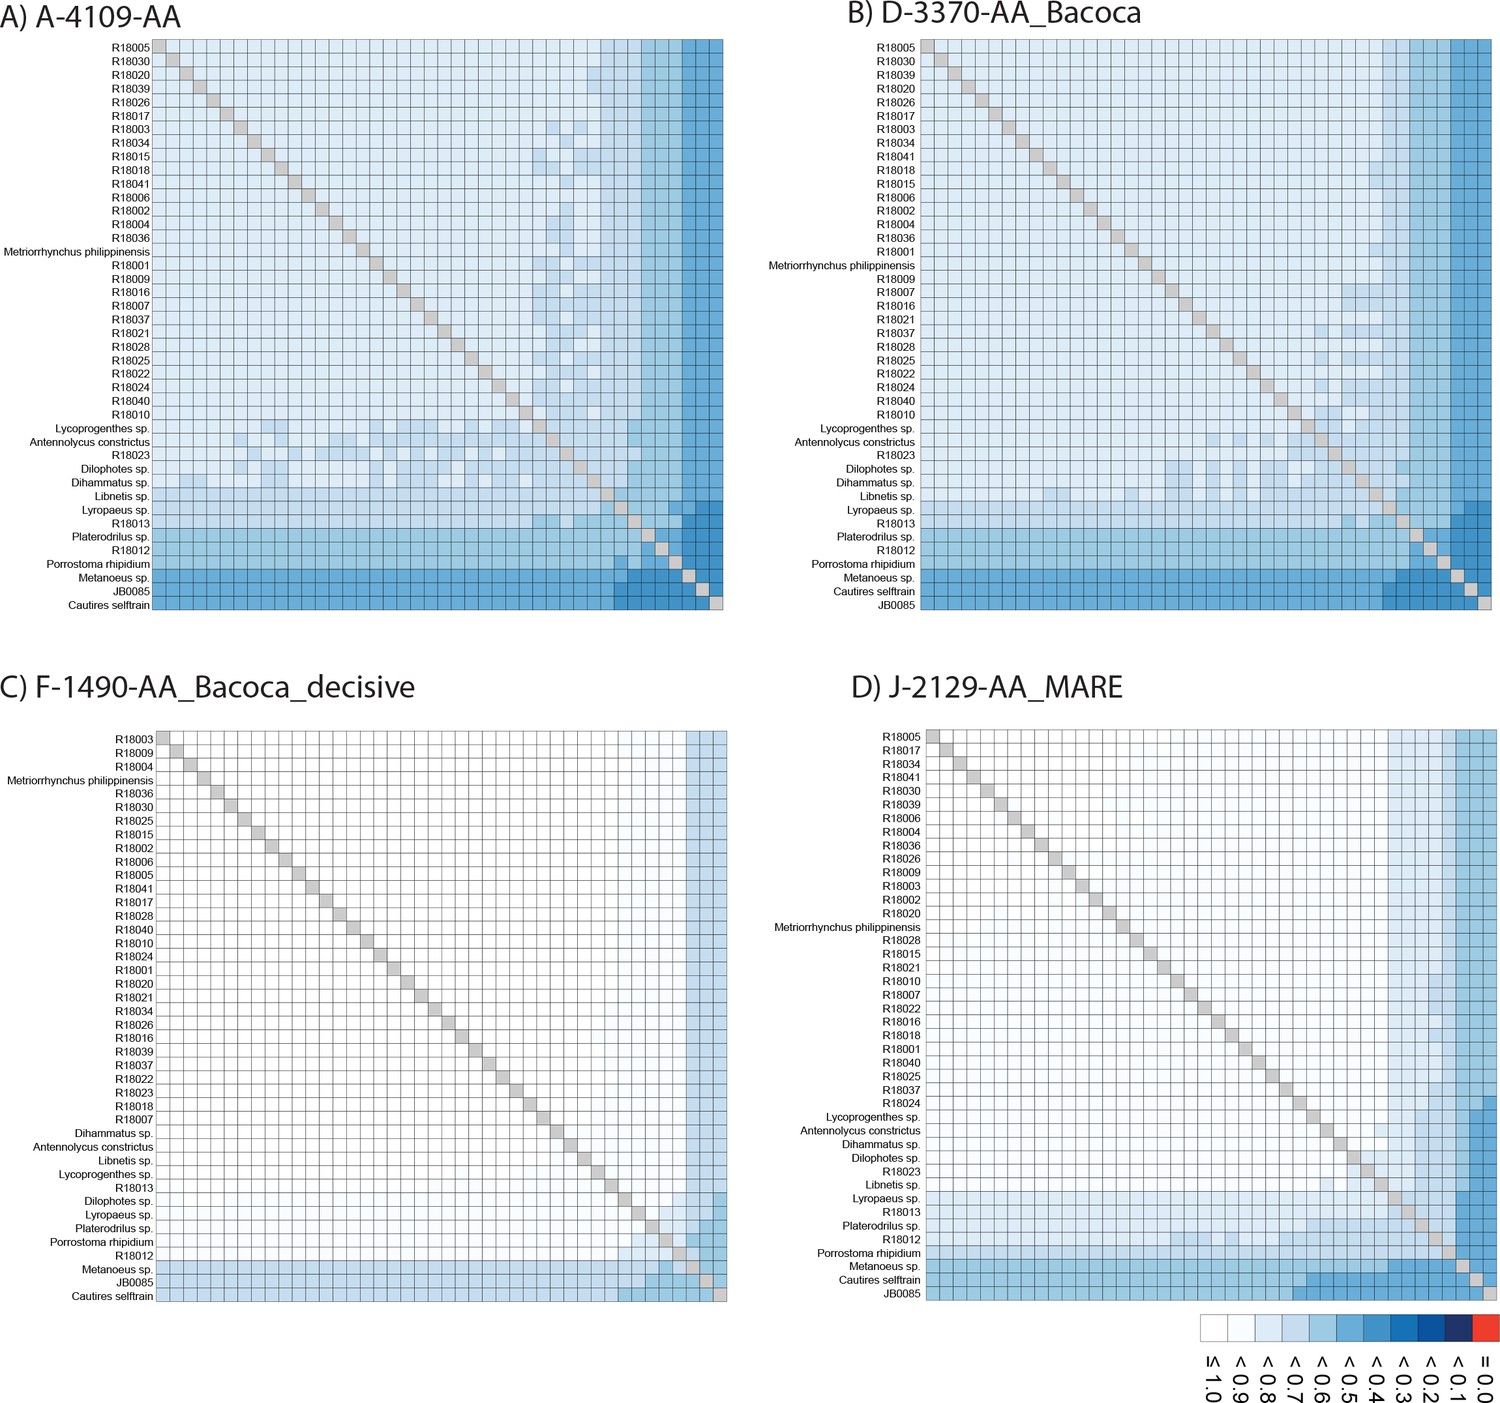
Alistat heatmaps.
(A–D) AliStat rectangular heatmaps showing pairwise alignment completeness scores for all species included in the analyzed amino acid supermatrices. The abbreviations of datasets correspond to Appendix 1—table 4. Values closer to one indicate higher completeness scores for the pairwise sequence comparisons.
Appendix 1—figure 10
AliStat heatmaps.
(A–F) AliStat rectangular heatmaps showing pairwise alignment completeness scores for all species included in the analyzed nucleotide supermatrices. The abbreviations of datasets correspond to Appendix 1—table 4. Values closer to one indicate higher completeness scores for the pairwise sequence comparisons.
Appendix 1—figure 11
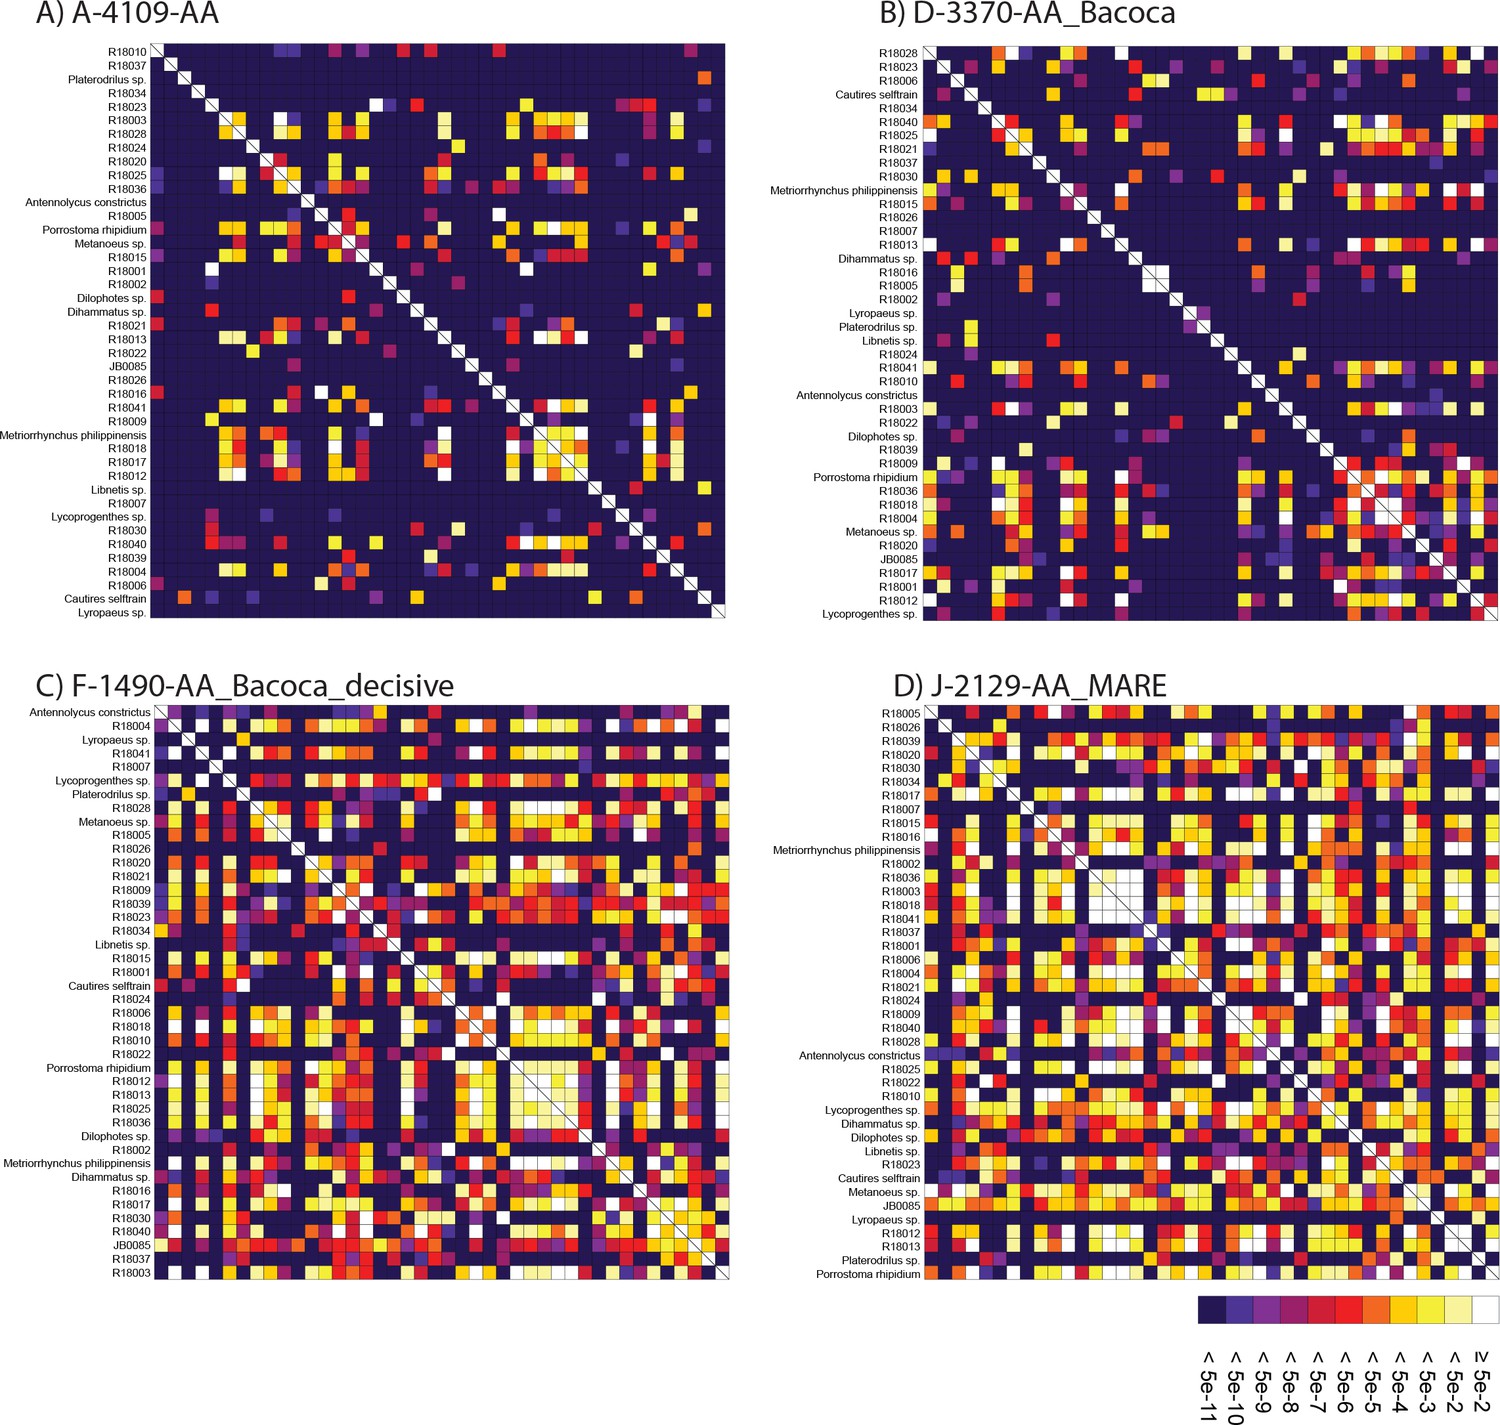
SymTest analyses.
(A–D) Rectangular heatmap calculated with SymTest showing p-values for the pairwise Bowker’s tests in the analyzed amino acid supermatrices. Darker boxes indicate lower p-values and thus larger deviation from evolution under SRH conditions.
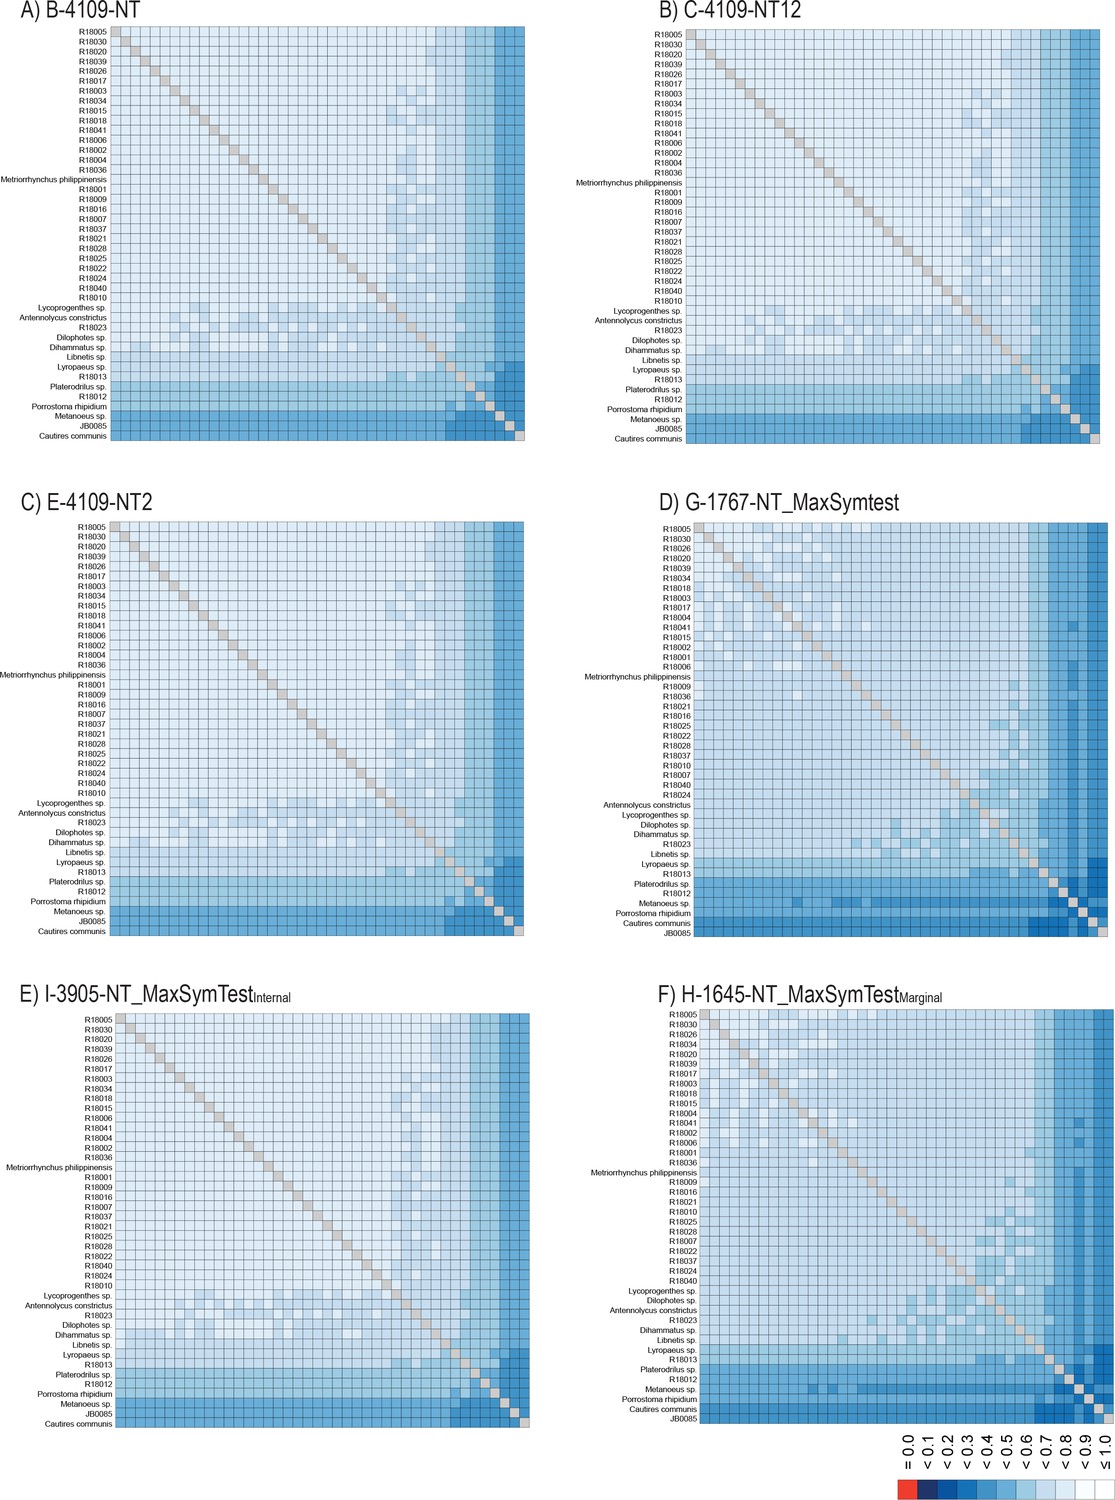
Appendix 1—figure 12
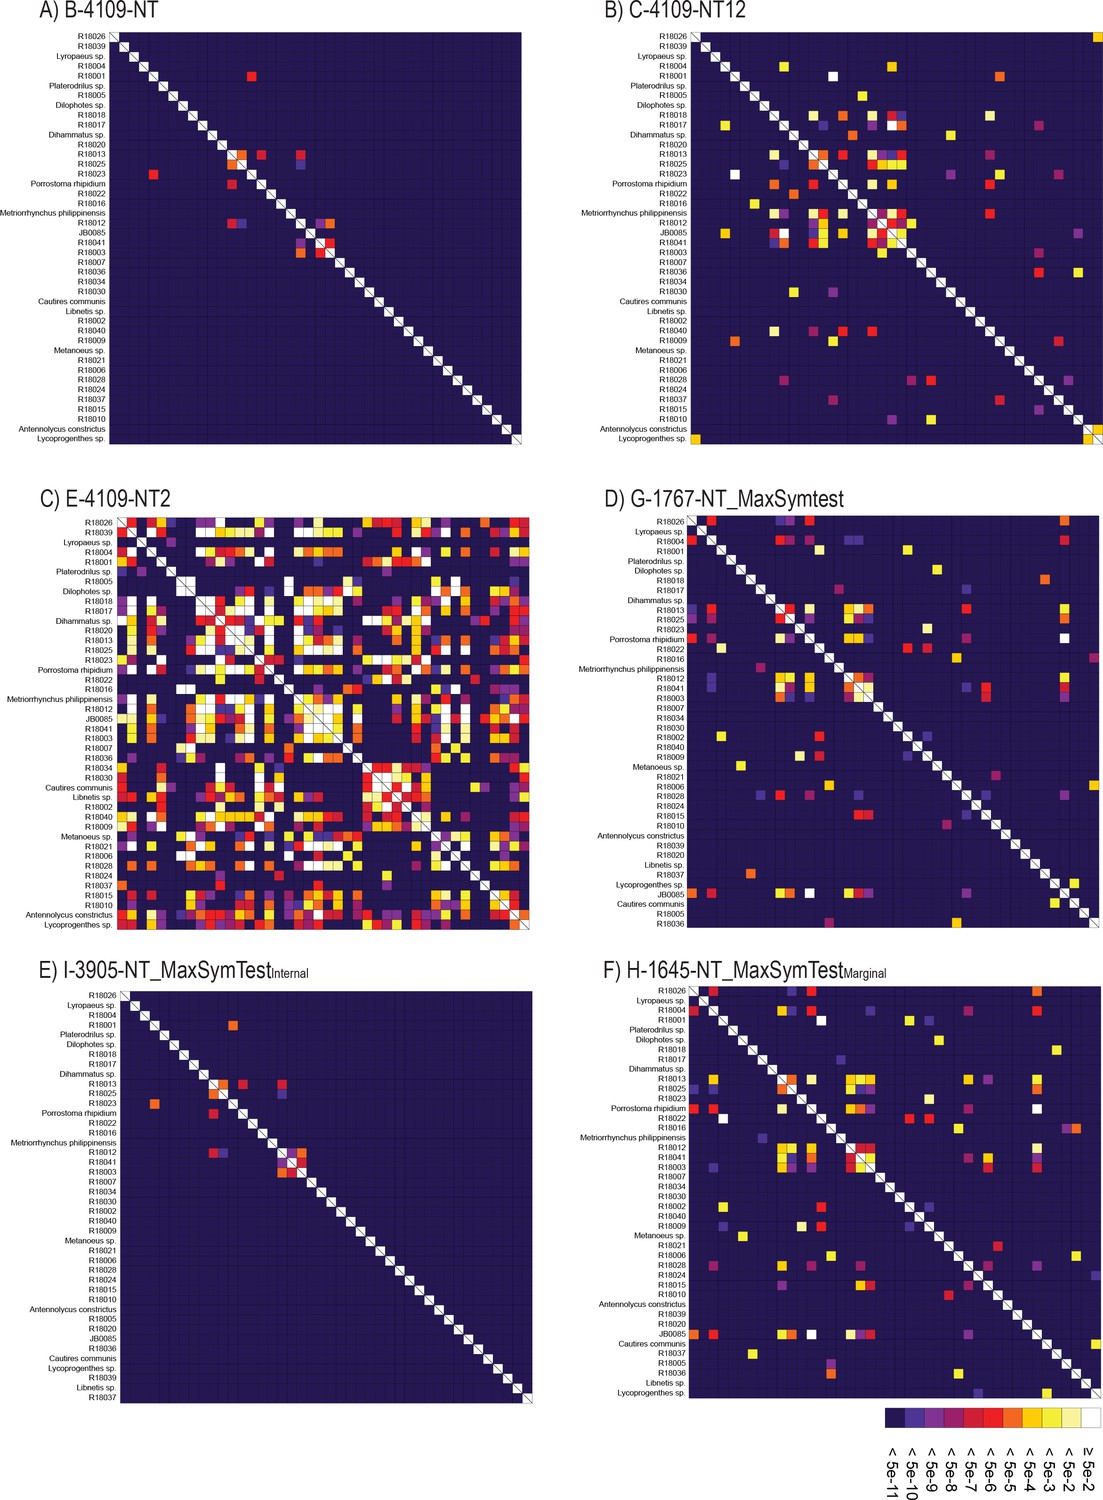
SymTest analyses.
(A–F) Rectangular heat map calculated with SymTest showing p-values for the pairwise Bowker’s tests in the analyzed nucleotide supermatrices. Darker boxes indicate lower p-values and thus larger deviation from the evolution under SRH conditions.
Appendix 1—figure 13
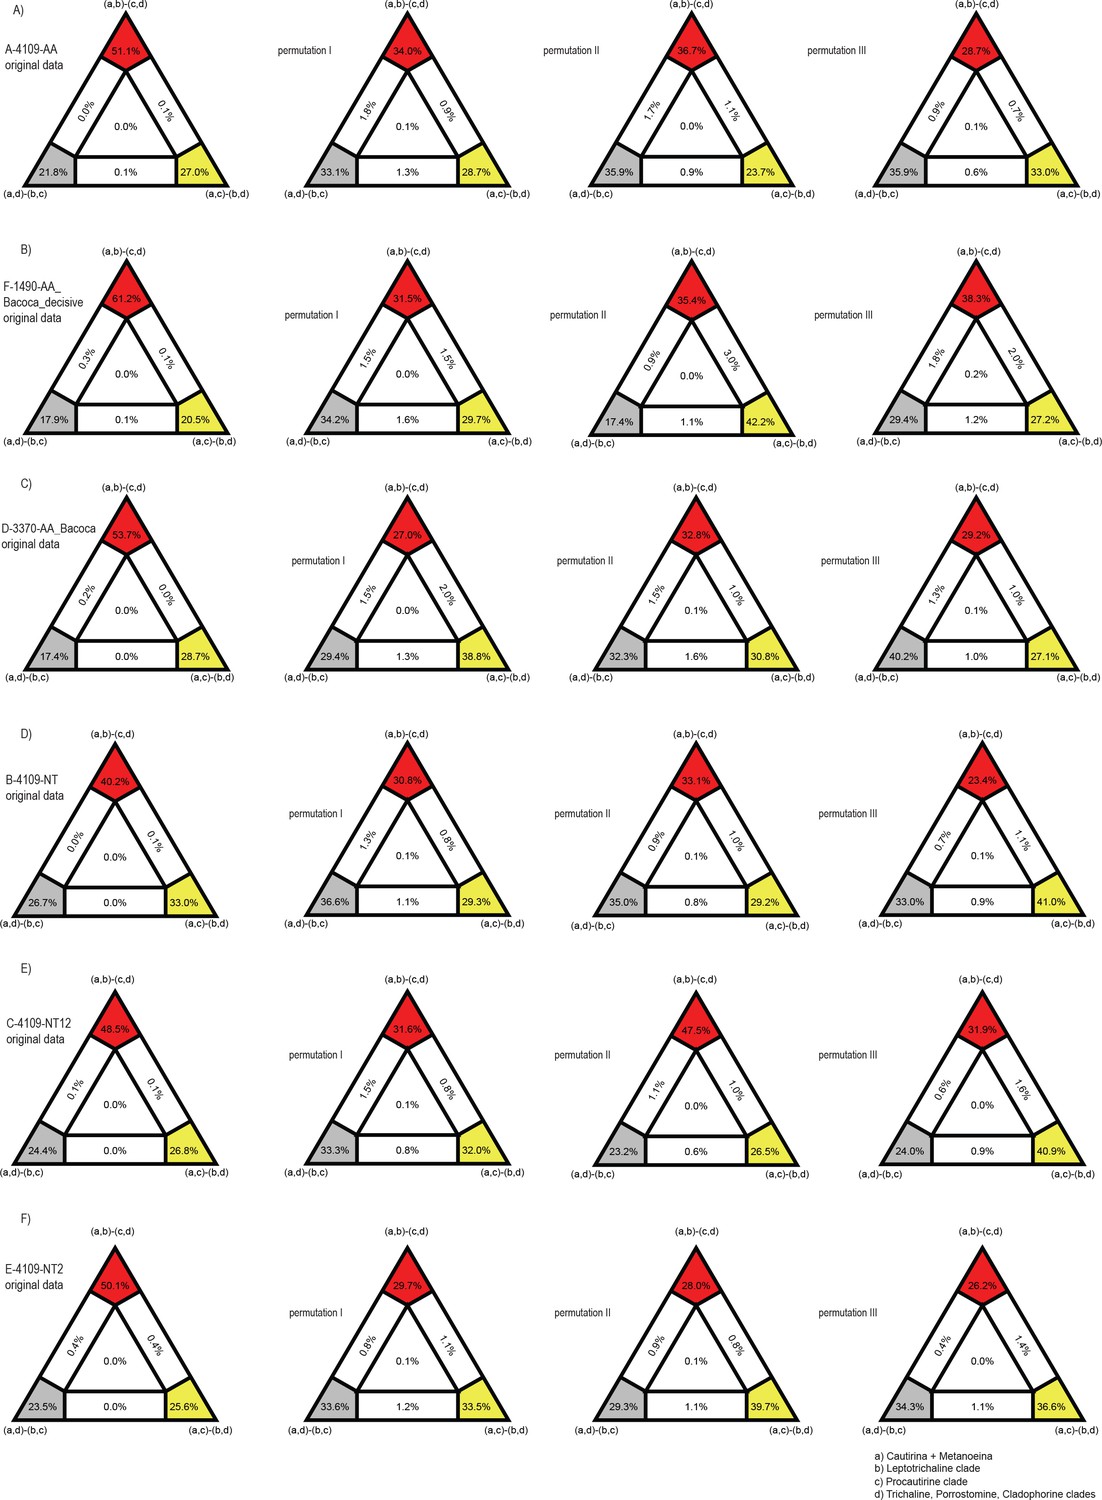
Results of FcLM analyses testing alternative phylogenetic hypotheses about placement of procautirine and leptotrichaline clades applied for various supermatrices.
The first column shows the results of FcLM when the original data were analyzed. The second column shows the results of FcLM after the phylogenetic signal had been eliminated from data. The third column show the results of FcLM after elimination of the phylogenetic signal and inhomogeneous amino-acid or nucleotide composition. The fourth column show the results of FcLM after the elimination of phylogenetic signal, inhomogeneous amino-acid or nucleotide composition and with randomized data coverage within all meta-partitions (see Supplementary methods for details).
Appendix 1—figure 14
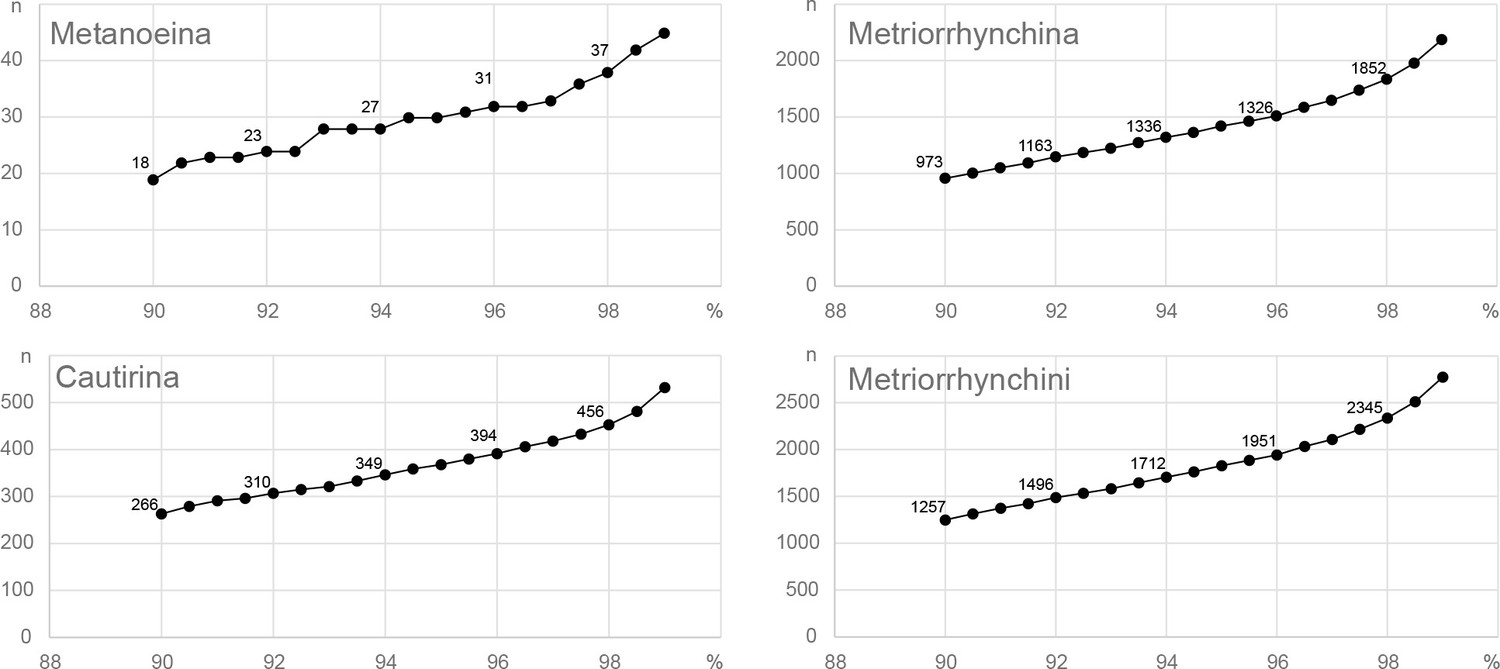
Tribal and subtribal mOTUs delimitation using CD-hit-est.
Axis X represent the number of operational taxonomic units, whereas axis Y shows the delimitation threshold.
Appendix 1—figure 15
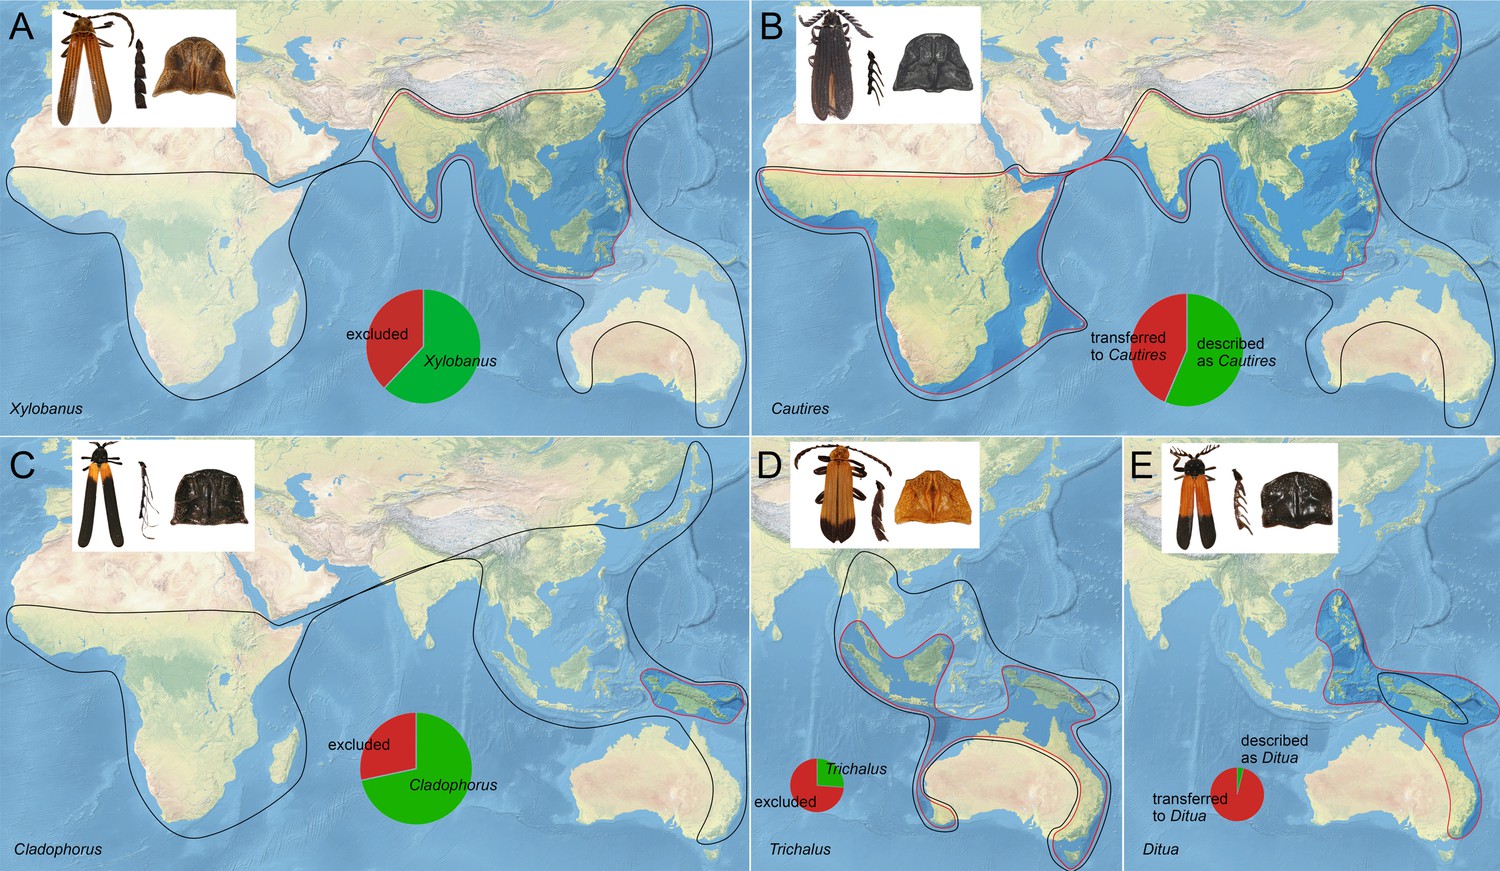
Distribution of selected Metriorrhynchini genera (originally assumed and revised).
Appendix 1—figure 16
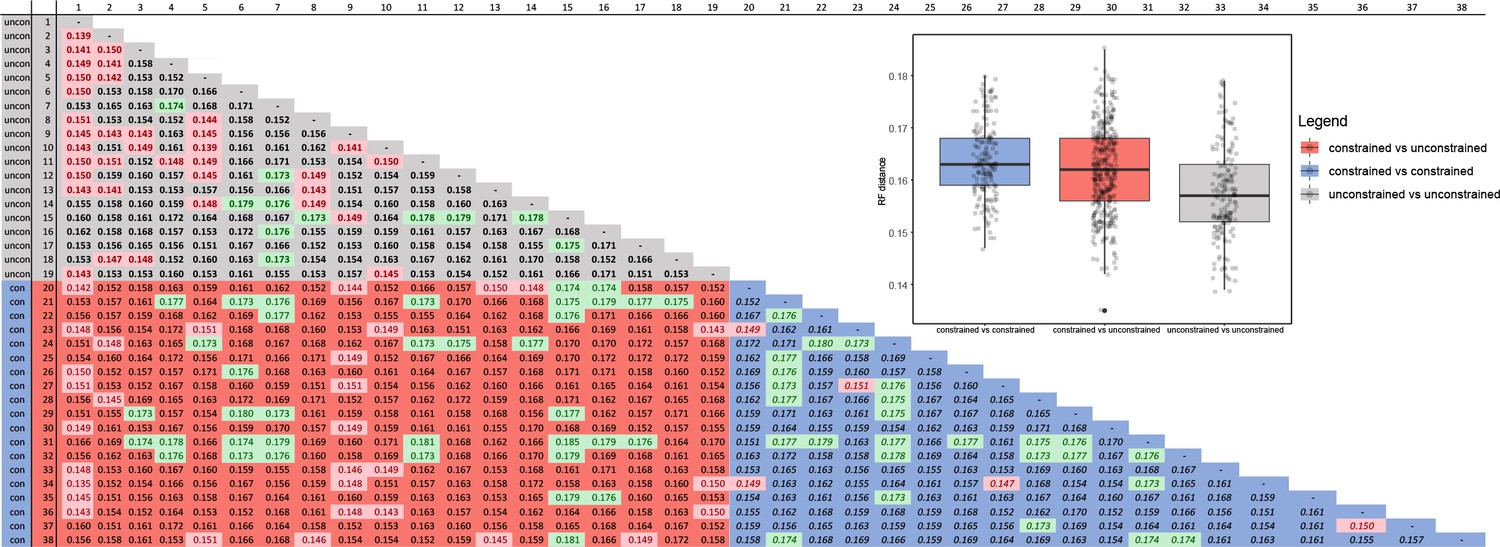
Comparison of the Robinson-Fould (RF) distances among tree searches with constrained topology and tree searches with unconstrained topology.
Green values represent top 10% RF- distances, and red values shows bottom 10% RF- distances. The blue part of the graph represents constrained trees values, the grey part of the graph represents unconstrained trees values, the red part of the graph represents constrained/unconstrained trees values.
Tables
Table 1
The numbers of sampled localities per region.
Details in Appendix 1—table 1.
| Area | Localities | Area | Localities |
|---|---|---|---|
| Australian region | 298 | Sino-Jap. region | 79 |
| Australia | 118 | China | 51 |
| New Guinea & Solomons | 179 | Japan | 28 |
| New Zealand | 1 | ||
| Wallacea | 49 | ||
| Moluccas | 15 | Oriental region | 206 |
| Sulawesi | 34 | S.India & Ceylon | 3 |
| E.India & Burma | 12 | ||
| Afrotropical Region | 64 | E.Indo-Burma | 44 |
| West Africa | 1 | Malay Peninsula | 57 |
| Guinean Gulf | 11 | Sumatra | 23 |
| Ethiopia | 6 | Java & Bali | 15 |
| East Africa | 10 | Philippines | 33 |
| South Africa | 25 | ||
| Madagascar | 11 | Total | 696 |
Table 2
The numbers of described species and identified mOTUs (molecular operational taxonomic units) at 2% and 5% thresholds per region and the total number of OTUs identified for subtribes.
Based on morphological identification, the OTUs of the kassemiine and other deeply rooted clades are included in Metriorrhynchina.
| Region | Metriorrhynchina described/analyzed at 2%/5% | Cautirina described/ analyzed at 2%/5% | Metanoeina described/ analyzed at 2%/5% | Metriorrhynchini described/ analyzed at 2%/5% | RatioAnalyzed/described | |
|---|---|---|---|---|---|---|
| Australian region | 639/1608/1239 | 639/1608/1239 | 2.52–1.93 | |||
| Australia | 196/167/133 | 196/167/131 | 0.85–0.67 | |||
| New Guinea | 423/1434/1105 | 423/1434/1105 | 3.39–2.61 | |||
| Solomon Isl. | 21/9/9 | 21/9/9 | 0.43 | |||
| Wallacea | 162/174/162 | 14/10/9 | 176/184/171 | 1.05–0.97 | ||
| Philippines | 51/18/18 | 45/12/12 | 8/3/3 | 104/33/33 | 0.32 | |
| Continental Asia | 43/52/42 | 331/330/257 | 30/34/31 | 404/416/330 | 1.03–0.82 | |
| Sundaland | 36/44/39 | 201/184/146 | 24/19/17 | 261/247/202 | 0.95–0.77 | |
| Indo-Burma | 6/7/7 | 62/52/42 | 3/4/4 | 74/63/53 | 0.85–0.72 | |
| China, Japan | 1/1/1 | 53/75/58 | 1/11/11 | 55/87/70 | 1.58–1.27 | |
| India | 35/19/18 | 2/0/0 | 37/19/18 | 0.51–0.49 | ||
| Afrotropical region | 231/104/94 | 231/104/94 | 0.46–0.41 | |||
| Sub-Saharan Africa | 178/74/65 | 178/74/65 | 0.42–0.37 | |||
| Madagascar | 53/30/29 | 53/30/29 | 0.57 | |||
| Total number of OTUs | 895/1852/1445 | 641/456/369 | 38/37/34 | 1574/2345/1848 | 1.50–1.17 | |
Appendix 1—table 1
Detailed information on regional sampling.
| Metriorrhynchina | Cautirina | Metanoeina | Metriorrhynchini | |
|---|---|---|---|---|
| Region | # of specimens | # of specimens | # of specimens | # of specimens |
| Australian region | 4489 | 4489 | ||
| Australian continent | 3964 | 3964 | ||
| Australia | 475 | 475 | ||
| New South Wales | 64 | 64 | ||
| Northern Territory | 18 | 18 | ||
| Queensland | 382 | 382 | ||
| South Australia | 1 | 1 | ||
| Western Australia | 10 | 10 | ||
| New Zealand | 1 | 1 | ||
| New Guinea | 3461 | 3461 | ||
| Solomon Islands | 19 | 19 | ||
| Aru Islands | 8 | 8 | ||
| Wallacea | 525 | 15 | 540 | |
| Maluku-Buru | 15 | 15 | ||
| Halmahera | 169 | 169 | ||
| Sulawesi | 341 | 15 | ||
| Oriental region | 278 | 1,311 | 113 | 1,692 |
| Philippines | 48 | 37 | 14 | 99 |
| Mindanao | 11 | 3 | 9 | 23 |
| Negros | 2 | |||
| Palawan | 29 | 34 | 5 | 68 |
| Sibuyan | 4 | 4 | ||
| Luzon | 2 | 2 | ||
| Continental Asia | 230 | 1264 | 99 | 1593 |
| Malaya | 34 | 270 | 8 | 348 |
| Java | 21 | 45 | 6 | 72 |
| Bali | 2 | 1 | 3 | |
| Sumatra | 56 | 201 | 26 | 283 |
| Borneo | 82 | 253 | 22 | 357 |
| Cambodia | 7 | 13 | 20 | |
| Indo-Burma | 23 | 145 | 10 | 178 |
| China incl. Taiwan | 5 | 100 | 23 | 128 |
| India | 59 | 59 | ||
| Japan | 177 | 4 | 181 | |
| Afrotropical region | 233 | 233 | ||
| Africa | 175 | 175 | ||
| Madagascar | 58 | 58 | ||
| Total | 4767 | 1549 | 113 | 6429 |
Appendix 1—table 2
List of material for phylogenomic analyses.
| Ingroup | |||||||
|---|---|---|---|---|---|---|---|
| Voucher | Species | Clade | Geographic origin | Data source | Data type | Tissue type | |
| R18010 | Metriorrhynchus s. l. | Metriorrhynchina | Porrostomine | New Guinea | This study | ILLUMINA RNA-seq PE-reads | Whole animal |
| R18013 | Metriorrhynchus sp. | Metriorrhynchina | Porrostomine | New Guinea | This study | ILLUMINA RNA-seq PE-reads | Whole animal |
| R20001 | Metriorrhynchus philippinensis | Metriorrhynchina | Porrostomine | Philippines | This study | ILLUMINA RNA-seq PE-reads | Whole animal |
| R18018 | Metriorrhynchus s. l. | Metriorrhynchina | Porrostomine | New Guinea | This study | ILLUMINA RNA-seq PE-reads | Whole animal |
| R18020 | Metriorrhynchus s. l. | Metriorrhynchina | Porrostomine | New Guinea | This study | ILLUMINA RNA-seq PE-reads | Whole animal |
| 1_kite | Porrostoma rhipidium | Metriorrhynchina | Porrostomine | Australia | McKenna et al., 2019 | ILLUMINA RNA-seq PE-reads | Whole animal |
| R18001 | Cladophorus sp. | Metriorrhynchina | Cladophorine | New Guinea | This study | ILLUMINA RNA-seq PE-reads | Whole animal |
| R18009 | Cladophorus sp. | Metriorrhynchina | Cladophorine | New Guinea | This study | ILLUMINA RNA-seq PE-reads | Whole animal |
| R18007 | Pseudodontocerus sp. | Metriorrhynchina | Cladophorine | New Guinea | This study | ILLUMINA RNA-seq PE-reads | Whole animal |
| R18012 | Ditua s. l. | Metriorrhynchina | Cladophorine | New Guinea | This study | ILLUMINA RNA-seq PE-reads | Whole animal |
| R18025 | Ditua s. l. | Metriorrhynchina | Cladophorine | New Guinea | This study | ILLUMINA RNA-seq PE-reads | Whole animal |
| R18028 | Ditua s. l. | Metriorrhynchina | Cladophorine | New Guinea | This study | ILLUMINA RNA-seq PE-reads | Whole animal |
| R18003 | Ditua s. l. | Metriorrhynchina | Cladophorine | New Guinea | This study | ILLUMINA RNA-seq PE-reads | Whole animal |
| R18016 | Ditua s. l. | Metriorrhynchina | Cladophorine | New Guinea | This study | ILLUMINA RNA-seq PE-reads | Whole animal |
| R18005 | Ditua s. l. | Metriorrhynchina | Cladophorine | New Guinea | This study | ILLUMINA RNA-seq PE-reads | Whole animal |
| R18015 | Ditua s. l. | Metriorrhynchina | Cladophorine | New Guinea | This study | ILLUMINA RNA-seq PE-reads | Whole animal |
| R18006 | Ditua s. l. | Metriorrhynchina | Cladophorine | New Guinea | This study | ILLUMINA RNA-seq PE-reads | Whole animal |
| R18002 | Microtrichalus sp. | Metriorrhynchina | Trichaline | New Guinea | This study | ILLUMINA RNA-seq PE-reads | Whole animal |
| R18024 | Eniclases sp. | Metriorrhynchina | Trichaline | New Guinea | This study | ILLUMINA RNA-seq PE-reads | Whole animal |
| R18022 | Diatrichalus sp. | Metriorrhynchina | Trichaline | New Guinea | This study | ILLUMINA RNA-seq PE-reads | Whole animal |
| R18026 | Trichaline sp. | Metriorrhynchina | Trichaline | New Guinea | This study | ILLUMINA RNA-seq PE-reads | Whole animal |
| JB0085 | Trichaline sp. | Metriorrhynchina | Trichaline | New Guinea | This study | ILLUMINA WGS-seq PE-reads | Thoracic muscles |
| R18004 | Procautires sp. | Metriorrhynchina | Procautirine | New Guinea | This study | ILLUMINA RNA-seq PE-reads | Whole animal |
| R18017 | Procautires sp. | Metriorrhynchina | Procautirine | New Guinea | This study | ILLUMINA RNA-seq PE-reads | Whole animal |
| R18021 | Procautires sp. | Metriorrhynchina | Procautirine | New Guinea | This study | ILLUMINA RNA-seq PE-reads | Whole animal |
| R18023 | Procautires sp. | Metriorrhynchina | Procautirine | New Guinea | This study | ILLUMINA RNA-seq PE-reads | Whole animal |
| R18037 | Broxylus sp. | Metriorrhynchina | Leptotrichaline | Sulawesi | This study | ILLUMINA RNA-seq PE-reads | Whole animal |
| R18030 | Leptotrichalus sp. | Metriorrhynchina | Leptotrichaline | Sulawesi | This study | ILLUMINA RNA-seq PE-reads | Whole animal |
| R18034 | Wakarumbia sp. | Metriorrhynchina | Leptotrichaline | Sulawesi | This study | ILLUMINA RNA-seq PE-reads | Whole animal |
| R18036 | Sulabanus sp. | Metriorrhynchina | Leptotrichaline | Sulawesi | This study | ILLUMINA RNA-seq PE-reads | Whole animal |
| R18041 | Sulabanus sp. | Metriorrhynchina | Leptotrichaline | Sulawesi | This study | ILLUMINA RNA-seq PE-reads | Whole animal |
| R18040 | Mangkutanus sp. | Metriorrhynchina | Leptotrichaline | Sulawesi | Kusy et al., 2019 | ILLUMINA RNA-seq PE-reads | Whole animal |
| R18039 | Xylobanus sp. | Cautirina | Sulawesi | This study | ILLUMINA RNA-seq PE-reads | Whole animal | |
| AJ0013 | Cautires communis | Cautirina | Malaysia | Kusy et al., 2019 | ILLUMINA WGS-seq PE-reads | Thoracic muscles | |
| G19002 | Metanoeus sp. | Metanoeina | Malaysia | This study | ILLUMINA WGS-seq PE-reads | Thoracic muscles | |
| Outgroup | |||||||
| Dilophotes sp. | Malaysia | Kusy et al., 2019 | ILLUMINA RNA-seq PE-reads | Whole animal | |||
| Dihammatus sp. | Malaysia | Kusy et al., 2019 | ILLUMINA RNA-seq PE-reads | Whole animal | |||
| Lycoprogentes sp. | Malaysia | Kusy et al., 2019 | ILLUMINA RNA-seq PE-reads | Whole animal | |||
| Libnetis sp. | Malaysia | Kusy et al., 2019 | ILLUMINA RNA-seq PE-reads | Whole animal | |||
| Platerodrilus sp. | Malaysia | Kusy et al., 2019 | ILLUMINA RNA-seq PE-reads | Whole animal | |||
| Lyropaeus optabilis | Malaysia | Kusy et al., 2019 | ILLUMINA RNA-seq PE-reads | Whole animal | |||
| Antennolycus constrictus | Malaysia | Kusy et al., 2019 | ILLUMINA RNA-seq PE-reads | Whole animal |
Appendix 1—table 3
Overview of official gene sets of six reference species used for ortholog assessment.
Number of genes correspond with OrthoDB 9.1.
| Species | Accession | # of contigs | Source | Download date | Reference |
|---|---|---|---|---|---|
| Onthophagus taurus | PRJNA167478 | 17,483 | i5K | 05.03.2017 | 1 |
| Tribolium castaneum | PRJNA12540 | 16,631 | iBeetle | 05.03.2017 | 2, 3 |
| Dendroctonus ponderosae | PRJNA360270 | 13,088 | ENS Metazoa | 05.03.2017 | 4 |
| Anoplophora glabripennis | PRJNA167479 | 22,035 | i5K | 05.03.2017 | 5 |
| Leptinotarsa decemlineata | PRJNA171749 | 24,671 | i5K | 05.03.2017 | 1 |
| Agrilus planipennis | PRJNA230921 | 15,497 | i5K | 05.03.2017 | 1 |
Appendix 1—table 4
Detailed information and statistics of each generated dataset.
| Dataset name | Number of taxa | Number of partitions | Number of alignment sites | Completeness score (Ca) AliStat | Percentage of pairwise P-values < 0.05 for the Bowker’s test | (SV) MARE Matrix saturation | (IC) MARE Information content | Partition scheme optimalization |
|---|---|---|---|---|---|---|---|---|
| Amino acids | ||||||||
| A-4109-AA | 42 | 4,109 | 1892691 | 0.772127 | 98.61% | 0.888 | 0.506 | Yes |
| D-3370-AA_Bacoca | 42 | 3,370 | 1672362 | 0.780363 | 97.91% | 0.880 | 0.511 | |
| F-1490-AA_Bacoca_decisive | 42 | 1,490 | 673,102 | 0.925082 | 94.08% | 1 | 0.594 | |
| J-2129-AA_MARE | 42 | 2,129 | 959,741 | 0.876331 | 90.82% | 0.964 | 0.648 | |
| Nucleoides | ||||||||
| B-4109-NT | 42 | 4,109 | 5678073 | 0.772133 | 100% | NA | NA | |
| C-4109-NT12 | 42 | 4,109 | 3785382 | 0.772133 | 99.77% | NA | NA | |
| E-4109-NT2 | 42 | 4,109 | 1892691 | '0.772134 | 92.45% | NA | NA | |
| G-NT-1767_MaxSymTest | 42 | 1,767 | 2413164 | '0.713912 | 99.88% | NA | NA | |
| H-NT-1645_MaxSymTestmarginal | 42 | 1,645 | 2233485 | '0.712208 | 99.77% | NA | NA | |
| I-NT-3905_MaxSymTestInternal | 42 | 3,905 | 5377449 | '0.771645 | 100% | NA | NA |
Appendix 1—table 5
Characteristics of concatenated super-matrices (mitochondrial fragments) and used models of the DNA evolution (descriptions of columns abbreviation listed bellow tables).
Abbreviations. Seq – Number of sequences, Site – Number of bases, Infor – Number of parsimony-informative sites, Invar – Number of invariant sites, Model – Best-fit model according to BIC using ModelFinder.
| Subset | Seqs | Sites | Infor | Invar | Model |
|---|---|---|---|---|---|
| Complete dataset | |||||
| nad5 | 3,205 | 987 | 809 | 88 | GTR + F + I + G4 |
| cox | 5,935 | 1,068 | 812 | 134 | GTR + F + I + G4 |
| 16 s | 2,381 | 875 | 577 | 201 | GTR + F + I + G4 |
| 98% OTUs delimitation dataset | |||||
| nad5 | 1,252 | 969 | 776 | 115 | GTR + F + I + G4 |
| tRNA Leu | 2,245 | 62 | 34 | 17 | GTR + F + G4 |
| cox1 | 2,395 | 783 | 536 | 141 | GTR + F + I + G4 |
| cox2 | 2,192 | 216 | 194 | 11 | GTR + F + I + G4 |
| 16 s | 1,115 | 834 | 512 | 237 | GTR + F + I + G4 |
Additional files
-
Transparent reporting form
- https://cdn.elifesciences.org/articles/71895/elife-71895-transrepform1-v3.docx
-
Supplementary file 1
Maximum likelihood tree recovered by the analysis of the full dataset (mitochondrial fragments); numbers above branches represent SH-alrt support values.
- https://cdn.elifesciences.org/articles/71895/elife-71895-supp1-v3.docx
-
Source data 1
Maximum likelihood tree recovered by the analysis of the full dataset (mitochondrial fragments).
Depicted numbers above branches represent SH-alrt support values.
- https://cdn.elifesciences.org/articles/71895/elife-71895-data1-v3.pdf
-
Source data 2
Maximum likelihood tree recovered by the analysis of the reduced dataset (98% similarity OTUs).
Depicted numbers above branches represent SH-aLRT support values. The taxa with the constrained position in the tree are marked with the red star.
- https://cdn.elifesciences.org/articles/71895/elife-71895-data2-v3.pdf
-
Source data 3
Maximum likelihood tree recovered by the analysis of the reduced dataset (mitochondrial fragments, 98% similarity OTUs) with unconstrained backbone.
Depicted numbers above branches represent SH-alrt support values.
- https://cdn.elifesciences.org/articles/71895/elife-71895-data3-v3.pdf
Download links
A two-part list of links to download the article, or parts of the article, in various formats.
Downloads (link to download the article as PDF)
Open citations (links to open the citations from this article in various online reference manager services)
Cite this article (links to download the citations from this article in formats compatible with various reference manager tools)
Phylogenomic and mitogenomic data can accelerate inventorying of tropical beetles during the current biodiversity crisis
eLife 10:e71895.
https://doi.org/10.7554/eLife.71895


