An empirical energy landscape reveals mechanism of proteasome in polypeptide translocation
- Department of Systems Biology, Harvard Medical School, United States
Figures
Figure 1 with 2 supplements
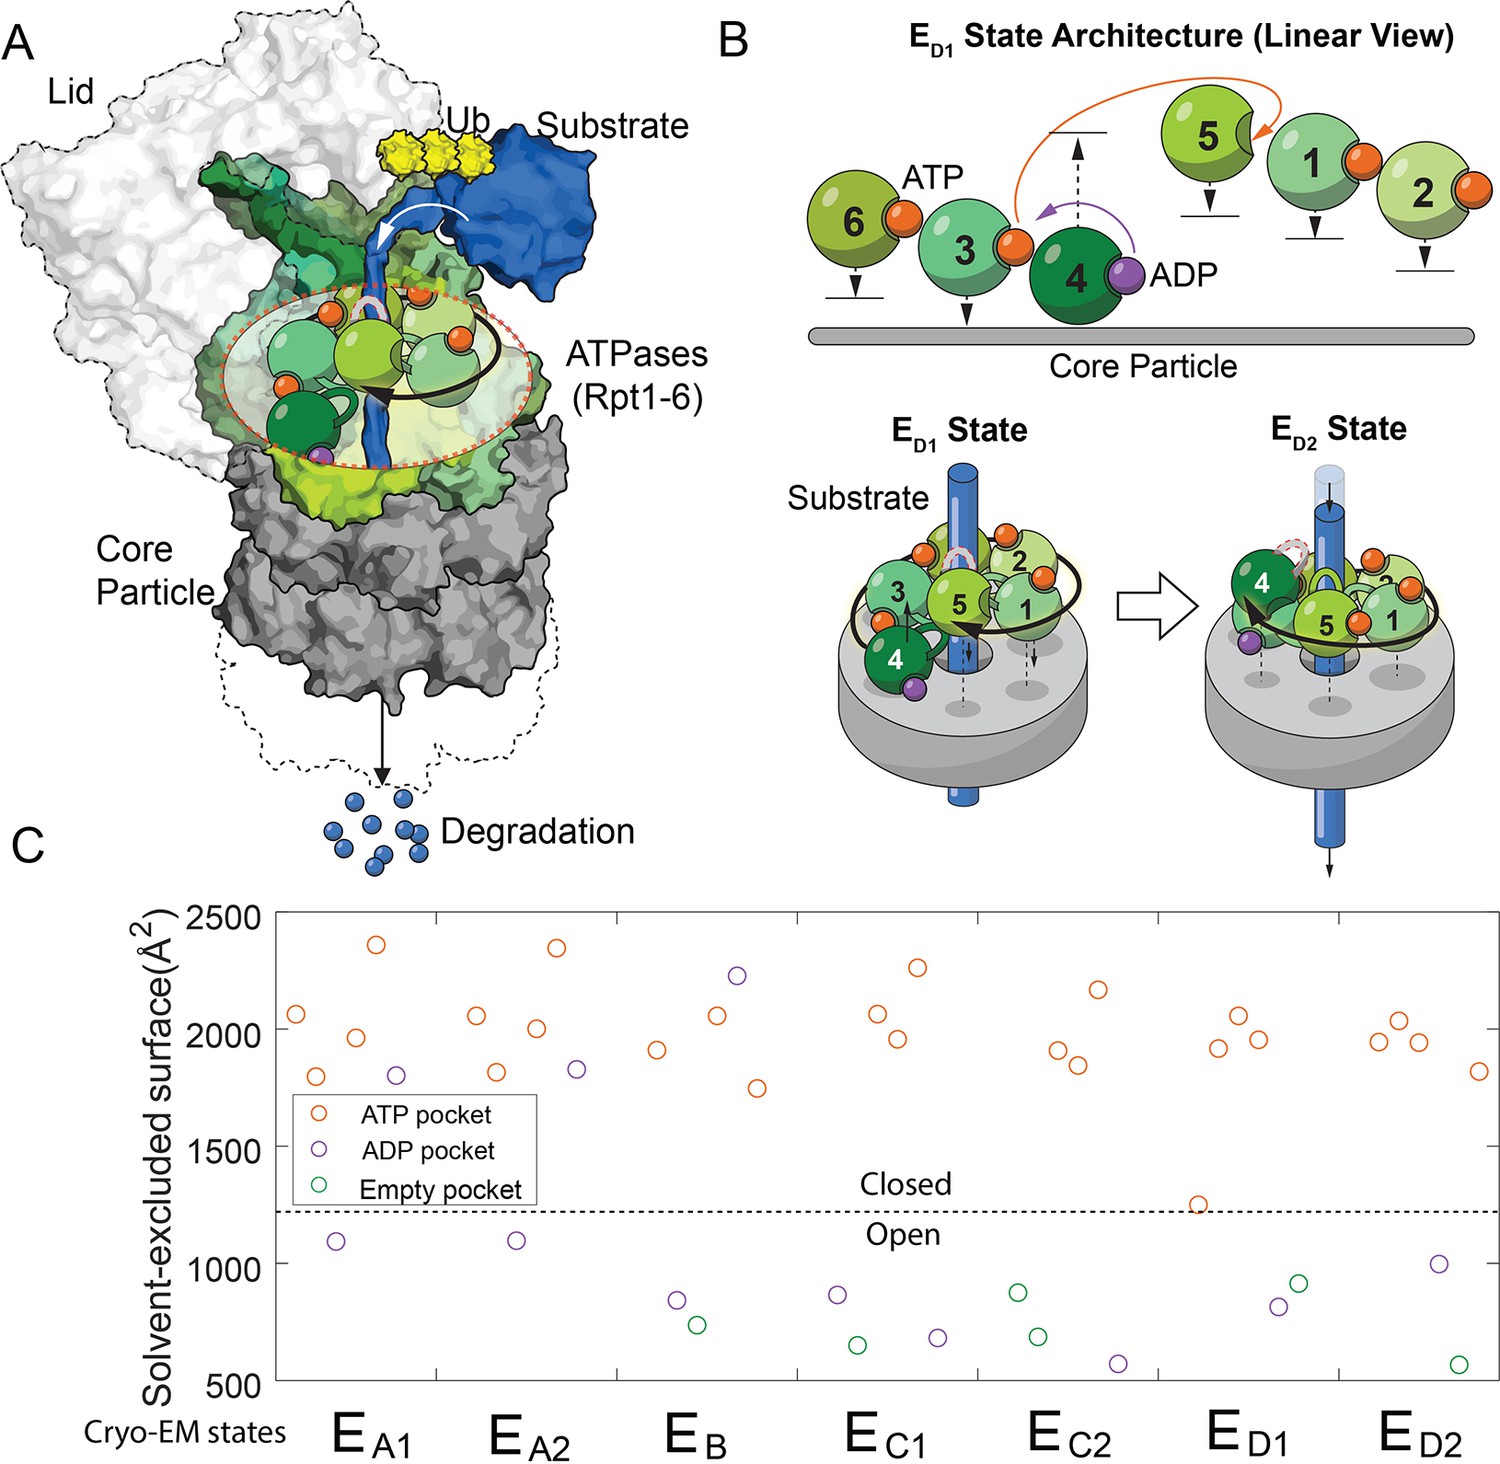
The architectures of the proteasomal ATPase complex and its interaction with substrate.
(A) A schematic showing a half 26S proteasome engaged with an unfolded substrate through the PL1s (color loops) on the ATPase subunits with bound nucleotides (color blobs). The disengaged PL1 is marked in gray. A black arrow suggests the staircase architecture of the ATPases. (B) Upper panel: a linear view of the architecture of the ATPase complex in a translocating state ED1. Each ATPase subunit (Rpt1–Rpt6) is shifted vertically according to the position of its PL1 relative to the core particle. An open interface is suggested by a large gap between subunits. Arrows indicate the displacements of the PL1s and the change of nucleotides in the ED1-to-ED2 transition. See Figure 1—figure supplement 1 for a complete list of these identified states of the proteasome. The lower panel illustrates how the ATPase rearrangement in the ED1-to-ED2 transition may drive substrate translocation: the PL1 on Rpt4 disengages from substrate and moves to the distal registry of the staircase. This change is accompanied by an axial movement of the PL1s on Rpt1/2/6/3 that still interact with the substrate toward the core particle to bring about axial stepping and translocation of approximate 2× AAs. (C) The solvent-excluded surface area at the interfaces of the ATPase domains in the seven substrate-engaged proteasome structures, colored according to the nucleotide at each binding pocket. The dashed line separates the closed and open interfaces, as defined here.
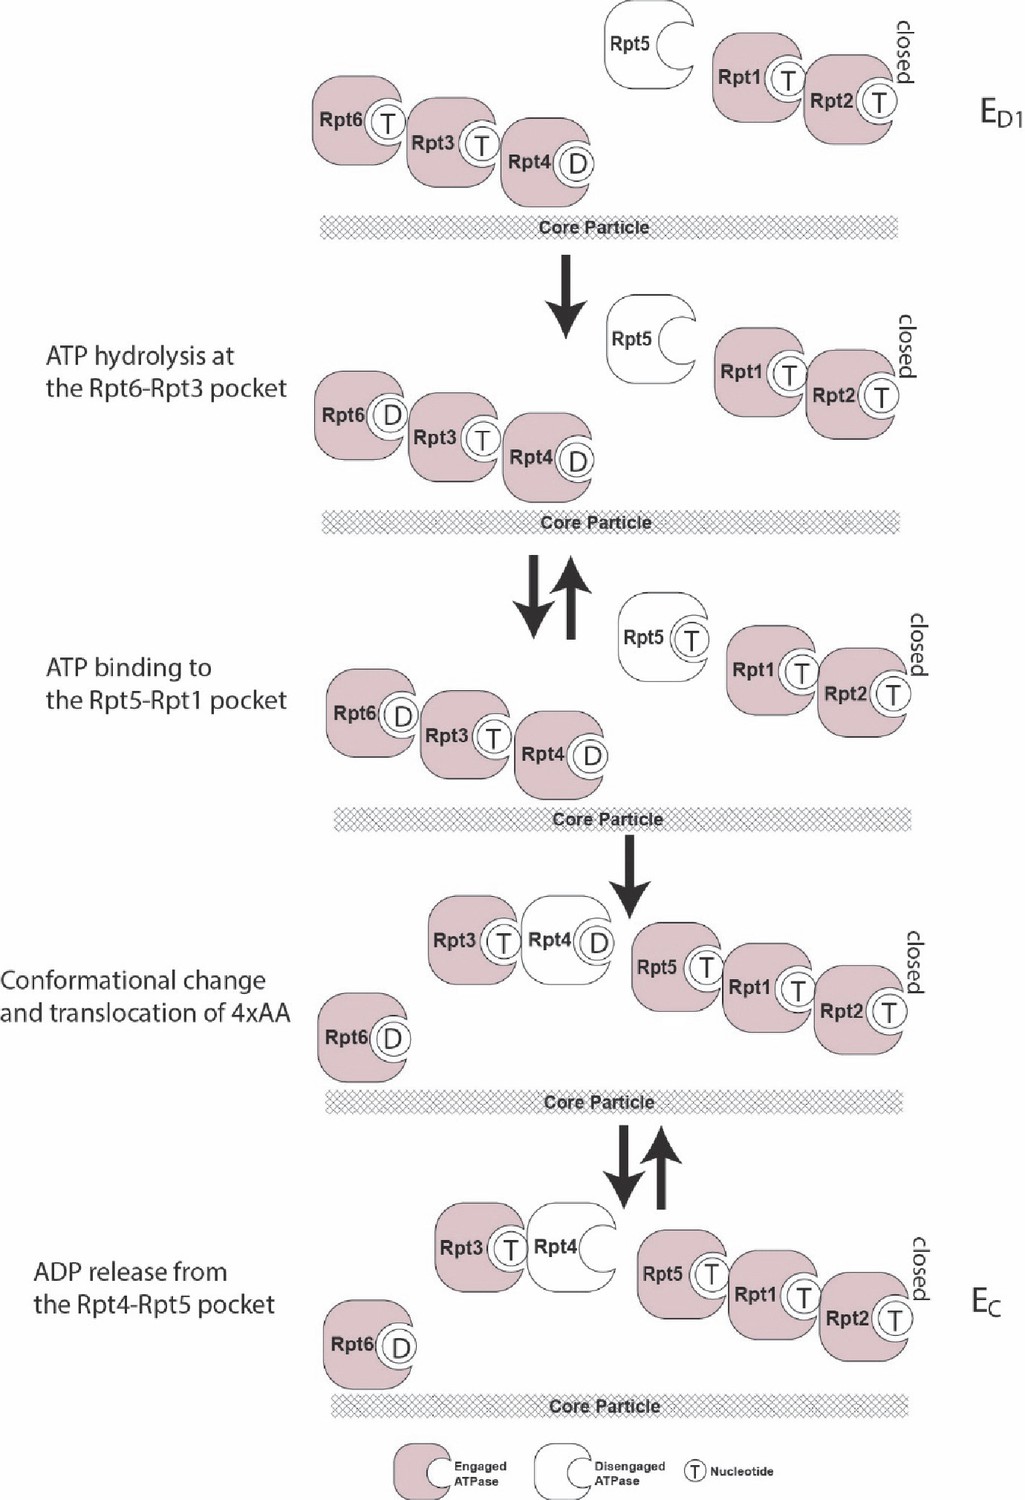
Figure 1—figure supplement 1

Schematics showing the key structural features and the nucleotide-binding status of the substrate-engaged proteasome identified in a cryo-EM study.
Each ATPase subunit is arranged vertically according to the order, or the approximate distance, of its pore-1 loop to the 20S core particle. An open interface is represented by a large gap. The Rpt2–Rpt6 interface is marked separately. Subunits that are disengaged from substrate are blank-and-white. The engage/disengage status is predicted according to the proximity of pore-1 loop to the central axis in the EA1/2 and EB states which do not exhibit substrate density in the translocation channel.
Figure 1—figure supplement 2

Comparison between open and closed interfaces of ATPases on proteasome.
(A) The closed interface of the ATPase domains of Rpt3–Rpt4 in the ED1 cryo-EM state. Green: Rpt3; Cyan: Rpt4; Red: ATP; Arginine fingers on Rpt4 were shown with sticks. (B) The open interface of Rpt3–Rpt4 in the ED2 cryo-EM state. Red: ADP. (C) Open and closed structures were aligned by Rpt3 (Green). Cyan: Rpt4 in ED1; light cyan: Rpt4 in ED2. EM, electron microscopy.
Figure 2 with 2 supplements

Parameterization of the nucleotide-dependent free-energy landscape.
(A) The interaction map of the residues on Rpt4 and Rpt3 with the bound ATP or ADP in the ED1 or ED2 states. Red: cis-interacting residues on Rpt3. Blue: trans-interacting residues on Rpt4. (B) A schematic showing the parameterization strategy for the free energy (Etotal) of the ATPase hexamer and valuation of the parameters. The molecular interactions underpinning the three energy terms are marked by different colors. ‘Open/Closed’ refers to the status of an ATPase interface Si. ‘Empty/Occupied/ADP/ATP/ATP-γS’ refers to the status of the nucleotide-binding pocket in the cis ATPase Ci. See 'Determining the FEL and kinetic parameters' for a detailed explanation. (C) The FEL on the ED-like and EC-like conformations of the ATPase complex in three representative nucleotide-binding statuses. T/D/E: ATP/ADP/empty. A sketch for the ATPase architecture of each conformation is listed on the right. The ATPases Rpt6/3/4/5/1/2 are represented by squares from left to right; dashed squares=disengaged ATPases that are flanked by open interfaces (gap between squares); the axial position of a PL1 is indicated by the vertical shift of the corresponding ATPase square.
Figure 2—figure supplement 1

Phosphate groups interact weakly with the proteasomal ATPases.
The degradation rate of ubiquitylated cyclinB-iRFP was measured at different phosphate concentrations, normalized by the rate at zero phosphate. The red curve is a fitting using the inhibitor equation to obtain the Ki value of 70 mM for phosphate. See 'iFRP substrate degradation assay' and Figure 3 for details on the activity assay.
Figure 2—figure supplement 2
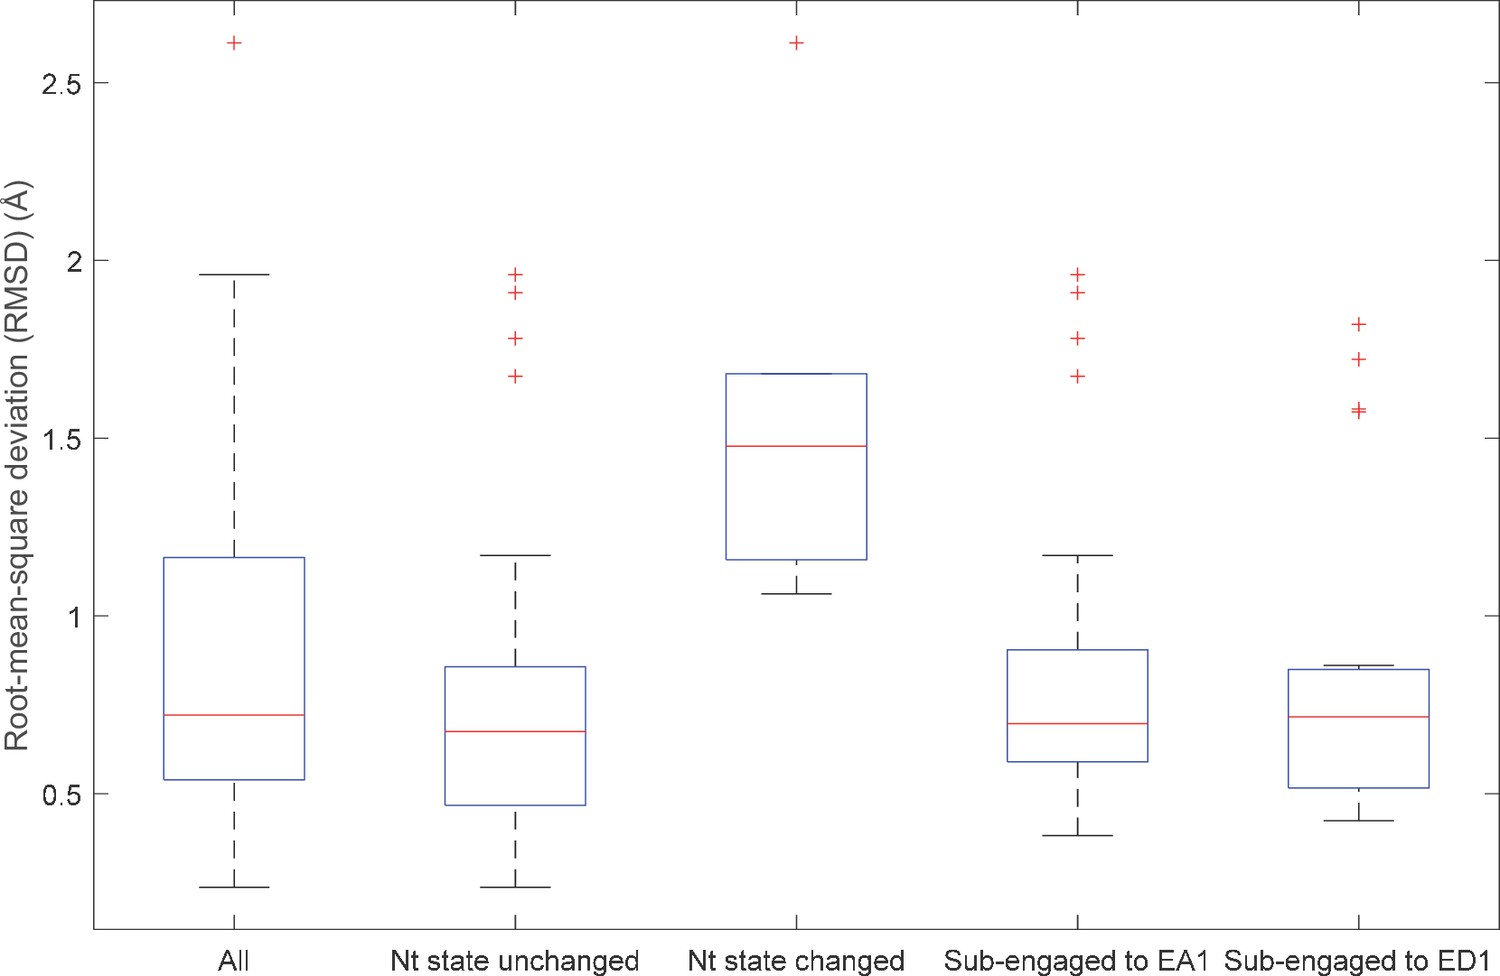
Root-mean-square deviation (RMSD) of the nucleotide-interacting residues in the cis pockets among different proteasomal states.
The RMSD of the nucleotide-interacting residues in the cis binding pockets among different proteasomal states was analyzed as described in 'Analysis of cryo-EM structures'. The first three comparisons were gated according to whether a pocket changed from ‘occupied’ to ‘empty’ or vice versa. The last two compare the pocket geometry in the EB, EC1,2, and ED1,2 states which have substrate peptide in the ATPase channel with the pocket geometry in the EA1 or ED1 state. In the last analysis, only pockets with identical nucleotide status (‘occupied’ or ‘empty’) are compared. The figure shows the box plot for the RMSD distributions.
Figure 3 with 2 supplements
Evaluation of the FEL model parameters.
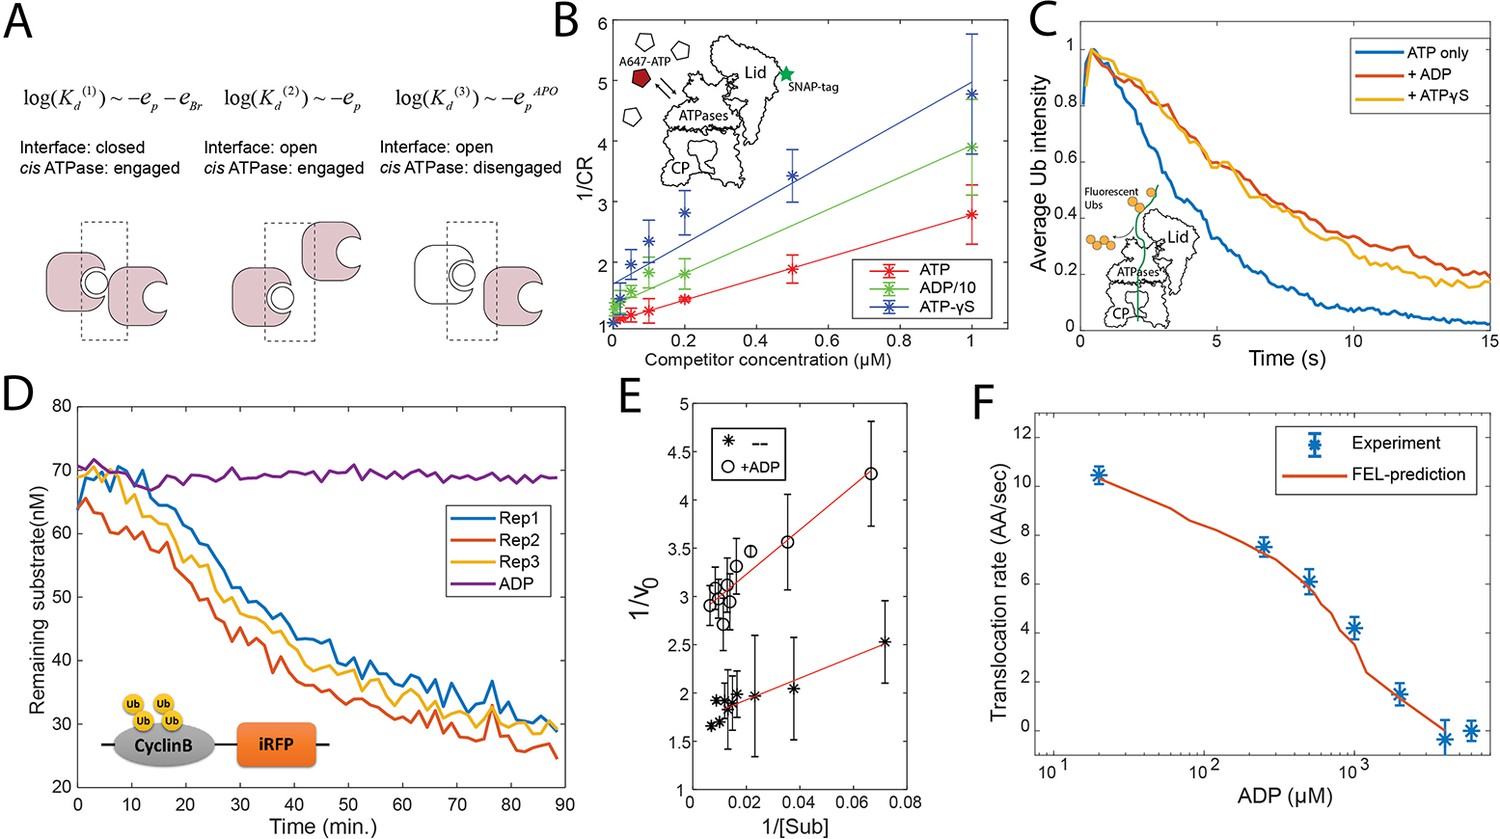
(A) A schematic showing three categories of nucleotide pockets with their corresponding dissociation constants Kd. (B) Single-molecule nucleotide-proteasome interaction assay. 200 nM Alexa647-ATP (red pentagon) was mixed ATP, ADP, or ATP-γS (white pentagons) as a competitor at different concentrations, incubated with surface-immobilized 26S proteasome which was labeled with a SNAP-tag dye. The degree of Alexa647-ATP-proteasome colocalization in a steady state was measured using a TIRF microscope. The colocalization ratio (CR) after normalization by the competitor-free condition was inversely regressed on the competitor concentration to obtain the relative inhibitor constant Ki (Materials and methods 'Single-molecule proteasome-nucleotide interaction assay'). ADP concentration is divided by 10 for presentation. The inset illustrates the experimental design. Error bars represent the standard deviation of three replicas. (C) Single-molecule translocation assay. N-terminal cyclinB was conjugated with Dylight550-labeled ubiquitins (yellow disks) on lysines (18, 36, and 64) and was incubated with surface-bound 26S proteasome in a buffer containing 0.5 mM ATP or with extra 0.8 mM ADP or with extra 40 μM ATP-γS. About 100 single-molecule traces exhibiting processive deubiquitylation in each condition were aligned by the time of substrate-proteasome encounter (t=0). The average fluorescent-ubiquitin intensity on a substrate molecule at each time point was calculated. The rate of translocation was calculated from the initial slope of the traces. The inset illustrates the experimental design. (D) Representative traces of the degradation of ubiquitylated cyclinB-iRFP by 1.5 nM purified 26S proteasome with ATP (rep1–3) or ADP in the buffer. (E) Lineweaver-Burk plot of the initial degradation rate (v0) at varying concentrations of cyclinB-iRFP (Sub) either with 0.5 mM ATP (--) or with extra 0.8 mM ADP (+ADP). (F) The translocation rate of cyclinB-iRFP was measured using the fluorescent degradation assay with 0.5 mM ATP and various concentrations of ADP-Mg2+. Error bars represent the standard deviation of 15 measurements. The red curve shows the prediction by the FEL model. FEL, free-energy landscape.
-
Figure 3—source data 1
Degradation kinetics of ubiquitylated cyclinB-iRFP at various concentrations of substrate and proteasome.
Related to Figure 3E.
- https://cdn.elifesciences.org/articles/71911/elife-71911-fig3-data1-v2.pdf
-
Figure 3—source data 2
Degradation kinetics of ubiquitylated cyclinB-iRFP in the presence of 500 µM ATP and various concentrations of ADP.
Related to Figure 3F.
- https://cdn.elifesciences.org/articles/71911/elife-71911-fig3-data2-v2.pdf
Figure 3—figure supplement 1
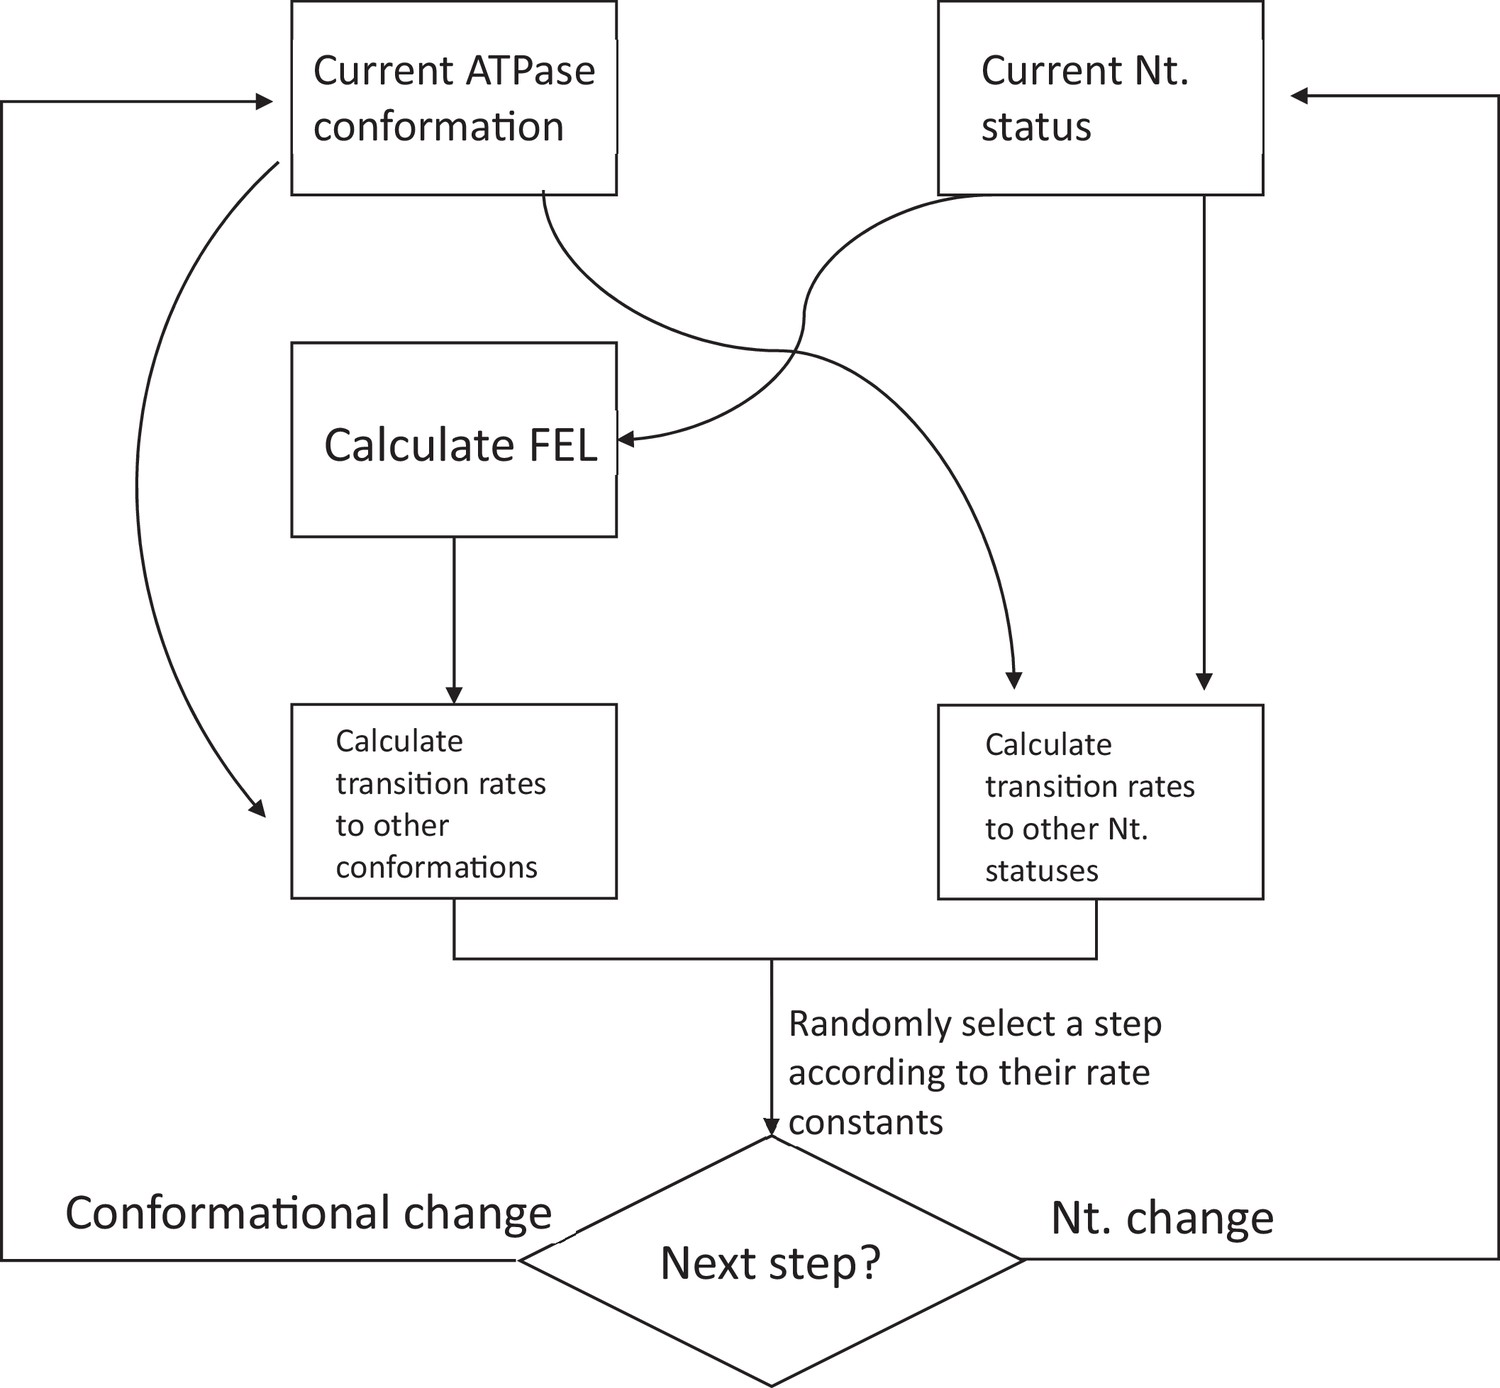
A block diagram for simulating the dynamics of proteasome using the FEL model.
See Materials and methods 'Constructing the nucleotide-dependent free-energy landscape (FEL) of the ATPase complex on proteasome to simulate its confirmational dynamics' for a detailed description of the process.
Figure 3—figure supplement 2
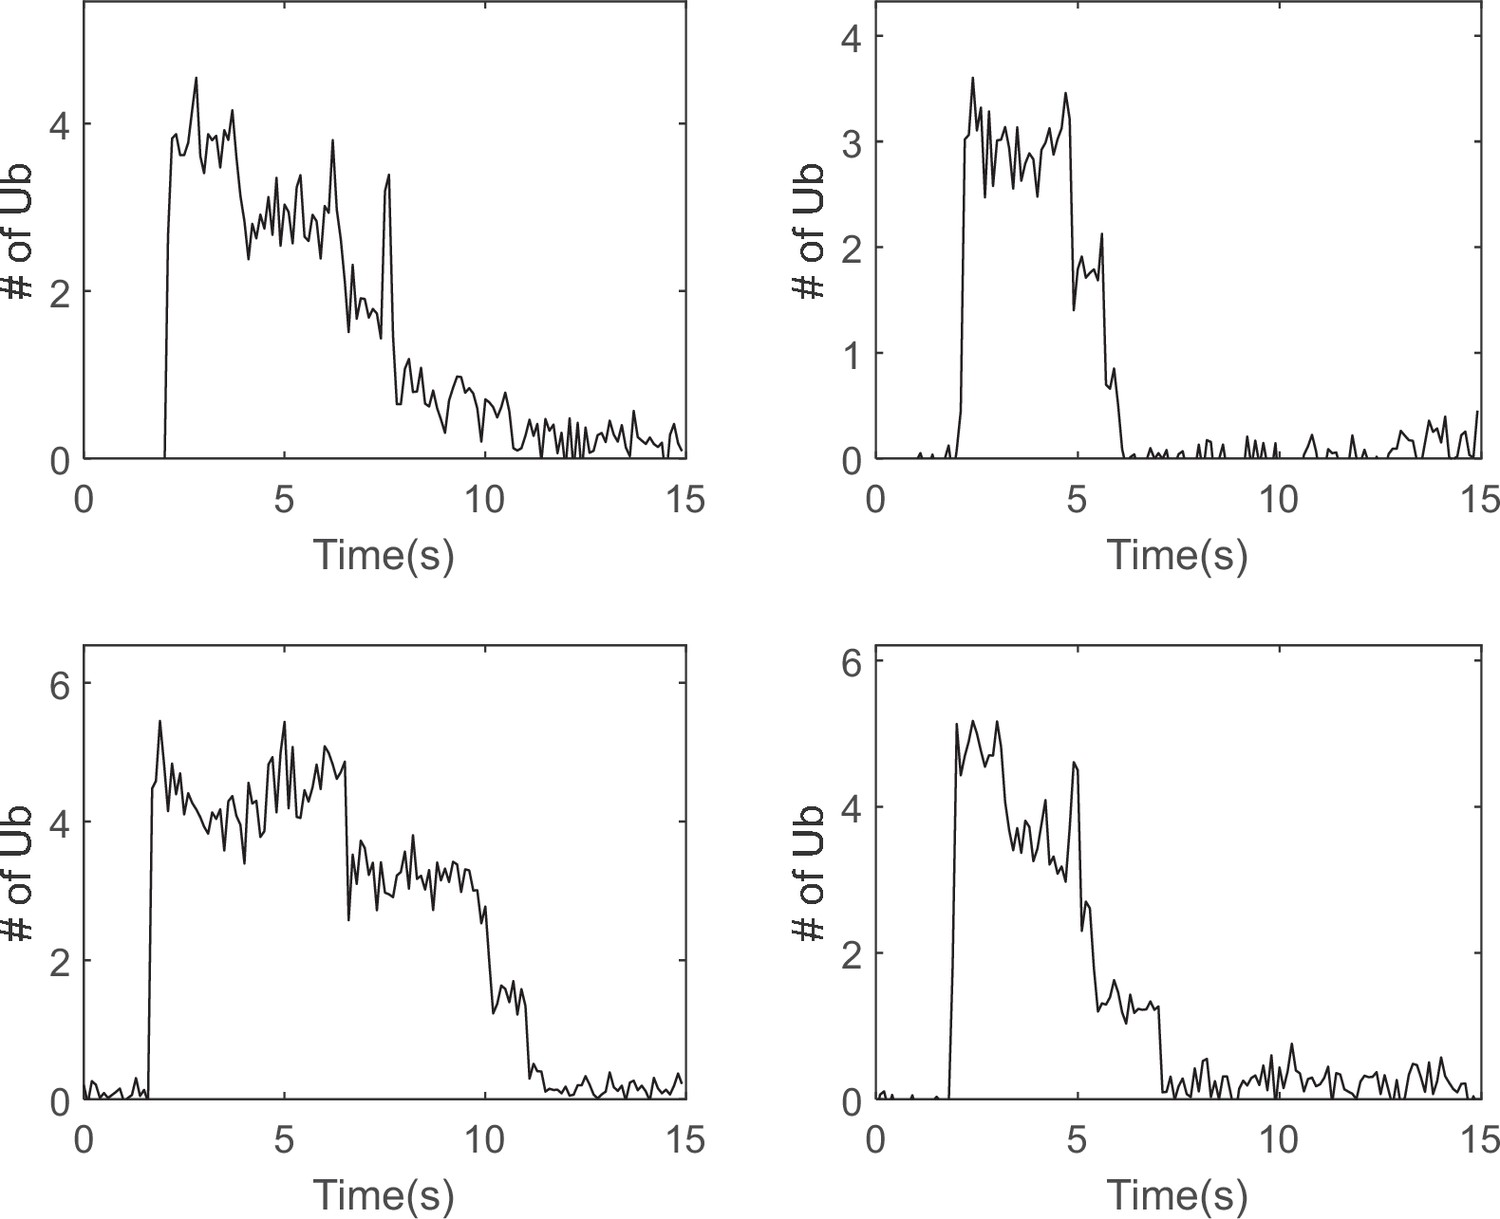
Examples of single-molecule traces showing processive ubiquitin chain removal.
Purified cycB_NT(K18,36,64) was ubiquitylated by APC-Cdh1 and E2 UbcH10 with Dylight550-Ub and was subjected to single-molecule proteasome assay as described in Materials and methods 'Single-molecule proteasome translation assay'. Four traces with the signature of processive ubiquitin chain removal are presented as examples.
Figure 4 with 5 supplements
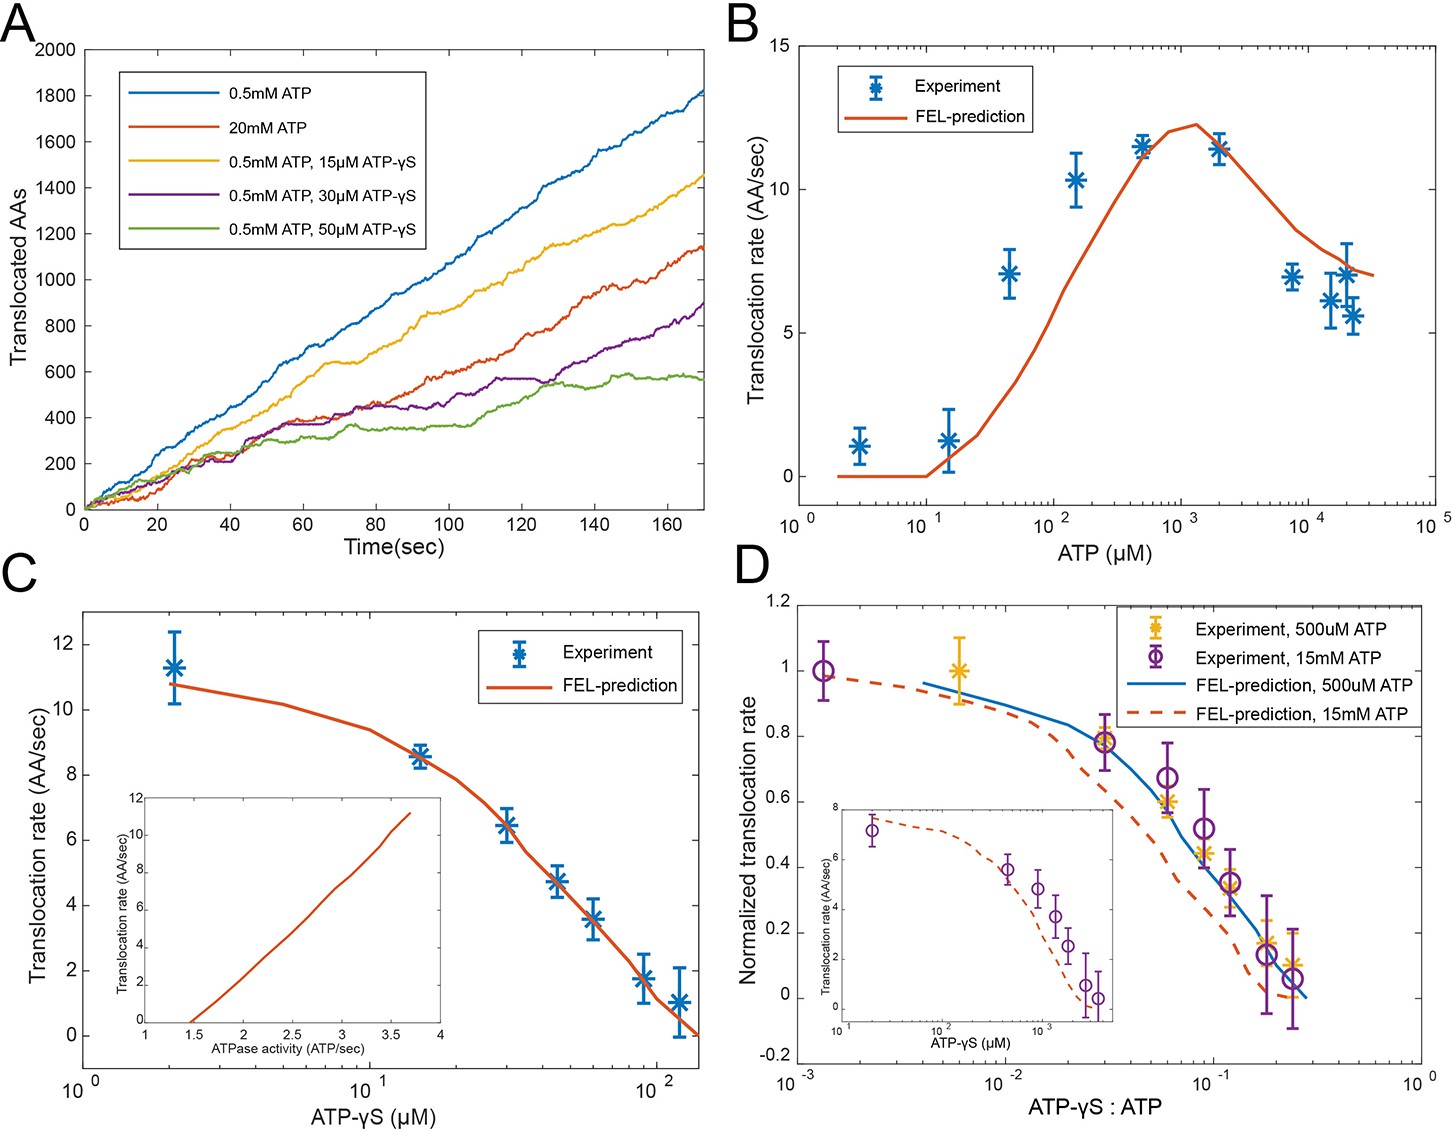
Evaluating the FEL-predicted degradation kinetics.
(A) Examples of simulated kinetics of translocation on individual proteasome particles under indicated nucleotide conditions. (B) The translocation rate of cyclinB-iRFP measured at various concentrations of ATP-Mg2+, in comparison with the FEL-model prediction (red curve) based on the determined parameters. (C) Same as in (B) but measured with 0.5 mM ATP and various concentrations of ATP-γS. Inset: translocation rate versus. ATP-hydrolysis activity as predicted by the FEL model at 0.5 mM ATP and different concentrations of ATP-γS. (D) Same as in (B) but measured with 15 mM ATP and various concentrations of ATP-γS. X-axis is the ratio between ATP-γS and ATP concentrations; Y-axis is the normalized translocation rate. The result in (C) is overlaid as a comparison. Inset: the absolute translocation rate versus ATP-γS concentrations. FEL, free-energy landscape.
-
Figure 4—source data 1
Degradation kinetics of ubiquitylated cyclinB-iRFP in the presence of various concentrations of ATP.
Related to Figure 4B.
- https://cdn.elifesciences.org/articles/71911/elife-71911-fig4-data1-v2.pdf
-
Figure 4—source data 2
Degradation kinetics of ubiquitylated cyclinB-iRFP in the presence of various concentrations of ATP.
Related to Figure 4B.
- https://cdn.elifesciences.org/articles/71911/elife-71911-fig4-data2-v2.pdf
-
Figure 4—source data 3
Degradation kinetics of ubiquitylated cyclinB-iRFP in the presence of 500 µM ATP and various concentrations of ATP-γS.
Related to Figure 4C and D.
- https://cdn.elifesciences.org/articles/71911/elife-71911-fig4-data3-v2.pdf
-
Figure 4—source data 4
Degradation kinetics of ubiquitylated cyclinB-iRFP in the presence of 15 mM ATP and various concentrations of ATP-γS.
Related to Figure 4D.
- https://cdn.elifesciences.org/articles/71911/elife-71911-fig4-data4-v2.pdf
Figure 4—figure supplement 1

The workflow of this study, including the observations used for model construction, experimental validations of the simulated ATPase dynamics, and the major insights into the ATPase mechanism.
Figure 4—figure supplement 2
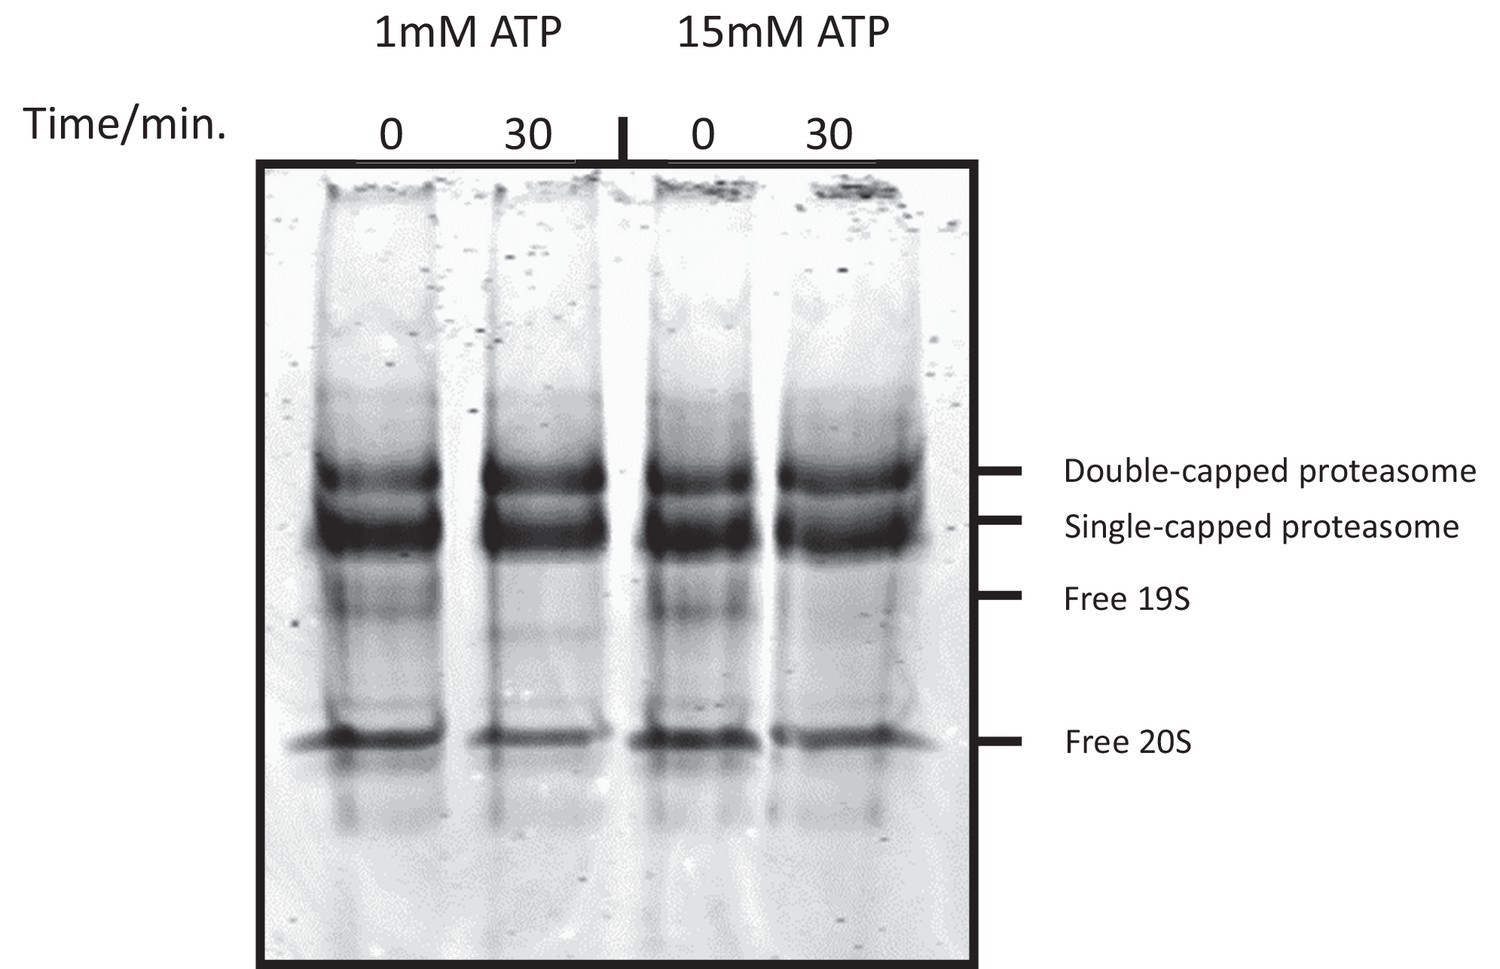
High ATP concentration does not cause proteasome disassembly.
Purified human 26S proteasome was incubated with ATP-Mg2+ at indicated concentrations. After incubation, the sample was fixed with 1 mM BS3 (bis(sulfosuccinimidyl)suberate) for 30 min and was analyzed on a native gel in the absence of nucleotide.
Figure 4—figure supplement 3
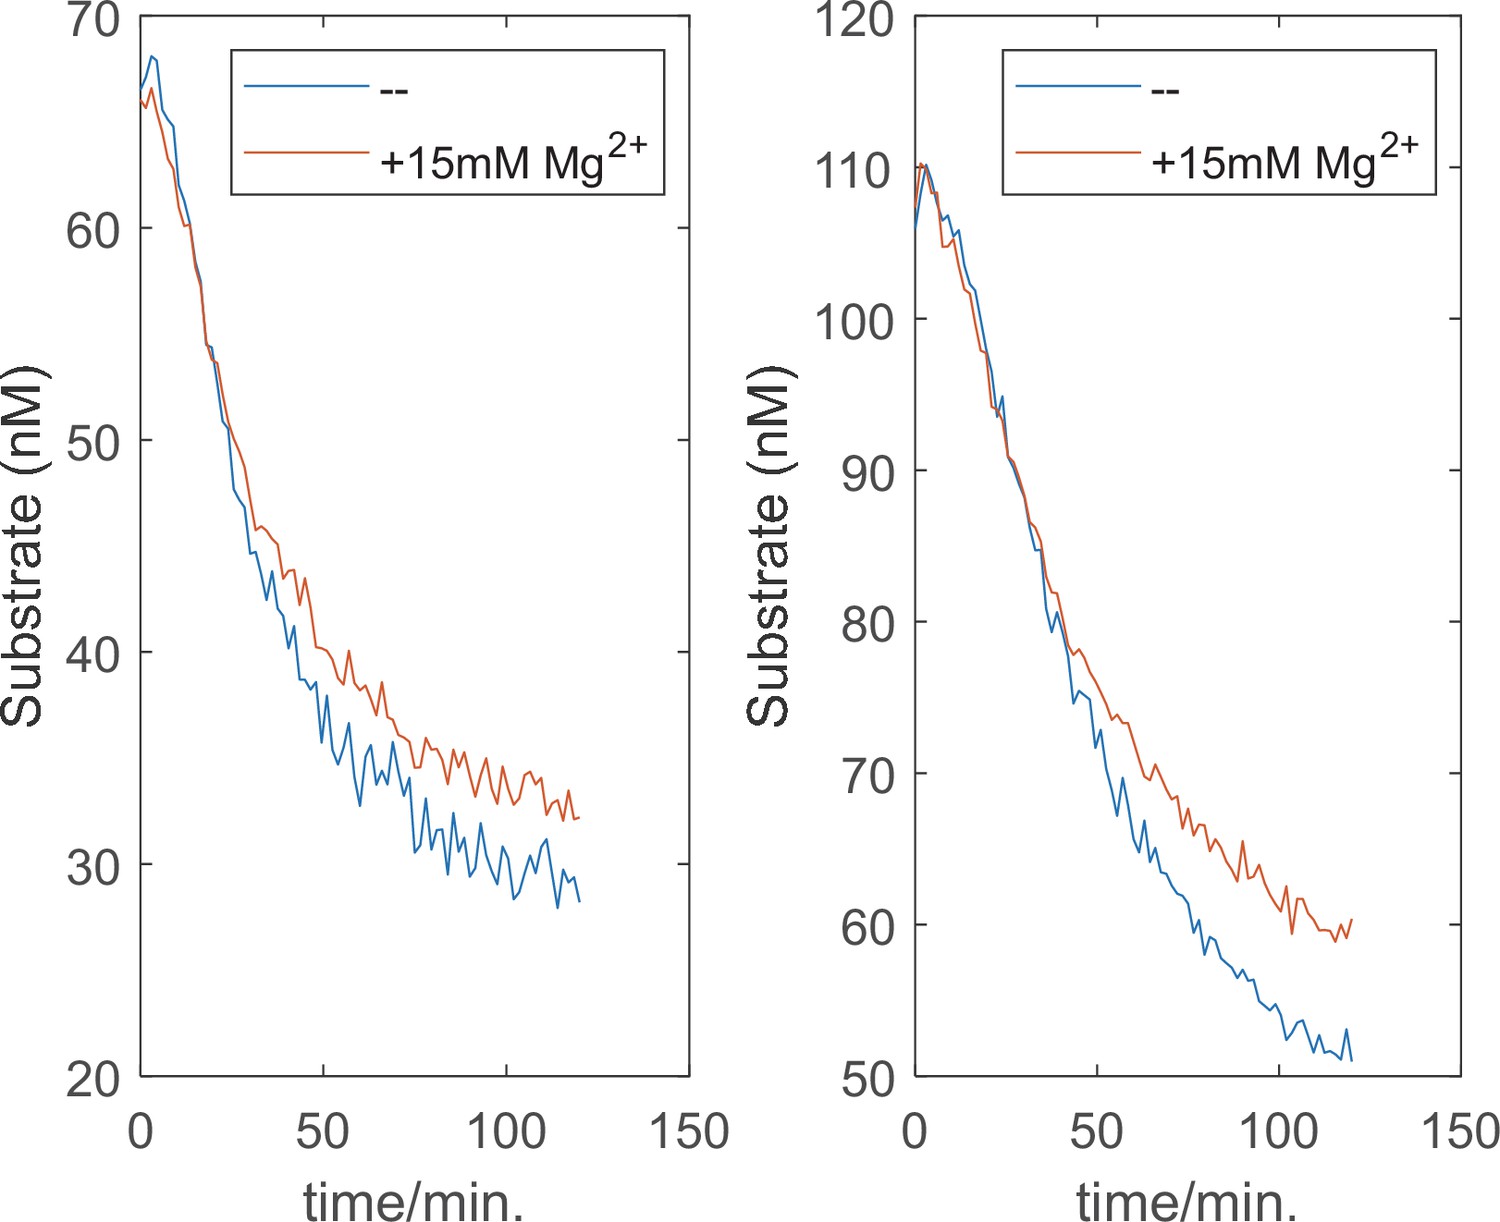
High concentration of Mg2+ alone does not affect the degradation kinetics.
The quantitative degradation assay of ubiquitylated cyclinB-iRFP was performed as described in Materials and methods with 0.5 mM ATP, with or without an extra 15 mM MgCl2. Two substrate concentrations were tested.
Figure 4—figure supplement 4
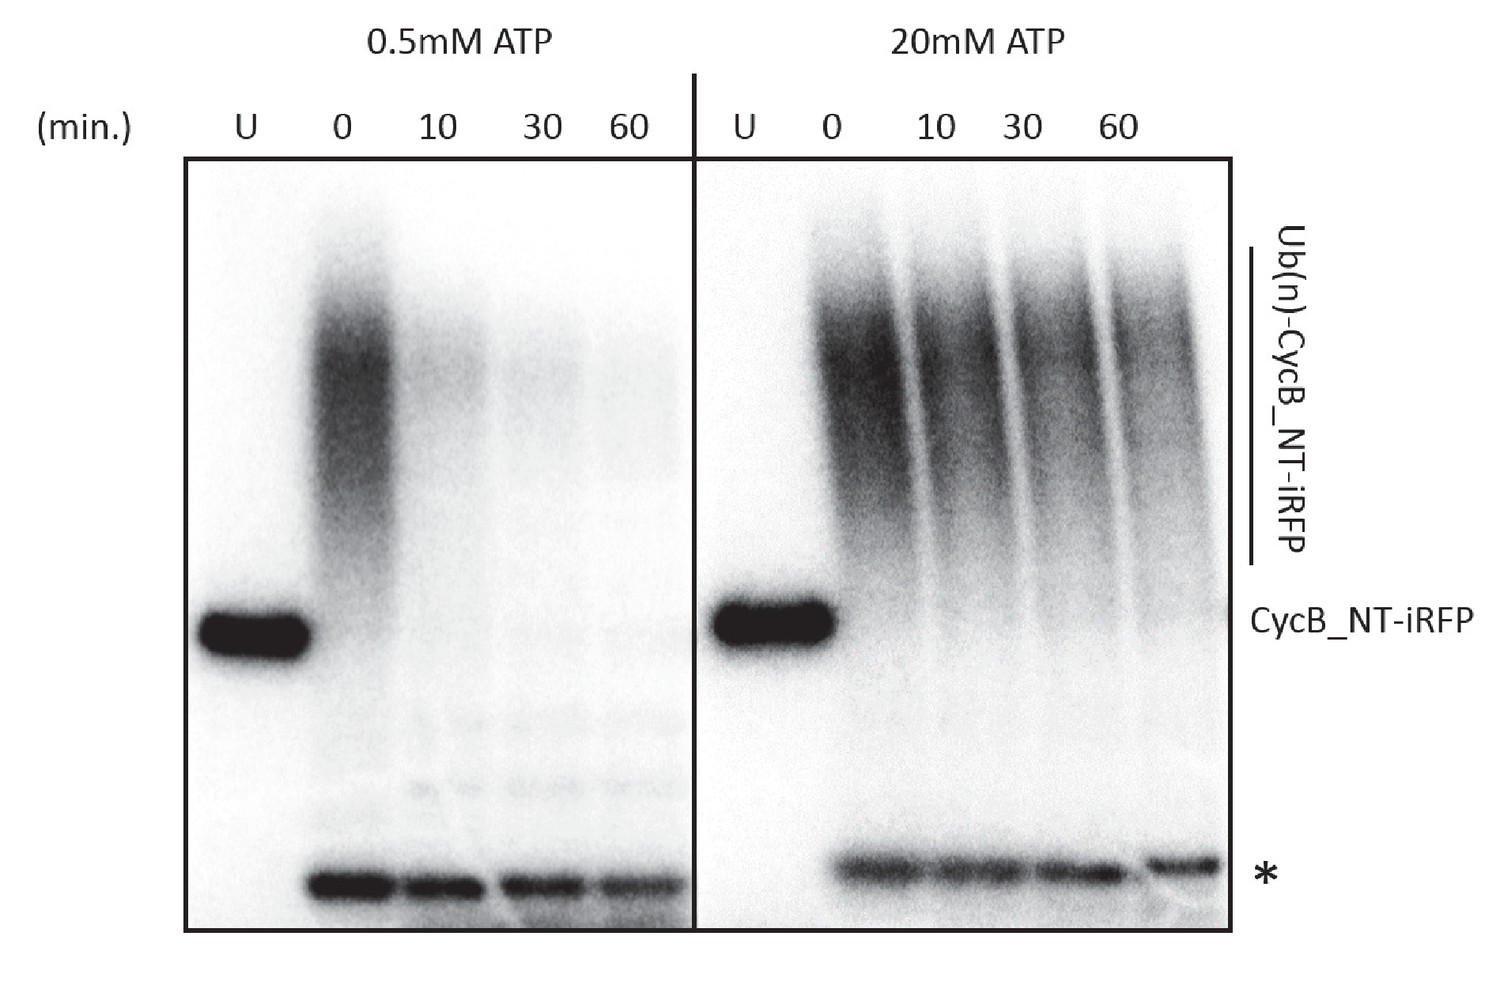
High ATP concentration does not lead to partial protein degradation or uncoupling between ubiquitylation and degradation.
Ubiquitylated cyclinB-iRFP was radiolabeled with (Lyubimov et al., 2011) p at both the N- and C-terminus using protein kinase A. The degradation assay was performed as described in methods and was sampled at indicated time points and analyzed by autoradiography. U: unubiquitylated cyclinB-iRFP. ‘*’: radiolabeled securin was added as a control for loading and nonspecific dephosphorylation.
Figure 4—figure supplement 5

High ATP concentration does not inhibit the ATPase activity of proteasome.
The rate of ATP hydrolysis of purified 26S proteasome was measured in the presence of varying concentrations of ATP-Mg2+ using a Malachite green assay (Peth et al., 2013b). Denatured ovalbumin was used as a generic substrate for proteasome as described previously (Cascio et al., 2001). Error bars represent three experimental replicas.
Figure 5 with 5 supplements
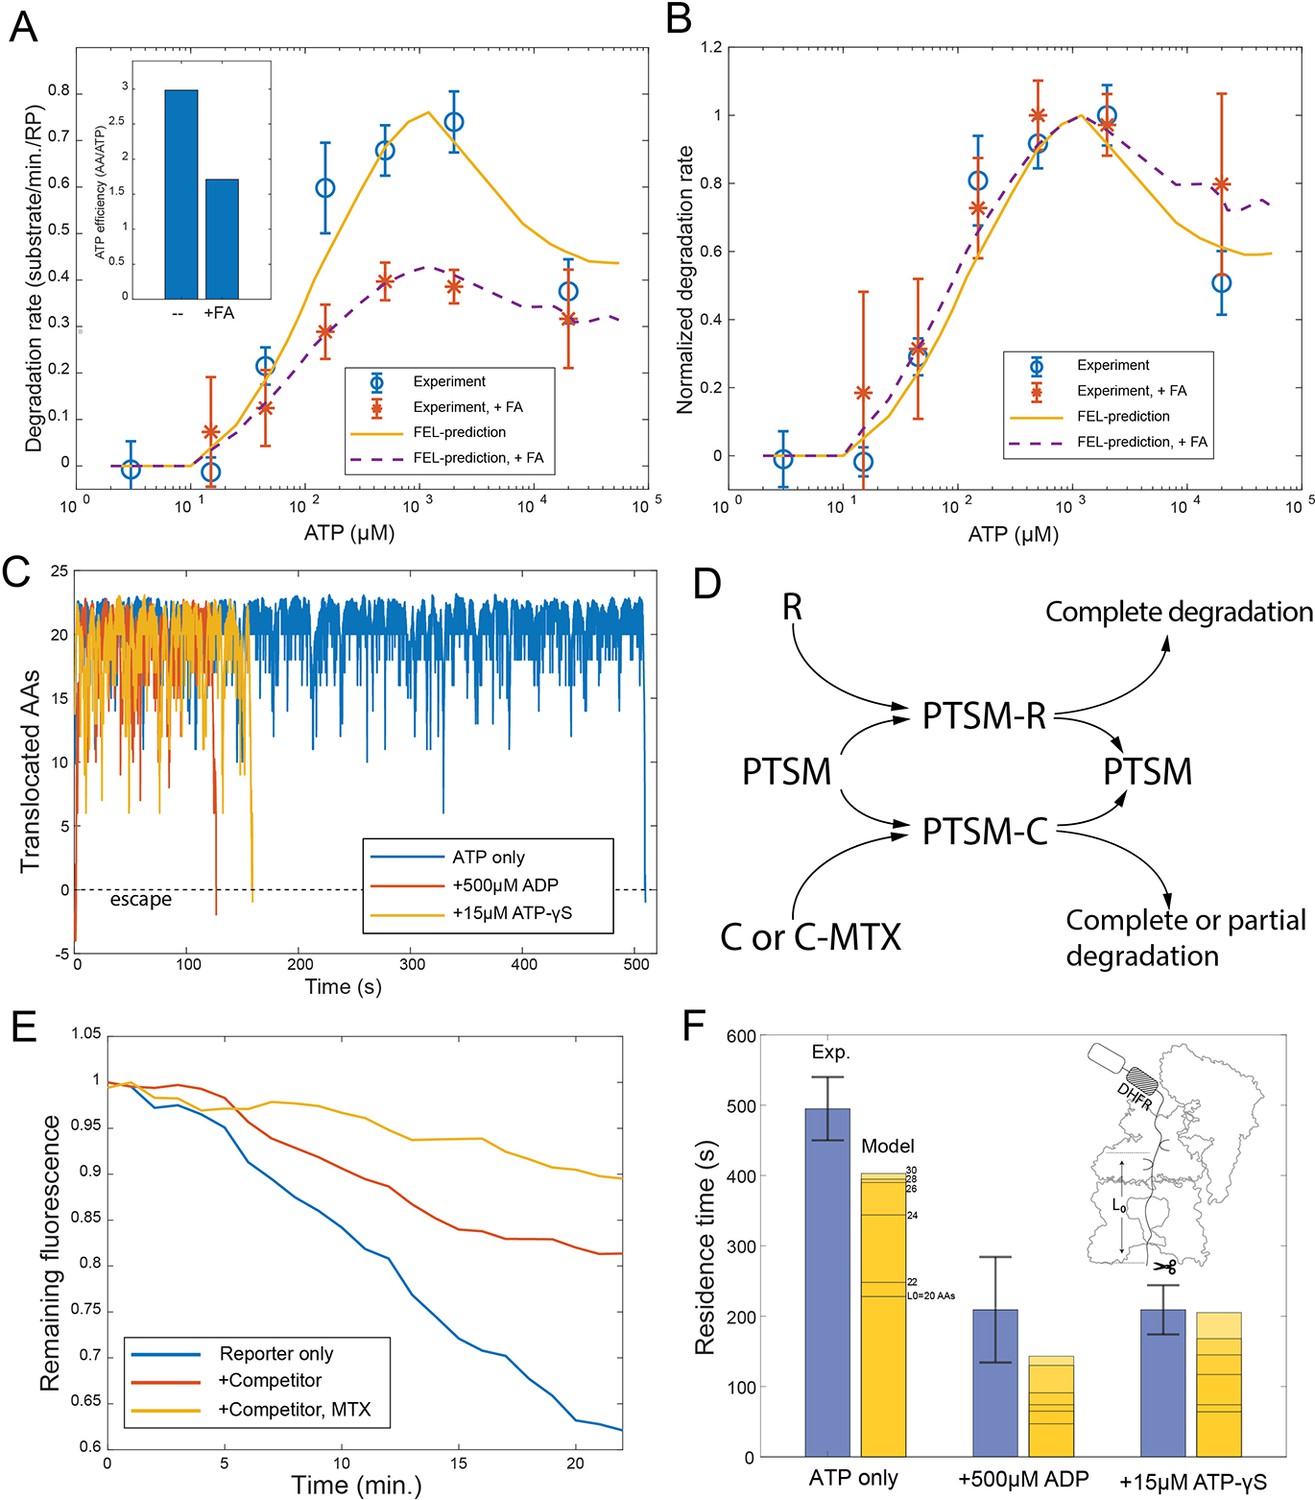
Evaluating the FEL predictions for structurally-stable substrates.
(A) The initial degradation rate of ubiquitylated cyclinB-DHFR-iRFP by purified 26S proteasome with or without 0.8 mM folic acid (FA), overlaid with the FEL model prediction. The inset shows the effective length of substrate peptide degraded by consuming one ATP molecule, as predicted by the FEL model. The normalized degradation rate is shown in (B). Error bars represent the standard deviation of 15 measurements. (C) Examples of simulated translocation kinetics when the ATPases encounter an unfolding-resistant domain at t=0, assuming substrate escape occurs at Y=0. (D) Schematic showing the reactions in the competition assay for determining the residence time of an unfolding-resistant substrate on proteasome. R: cyclinB-iRFP reporter; C: cyclinB-DHFR-iRFPdark competitor. (E) Representative traces of the competition assay in (D). (F) Experimental values of the residence time of cyclinB-DHFR(MTX)-iRFP under indicated nucleotide conditions, in comparison with FEL model predictions with the peptide track length L0 from 20 to 30 AAs. Error bars represent the standard deviation of 5 measurements. FEL, free-energy landscape.
-
Figure 5—source data 1
Degradation kinetics of ubiquitylated cyclinB-DHFR-iRFP in the presence of various concentrations of ATP without folic acid.
Related to Figure 5A and B.
- https://cdn.elifesciences.org/articles/71911/elife-71911-fig5-data1-v2.pdf
-
Figure 5—source data 2
Degradation kinetics of ubiquitylated cyclinB-DHFR-iRFP in the presence of various concentrations of ATP with folic acid.
Related to Figure 5A and B.
- https://cdn.elifesciences.org/articles/71911/elife-71911-fig5-data2-v2.pdf
-
Figure 5—source data 3
Degradation kinetics of ubiquitylated cyclinB-iRFP in the presence of cyclinB-DHFR-iRFPdark as competitor, with either ADP or ATP-γS in the buffer.
Related to Figure 5F.
- https://cdn.elifesciences.org/articles/71911/elife-71911-fig5-data3-v2.pdf
Figure 5—figure supplement 1

Folic acid slows down the degradation of cyclinB-DHFR-iRFP, but not cyclinB-iRFP.
100 nM ubiquitylated cyclinB-DHFR-iRFP was tested in the quantitative degradation assay with 2 nM proteasome at various concentrations of folic acid (A) or methotrexate (C) as indicated in the legend. Results for cyclinB-iRFP under identical conditions were shown in (B) and (D).
Figure 5—figure supplement 2

CyclinB-DHFR-iRFP was completely degraded by the proteasome in the presence of folic acid.
Ubiquitylated cyclinB-DHFR-iRFP was radiolabeled with (Lyubimov et al., 2011) p at both the N- and C-terminus using protein kinase A and was subject to degradation by 2 nM purified human 26S proteasome as described in Figure 5—figure supplement 1. +FA: in the presence of 800 µM folic acid (+FA). Samples were analyzed by autoradiography which was intentionally overexposed to reveal any partially degraded products.
Figure 5—figure supplement 3

The degradation rate of cyclinB-DHFR-iRFP is inversely proportional to the folic acid concentrations.
The degradation rate of cyclinB-DHFR-iRFP was measured at various folic acid concentrations as described in the Methods. Its inverse was plotted against the folic acid concentration.
Figure 5—figure supplement 4

The rate of ATP hydrolysis versus ATP concentration as predicted by the FEL model.
The predicted rate of ATP hydrolysis per ATPase hexamer was plotted against the concentration of ATP in the FEL simulation as described in Materials and methods 'Monte Carlo simulation of the FEL model of proteasome'.
Figure 5—figure supplement 5
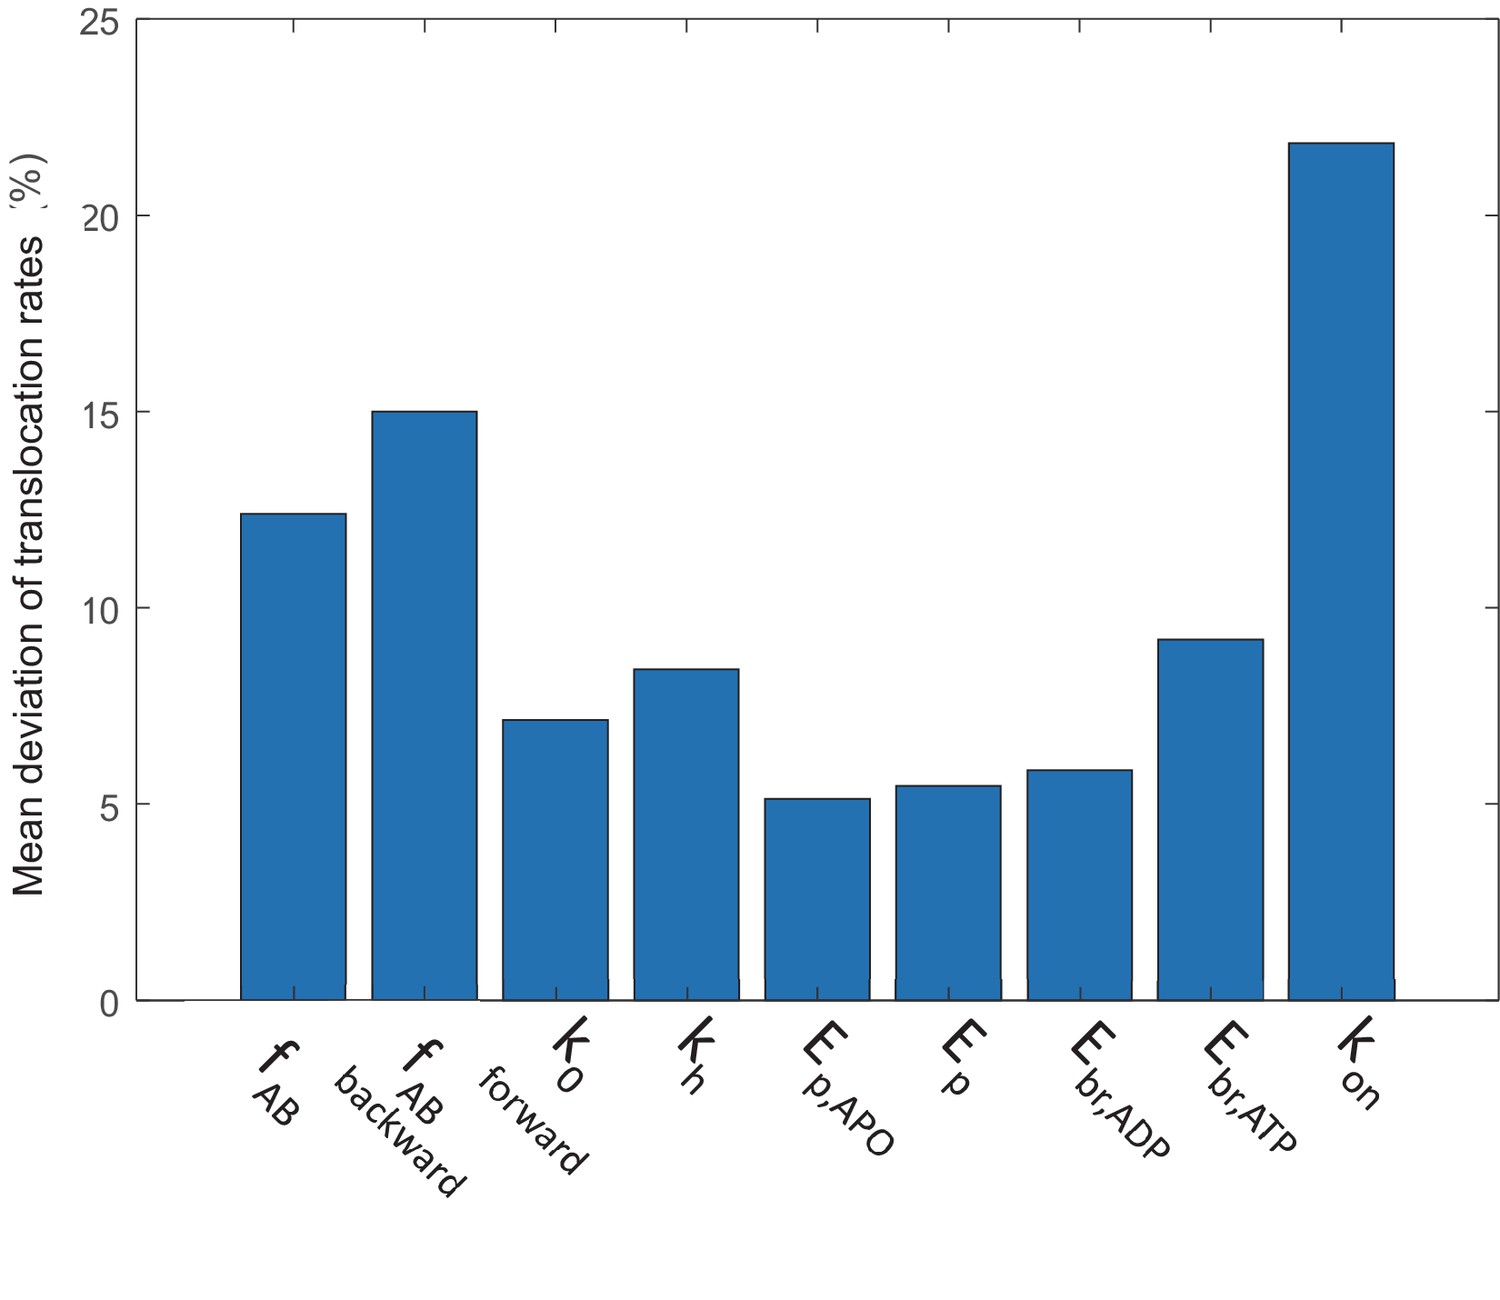
Sensitivity of the simulated translocation rates to parameter variations.
A parameter is either increased or decreased by 30%, except for kon which is varied by threefold due to the large uncertainty in its estimation. The simulated translocation rates under various nucleotide conditions in this study were compared with the original, and the mean deviation over the original translocation rate is presented. See Materials and methods 'Parameter sensitivity analysis'.
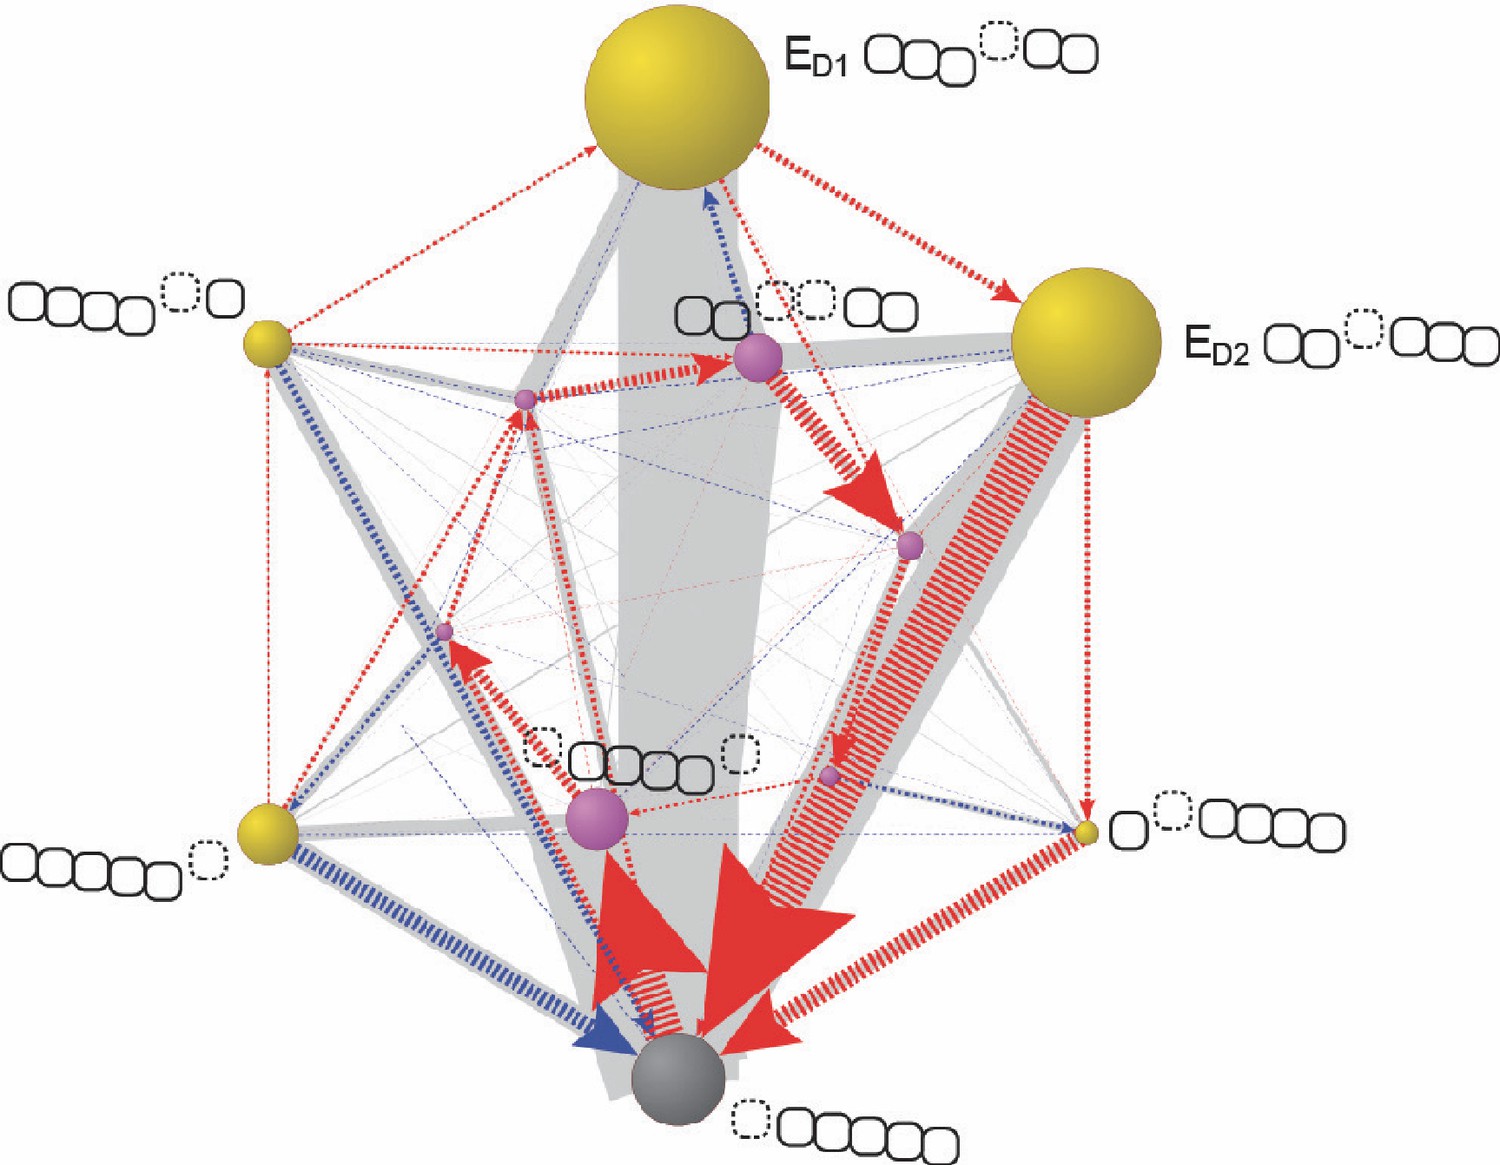
Figure 6 with 6 supplements
Organization of proteasomal conformations in dynamical space.
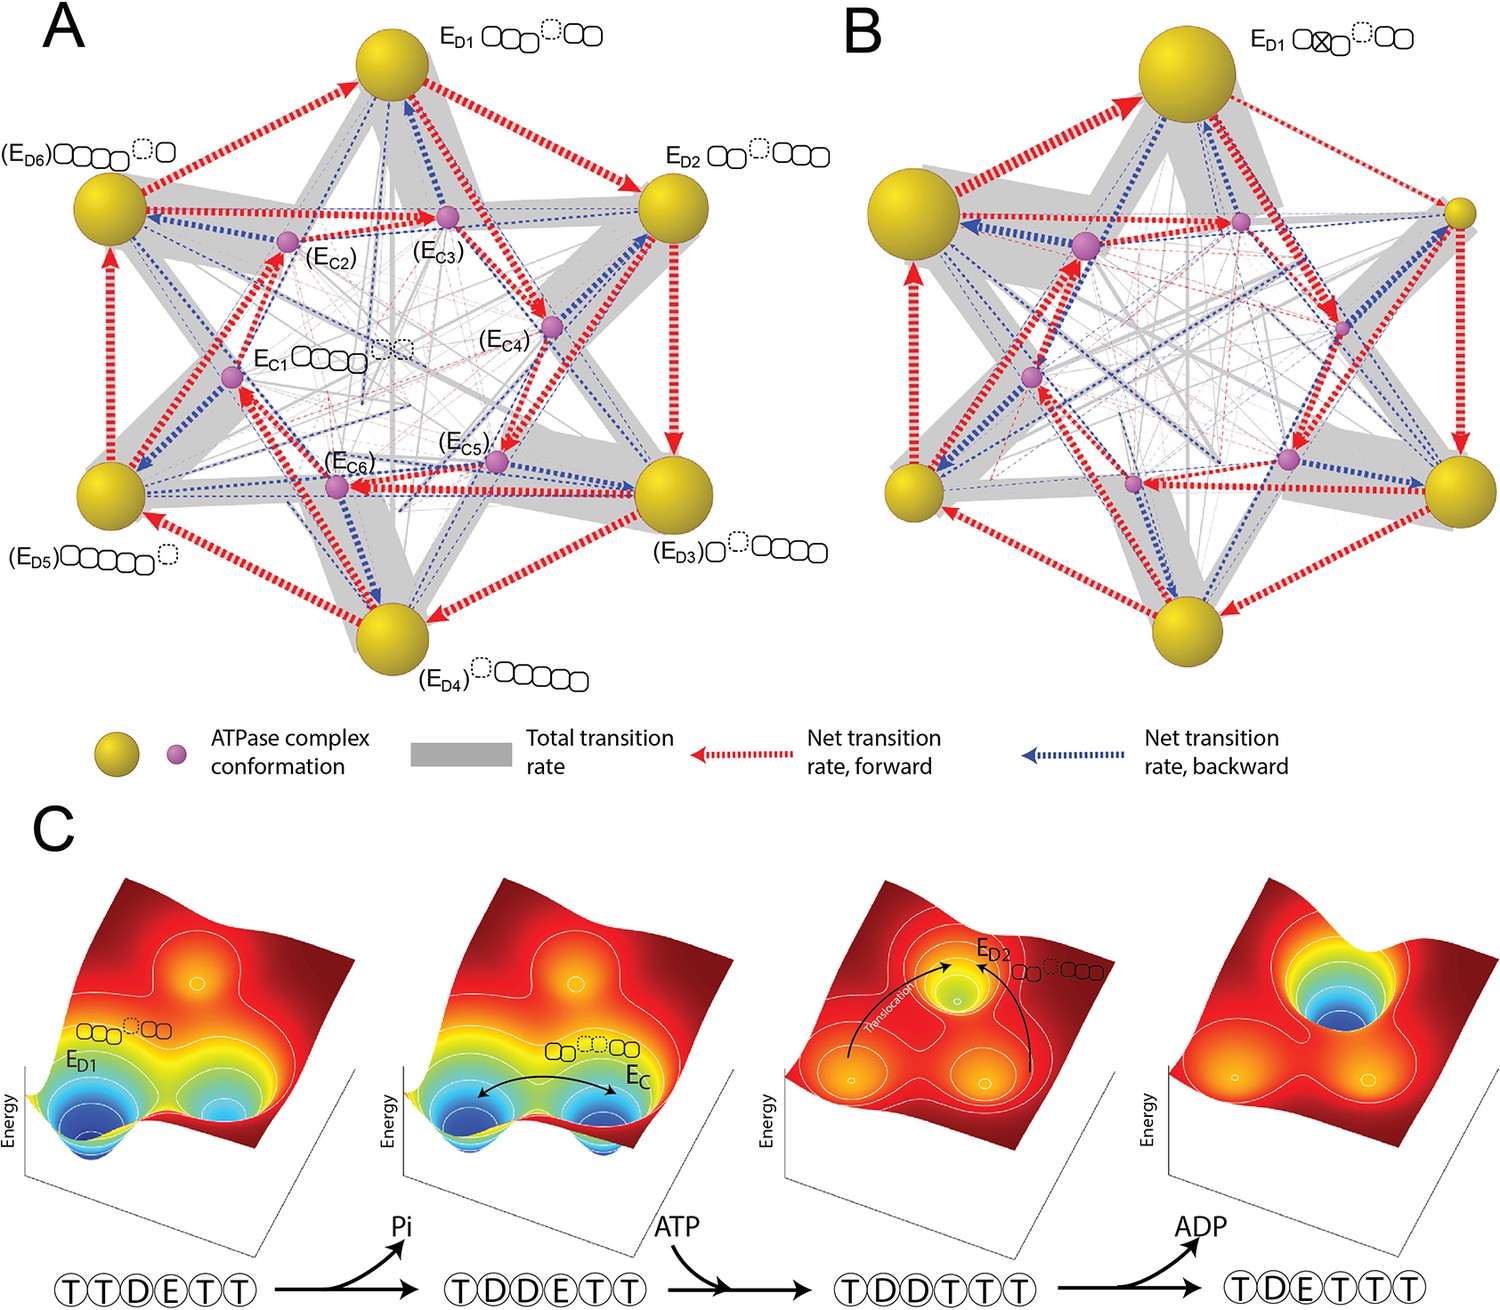
(A) A diagram showing the steady-state transitions between the ATPase complex conformations in the FEL model. Each node represents a unique hexamer conformation, whose size is in proportion to its probability of occupancy in a steady state. Yellow and purple nodes are the ED-like and EC-like conformations, respectively, with the corresponding ATPase architecture as presented in Figure 2C. The labels of the conformations that have not yet been experimentally identified are bracketed. The width of a gray line is proportional to the total rate of forward and backward transitions between two conformations; and a dashed arrow represents the net transition rate and is colored according to the direction of substrate translocation associated with this conformational change. Minor conformations are randomly distributed in the graph. Supplementary file 1 contains a full list of the conformations and their transition rates. The transition diagram without the hydrolysis activity of Rpt3 is shown in (B). (C) The mechanism of the cooperative movements of proteasomal ATPases during substrate translocation. The FELs on three conformations (the ED1- and ED2-equivalent and an EC) are illustrated for four nucleotide statuses in a typical ED1-to-ED2 transition (Figure 6—figure supplement 2). The ATPase architecture of each conformation is presented as in Figure 2C. Arrows indicate the major conformation transitions upon the change of the nucleotide status and the associated FEL. FEL, free-energy landscape.
Figure 6—figure supplement 1

The rates of substrate translocation and ATP hydrolysis for a Walker-B mutant proteasome.
The translocation rate and ATPase activity were calculated using the FEL model in which Rpt3’s ATP hydrolysis activity was abolished (WBM). The results are compared with those of the wild-type (WT) proteasome.
Figure 6—figure supplement 2

The typical sequence of elementary steps underlying the ED1-to-ED2 state transition.
In a simulation of the FEL model, the probabilities of all the pathways that lead to the ED1 to ED2 transition were calculated. The pathway with the highest probability is presented. This pathway is also embedded in most other ED1–ED2 pathways. Irreversible steps are indicated by a single arrow and reversible steps are indicated by double arrows.
Figure 6—figure supplement 3
The typical sequence of elementary steps underlying the ED1-to-EC state transitions.
The same analysis was performed as in Figure 6—figure supplement 2, but for the ED1 to EC transition.
Figure 6—figure supplement 4
The Lid-ATPase interaction may account for the observed dissymmetry in conformational occupancies in previous cryo-EM studies.
In an FEL model simulation, the standard free energy of the ED-like conformation (gray) which mimics the ATPase architecture in the EA-like states in the cryo-EM studies was lowered by an arbitrary 2.0 kcal/mol. The resulting transition network is presented using the same convention as in Figure 5A. The size of the gray node was shrunk by 2.5-fold for presentation. Varying the free energy difference from 1.6 to 4.0 kcal/mol gave qualitatively similar results. The ATPase architecture of each conformation is shown next to the node as in Figure 5A.
Figure 6—figure supplement 5
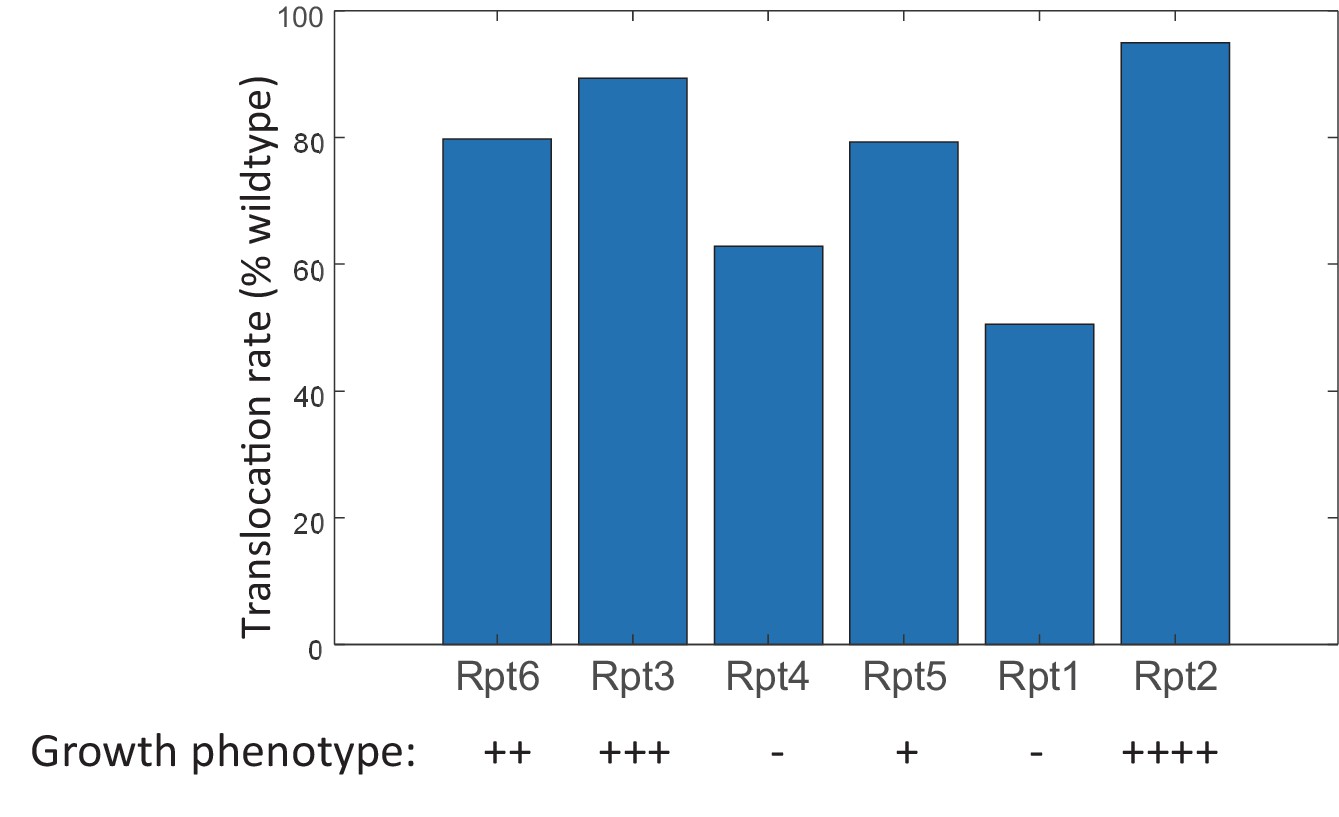
The Lid-ATPase interaction may account for the different growth phenotypes of yeast Walker-B mutants.
The translocation rate was calculated for each Walker-B mutant proteasome (ATP hydrolysis set to zero) using the FEL model involving the ATPase-Lid interaction as described in Materials and methods 'Monte Carlo simulation of the FEL model of proteasome'. The growth phenotype of each Walker-B mutant is adapted from a previous study; ‘++++’: healthy; ‘+++’: slightly sick; ‘++’: sick; ‘+’: near-lethal; ‘−’: lethal (Eisele et al., 2018). Varying the ATPase-Lid interaction from 1.6 to 4.0 kcal/mol gave qualitatively similar results.
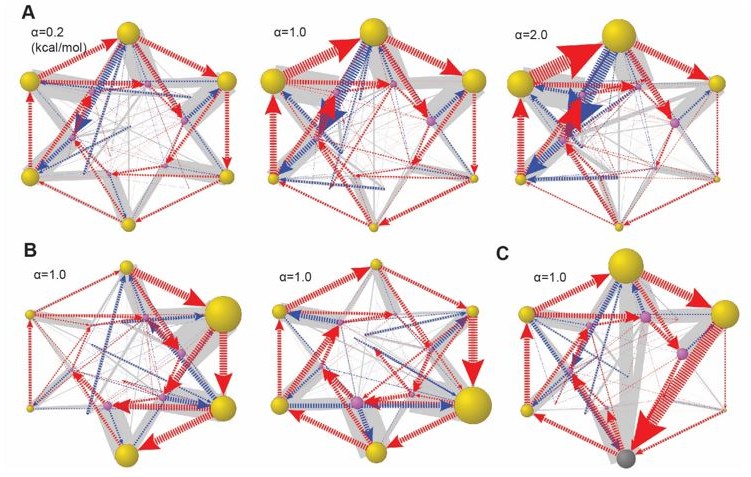
Figure 6—figure supplement 6
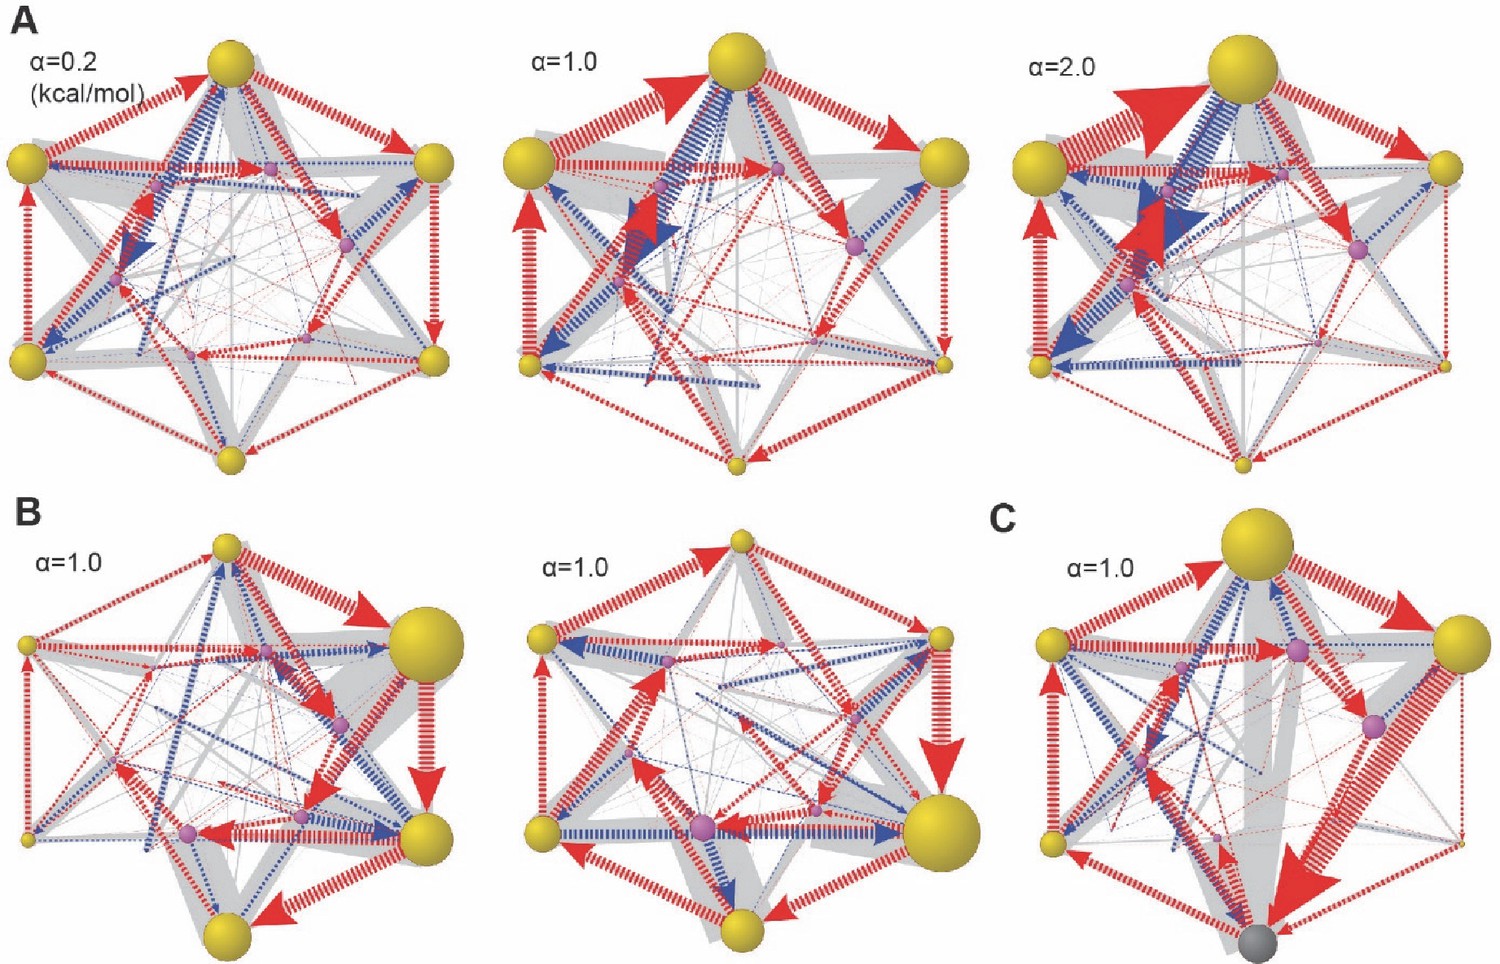
Global dynamical space with heterogeneous ATPase parameters.
In the simulation, we let the basal energy Ebi of the ith ATPase = α×δi. δi is a random number from 0 to 1 and α is a scaling constant. In (A), we varied the value of α while fixing the ratios of Ebi. In this example, δi=(0.45, 0.15, 0.83, 1.0, 0.68, and 0.88). (B) Two cases with alternative δi and the same α. (C) The same Eb setting as in (A, middle), but including the Lid-ATPase interaction as in Figure 6—figure supplement 4. The results are presented as in Figure 6.
Author response image 1

Testing alternative FEL models.
(A) Steady-state occupancies for different conformations. See text for the definition of each model. B-D. Comparison of different models in predicting translocation rates in various nucleotide conditions.
Author response image 2
Global dynamical space in the presence of variations in e_b.
(A) Varying the amplitude α of e_b variation while fixing the ratios. In this example, δi=(0.45,0.15,0.83,1.0, 0.68,0.88). B. Two cases with alternative δi and the same amplitude. C. The same e_b setting as in A(middle), but including the Lid-ATPase interaction as in Fig. 6-fig. supp. 4. Results are presented as in Fig. 6.
Tables
Key resources table
| Reagent type (species) or resource | Designation | Source or reference | Identifiers | Additional information |
|---|---|---|---|---|
| Recombinant DNA reagent | pT7-CyclnB-iRFP (plasmid) | This study | pLM254 | For expressing cyclinB-iRFP(available upon request) |
| Recombinant DNA reagent | pT7-cyclinB-DHFR-iRFP (plasmid) | This study | pLM428 | For expressing cyclinB-DHFR-iRFP(available upon request) |
| Recombinant DNA reagent | pT7-cyclinB-iRFP-DHFR (plasmid) | This study | pLM429 | For expressing cyclinB-iRFP-DHFR(available upon request) |
| Recombinant DNA reagent | pT7-cyclinB (K18, 36, 64) (plasmid) | This study | pLM120 | For expressing cyclinB (K18, 36, 64)(available upon request) |
| Peptide, recombinant protein | Dylight550-Ubiquitin | Lu et al., 2015; Puchades et al., 2020 | Dy550-Ub | Available upon request |
| Peptide, recombinant protein | Human 26S proteasome | HEK293 cell (Rpn11-HTBH) | hPTSM | |
| Peptide, recombinant protein | Human 26S proteasome SNAP-Rpn3 | HE293 cell (SNAP-Rpn3) This study | hPTSM-SNAP | |
| Cell line (Human) | HEK293 | Lab stock (commonly available) | HEK293 | |
| Cell line (Human) | HEK293-SNAP-Rpn3 | This study | HEK293-Rpn3-SNAP | For expressing SNAP-Rpn3 proteasome |
| Chemical compound, drug | ATP-gS | Sigma-Aldrich | A1388 | |
| Chemical compound, drug | A647-ATP | Thermo Fisher Scientific | A22362 | |
| Chemical compound, drug | Folic acid | Sigma-Aldrich | F8758 | |
| Chemical compound, drug | Methotrexate | Sigma-Aldrich | A6770 | |
| Chemical compound, drug | Biliverdin | Sigma-Aldrich | 30891 | |
| Chemical compound, drug | SNAP-surface-549 | NEB | S9112S | |
| Strain, strain background (Escherichia coli) | NiCo21 DE3 | NEB | C2529H | |
| Software, algorithm | MATLAB 2018 | MathWorks | ||
| Software, algorithm | Pajek | Pajek | http://vlado.fmf.uni-lj.si/pub/networks/pajek/ | |
| Software, algorithm | Proteasome FEL model | This study | https://github.com/luyinghms/Proteasome-FEL-model.git; Ying, 2022 | Source code for the FEL model |
| Chemical compound, drug | ATP-gS | Sigma-Aldrich | A1388 |
Additional files
-
Supplementary file 1
ATPase conformations and steady-state occupancies.
“Close interface”: the six digits indicate the Rpt6-Rpt3, Rpt3-Rpt4, Rpt4-Rpt5, Rpt5-Rpt1, Rpt1-Rpt2, Rpt2-Rpt6 interfaces. “0”: open; “1”: closed. “Engaged ATPases”: the six digits indicate Rpt6, Rpt3, Rpt4, Rpt5, Rpt1, Rpt2. “0”: disengaged subunit; “1”: engaged subunit. “PL1 registry”: the six digits indicate the PL1s on Rpt6, Rpt3, Rpt4, Rpt5, Rpt1, Rpt2. “1~5”: part of the staircase architecture. “1” is closest to the CP; and “5” is farthest from the CP. “7”: disengaged PL1 at the top registry. “Steady-state occupancy (%)”: the steady-state occupancy of each conformation in a FEL simulation. 2. Steady-state transition rates among ATPase conformations in the FEL model. “Total transition”: the total rate of transitions from conformation 1 to conformation two and reverse. Numbers are normalized by the highest value set to 100. “Net transition”: the absolute value of the rate difference between conf1-conf2 and conf2-conf1 transitions. Numbers are normalized by the same factor as above. “Translocation”: F: the net effect of conf1-conf2 transitions is a forward translocation of substrate; “B”: the net effect is a backward translocation; “N”: this conformational transition does not lead to translocation.
- https://cdn.elifesciences.org/articles/71911/elife-71911-supp1-v2.xlsx
-
Transparent reporting form
- https://cdn.elifesciences.org/articles/71911/elife-71911-transrepform1-v2.docx
Download links
A two-part list of links to download the article, or parts of the article, in various formats.
Downloads (link to download the article as PDF)
Open citations (links to open the citations from this article in various online reference manager services)
Cite this article (links to download the citations from this article in formats compatible with various reference manager tools)
An empirical energy landscape reveals mechanism of proteasome in polypeptide translocation
eLife 11:e71911.
https://doi.org/10.7554/eLife.71911


