Cystathionine-β-synthase is essential for AKT-induced senescence and suppresses the development of gastric cancers with PI3K/AKT activation
- Division of Cancer Research, Peter MacCallum Cancer Centre, Australia
- Sir Peter MacCallum Department of Oncology, University of Melbourne, Australia
- Monash Institute of Pharmaceutical Sciences, Australia
- Metabolomics Australia, Bio21 Molecular Science and Biotechnology Institute, Australia
- Department of Oncology, The People’s Liberation Army No. 903rd Hospital, China
- Zhejiang Provincial Key Laboratory of Silkworm Bioreactor and Biomedicine, College of Life Sciences and Medicine, Zhejiang Sci-Tech University, China
- St Vincent’s Institute of Medical Research, Australia
- Department of Clinical Pathology, University of Melbourne, Australia
- Department of Biochemistry and Molecular Biology, Monash University, Australia
- Department of Medicine, St Vincent’s Hospital, University of Melbourne, Australia
- Department of Biochemistry and Molecular Biology, University of Melbourne, Australia
Figures
Figure 1 with 1 supplement
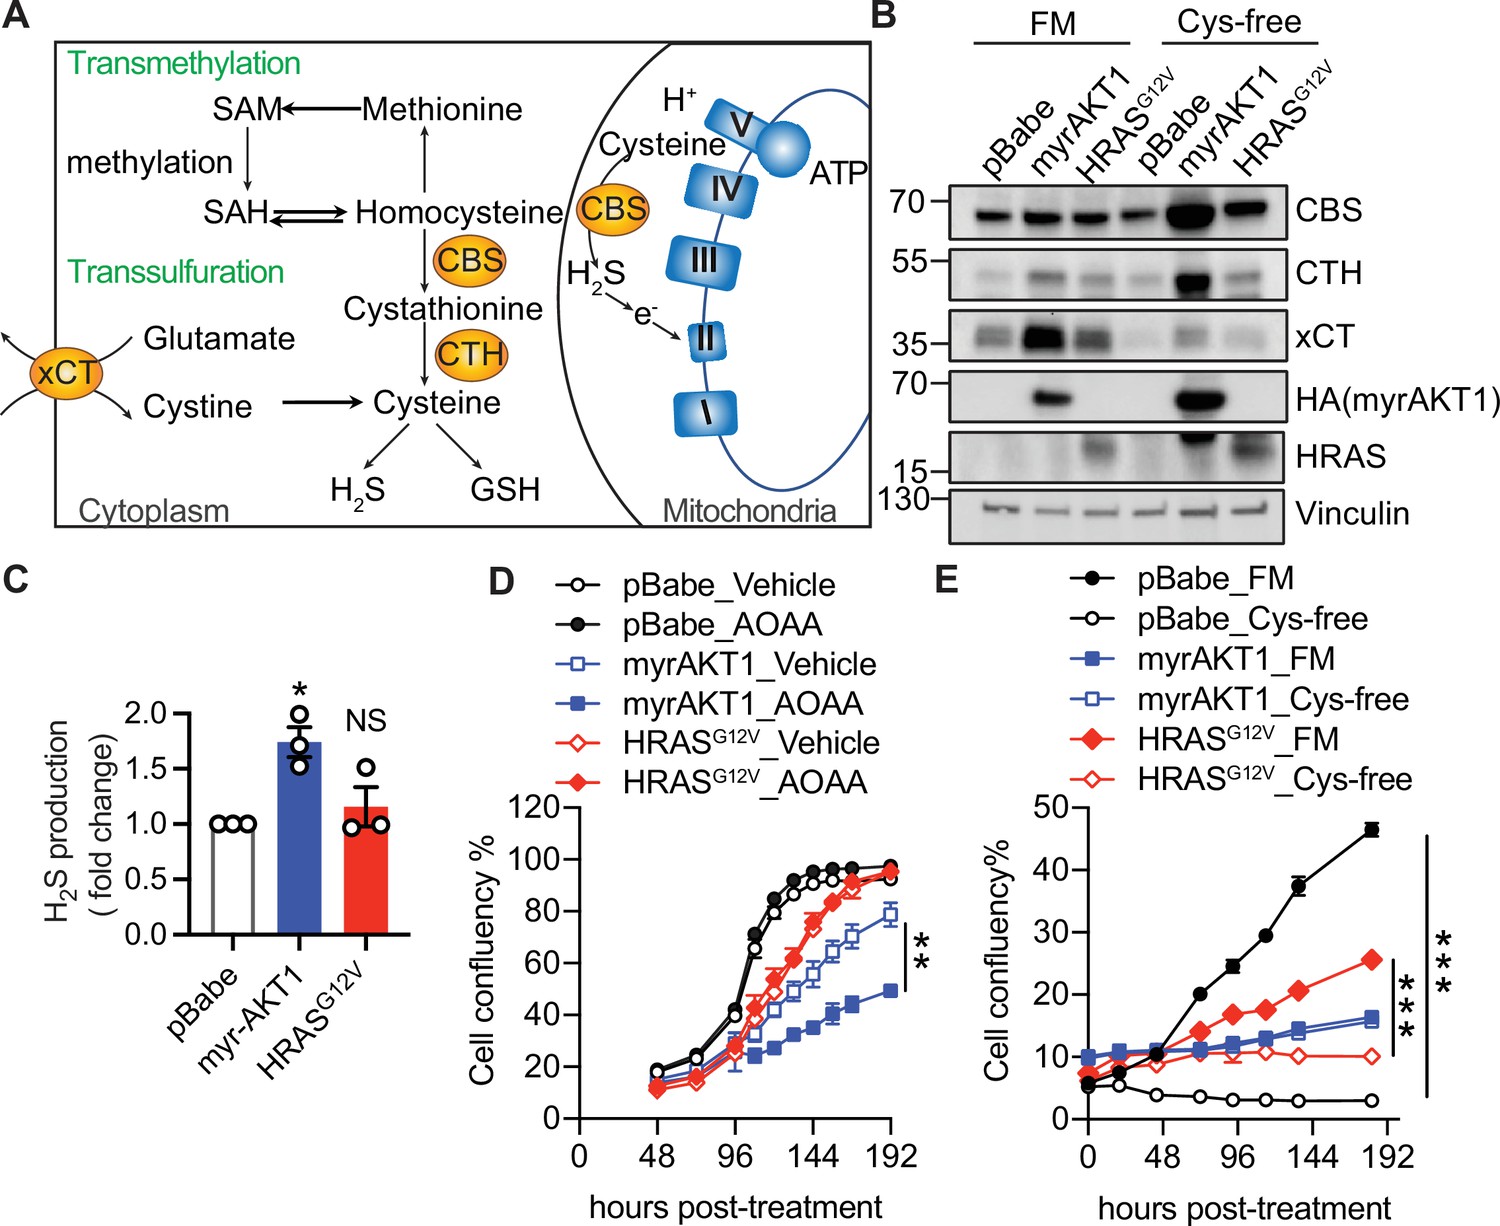
Cystathionine-β-synthase (CBS) expression and transsulfuration pathway activity are elevated in AKT-induced senescence.
(A) Schematic diagram illustrating that the cytoplasmic localized CBS regulates transmethylation and transsulfuration metabolic pathways, and mitochondrial localized CBS regulates oxidative phosphorylation. (B) BJ3 human skin fibroblasts expressing telomerase reverse transcriptase (BJ-TERT) cells were transduced with pBabe, myrAKT1, or HRASG12V. On day 6 post-transduction the cells were plated in either full culture medium containing 100 µM cysteine (FM) or cysteine-deficient medium (Cys-free). Western blot analysis was performed on day 10 post-transduction. Vinculin was probed as a loading control. Representative of n=3 experiments. (C) Hydrogen sulfide (H2S) production was measured by AzMC on day 14 post-transduction. Fold changes over pBabe control are presented as mean ± SEM (n=3). One sample t-test compared to the hypothetical value 1.0 was performed (NS, not significant; *p<0.05). (D) Cells were treated with aminoxyacetate (AOAA) 30 μM on day 5 post-transduction. Cell confluency measured by IncuCyte is presented as mean ± SEM (n=3). (E) Cells were cultured in the conditions as described in (B). Cell confluency measured by IncuCyte is presented as mean ± SEM (n=3–5). Statistical significance at the last time point in (D) and (E) was determined by unpaired t-test (**p<0.01; ***p<0.001).
-
Figure 1—source data 1
Unedited immunoblots of Figure 1B.
Raw images were acquired using the ChemiDoc system (Bio-Rad).
- https://cdn.elifesciences.org/articles/71929/elife-71929-fig1-data1-v1.pdf
Figure 1—figure supplement 1
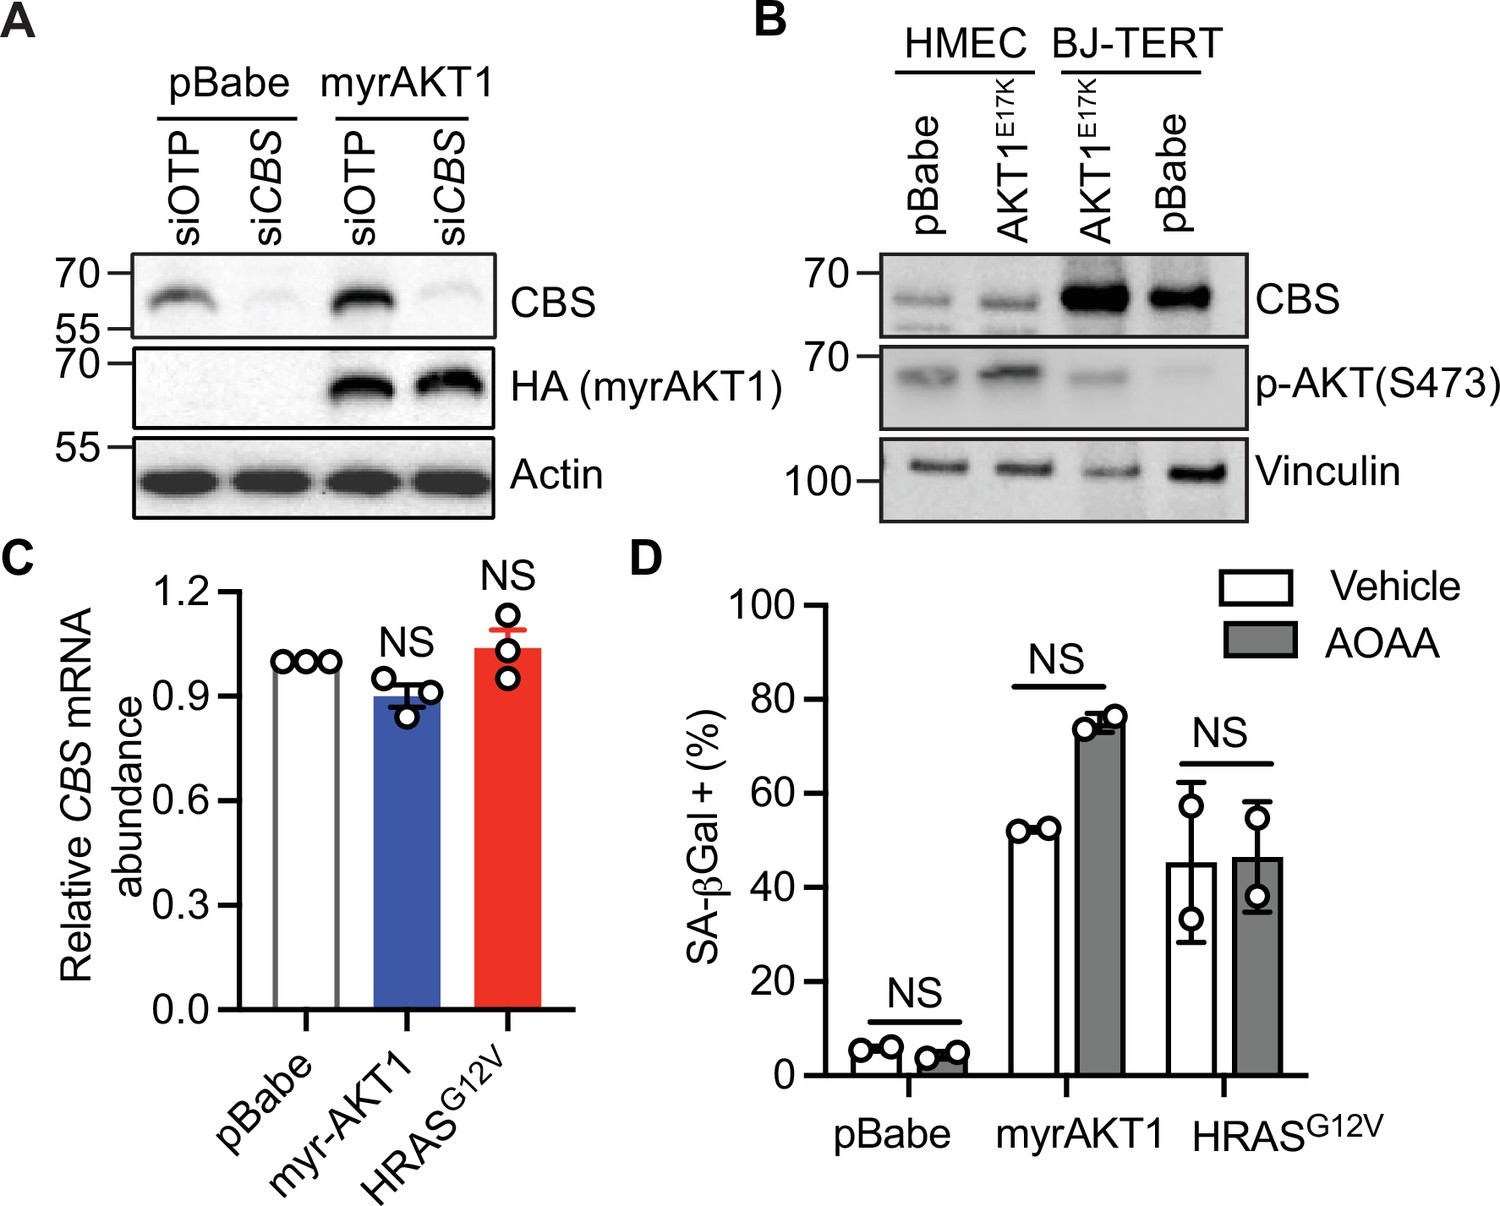
Cystathionine-β-synthase (CBS) expression and transsulfuration pathway activity are elevated in AKT-induced senescence.
(A) IMR-90 human fetal lung fibroblasts were transduced with pBabe or myrAKT1. On day 5 post-transduction, cells were transfected with either CBS siRNA (siCBS) or control siRNA (siOTP). Western blot analysis was performed on day 6 post-siRNA transfection. Actin was probed as a loading control. Representative of n=3 experiments. (B) BJ3 human skin fibroblasts expressing telomerase reverse transcriptase (BJ-TERT) human skin fibroblasts and human mammary epithelial cells (HMEC) were transduced with either pBabe or AKT1E17K. Western blot analysis was performed on day 14 post-transduction. Vinculin was probed as a loading control. (C) BJ-TERT cells were transduced with pBabe, myrAKT1, and HRASG12V. Relative CBS mRNA expression measured on day 14 post-transduction by qPCR was normalized to pBabe control are presented as mean ± SEM (n=3). One sample t-test compared to the hypothetical value 1.0 was performed (NS, not significant). (D) BJ-TERT cells were transduced with pBabe, myrAKT1, and HRASG12V and then treated with aminoxyacetate (AOAA) 30 μM or vehicle (DMSO) on day 5 post-transduction. The percentage of cells with positive staining for SA-βGal activity was quantified on day 6 post-treatment and presented as mean ± SD (n=2). Two-way analysis of variance (ANOVA) with Holm-Šídák multiple comparisons was performed (NS, not significant).
-
Figure 1—figure supplement 1—source data 1
Unedited immunoblots of Figure 1—figure supplement 1B.
Raw images were acquired using the ChemiDoc system (Bio-Rad).
- https://cdn.elifesciences.org/articles/71929/elife-71929-fig1-figsupp1-data1-v1.pdf
Figure 2 with 1 supplement
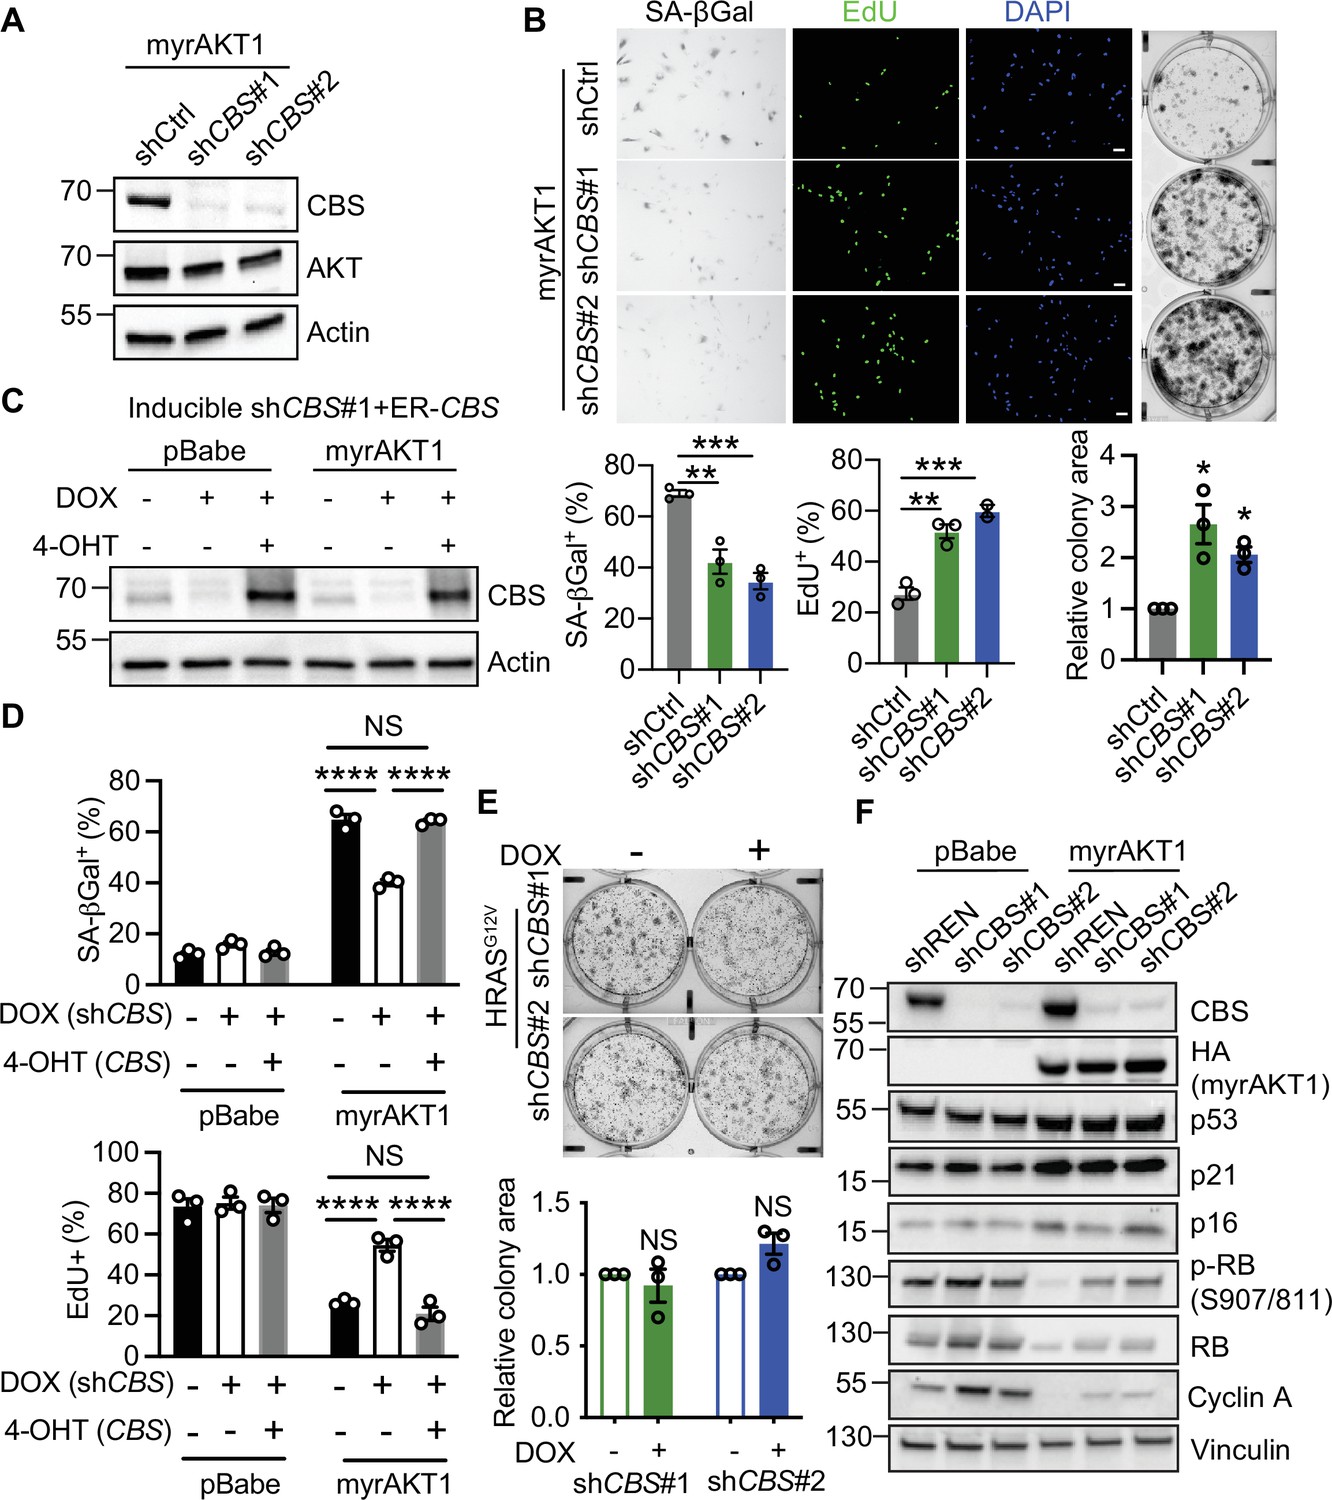
Depletion of cystathionine-β-synthase (CBS) promotes escape from AKT-induced senescence.
(A and B) BJ3 human skin fibroblasts expressing telomerase reverse transcriptase (BJ-TERT) cells expressing myrAKT1 were transduced with pGIPZ-shCBS or non-silencing small hairpin RNA (shRNA) control (shCtrl) on day 6 post-transduction of myrAKT1. (A) Western blot analysis was performed on day 8 post-transduction of shRNA. Representative of n=2 experiments. (B) Images and quantification of the percentage of cells with positive staining for SA-βGal activity and EdU incorporation on day 8 post-transduction of shRNA, as well as colony formation assay on day 14 post-transduction of shRNA. Data is presented as mean ± SEM (n=3). One-way analysis of variance (ANOVA) with Holm-Šídák’s multiple comparisons was performed (**p<0.01; ***p<0.001). Relative colony area normalized to shCtrl group is presented as mean ± SEM (n=3) and one sample t-test compared to the hypothetical value 1.0 was performed (C–D) BJ-TERT cells expressing doxycycline-inducible CBS shRNA#1 and 4-OHT-inducible CBS were transduced with pBabe or myrAKT1, treated with ±doxycycline (1 μg/ml)±4 OHT (20 nM) on day 5 post-transduction and analyzed on day 14 post-transduction. (C) Western blot analysis of CBS expression. Actin was probed as a loading control. (D) The percentage of cells with positive staining for SA-βGal activity or EdU proliferation marker incorporation is presented as mean ± SEM (n=3). Two-way ANOVA with Holm-Šídák’s multiple comparisons was performed (NS, not significant; ****p<0.0001). (E) BJ-TERT cells expressing doxycycline-inducible CBS shRNA were transduced with HRASG12V, treated with doxycycline (1 μg/ml) on day 5 post-transduction and colony formation assay analyzed on day 14 post-transduction. Relative colony area normalized to doxycycline-untreated group is presented as mean ± SEM (n=3) and one-sample t-test compared to the hypothetical value 1.0 was performed (NS, not significant). (F) BJ-TERT cells expressing doxycycline-inducible shCBS or control shREN were transduced with pBabe or myrAKT1 and then treated with doxycycline (1 μg/ml) on day 5 post-transduction. Western blot analysis was performed on day 14 post-transduction. Vinculin was probed as a loading control. Representative of n=2–4 experiments.
-
Figure 2—source data 1
Unedited immunoblots of Figure 2A.
Raw images were acquired using the ChemiDoc system (Bio-Rad).
- https://cdn.elifesciences.org/articles/71929/elife-71929-fig2-data1-v1.pdf
-
Figure 2—source data 2
Unedited immunoblots of Figure 2C.
Raw images were acquired using the ChemiDoc system (Bio-Rad).
- https://cdn.elifesciences.org/articles/71929/elife-71929-fig2-data2-v1.pdf
-
Figure 2—source data 3
Unedited immunoblots of Figure 2F.
Raw images were acquired using the ChemiDoc system (Bio-Rad).
- https://cdn.elifesciences.org/articles/71929/elife-71929-fig2-data3-v1.pdf
Figure 2—figure supplement 1
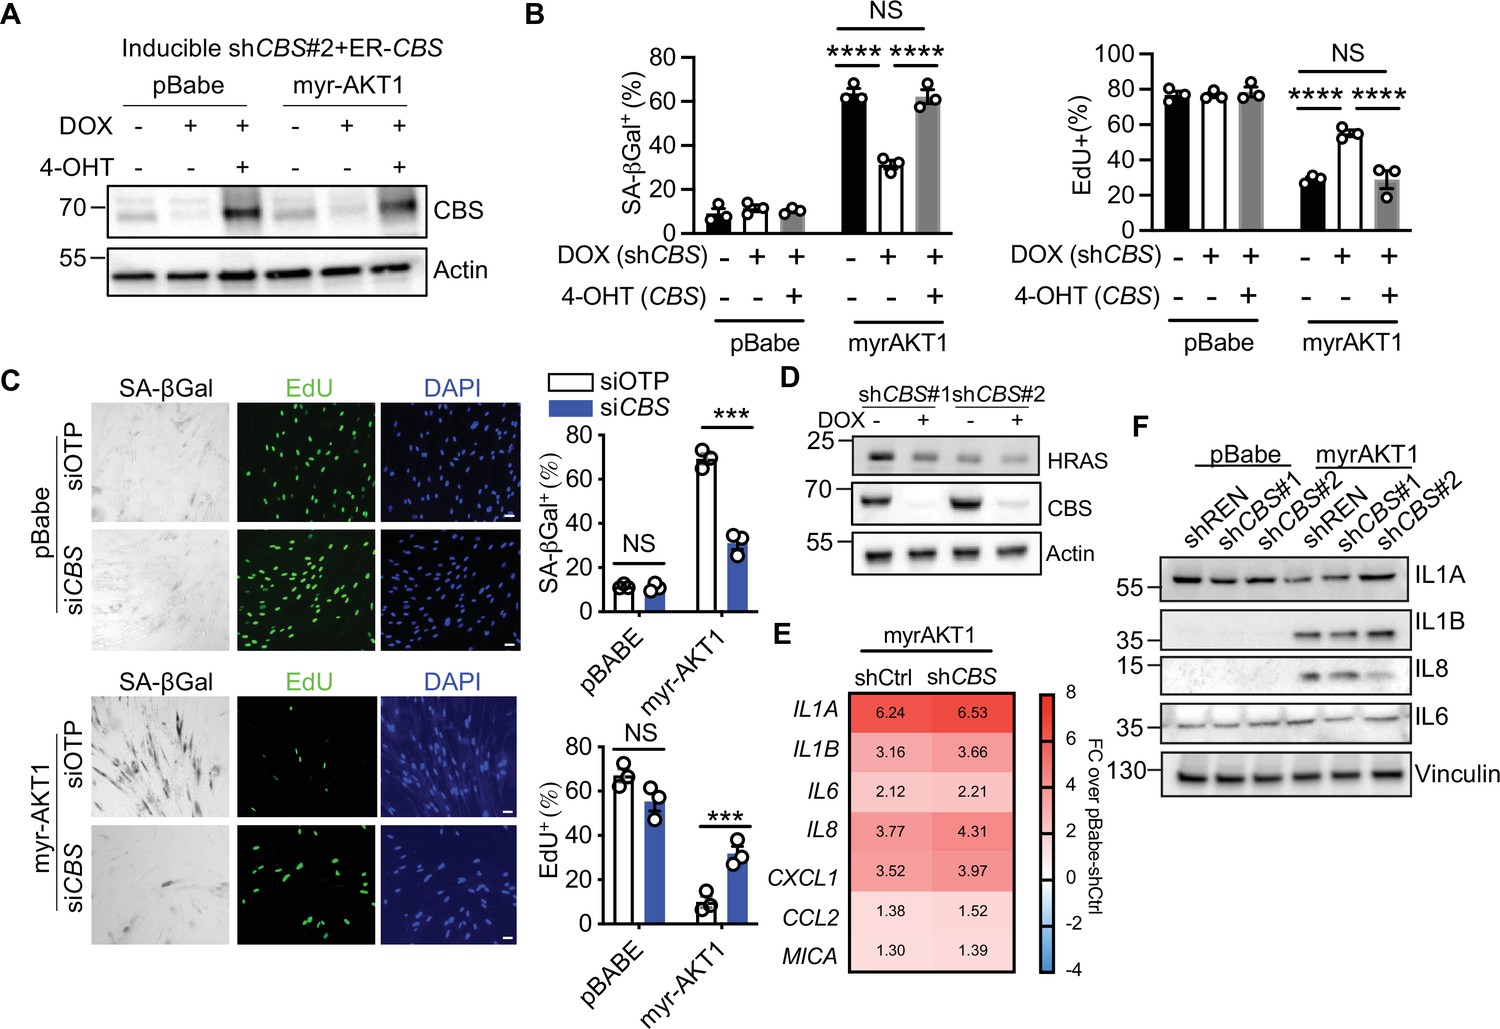
Depletion of cystathionine-β-synthase (CBS) promotes escape from AKT-induced senescence.
(A–B) BJ3 human skin fibroblasts expressing telomerase reverse transcriptase (BJ-TERT) cells expressing doxycycline-inducible CBS shRNA#2 and 4-OHT-inducible CBS were transduced with pBabe or myrAKT1, treated with ±doxycycline (1 μg/ml)±4 OHT (20 nM) on day 5 post-transduction. (A) Western blot analysis of CBS expression on day 14 post-transduction. Actin was probed as a loading control. (B) The percentage of cells with positive staining for SA-βGal activity or EdU proliferation marker incorporation is presented as mean ± SEM (n=3). Two-way analysis of variance (ANOVA) with Holm-Šídák’s multiple comparisons was performed (NS, not significant; ****p<0.0001). (C) IMR-90 human fetal lung fibroblasts were transduced with pBabe or myrAKT1. On day 5 post-transduction, cells were transfected with either CBS siRNA (siCBS) or control siRNA (siOTP). Images and quantification of percentage of cells with positive staining for SA-βGal activity and EdU were performed on day 6 post-siRNA transfection. Data is presented as mean ± SEM (n=3). Two-way ANOVA with Holm-Šídák multiple comparisons was performed (NS, not significant; ***p<0.001). (D) BJ-TERT cells expressing doxycycline-inducible CBS shRNA were transduced with HRASG12V, treated with doxycycline (1 μg/ml) on day 5 post-transduction. Western blot analysis on day 14 post-transduction. Actin was probed as a loading control. (E) BJ-TERT cells expressing myrAKT1 were transduced with pGIPZ-shCBS or non-silencing shRNA control (shCtrl) and the cells expressing pBabe transduced with the control vector (pBabe-shCtrl). The heatmap of mRNA expression levels of key senescence-associated secretory phenotype (SASP) factors measured on day 14 post-transduction by qPCR. The data were normalized with Nono control and presented as fold changes over pBabe-shCtrl cells. (F) BJ-TERT cells expressing doxycycline-inducible shCBS or control shREN were transduced with pBabe or myrAKT1, and then treated with doxycycline (1 μg/ml) on day 5 post-transduction. Western blot analysis was performed on day 14 post-transduction. Vinculin was probed as a loading control. Representative of n=2 experiments.
-
Figure 2—figure supplement 1—source data 1
Unedited immunoblots of Figure 2—figure supplement 1A (A) and 1D (B).
Raw images were acquired using the ChemiDoc system (Bio-Rad).
- https://cdn.elifesciences.org/articles/71929/elife-71929-fig2-figsupp1-data1-v1.pdf
-
Figure 2—figure supplement 1—source data 2
Unedited immunoblots of Figure 2—figure supplement 1E.
Raw images were acquired using the ChemiDoc system (Bio-Rad).
- https://cdn.elifesciences.org/articles/71929/elife-71929-fig2-figsupp1-data2-v1.pdf
Figure 3 with 1 supplement
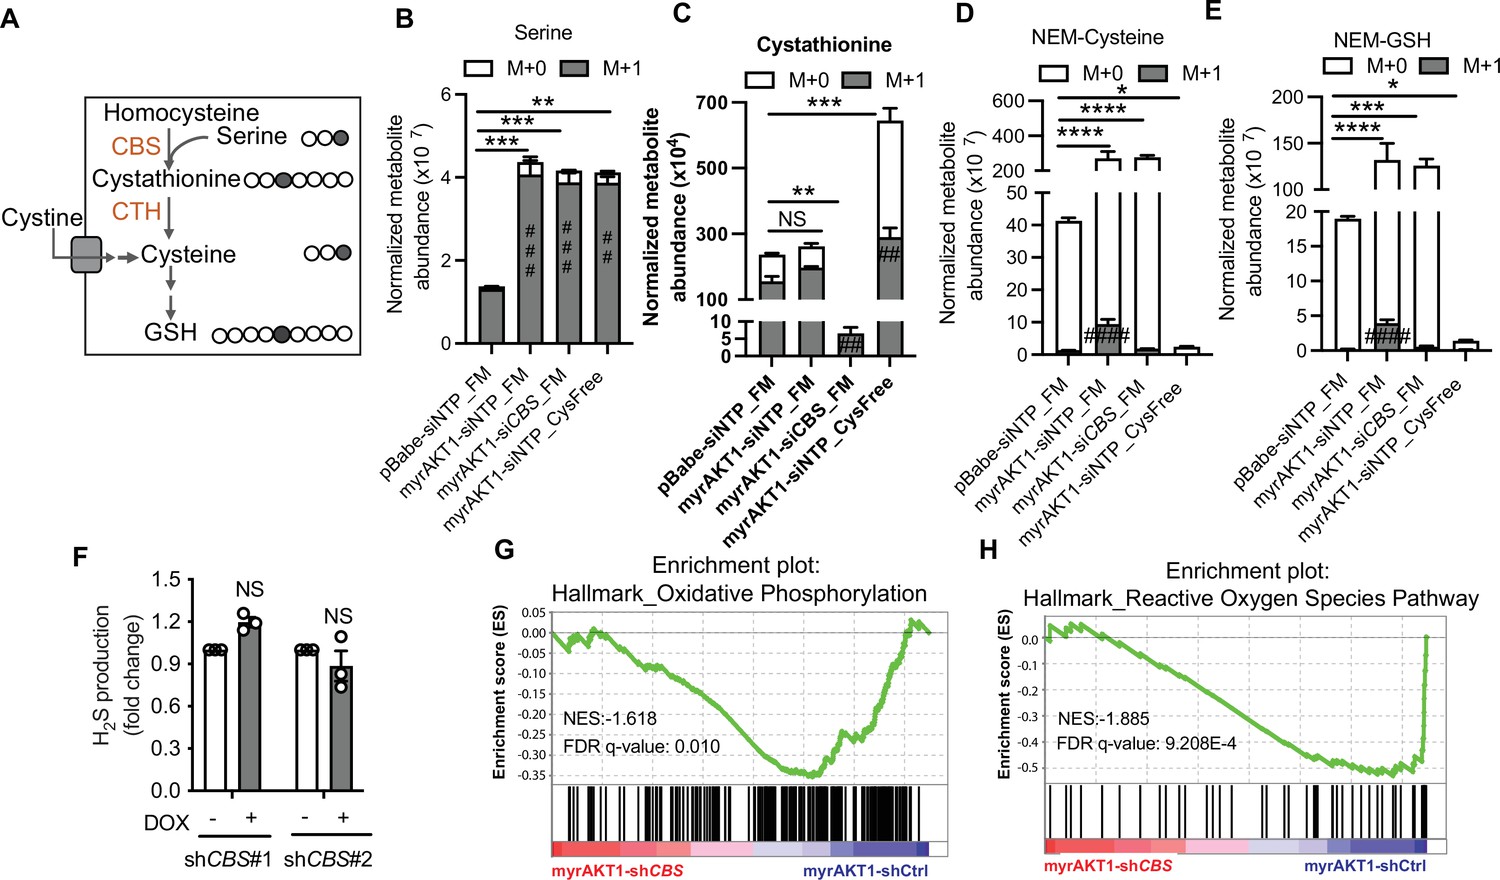
Depletion of cystathionine-β-synthase (CBS) in AKT-induced senescence (AIS) cells does not affect cysteine and glutathione (GSH) abundance in cysteine-replete conditions.
(A) Schematic of [3–13C] serine isotope tracing. Gray circles indicate 13C carbon atoms. Clear circles indicate unlabeled carbon atoms. (B–E) BJ3 human skin fibroblasts expressing telomerase reverse transcriptase (BJ-TERT) cells were transduced with pBabe or myrAKT1. After 6 days cells were transfected with either CBS siRNA (siCBS) or control siRNA (siOTP). On day 3 post-siRNA transfection, cells were cultured in either full medium (FM) or cysteine-deficient medium (Cys-Free) for 48 hr. Six hours before harvest, the culture medium was replaced with the basal isotope labeling medium containing 400 μM [3–13C] serine. The thiol redox metabolome was assessed by targeted liquid chromatography mass spectrometry (LC/MS). The abundances of labeled and unlabeled metabolites including (B) serine, (C) cystathionine, (D) NEM-Cys, and (E) NEM-GSH normalized with cell number are presented as mean ± SEM (n=4). Statistical significance was determined by one-way analysis of variance (ANOVA) with Holm-Šídák’s multiple comparisons (for the total metabolite levels, *p<0.05; **p<0.01; ***p<0.001; ****p<0.0001; and for the M+1 metabolite levels, ##p<0.01; ###p<0.001; ####p<0.0001 compared to pBabe-siNTP_FM cells). (F) BJ-TERT cells expressing doxycycline-inducible shCBS were transduced with myrAKT1, and treated with doxycycline (1 μg/ml) on day 5 post-transduction. Hydrogen sulfide (H2S) production was measured by AzMC on day 14 post-transduction. Fold changes over doxycycline-untreated group are presented as mean ± SEM (n=3). One sample t-test compared to the hypothetical value 1.0 was performed (NS, not significant). (G and H) Gene set enrichment analysis of RNA-seq data showing downregulation of hallmark of oxidative phosphorylation and reactive oxygen species pathways in myrAKT1-shCBS cells compared with myrAKT1-shCtrl cells.
Figure 3—figure supplement 1
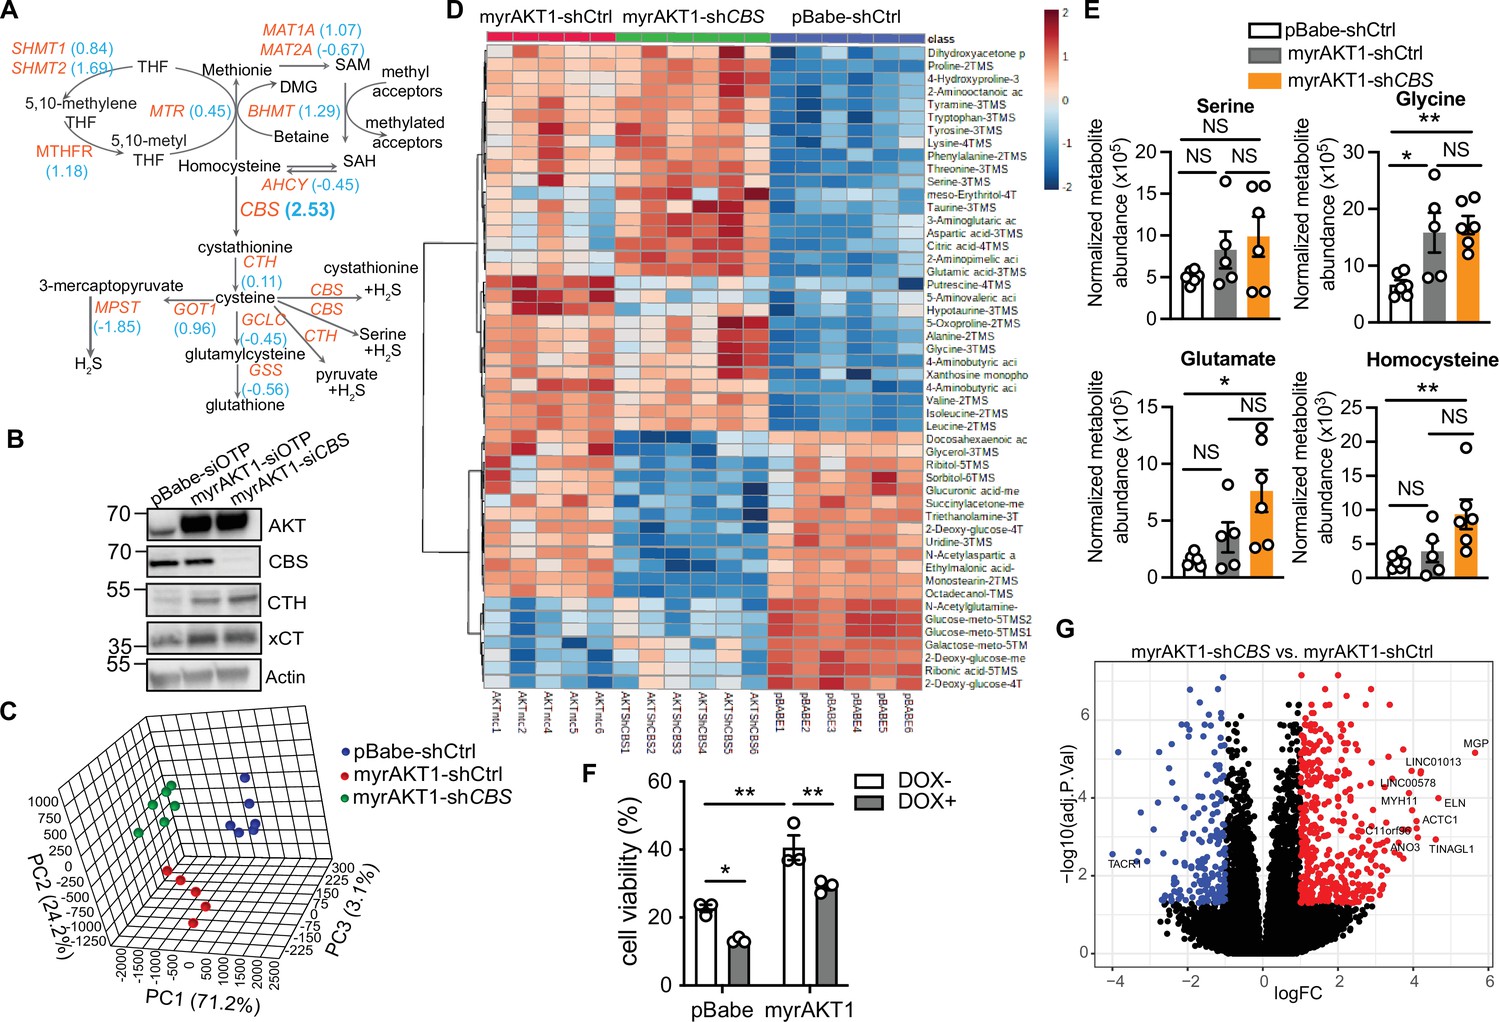
Depletion of cystathionine-β-synthase (CBS) in AKT-induced senescence (AIS) cells does not affect cysteine and glutathione (GSH) abundance in cysteine-replete conditions.
(A) The effects of siRNA knockdown of genes involved in the transsulfuration and transmethylation pathways on the cell number of AIS cells with Z score in blue, as measured by the functional genomic siRNA screen for AIS escape. (B) BJ3 human skin fibroblasts expressing telomerase reverse transcriptase (BJ-TERT) cells were transduced with pBabe or myrAKT1. After 4 days cells were transfected with either CBS siRNA (siCBS) or control siRNA (siOTP). Western blot analysis on day 6 post-siRNA transfection. Actin was probed as a loading control. (C) BJ-TERT cells were transduced with pBabe or myrAKT1 followed by transduction with pGIPZ-shCBS (myrAKT1-shCBS) or control vector (pBABE-shCtrl, myrAKT1-shCtrl) on day 6 post-transduction. Metabolic profiling by gas chromatography mass spectrometry (GC/MS) was performed on day 14 post-transduction. n=6 in both pBabe-shCtrl and myrAKT1-shCBS groups and n=5 in myrAKT1-shCtrl group, with one sample excluded due to a technical issue during the sample processing. Principal component analysis (PCA) plot, x-, y-, and z-axis represent individual principal components. (D) Heatmap of the top 50 metabolites analyzed by MetaboAnalyst 4.0. (E) The abundance of serine, glycine, glutamine, and homocysteine measured by GC-MS. Metabolite abundance normalized with cell number is presented as mean ± SEM (N=6 in both pBabe-shCtrl and myrAKT1-shCBS groups and n=5 in myrAKT1-shCtrl group). One-way analysis of variance (ANOVA) with Holm-Šídák’s multiple comparisons was performed (NS, not significant; *p<0.05; **p<0.01). (F) BJ-TERT cells expressing doxycycline-inducible shCBS were treated with erastin 5 µM for 3 days. Cell viability was calculated using the cell number measured by IncuCyte relative to the untreated control group and is expressed as mean ± SEM (N=3). Two-way ANOVA with Holm-Šídák multiple comparisons was performed (*p<0.05; **p<0.01). (I) RNA-seq was performed on day 14 post-transduction. Volcano plot showing differentially expressed genes (FC ≤ –2 or FC ≥ 2, FDR ≤ 0.05) between cells expressing myrAKT1-shCBS vs. myrAKT1-shCtrl cells, which are downregulated (blue), upregulated (red), or not significant (black) (n=3 biological replicates). The top 10 significantly upregulated and downregulated genes are indicated.
Figure 4 with 1 supplement
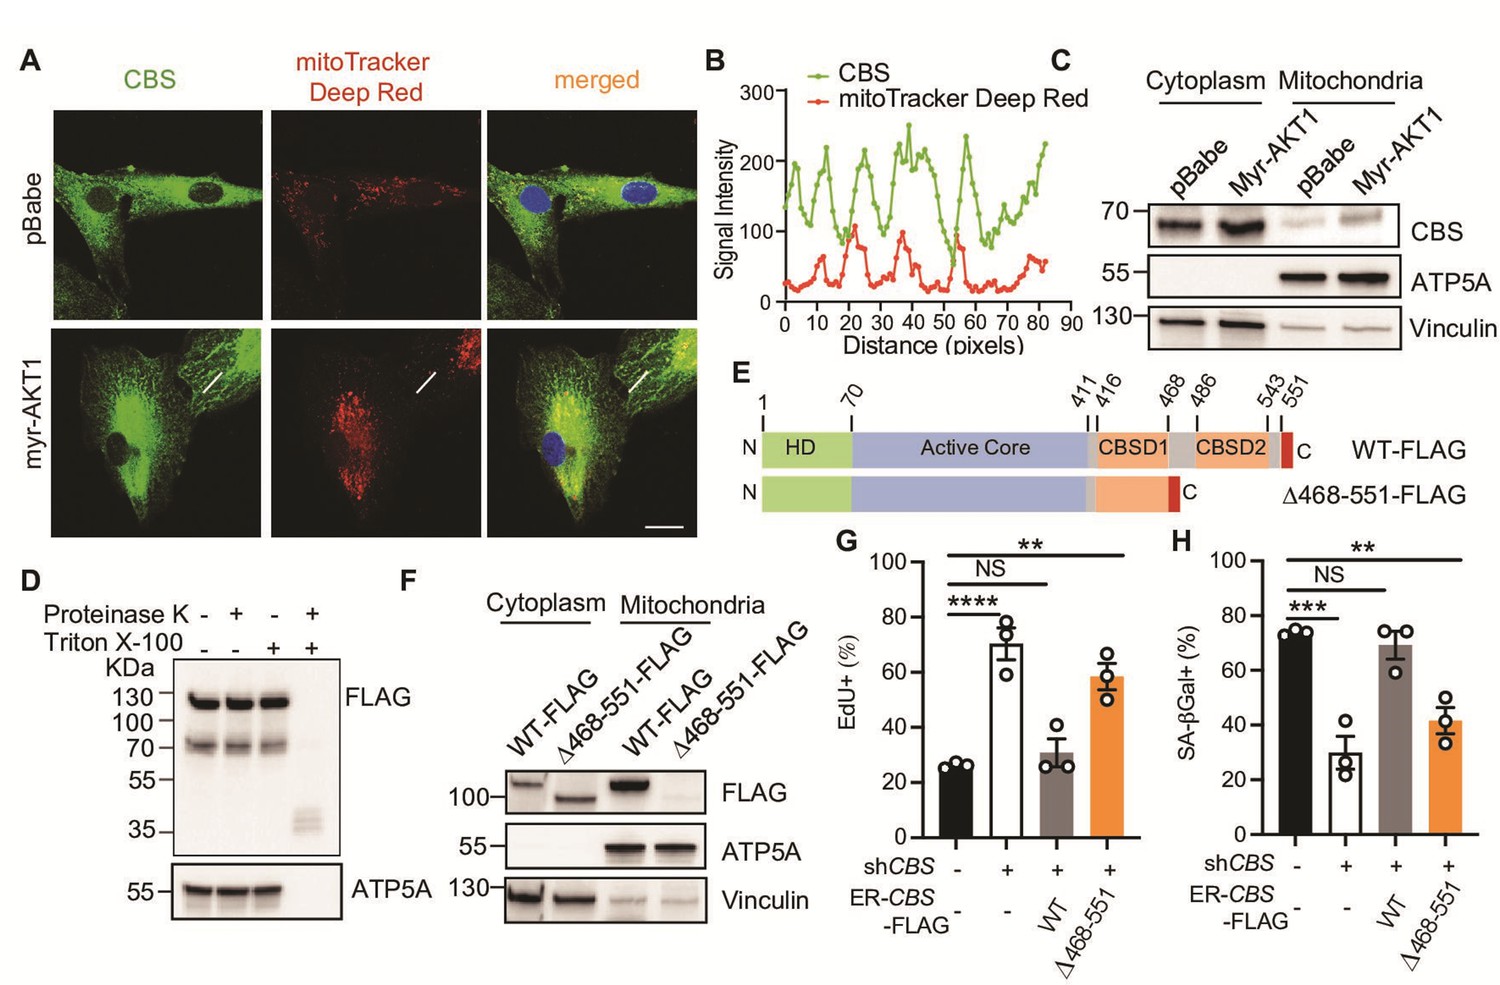
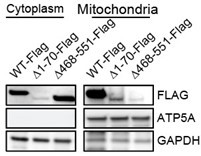
Cystathionine-β-synthase (CBS) mitochondrial localization is required for AKT-induced senescence (AIS) maintenance.
(A–B) BJ3 human skin fibroblasts expressing telomerase reverse transcriptase (BJ-TERT) cells were transduced with pBabe or myrAKT1. Immunofluorescent staining showing CBS (green) and mitochondria (red) on day 10 post-transduction. The representative images are from one of two independent experiments. Scale bar = 20 μm. (B) Quantification of signal intensities using ImageJ by applying a single ROI to two color channels in the same image and extracting the plot profile. (C) Western blot analysis of CBS expression in the cytoplasmic and mitochondrial fractions isolated from BJ-TERT cells transduced with pBabe or myrAKT1. ATP5A and vinculin serve as the markers of mitochondria and cytoplasm, respectively. (D) Western blot analysis of a protease protection assay using the mitochondrial fraction isolated from BJ-TERT cells expressing C-terminal FLAG-tagged CBS. ATP5A serves as a positive control. (E) Schematic of 4-OHT-inducible plasmids expressing FLAG-tagged wild type CBS (WT) or a C-terminal regulatory domain CBSD2 truncated CBS mutant. (F) Western blot analysis of CBS expression in the cytoplasmic and mitochondrial fractions isolated from BJ-TERT cells transduced with FLAG-tagged wild type (WT) or a truncated mutant CBS after 20 nM 4-OHT induction for 3 days. ATP5A and vinculin serve as the markers of mitochondria and cytoplasm, respectively. (C), (D), and (F) are representative of at least n=3 experiments. (G–H) BJ-TERT cells expressing doxycycline-inducible CBS shRNA#2 and 4-OHT-inducible CBS wide type or a truncated mutant were transduced with myr-AKT1, treated with doxycycline (1 μg/ml)±4 OHT (20 nM) on day 5 post-transduction and analyzed on day 12 post-transduction. The percentage of cells with positive staining for (G) EdU proliferation marker incorporation or (H) SA-βGal activity is expressed as mean ± SEM (n=3). One-way analysis of variance (ANOVA) with Holm-Šídák’s multiple comparisons was performed (NS, not significant; **p<0.01; ***p<0.001; ****p<0.0001).
-
Figure 4—source data 1
Unedited immunoblots of Figure 4C.
Raw images were acquired using the ChemiDoc system (Bio-Rad).
- https://cdn.elifesciences.org/articles/71929/elife-71929-fig4-data1-v1.pdf
-
Figure 4—source data 2
Unedited immunoblots of Figure 4D.
Raw images were acquired using the ChemiDoc system (Bio-Rad).
- https://cdn.elifesciences.org/articles/71929/elife-71929-fig4-data2-v1.pdf
-
Figure 4—source data 3
Unedited immunoblots of Figure 4F.
Raw images were acquired using the ChemiDoc system (Bio-Rad).
- https://cdn.elifesciences.org/articles/71929/elife-71929-fig4-data3-v1.pdf
Figure 4—figure supplement 1
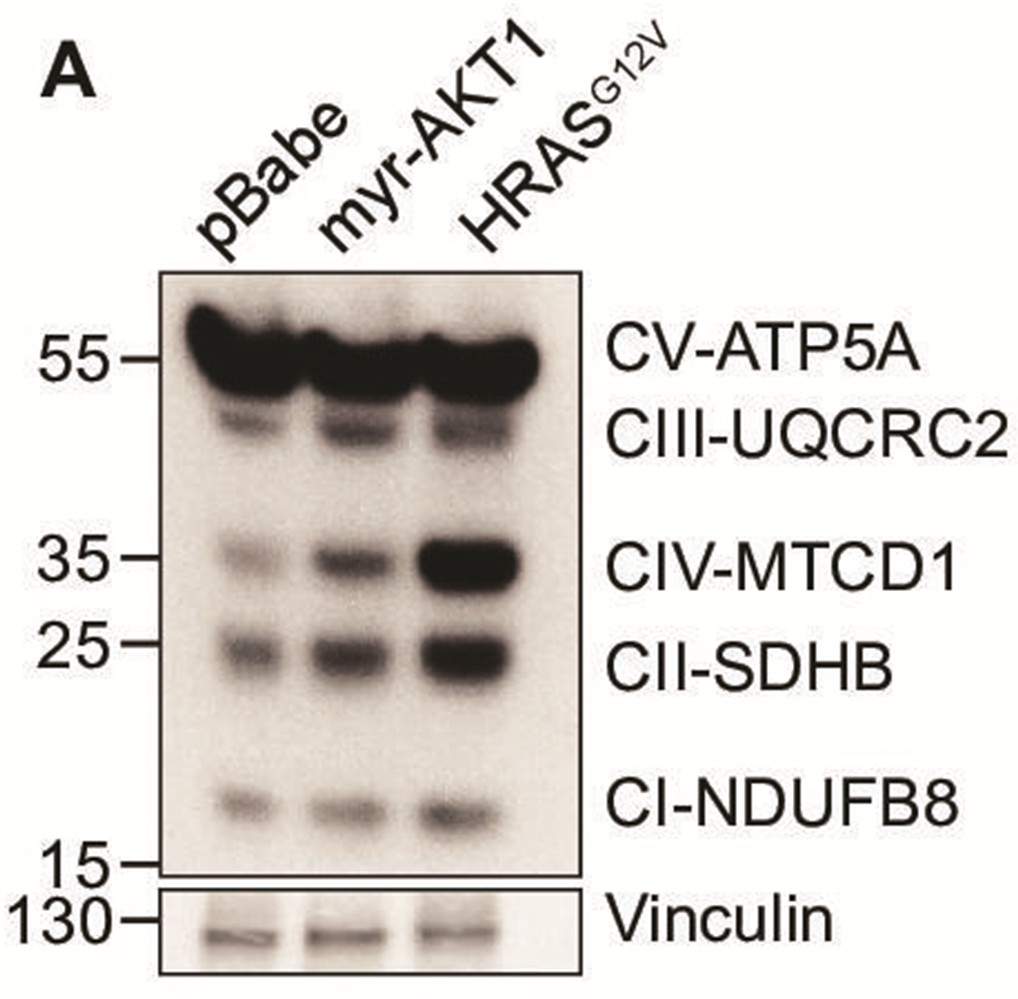
AKT-induced senescent cells showed increased expression of proteins involved in the mitochondrial electron transport chain.
(A) BJ3 human skin fibroblasts expressing telomerase reverse transcriptase (BJ-TERT) cells were transduced with pBabe, myrAKT1, or HRASG12V. Western blot analysis was performed on day 10 post-transduction. Vinculin was probed as a loading control.
-
Figure 4—figure supplement 1—source data 1
Unedited immunoblots of Figure 4—figure supplement 1A.
Raw images were acquired using the ChemiDoc system (Bio-Rad).
- https://cdn.elifesciences.org/articles/71929/elife-71929-fig4-figsupp1-data1-v1.pdf
Figure 5 with 1 supplement

Cystathionine-β-synthase (CBS) deficiency alleviates oxidative stress in AKT-induced senescence (AIS) cells.
(A–C) BJ3 human skin fibroblasts expressing telomerase reverse transcriptase (BJ-TERT) cells were transduced with either pBabe, myrAKT1, or HRASG12V. After 5 days cells were transfected with either CBS siRNA (siCBS) or control siRNA (siOTP) and analyzed on day 6 post-siRNA transfection. (A) Oxygen consumption rate (OCR) was determined using the Seahorse XF96 mitochondrial stress test by sequential injection of oligomycin (1 μM), p-trifluoromethoxy- phenylhydrazone (FCCP) (1 μM), and rotenone/antimycin (0.5 μM each). (B) Basal respiration rate and (C) ATP production rate determined by the mitochondrial stress test are presented as mean ± SEM of four replicates from one of two independent experiments. Two-way analysis of variance (ANOVA) with Holm-Šídák’s multiple comparisons was performed (*p<0.05; ***p<0.001; ****p<0.0001). (D–F) BJ-TERT cells expressing doxycycline-inducible CBS shRNA#2 and 4-OHT-inducible CBS wide type or a truncated mutant were transduced with myrAKT1, treated with ±doxycycline (1 μg/ml)±4 OHT (20 nM) on day 5 post-transduction and analyzed on day 12 post-transduction. (D) OCR, (E) basal respiration rate, and (F) ATP production rate determined by the Seahorse XF96 mitochondrial stress test were presented as mean ± SEM (n=7–9 from one of two independent experiments). One-way ANOVA with Holm-Šídák’s multiple comparisons was performed (NS, not significant; *p<0.05; **p<0.01; ***p<0.001; ****p<0.0001). (G) On day 5 post-transduction, cells were treated with Trolox 100 μM. Cell confluency measured by IncuCyte was presented as mean ± SEM (n=3). Statistical significance at the last time point was determined by unpaired student’s t-test (**p<0.01; ***p<0.001). (H and I) Flow cytometric analysis of (H) the mitochondrial superoxide production by MitoSOX and (I) the cytoplasmic reactive oxygen species (ROS) production by H2DCFDH-DA on day 6 post-siRNA transfection. Relative mean fluorescence intensity normalized to the pBabe-siOTP is presented as mean ± SEM (n=3). Statistical significance was determined by one sample t-test compared to the hypothetical value 1.0 (NS, not significant; *p<0.05; **p<0.01) and one-way ANOVA with Holm-Šídák’s multiple comparisons (#p<0.05). (J) Schematic diagram illustrating CBS-mediated metabolic alterations on maintenance of AKT-induced senescence.
Figure 5—figure supplement 1

Cystathionine-β-synthase (CBS) deficiency alleviates oxidative stress in AKT-induced senescence (AIS) cells.
(A) BJ3 human skin fibroblasts expressing telomerase reverse transcriptase (BJ-TERT) cells expressing doxycycline-inducible CBS shRNA#2 and 4-OHT-inducible FLAG-tagged wild type or a truncated mutant CBS were transduced with myrAKT1 and then treated with doxycycline (1 μg/ml)±4 OHT (20 nM) on day 5 post-transduction. Western blot analysis was performed on day 12 post-transduction. (B) BJ-TERT cells were treated with Trolox 100 μM or vehicle on day 5 post-transduction of pBabe or myrAKT1. Percentage of cells with positive staining for SA-βGal activity was quantified after treatment for 6 days and presented as mean ± SD (n=2). Two-way analysis of variance (ANOVA) with Holm-Šídák’s multiple comparisons was performed (NS, not significant; ****p<0.0001). (C) BJ-TERT cells were transduced with either pBabe or myrAKT1. After 5 days cells were then transfected with either CBS siRNA (siCBS) or control siRNA (siOTP). Flow cytometric analysis of mitochondrial superoxide production by MitoSOX and cytoplasmic reactive oxygen species (ROS) production by H2DCFDH-DA on day 6 post-siRNA transfection.
-
Figure 5—figure supplement 1—source data 1
Unedited immunoblots of Figure 5—figure supplement 1A.
Raw images were acquired using the ChemiDoc system (Bio-Rad).
- https://cdn.elifesciences.org/articles/71929/elife-71929-fig5-figsupp1-data1-v1.pdf
Figure 6 with 1 supplement
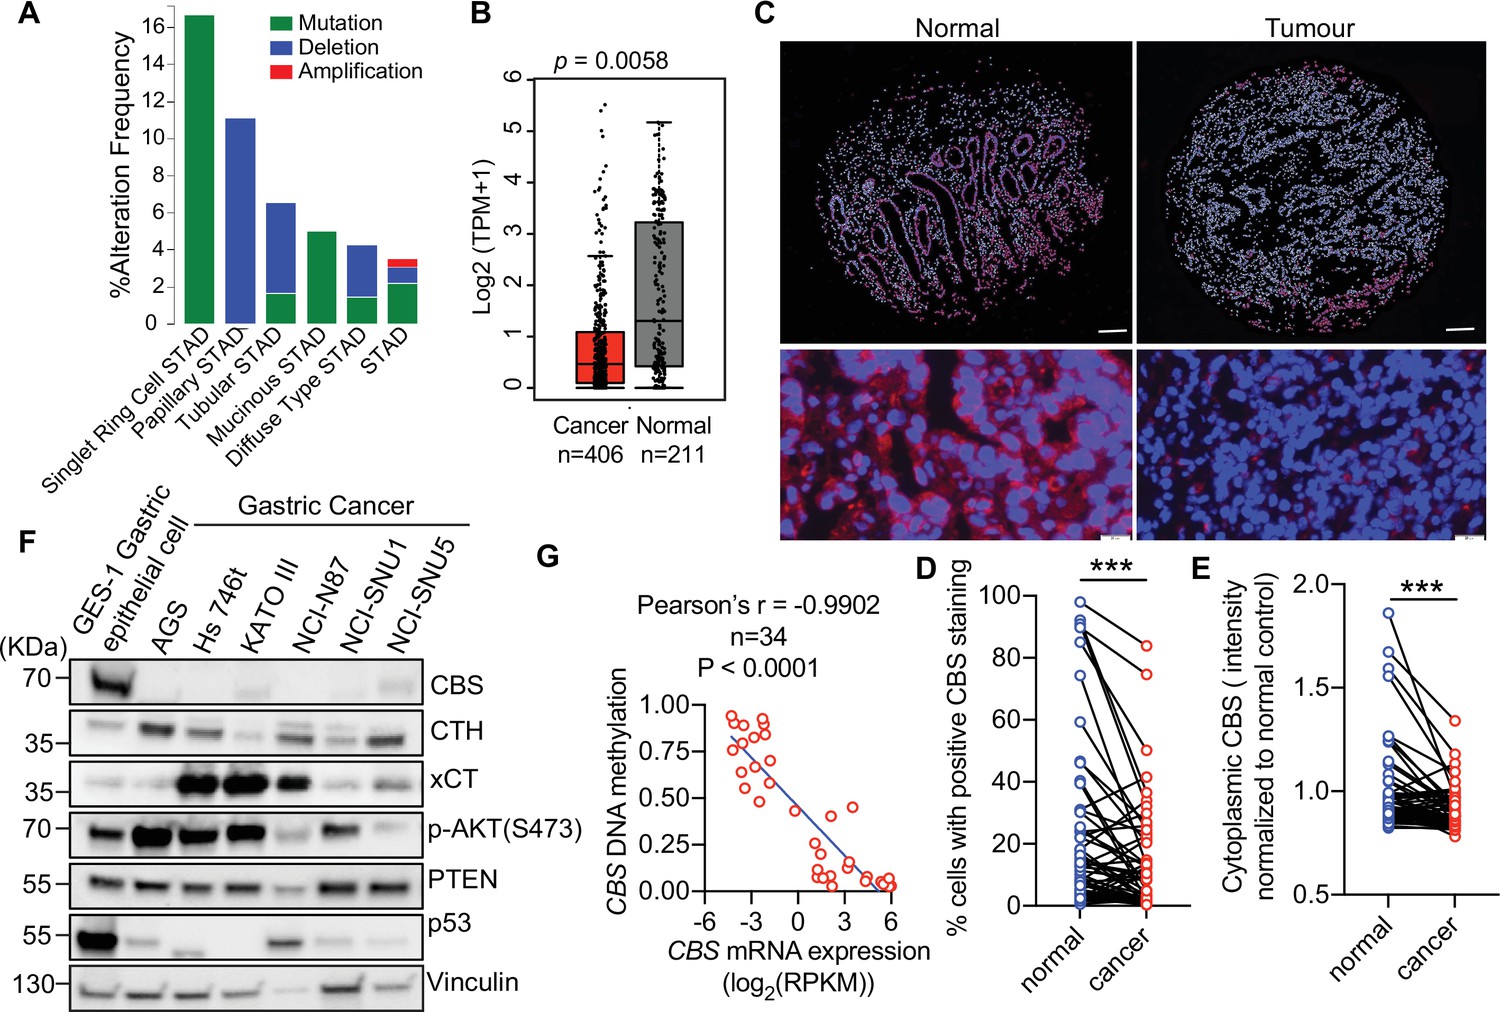
Cystathionine-β-synthase (CBS) expression is suppressed in tumor tissues and human cell lines of gastric cancer.
(A) Analysis of genetic alterations of CBS in different subtypes of gastric cancer using cBioPortal (http://www.cbioportal.org). (B) Median mRNA expression level of CBS in normal stomach tissues and stomach adenocarcinoma tissues profiled by Gene Expression Profiling Interactive Analysis (GEPIA, http://gepia.cancer-pku.cn) based on the TCGA database. p=0.0058 by unpaired Student’s t-test. (C–E) Gastric cancer patient tissue microarray was assessed by immunofluorescent staining of CBS (red) and counterstained for the nucleus (DAPI, blue). (C) The representative images of normal or cancer tissues from one gastric cancer patient were shown. Top panel: Scale bars = 200 μm. Bottom panel: Scale bars = 50 μm. (D) The percentage of cytosolic CBS-positive cells and (E) the intensity of cytoplasmic CBS in the tumor or adjacent normal tissues from 62 patients were shown. Statistical significance was determined by paired Student’s t-test (***p<0.001). (F) Western blot analysis in GES-1 gastric epithelial cell line and six gastric cancer cell lines. Vinculin was probed as a loading control. Representative of at least n=3 experiments. (G) Correlation of CBS mRNA expression with CBS DNA methylation in 34 gastric cancer cell lines based on the data retrieved from the Cancer Cell Line Encyclopedia.
-
Figure 6—source data 1
Unedited immunoblots of Figure 6F.
Raw images were acquired using the ChemiDoc system (Bio-Rad).
- https://cdn.elifesciences.org/articles/71929/elife-71929-fig6-data1-v1.pdf
Figure 6—figure supplement 1
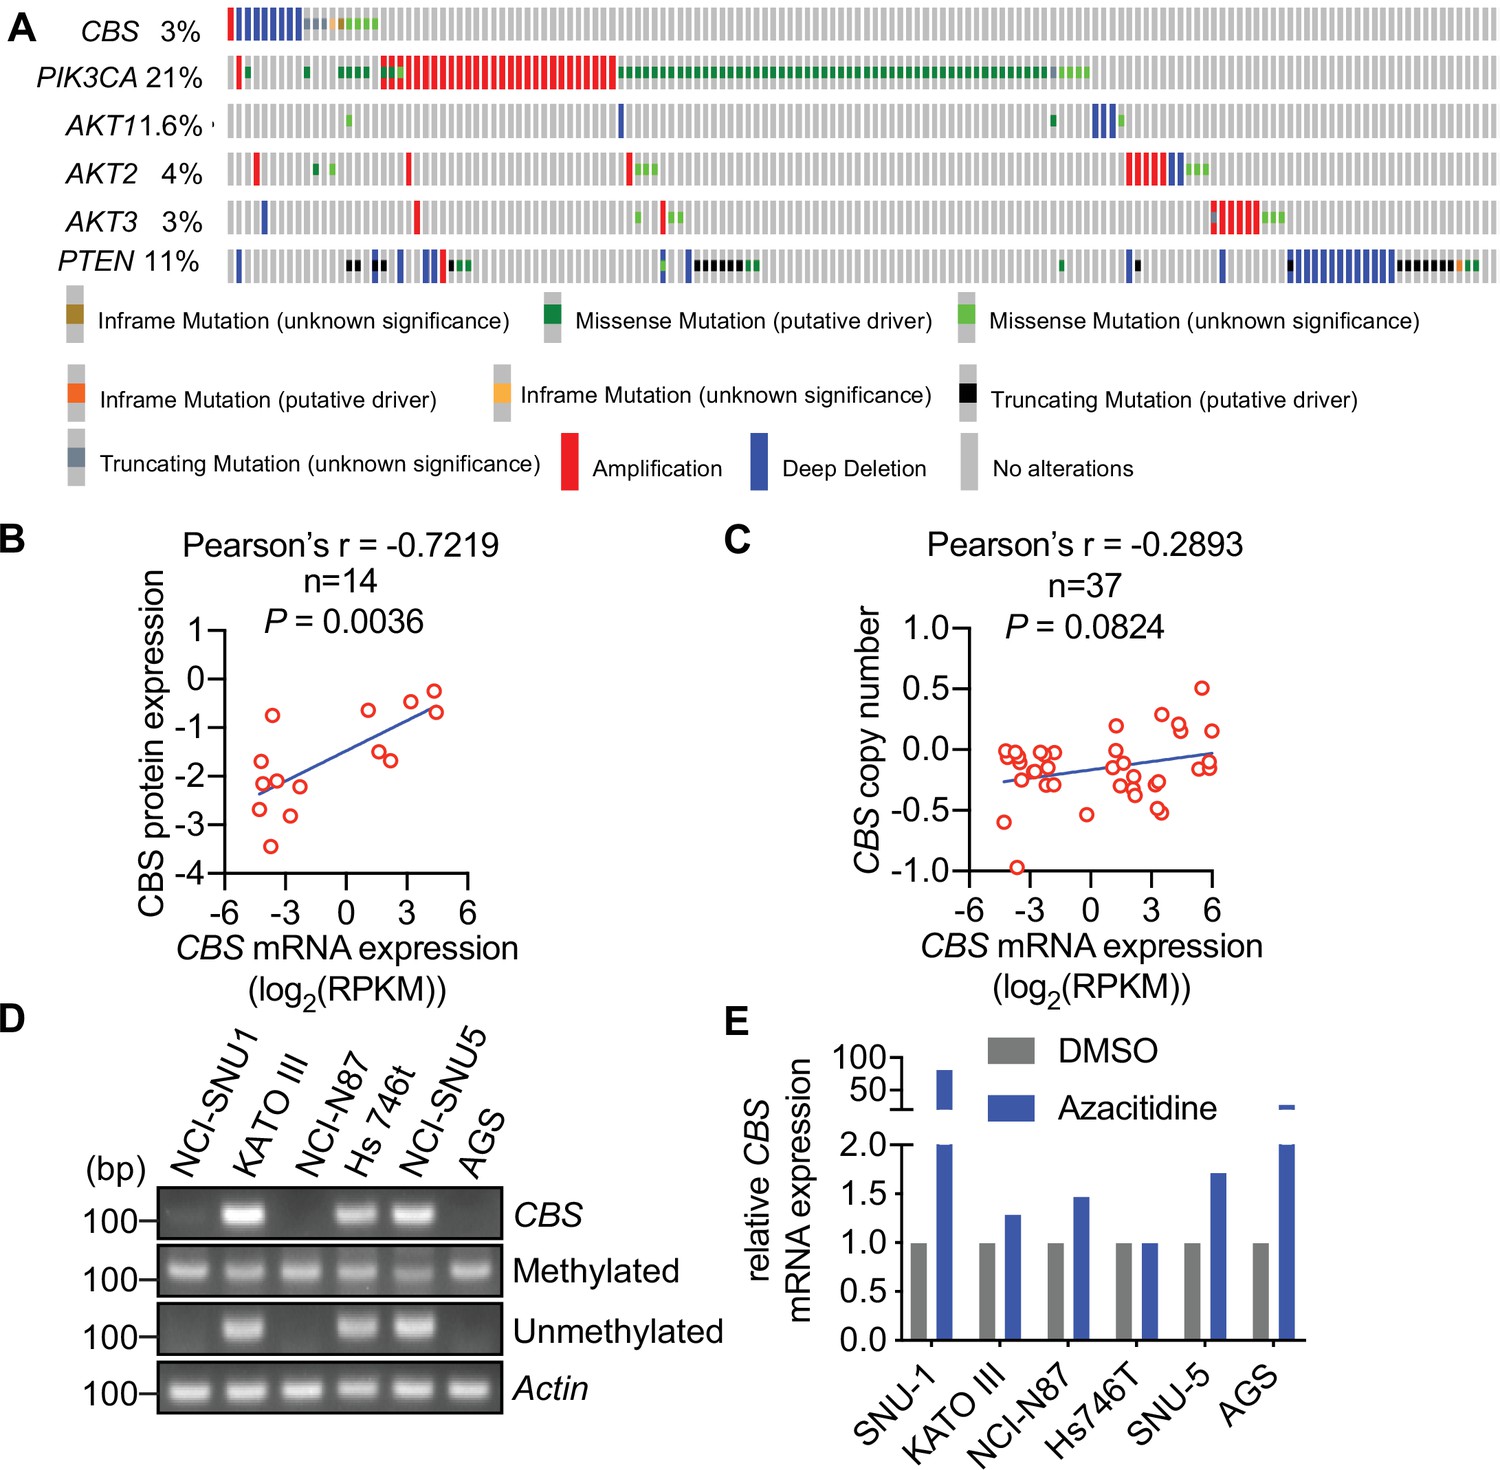
Cystathionine-β-synthase (CBS) expression is suppressed in tumor tissues and human cell lines of gastric cancer.
(A) CBS, PIK3CA, AKT1, AKT2, AKT3, and PTEN gene expression in 441 gastric cancer patient samples from TCGA, Firehose Legacy study using cBioPortal (http://www.cbioportal.org). (B) Correlation of CBS mRNA expression with CBS protein expression in 14 gastric cancer cell lines. (C) Correlation of CBS mRNA expression with CBS copy number in 37 gastric cancer cell lines based on the data retrieved from the Cancer Cell Line Encyclopaedia. (D) Methylation in the CBS promoter region of six gastric cancer cell lines was examined by methylation-specific PCR and visualized after agarose gel electrophoresis. Actin was used as a loading control. (E) Gastric cancer cells were treated with 2 μM azacitidine for 48 hr. CBS mRNA expression levels were analyzed by qRT-PCR from three biological replicates in one experiment. The data presents the fold changes relative to the untreated controls.
-
Figure 6—figure supplement 1—source data 1
Unedited gel image of Figure 6—figure supplement 1D.
Raw images were acquired using the ChemiDoc system (Bio-Rad).
- https://cdn.elifesciences.org/articles/71929/elife-71929-fig6-figsupp1-data1-v1.pdf
Figure 7 with 1 supplement
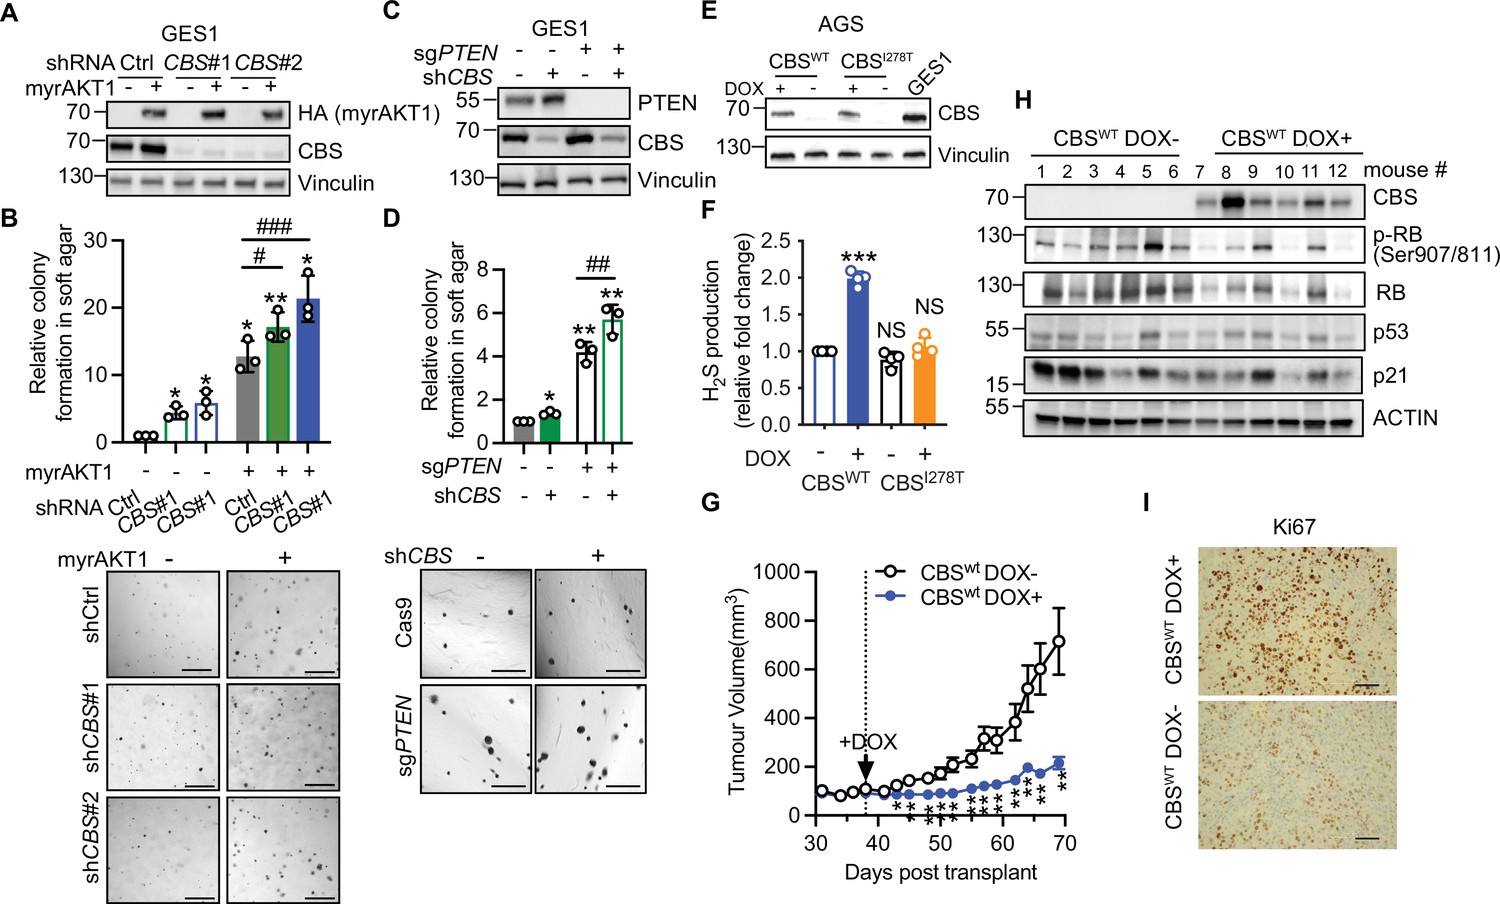
Loss of cystathionine-β-synthase (CBS) synergizes with PI3K/AKT pathway to promote gastric cancer pathogenesis.
(A–B) GES-1 gastric epithelial cells were stably transfected with doxycycline-inducible myrAKT1 and pGIPZ-shCBS or non-silencing small hairpin RNA (shRNA) control (shCtrl). (A) Western blot analysis showing HA-tagged myrAKT1 and CBS after doxycycline (0.75 μg/ml) induction for 3 days. Vinculin was probed as a loading control. (B) Relative colony formation assessed by soft agar colony formation assay on day 21 post-doxycycline induction was normalized to doxycycline-untreated shCtrl group and presented as mean ± SEM (n=3). The representative images of colonies formed in the soft agar. Scale bar = 500 μm. (C–D) GES-1 cells with PTEN knockout by CRISPR or Cas9 control were transduced with doxycycline-inducible CBS shRNA#1. (C) Western blotting after treatment with doxycycline (0.75 μg/ml) for 3 days. Vinculin was probed as a loading control. (D) Relative colony formation assessed by soft agar colony formation assay on day 21 post-doxycycline induction was normalized to doxycycline-untreated shCtrl group and presented as mean ± SEM (n=3). The representative images of colonies formed in the soft agar. Scale bar = 500 μm. (E–F) AGS gastric cancer cells were stably transfected with doxycycline-inducible CBSwt or CBSI278T. Cells were cultured in the presence or absence of doxycycline induction (0.08 μg/ml for CBSwt or 1 μg/ml for CBSI278T). (E) Western blot analysis on day 3 post-treatment. Vinculin was probed as a loading control. (F) Fold changes of hydrogen sulfide (H2S) production over doxycycline-untreated CBSwt group were presented as mean ± SEM (n=4). Statistical significance in (A, C, and F) was determined by one-sample t-test compared to the hypothetical value 1.0 (NS, not significant; *p<0.05; **p<0.01; ***p<0.001) and two-way analysis of variance (ANOVA) with Holm-Šídák’s multiple comparisons (#p<0.05; ##p<0.01; ###p<0.001). (G–I) AGS gastric cancer cells expressing doxycycline-inducible CBSwt were subcutaneously implanted in BALB/c nude mice. On day 38 post-implantation, mice were supplied with water containing 0.2% (W/V) doxycycline and 600 mg doxycycline/kg food. (G) Tumor volume was presented as mean ± SEM (n=6 mice per group). Statistical significance at each time point was determined by unpaired Student’s test (*p<0.05; **p<0.01). (H) Western blot analysis of CBS and senescence-associated protein expression in tumor tissues. Actin was probed as a loading control. (I) IHC of Ki67 on the tumor tissue. Scale bar: 50 μm.
-
Figure 7—source data 1
Unedited immunoblots of Figure 7A.
Raw images were acquired using the ChemiDoc system (Bio-Rad).
- https://cdn.elifesciences.org/articles/71929/elife-71929-fig7-data1-v1.pdf
-
Figure 7—source data 2
Unedited immunoblots of Figure 7C.
Raw images were acquired using the ChemiDoc system (Bio-Rad).
- https://cdn.elifesciences.org/articles/71929/elife-71929-fig7-data2-v1.pdf
-
Figure 7—source data 3
Unedited immunoblots of Figure 7E.
Raw images were acquired using the ChemiDoc system (Bio-Rad).
- https://cdn.elifesciences.org/articles/71929/elife-71929-fig7-data3-v1.pdf
Figure 7—figure supplement 1
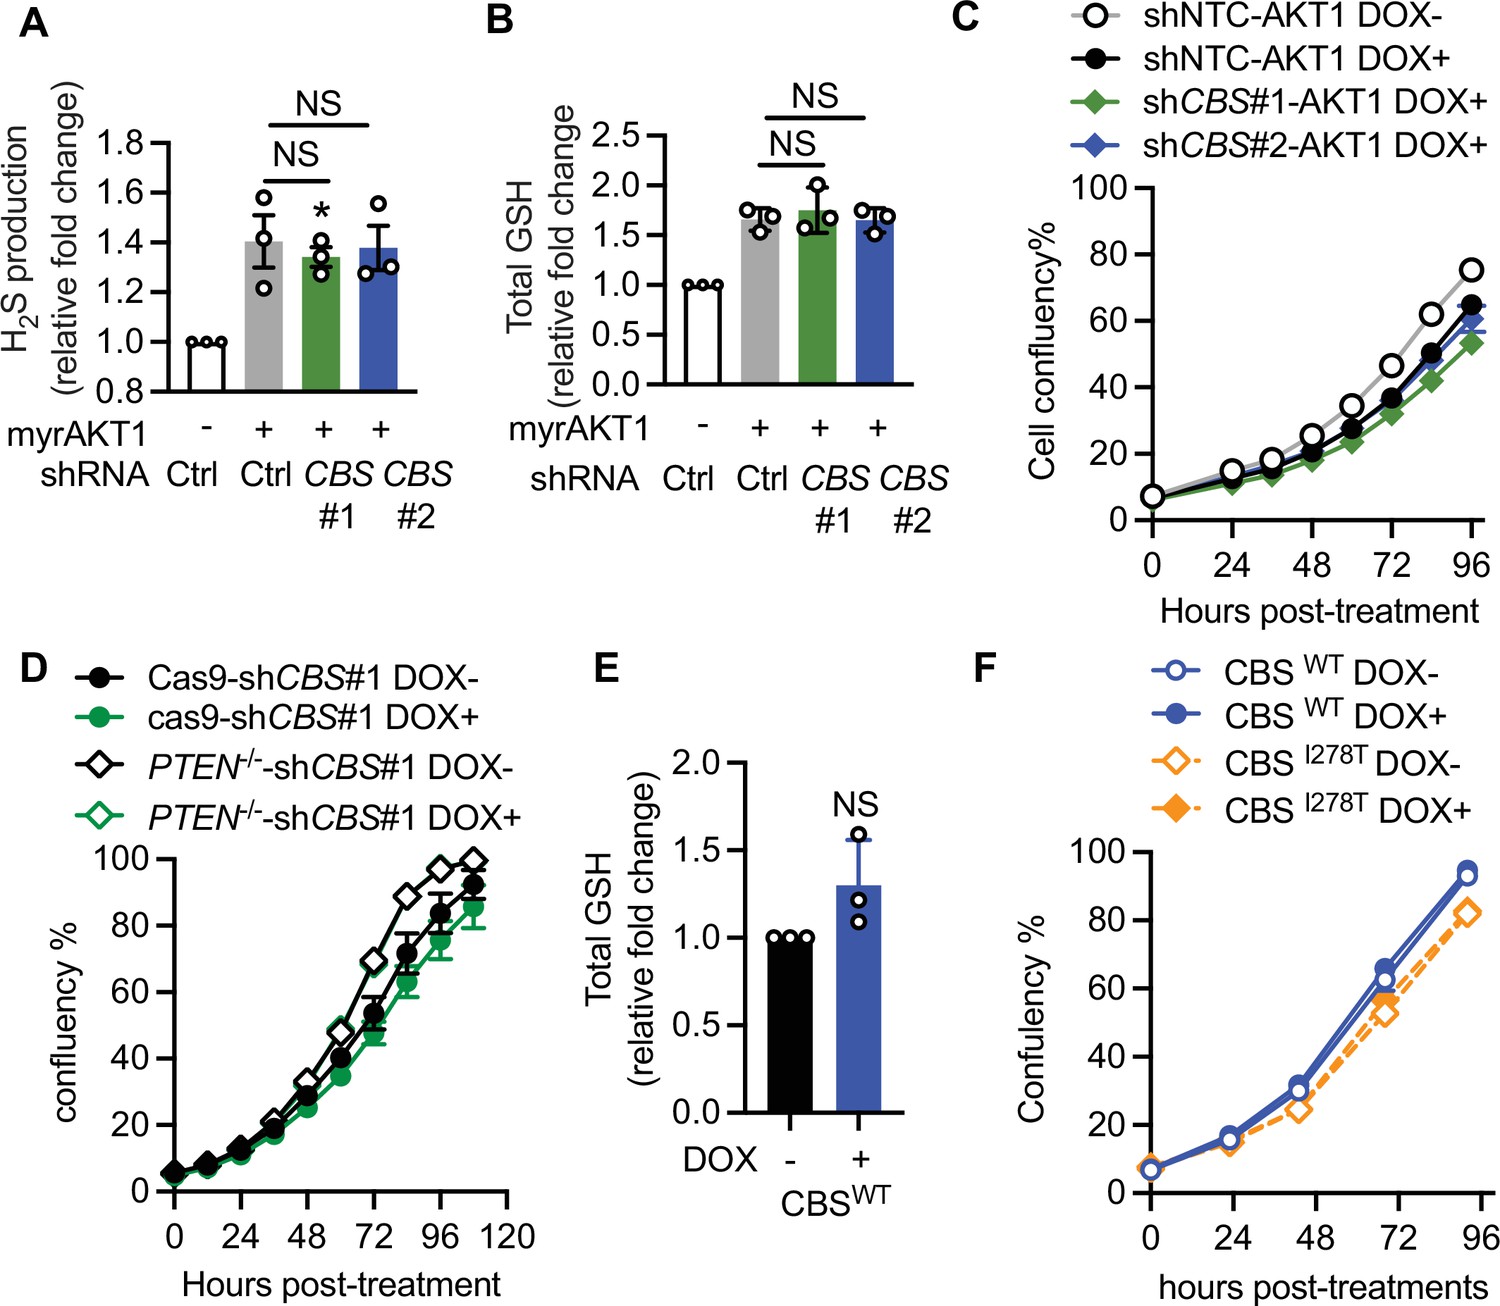
Loss of cystathionine-β-synthase (CBS) synergizes with the PI3K/AKT pathway to promote gastric cancer pathogenesis.
(A–C) GES-1 gastric epithelial cells were stably transfected with doxycycline-inducible myrAKT1 and pGIPZ-shCBS or non-silencing small hairpin RNA (shRNA) control (shCtrl). Cells were treated with doxycycline (0.75 μg/ml). Fold changes of (A) hydrogen sulfide (H2S) production and (B) total glutathione (GSH) level over doxycycline-untreated shCtrl group are presented as mean ± SEM. One-way analysis of variance (ANOVA) with Holm-Šídák’s multiple comparisons was performed (NS, not significant). (C) Cell confluency measured by IncuCyte is presented as mean ± SEM (n=4). (D) GES-1 cells with PTEN knockout by CRISPR or Cas9 control were transduced with doxycycline-inducible CBS shRNA#1. Cells were treated with doxycycline (0.75 μg/ml). Cell confluency measured by IncuCyte is presented as mean ± SEM (n=4). (E–F) AGS gastric cancer cells were stably transfected with doxycycline-inducible CBSwt or CBSI278T and treated with doxycycline (0.08 μg/ml for CBSwt or 1 μg/ml for CBSI278T). (E) Fold changes of total GSH level measured on day 3 post-doxycycline induction are presented as mean ± SEM (n=3). NS, not significant by one sample t-test. (F) Cellular confluency measured by IncuCyte is presented as mean ± SEM (n=3).
Author response image 1
Author response image 2
Tables
Appendix 1—key resources table
| Reagent type (species) or resource | Designation | Source or reference | Identifiers | Additional information |
|---|---|---|---|---|
| Gene (Homo sapiens) | CBS | NCBI | NM_000071.3 | |
| Strain, strain background (Mus musculus) | NOD scid gamma mouse | Peter MacCallum Cancer Centre Animal Facility, Australia | ||
| Cell line (Homo sapiens) | BJ-TERT human foreskin fibroblast | Provided by Robert Weinberg (Massachusetts Institute of Technology, Cambridge, MA) | BJ3 human skin fibroblasts expressing telomerase reverse transcriptase. Cultured in DMEM+20 mM HEPES, 17% Medium 199, 15% FBS, and 1% GlutaMAX | |
| Cell line (Homo sapiens) | IMR90 | Originated from ATCC and obtained from the Garvan Institute of Medical Research, Sydney, Australia | ATCC-CL-186 | Cultured in EMEM+10% FBS, 5 mM sodium pyruvate, 1% non-essential amino acids, and 1% GlutaMAX |
| Cell line (Homo sapiens) | AGS | ATCC | ATCC-CRL-1739 | Cultured in DMEM+20 mM HEPES, 10% FBS, and 1% GlutaMAX |
| Cell line (Homo sapiens) | Hs 746T | ATCC | ATCC-HTB-135 | Cultured in DMEM+20 mM HEPES, 10% FBS, and 1% GlutaMAX |
| Cell line (Homo sapiens) | KATO III | ATCC | ATCC-HTB-103 | Cultured in DMEM+20 mM HEPES, 10% FBS, and 1% GlutaMAX |
| Cell line (Homo sapiens) | NCI-N87 | ATCC | ATCC-CRL-5822 | Cultured in RPMI+20 mM HEPES, 10% FBS, and 1% GlutaMAX |
| Cell line (Homo sapiens) | SNU1 | ATCC | ATCC-CRL-5971 | Cultured in RPMI+20 mM HEPES, 10% FBS, and 1% GlutaMAX |
| Cell line (Homo sapiens) | SNU5 | ATCC | ATCC-CRL-5973 | Cultured in IMDM, 20%FBS, and 1% GlutaMAX. |
| Cell line (Homo-sapiens) | GES-1 | Provided by Prof. Caiyun Fu (Zhejiang Sci-Tech University, China) | Cultured in DMEM+20 mM HEPES, 10% FBS, and 1% GlutaMAX | |
| Recombinant DNA reagent | pBabe-puro (plasmid) | Morgenstern and Land, 1990 | Addgene plasmid #1764 | Retroviral vector as the backbone of all pBabe constructs, used as empty vector control |
| Recombinant DNA reagent | pBabe-puro-HA-myrAKT1 (plasmid) | Astle et al., 2012 | pBabe-puro construct expressing HA-tagged myrAKT1 | |
| Recombinant DNA reagent | pBabe-puro-HRASG12V | Astle et al., 2012 | pBabe-puro construct expressing HA- tagged HRASG12V, gift from Patrick Humbert | |
| Recombinant DNA reagent | pCW57.1-HA-myrAKT1 | Chan et al., 2020 | Doxycycline-inducible pCW57.1 construct expressing HA-tagged myrAKT1 | |
| Recombinant DNA reagent | pREBIR (TRE3G-dsRed-miRE/shRNA-PGK-eBFP2-IRES-rtTA3) | Kim et al., 2018 | Retroviral doxycycline-inducible shRNA expression vector as the backbone of pREBIR constructs | |
| Recombinant DNA reagent | pREBIR-shREN | Chan et al., 2020 | Doxycycline-inducible pREBIR construct expressing renilla luciferase sequence | |
| Recombinant DNA reagent | pREBIR-shCBS#1 | This paper | Doxycycline-inducible pREBIR construct expressing shRNA targeting CBS. The shRNA hairpins were subcloned from Dharmacon pGIPZ-shCBS (Cat# V3LHS_363331) | |
| Recombinant DNA reagent | pREBIR-shCBS#2 | This paper | Doxycycline-inducible pREBIR construct expressing shRNA targeting CBS. The shRNA hairpins were subcloned from Dharmacon pGIPZ-shCBS (Cat# V3LHS_363334) | |
| Recombinant DNA reagent | pRT3-puro | This paper | Retroviral doxycycline-inducible vector which is modified from pREBIR by excising the dsRed/mire cassette and replacing eBFP2 with the puromycin resistance gene | |
| Recombinant DNA reagent | pRT3-puro-CBS | This paper | Retroviral doxycycline-inducible vector pREBIR-puro expressing CBS cDNA which encodes human CBS isoform1 | |
| Recombinant DNA reagent | pLNCX2 ER:ras | Masashi Narita (Young et al., 2009) | Addgene plasmid #67844 | 4-Hydroxytamoxifen-inducible ER:ras fusion protein as the backbone for pLNCX2 ER constructs |
| Recombinant DNA reagent | pLNCX2 ER:CBS WT-FLAG | This paper | HRASV12 in pLNCX2 ER;ras was replaced with C-terminally FLAG tagged human CBS isoform 1 | |
| Recombinant DNA reagent | pLNCX2 ER:CBS Δ468–551-FLAG | This paper | HRASV12 in pLNCX2 ER;ras was replaced with C-terminally FLAG tagged human CBS isoform 1 with a deletion of regulatory domain CBSD2 (Δ468–551) | |
| Recombinant DNA reagent | FgH1t-puro-PTEN gRNA | This paper | FgH1t-puro was modified from FgH1t-GFP (Marco Herold) to replace GFP with a puromycin resistance gene. Lentiviral vector expressing PTEN gRNA sequence (TCATCTGGATTATAGACCAG) | |
| Transfected construct (Homo sapiens) | pGIPZ-Non-silencing lentiviral shRNA control | Dharmacon (Horizon Discovery, UK) | Cat#RHS4348 | Lentiviral construct to transfect and express shRNA whose sequence contain no homology to known mammalian genes as the negative control for shRNA experiments |
| Transfected construct (Homo sapiens) | pGIPZ-shCBS #1 | Dharmacon (Horizon Discovery, UK) | Cat# V3LHS_363331 | Lentiviral construct to transfect and express the shRNA targeting human CBS |
| Transfected construct (Homo sapiens) | pGIPZ-shCBS #2 | Dharmacon (Horizon Discovery, UK) | Cat# V3LHS_363334 | Lentiviral construct to transfect and express the shRNA targeting human CBS |
| Transfected construct (Homo sapiens) | On-Targetplus Non-targeting control pool | Dharmacon (Horizon Discovery, UK) | Cat#D-001810-10-05 | Transfected construct (human) as the negative control for RNAi experiment |
| Transfected construct (Homo sapiens) | siRNA to human CBS (SMARTpool) | Dharmacon (Horizon Discovery, UK) | Cat#L-008617-00-0005 | Transfected construct (human) |
| Biological samples (Homo sapiens) | Tissue microarray slide contains 120 tumor sections and 63 normal sections from 62 individual gastric cancer patients | Wang et al., 2013 | These patients underwent gastrectomy from 2000 to 2005 in Changhai Hospital, second Military Medical University, Shanghai, China. All patients have not received any anticancer therapy before surgery | |
| Antibody | Anti-p53 (mouse monoclonal) | Santa Cruz | Cat#sc-126 | WB (1:1000) |
| Antibody | Anti-AKT (rabbit monoclonal) | Cell Signaling Technology | Cat#4691 | WB (1:1000) |
| Antibody | Anti-HA (mouse monoclonal) | In-house | Cat#12CA5 | WB (1:2000) |
| Antibody | Anti-Ras (mouse monoclonal) | Santa Cruz | Cat#sc-520 | WB (1:500) |
| Antibody | Anti-Cyclin A (mouse monoclonal) | Santa Cruz | Cat#sc-751 | WB (1:1000) |
| Antibody | Anti-Phospho-RB (S807/811) (rabbit monoclonal) | Cell Signaling Technology | Cat#8,561 | WB (1:1000) |
| Antibody | Anti-RB (mouse monoclonal) | BD Pharmingen | Cat#544136 | WB (1:1000) |
| Antibody | Anti-Phospho-AKT(S473) (rabbit monoclonal) | Cell Signaling Technology | Cat#4058 | WB (1:1000) |
| Antibody | Anti-p21(rabbit monoclonal) | Cell Signaling Technology | Cat#2947 | WB (1:1000) |
| Antibody | Anti-p16 (mouse monoclonal) | BD Pharmingen | Cat#550834 | WB (1:1000) |
| Antibody | Anti-CBS (rabbit monoclonal) | Proteintech | Cat#14787–1-AP | WB (1:1000), IF(1:100) |
| Antibody | Anti-PTEN (rabbit monoclonal) | Cell Signaling Technology | Cat#9559 | WB (1:1000) |
| Antibody | Anti-SLC7A11 (rabbit monoclonal) | Cell Signaling Technology | Cat#12691 | WB (1:1000) |
| Antibody | Anti-CTH (rabbit monoclonal) | Cell Signaling Technology | Cat#19689 | WB (1:1000) |
| Antibody | Anti-IL-1α (Goat polyclonal) | R&D Systems | Cat#AF-200-NA | WB (1:1000) |
| Antibody | Anti-IL-1β (mouse monoclonal) | R&D Systems | Cat#MAB201100 | WB (1:1000) |
| Antibody | Anti-IL-8 (mouse monoclonal) | R&D Systems | Cat#MAB208100 | WB (1:1000) |
| Antibody | Anti-IL-6 (goat polyclonal) | R&D Systems | Cat#AB-206-NA | WB (1:1000) |
| Antibody | Anti-OXPHOS (mouse monoclonal) | abcam | Cat#ab110413 | WB (1:1000) |
| Antibody | Anti-FLAG (mouse monoclonal) | Sigma-Aldrich | Cat#F3165 | WB (1:1000) |
| Antibody | Anti-β-Actin conjugated to HRP (mouse monoclonal) | Sigma-Aldrich | Cat#A3854 | WB (1:10,000) |
| Antibody | Anti-Vinculin conjugated to HRP (mouse monoclonal) | Santa Cruz | Cat# sc-73614HRP | WB (1:2000) |
| Antibody | Goat anti-rabbit IgG (H+L) HRP conjugate (goat polyclonal) | Bio-Rad Laboratories | Cat# 170-6515 | WB (1:2000) |
| Antibody | Goat anti-mouse IgG (H+L) HRP conjugate (goat polyclonal) | Bio-Rad Laboratories | Cat#172-1011 | WB (1:2000) |
| Sequence-based reagent | Human CBS-Forward | This paper | PCR primers | 5’-GGGGCTGAGATTGTGAGGAC-3’ |
| Sequence-based reagent | Human CBS-Reverse | This paper | PCR primers | 5’-CGGTACTGGTCTAGGATGTGA-3’ |
| Sequence-based reagent | Human CBS-Forward | Zhao et al., 2012 | Methylation-specific PCR primers | 5’-CAGAGGATAAGGAAGCCAAG-3’ |
| Sequence-based reagent | Human CBS-Reverse | Zhao et al., 2012 | Methylation-specific PCR primers | 5’-TCCCAATCTTGTTGATTCTGAC-3’ |
| Sequence-based reagent | Human CBS methylated-Forward | Zhao et al., 2012 | Methylation-specific PCR primers | 5’-CGAGATATTGGTCGGCGTC-3’ |
| Sequence-based reagent | Human CBS unmethylated-Forward | Zhao et al., 2012 | Methylation-specific PCR primers | 5’-TTATGAGATATTGGTTGGTGTT-3’ |
| Sequence-based reagent | Human CBS unmethylated-Reverse | Zhao et al., 2012 | Methylation-specific PCR primers | 5’-TACCCCAACTACAACAAAACA-3’ |
| Commercial assay or kit | Click-iT EdU AlexaFluor-488 imaging kit | Invitrogen | Cat#C10337 | |
| Commercial assay or kit | Qproteome mitochondria isolation kit | Qiagen | Cat#37612 | |
| Commercial assay or kit | ISOLATE-II kit | Bioline | Cat#52073 | |
| Commercial assay or kit | SuperScript III reverse transcriptase | Invitrogen | Cat#18080051 | |
| Commercial assay or kit | Fast SYBR green Master Mix | Applied Biosystems | Cat#4385612 | |
| Commercial assay or kit | NucleoSpin Tissue Kit | Macherey-Nagel | Cat#740952 | |
| Commercial assay or kit | EZ DNA methylation kit | Zymo Research | Cat#D5001 | |
| Commercial assay or kit | Glutathione Assay Kit | Cayman Chemical | Cat#703002 | |
| Chemical compound, drug | O-(Carboxymethyl)hydroxylamine hemihydrochloride (AOAA) | Sigma-Aldrich | Cat#C13408 | Final conc: 30 μM |
| Chemical compound, drug | Doxycycline hyclate | Sigma-Aldrich | Cat#D5207 | Final conc: 1 μg/ml |
| Chemical compound, drug | (Z)–4-hydroxytamoxifen (4-OHT) | Sigma-Aldrich | Cat#H7904 | Final conc: 20 nM |
| Chemical compound, drug | L-serine (3–13C) | Cambridge Isotope Laboratories | Cat#CLM-1572 | Final conc: 400 μM |
| Chemical compound, drug | NEM | Sigma-Aldrich | Cat#E3876 | Final conc: 50 mM |
| Chemical compound, drug | Ammonium formate | Sigma-Aldrich | Cat#516961 | Final conc: 10 mM |
| Chemical compound, drug | Erastin | Sigma-Aldrich | Cat#E7781 | Final conc: 5 μM |
| Chemical compound, drug | Protease K | Thermo Fisher | Cat#25530029 | Final conc: 0.1 μg/ml |
| Software, algorithm | GraphPad Prism | GraphPad Software | Version 9.3.0 | |
| Software, algorithm | Molecular signatures database | Broad Institute | Version 6.1 | |
| Software, algorithm | MetaboAnalyst | https://www.metaboanalyst.ca | Version 4.0 | |
| Other | DAPI stain | Invitrogen | Cat#D1306 | Final conc: 0.5–1 µg/ml |
| Other | MitoTracker Deep Red FM | Invitrogen | Cat#M22426 | Final conc: 1 μM |
| Other | MitoSOX red | Invitrogen | Cat#M36008 | Final conc: 5 μM |
| Other | 2′,7′-Dichlorofluorescein diacetate (H2DCFDH-DA) | Sigma-Aldrich | Cat#35845 | Final conc: 10 μM |
| Other | 7-Azido-4-Methylcoumarin (AzMC) | Sigma-Aldrich | Cat#802409 | Final conc: 20 μM |
| Other | 5-Ethyl-2’deoxyuridine (EdU) | Invitrogen | Cat#A10044 | Final conc: 10 μM |
| Other | X-gal | Sigma-Aldrich | Cat#B4252 | Final conc: 1 mg/ml |
Additional files
Download links
A two-part list of links to download the article, or parts of the article, in various formats.
Downloads (link to download the article as PDF)
Open citations (links to open the citations from this article in various online reference manager services)
Cite this article (links to download the citations from this article in formats compatible with various reference manager tools)
Cystathionine-β-synthase is essential for AKT-induced senescence and suppresses the development of gastric cancers with PI3K/AKT activation
eLife 11:e71929.
https://doi.org/10.7554/eLife.71929


