C-type natriuretic peptide facilitates autonomic Ca2+ entry in growth plate chondrocytes for stimulating bone growth
- Graduate School of Pharmaceutical Sciences, Kyoto University, Japan
- Graduate School of Medicine, Kyoto University, Japan
- Graduate School of Engineering, Kyoto University, Japan
- Graduate School of Medicine, Gifu University, Japan
- Medical Innovation Center, Kyoto University, Japan
Figures
Figure 1 with 2 supplements
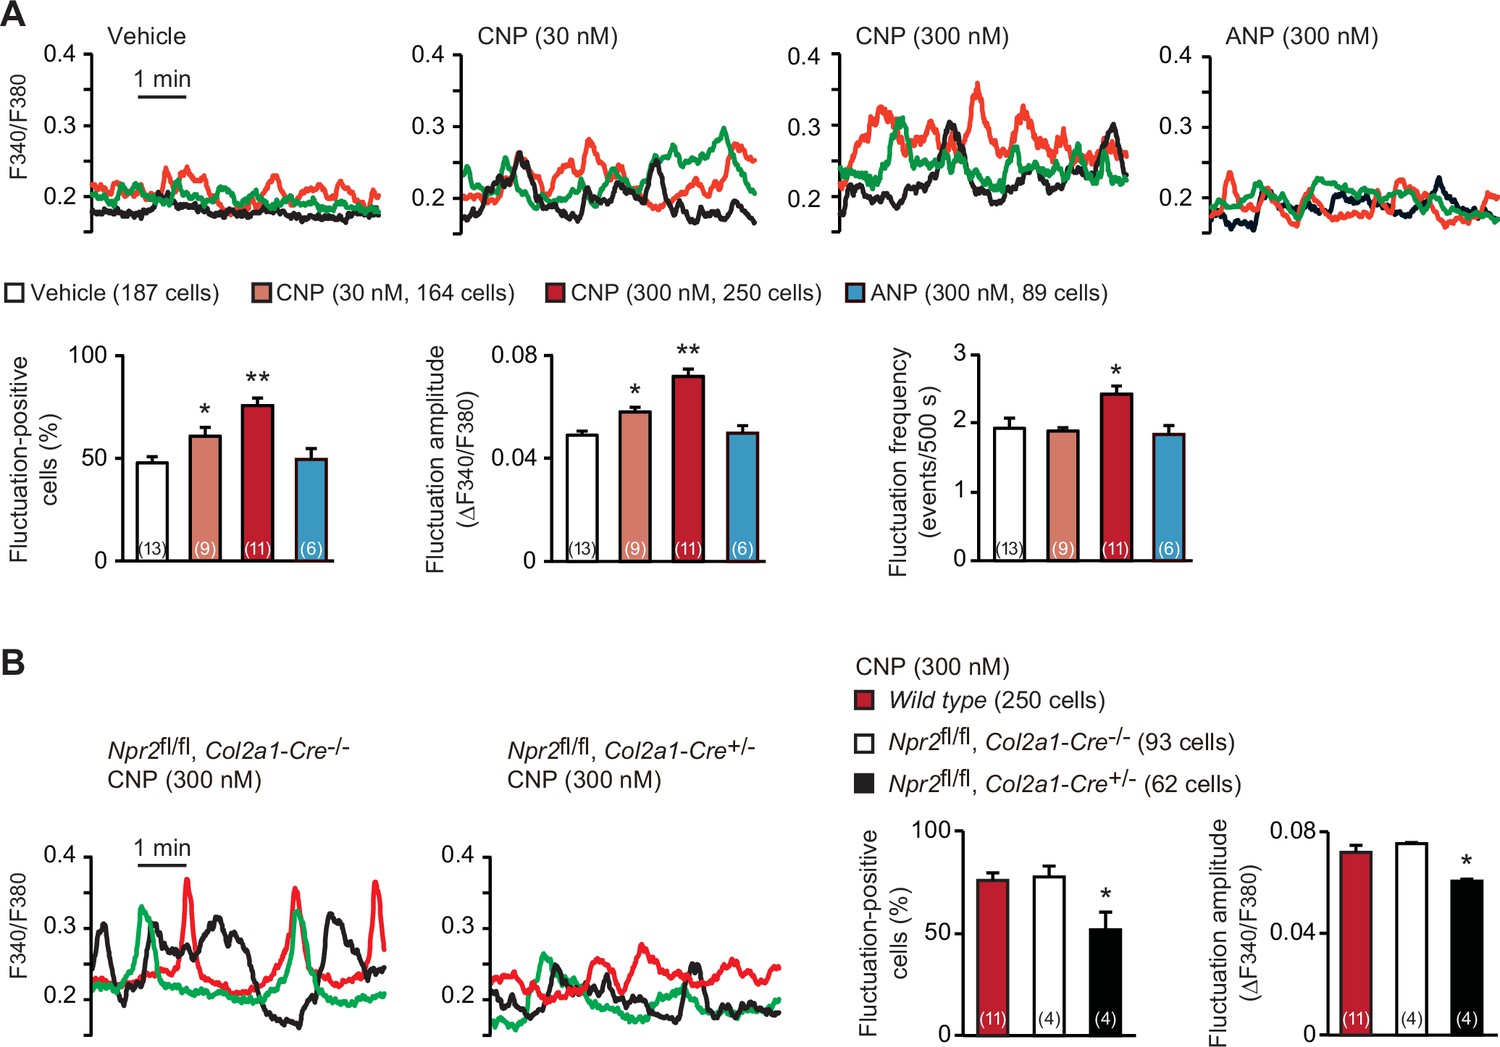
C-type natriuretic peptide (CNP)-induced facilitation of Ca2+ fluctuations in growth plate chondrocytes.
(A) Fura-2 imaging of round chondrocytes pretreated with or without natriuretic peptides. Femoral bone slices prepared from wild-type C57BL embryos were pretreated with or without CNP and atrial natriuretic peptide (ANP), and subjected to Ca2+ imaging. Representative recording traces from three cells are shown in each pretreatment group (upper panels). The effects of CNP and ANP pretreatments on spontaneous Ca2+ fluctuations are summarized (lower graphs). The fluctuation-positive cell ratio, fluctuation amplitude and frequency were statistically analyzed, and significant differences from the control vehicle pretreatment are marked with asterisks (*p < 0.05 and **p < 0.01 in one-way analysis of variance (ANOVA) and Dunnett’s test). The data are presented as the means ± standard error of the mean (SEM). with n values indicating the number of examined mice. (B) Fura-2 imaging of round chondrocytes prepared from chondrocyte-specific Npr2-knockout (Npr2fl/fl, Col2a1-Cre+/−) and control (Npr2fl/fl, Col2a1-Cre−/−) mice. The bone slices were pretreated with CNP, and then subjected to Ca2+ imaging. Representative recording traces are shown (left panels) and the CNP-pretreated effects are summarized (right graphs); significant differences from the wild-type group are marked with asterisks (*p < 0.05 in one-way ANOVA and Tukey’s test). The data are presented as the means ± SEM with n values indicating the number of examined mice.
-
Figure 1—source data 1
Related to Figure 1A.
- https://cdn.elifesciences.org/articles/71931/elife-71931-fig1-data1-v1.xlsx
-
Figure 1—source data 2
Related to Figure 1B.
- https://cdn.elifesciences.org/articles/71931/elife-71931-fig1-data2-v1.xlsx
Figure 1—figure supplement 1
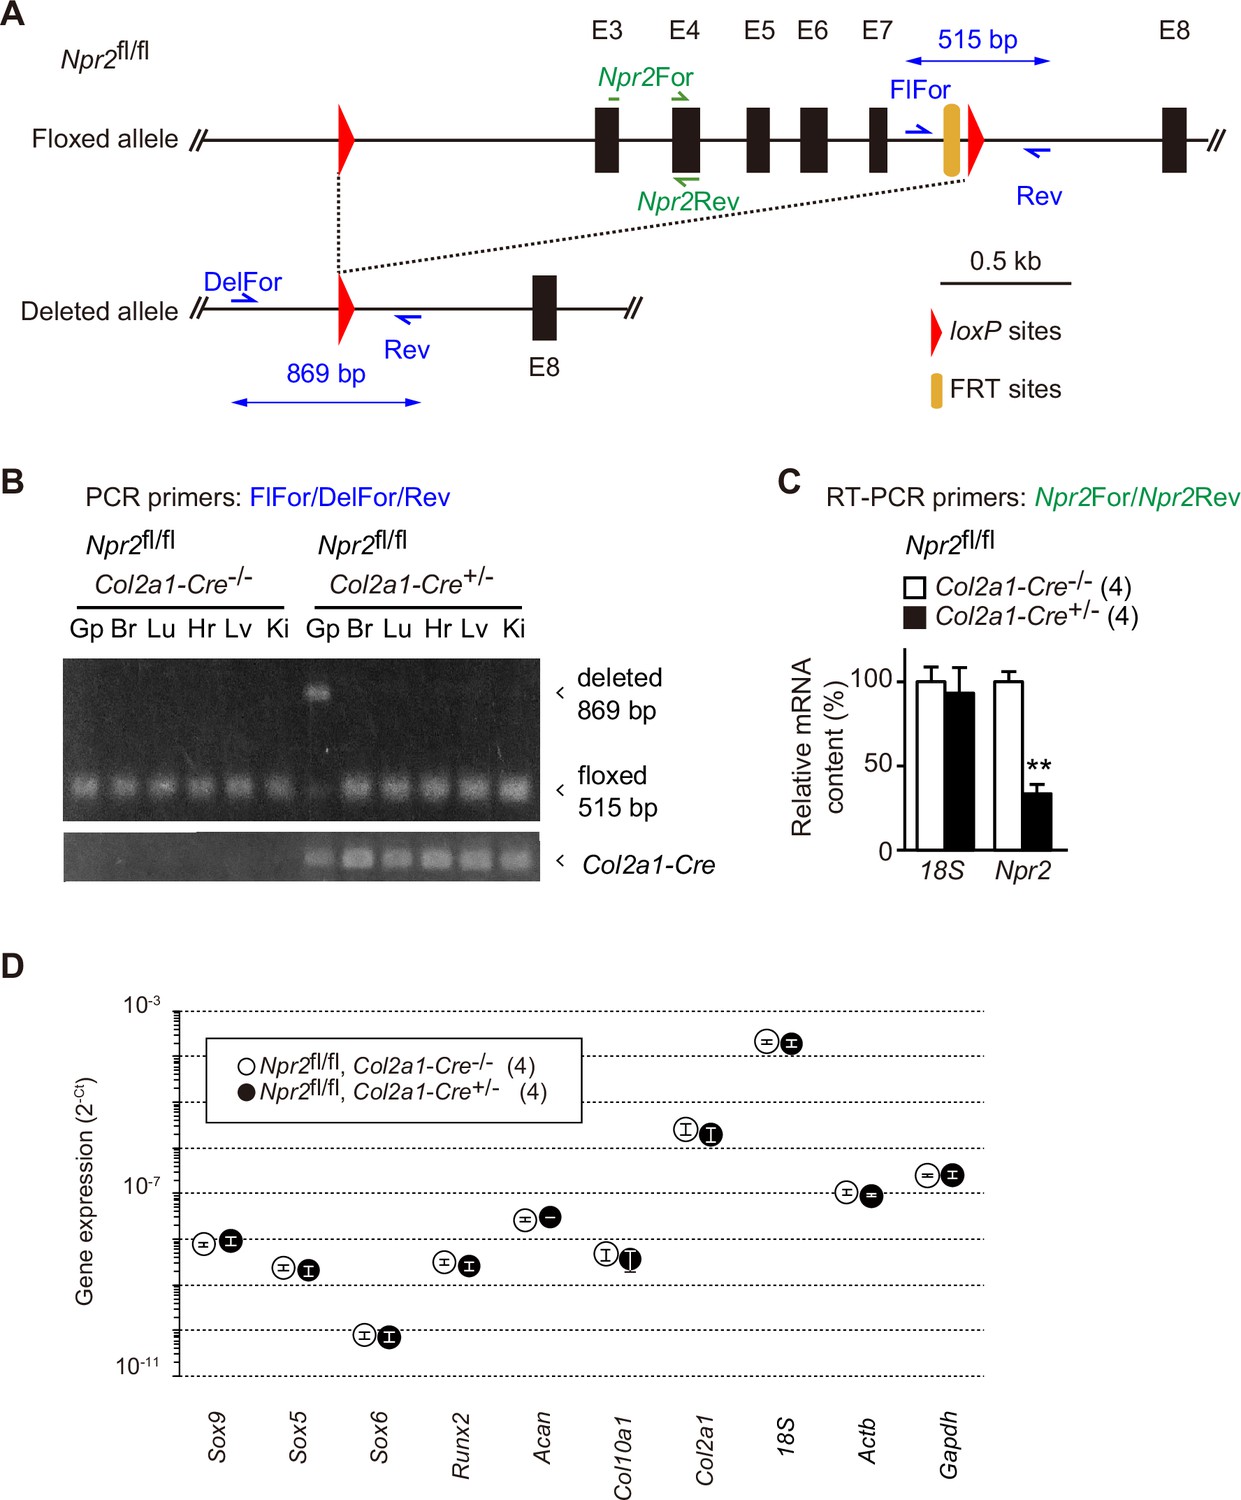
Chondrocyte-specific Npr2 ablation.
(A) Organization of floxed and deleted Npr2 alleles. The chondrocyte-specific Npr2-knockout (Npr2fl/fl, Col2a1-Cre+/−) mice were previously generated (Nakao et al., 2015). In this study, genotyping primers were newly designed, and Npr2 ablation was evaluated in growth plates. The genomic map shows PCR primers for detecting the mutated Npr2 alleles and Npr2 mRNA. (B) Npr2 gene ablation in various tissues from the chondrocyte-specific Npr2-knockout mice. Genomic DNAs were prepared from tissues (Gp, humeral growth plate; Br, brain; Lu, lung; Hr, heart; Lv, liver; Ki, kidney) from the E17.5 chondrocyte-specific Npr2-knockout and control embryos, and subjected to PCR analysis to detect the floxed and deleted Npr2 alleles; the Col2a1-Cre transgene was also examined. (C) Reduction of Npr2 mRNA in mutant growth plates prepared from the chondrocyte-specific Npr2-knockout mice. Total RNAs were prepared from humeral growth plates from the E17.5 embryos, and subjected to reverse transcription PCR (RT-PCR) analysis for estimating Npr2 mRNA content. 18S ribosomal RNA was examined as an internal control. The relative mRNA contents were estimated from cycle thresholds in RT-PCR reactions and are summarized in the bar graph. (D) Total RNAs were prepared from humeral growth plate sections of the chondrocyte-specific Npr2-knockout (Npr2fl/fl, Col2a1-Cre+/−) and control (Npr2fl/fl, Col2a1-Cre−/−) E17.5 embryos and subjected to quantitative RT-PCR analysis. The cycle threshold (Ct) was determined for each RT-PCR reaction for estimating relative mRNA content. The data represent means ± standard error of the mean (SEM), and the numbers of mice examined are shown in parentheses. A significant difference between the genotype is marked with an asterisk (**p < 0.01 in t-test).
-
Figure 1—figure supplement 1—source data 1
Related to Figure 1—figure supplement 1B.
- https://cdn.elifesciences.org/articles/71931/elife-71931-fig1-figsupp1-data1-v1.zip
-
Figure 1—figure supplement 1—source data 2
Related to Figure 1—figure supplement 1B.
- https://cdn.elifesciences.org/articles/71931/elife-71931-fig1-figsupp1-data2-v1.zip
-
Figure 1—figure supplement 1—source data 3
Related to Figure 1—figure supplement 1C.
- https://cdn.elifesciences.org/articles/71931/elife-71931-fig1-figsupp1-data3-v1.xlsx
-
Figure 1—figure supplement 1—source data 4
Related to Figure 1—figure supplement 1D.
- https://cdn.elifesciences.org/articles/71931/elife-71931-fig1-figsupp1-data4-v1.xlsx
Figure 1—figure supplement 2
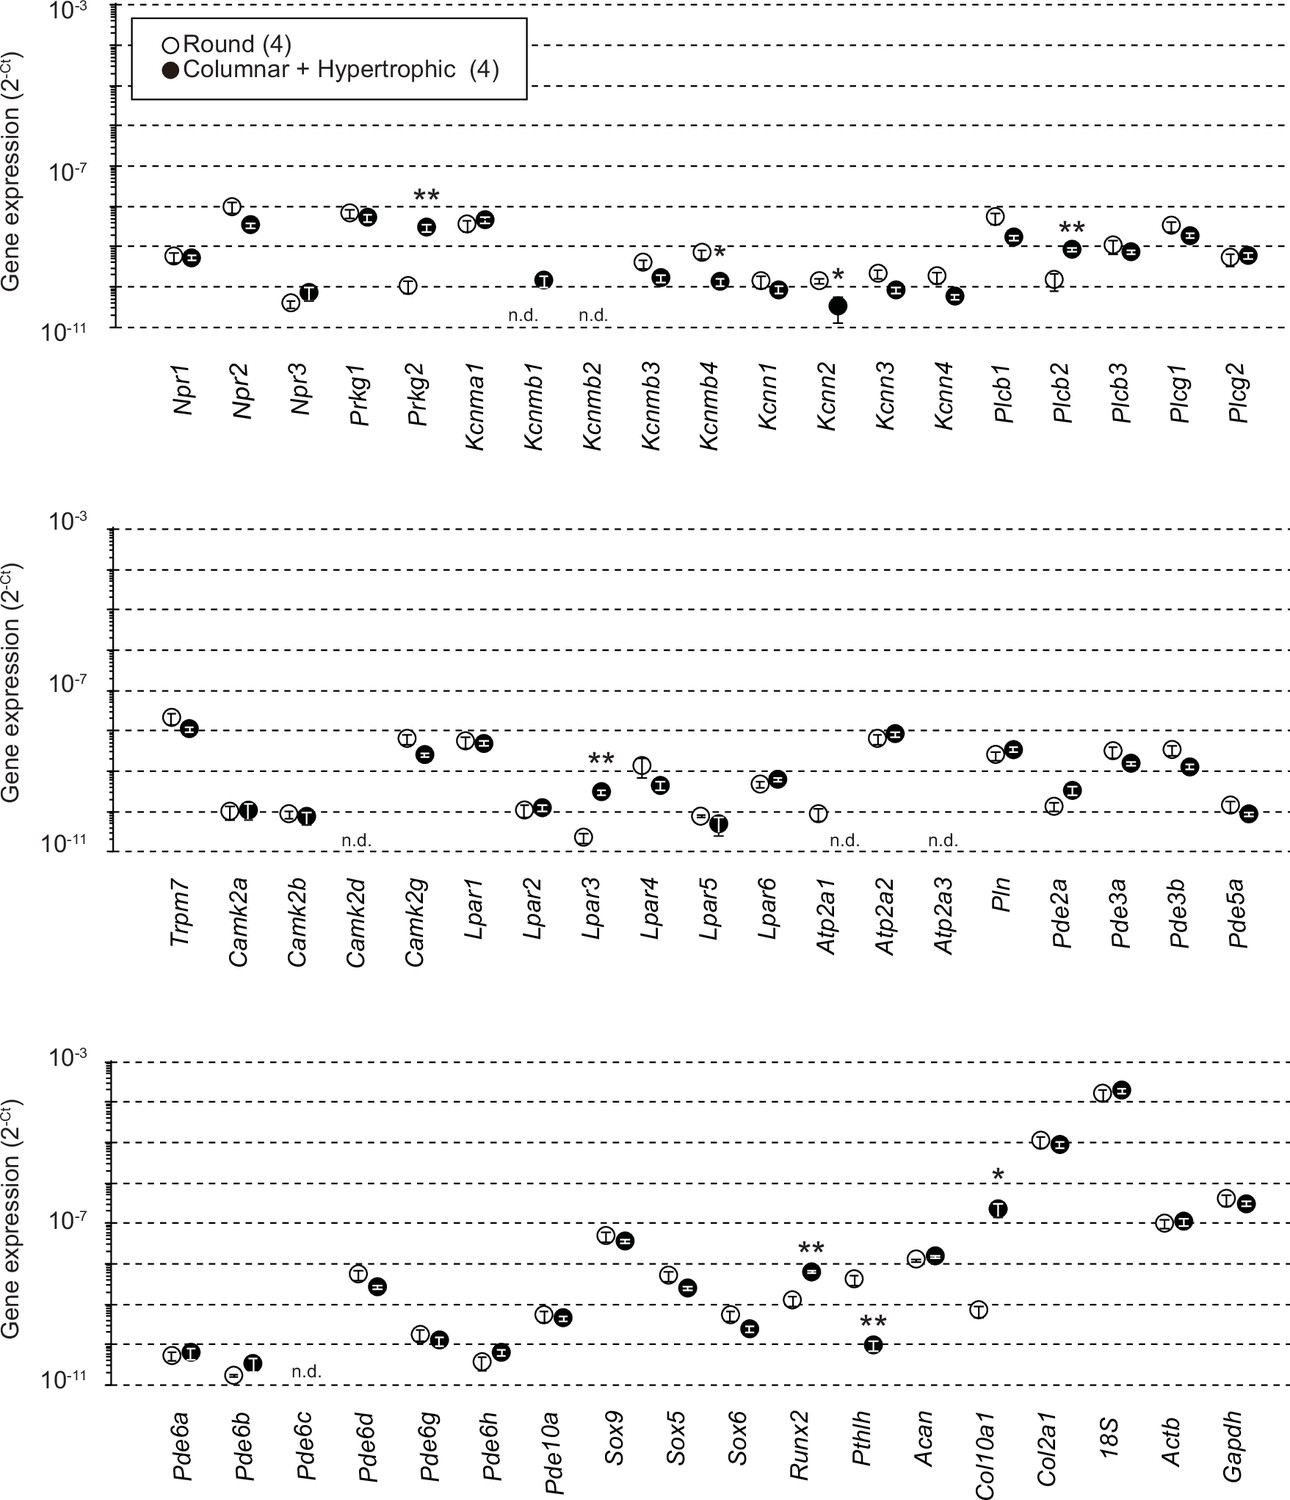
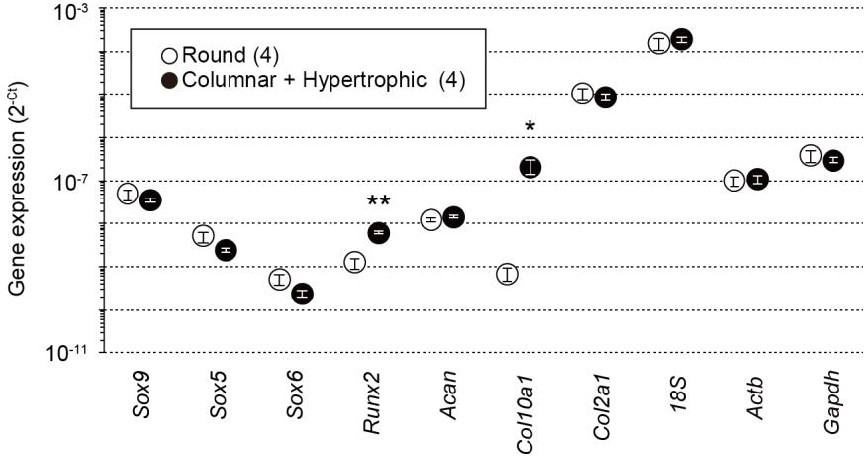
Gene expression analysis in wild-type growth plate chondrocytes.
Total RNAs were prepared from growth plate sections packed with round chondrocytes or enriched with columnar and hypertrophic chondrocytes, and subjected to RT-PCR analysis. The cycle threshold (Ct) was determined for each RT-PCR reaction for estimating relative mRNA content. The data represent the mean ± standard error of the mean (SEM), and the numbers of mice examined are shown in parentheses. Significant differences between the growth plate sections are marked with asterisks (*p < 0.05 and **p < 0.01 in t-test). n.d.: not detectable.
-
Figure 1—figure supplement 2—source data 1
Related to Figure 1—figure supplement 2.
- https://cdn.elifesciences.org/articles/71931/elife-71931-fig1-figsupp2-data1-v1.xlsx
Figure 2

Contribution of cGMP-dependent protein kinase (PKG) to C-type natriuretic peptide (CNP)-facilitated Ca2+ fluctuations.
(A) Facilitated Ca2+ fluctuations in round chondrocytes pretreated with the PKG activator 8-pCPT-cGMP. Wild-type bone slices were pretreated with or without the cGMP analog, and then subjected to Ca2+ imaging. Representative recording traces are shown (left panels), and the pharmacological effects are summarized (right graphs). Significant differences between control and 8-pCPT-cGMP pretreatments are marked with asterisks (**p < 0.01 in t-test). The data are presented as the means ± standard error of the mean (SEM) with n values indicating the number of examined mice. (B) Attenuation of CNP-facilitated Ca2+ fluctuations by the PKG inhibitor KT5823. Wild-type bone slices were pretreated with CNP, and then subjected to Ca2+ imaging. Representative recording traces are shown (left panel), and KT5823-induced effects are summarized (right graphs). Significant KT5823-induced shifts are marked with asterisks (**p < 0.01 in t-test). The data are presented as the means ± SEM with n values indicating the number of examined mice.
-
Figure 2—source data 1
Related to Figure 2A.
- https://cdn.elifesciences.org/articles/71931/elife-71931-fig2-data1-v1.xlsx
-
Figure 2—source data 2
Related to Figure 2B.
- https://cdn.elifesciences.org/articles/71931/elife-71931-fig2-data2-v1.xlsx
Figure 3 with 2 supplements
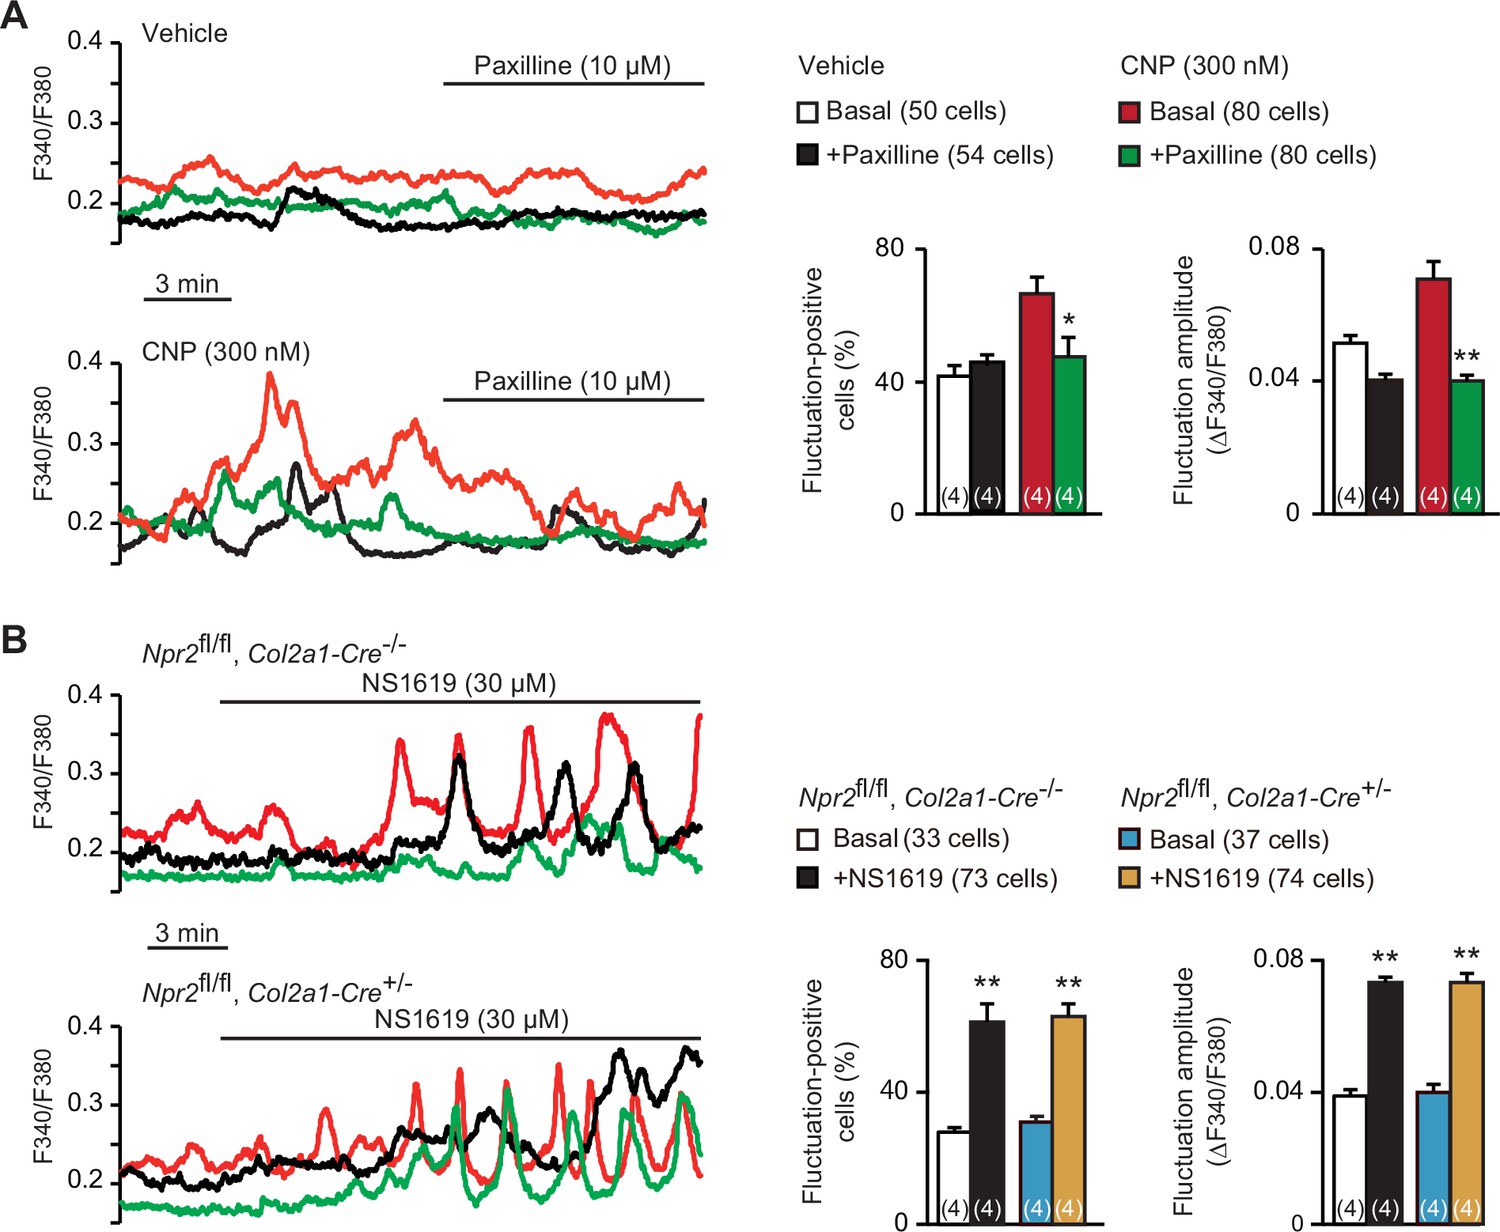
Contribution of BK channels to C-type natriuretic peptide (CNP)-facilitated Ca2+ fluctuations.
(A) Attenuation of CNP-facilitated Ca2+ fluctuations by the BK channel inhibitor paxilline in round chondrocytes. Wild-type bone slices were pretreated with or without CNP, and then subjected to Ca2+ imaging. Representative recording traces are shown (left panels), and paxilline-induced effects are summarized (right graphs). Significant paxilline-induced shifts are marked with asterisks (*p < 0.05 and **p < 0.01 in one-way analysis of variance (ANOVA) and Tukey’s test). The data are presented as the means ± standard error of the mean (SEM) with n values indicating the number of examined mice. (B) Ca2+ fluctuations facilitated by the BK channel activator NS1619 in Npr2-deficient chondrocytes. Bone slices were prepared from the chondrocyte-specific Npr2-knockout and control embryos, and NS1619-induced effects were examined in Ca2+ imaging. Representative recording traces are shown (left panels), and the effects of NS1619 are summarized (right graphs). Significant NS1619-induced shifts are marked with asterisks (**p < 0.01 in one-way ANOVA and Tukey’s test). The data are presented as the means ± SEM with n values indicating the number of examined mice.
-
Figure 3—source data 1
Related to Figure 3A.
- https://cdn.elifesciences.org/articles/71931/elife-71931-fig3-data1-v1.xlsx
-
Figure 3—source data 2
Related to Figure 3B.
- https://cdn.elifesciences.org/articles/71931/elife-71931-fig3-data2-v1.xlsx
Figure 3—figure supplement 1
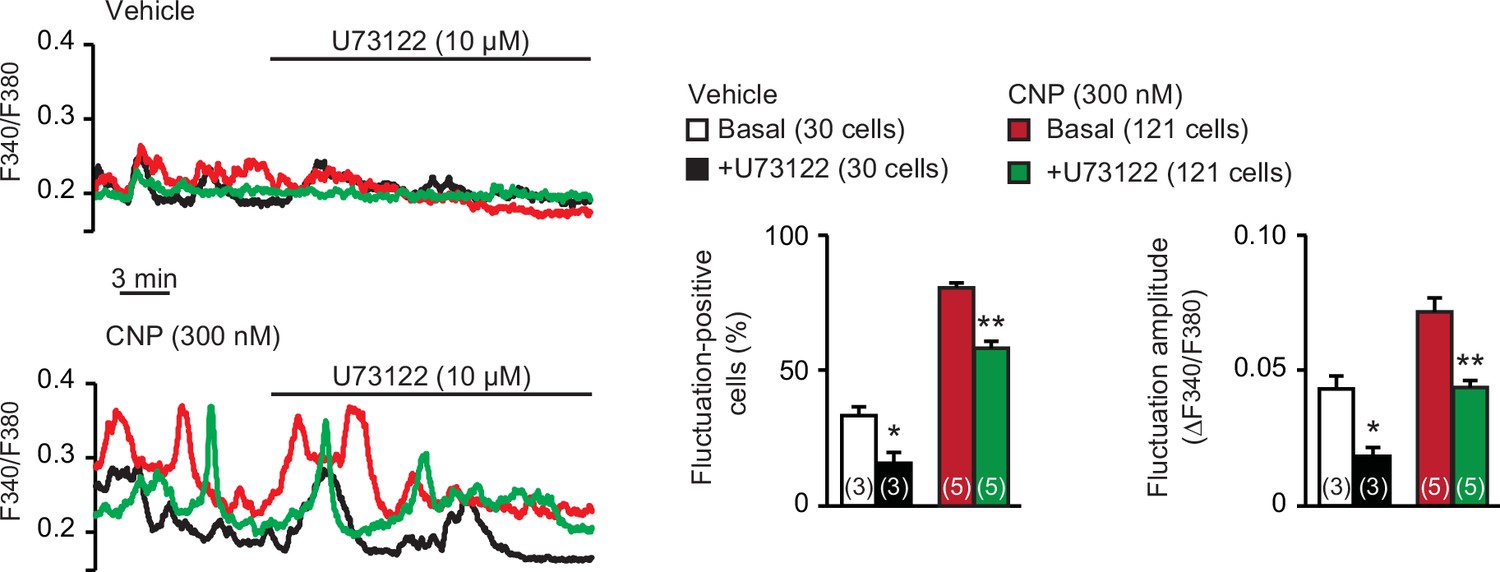
Effects of phospholipase C (PLC) inhibitor U73122 on C-type natriuretic peptide (CNP)-facilitated Ca2+ fluctuations.
In Ca2+ imaging, U73122 was bath applied to wild-type round chondrocytes pretreated with or without CNP. Representative recording traces are shown (left panels), and the effects of U73122 are summarized (right bar graphs). Data represent means ± standard error of the mean (SEM), and the numbers of cells and mice examined are shown in parentheses in the keys and graph bars, respectively. Significant differences between before and after the U73122 treatment are marked with asterisks (*p < 0.05 and **p < 0.01 in one-way analysis of variance [ANOVA] and Tukey’s test).
-
Figure 3—figure supplement 1—source data 1
Related to Figure 3—figure supplement 1.
- https://cdn.elifesciences.org/articles/71931/elife-71931-fig3-figsupp1-data1-v1.xlsx
Figure 3—figure supplement 2
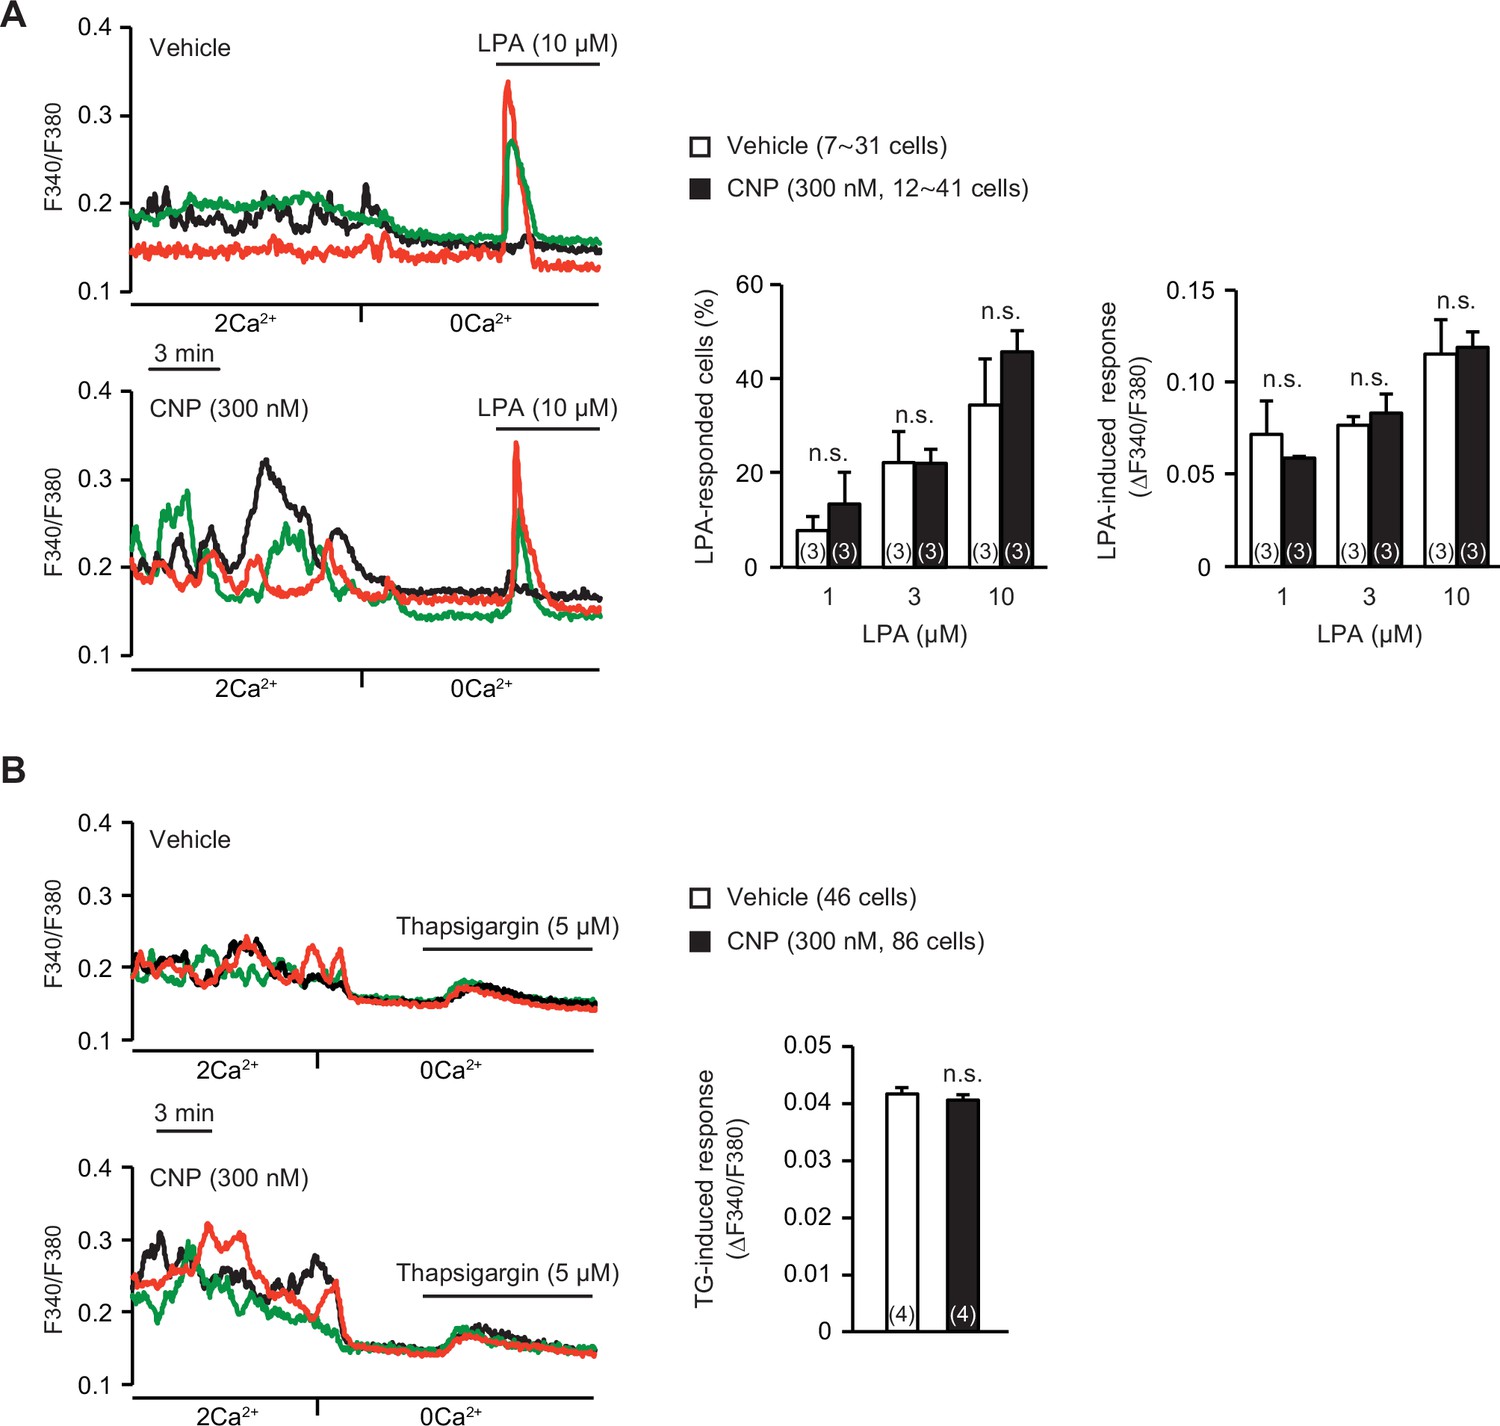
Store Ca2+ release in C-type natriuretic peptide (CNP)-treated round chondrocytes.
(A) Store Ca2+ release triggered by 1-oleoyl lysophosphatidic acid (LPA) in wild-type round chondrocytes pretreated with or without CNP. Representative recording traces are shown (left panels), and LPA-evoked Ca2+ responses are summarized (right graphs). Data represent means ± standard error of the mean (SEM), and the numbers of cells and mice examined are shown in parentheses in the keys and graph bars, respectively. No significant differences were observed between CNP- and vehicle-pretreated groups (one-way analysis of variance [ANOVA] and Tukey’s test). (B) Ca2+ leak responses evoked by the sarco/endoplasmic reticulum Ca2+-ATPase (SERCA) pump inhibitor thapsigargin (TG) in wild-type round chondrocytes pretreated with or without CNP. Representative recording traces are shown (left panels), and TG-evoked Ca2+ responses are summarized (right bar graphs). Data represent means ± SEM, and the numbers of cells and mice examined are shown in parentheses in the keys and graph bars, respectively. No significant differences were observed between CNP- and vehicle-pretreated groups (t-test).
-
Figure 3—figure supplement 2—source data 1
Related to Figure 3—figure supplement 2A.
- https://cdn.elifesciences.org/articles/71931/elife-71931-fig3-figsupp2-data1-v1.xlsx
-
Figure 3—figure supplement 2—source data 2
Related to Figure 3—figure supplement 2B.
- https://cdn.elifesciences.org/articles/71931/elife-71931-fig3-figsupp2-data2-v1.xlsx
Figure 4
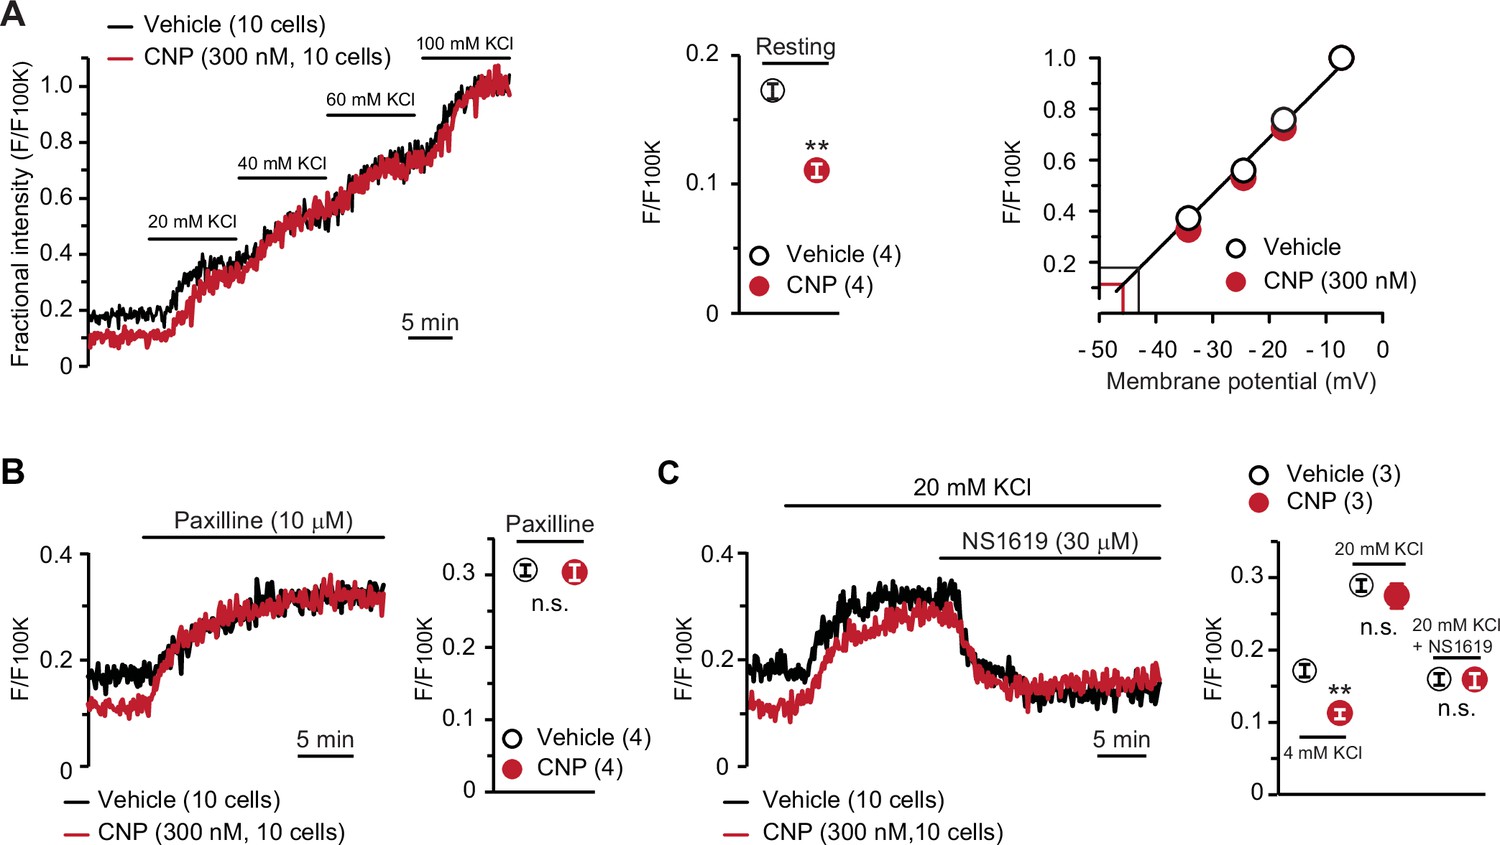
BK channel-mediated hyperpolarization induced by C-type natriuretic peptide (CNP).
(A) Oxonol VI imaging of round chondrocytes pretreated with or without CNP. Wild-type bone slices were pretreated with or without CNP, and then subjected to membrane potential imaging. During contiguous treatments with high-K+ solutions, cellular fluorescence intensities were monitored and normalized to the maximum value in the 100 mM KCl-containing solution to yield the fractional intensity (left panel). The resting fractional intensities were quantified and statistically analyzed in CNP- and vehicle-pretreated cells (middle graph). For preparing the calibration plot (right panel), the data from 10 cells in bathing solutions containing 4 (normal solution), 20, 40, 60, and 100 mM KCl are summarized; red and black lines indicate the estimated resting membrane potentials of CNP- and vehicle-pretreated cells, respectively. (B) Effects of the BK channel inhibitor paxilline on resting membrane potential in round chondrocytes. Recording data from 10 cells pretreated with or without CNP were averaged (left panel), and the fractional intensities elevated by paxilline are summarized (right graph). (C) Effects of the BK channel activator NS1619 on membrane potential in round chondrocytes. Recording data from 10 cells pretreated with or without CNP were averaged (left panel), and the fractional intensities in normal, 20 mM KCl and NS1619-containing 20 mM KCl solutions are summarized (right graph). Significant differences between CNP- and vehicle-pretreated cells are indicated by asterisks in (A) (**p < 0.01 in t-test) and in (C) (**p < 0.01 in one-way analysis of variance [ANOVA] and Dunn’s test). The data are presented as the means ± standard error of the mean (SEM) with n values indicating the number of examined mice.
-
Figure 4—source data 1
Related to Figure 4A.
- https://cdn.elifesciences.org/articles/71931/elife-71931-fig4-data1-v1.xlsx
-
Figure 4—source data 2
Related to Figure 4B.
- https://cdn.elifesciences.org/articles/71931/elife-71931-fig4-data2-v1.xlsx
-
Figure 4—source data 3
Related to Figure 4C.
- https://cdn.elifesciences.org/articles/71931/elife-71931-fig4-data3-v1.xlsx
Figure 5
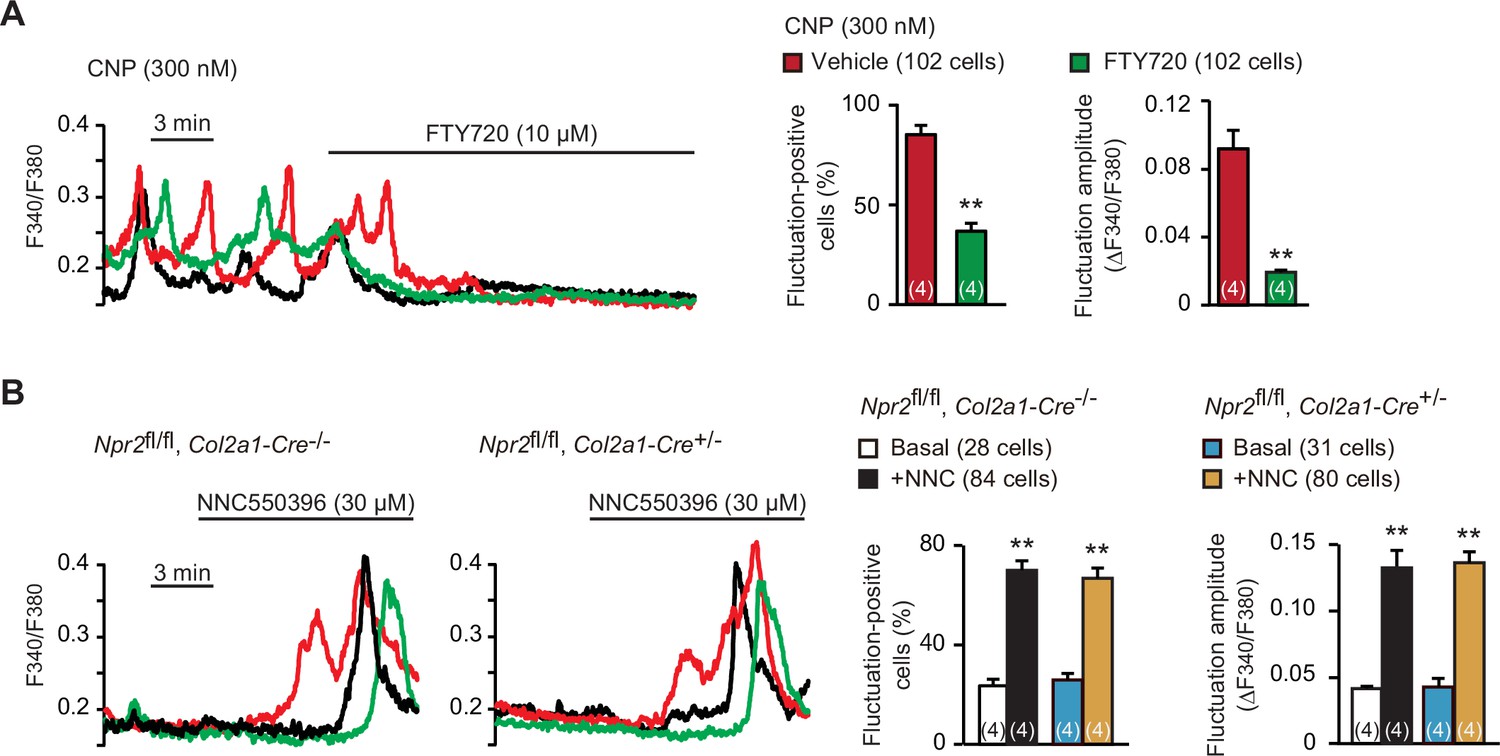
Enhanced TRPM7-mediated Ca2+ entry by C-type natriuretic peptide (CNP) treatments.
(A) Inhibition of CNP-facilitated Ca2+ fluctuations by the TRPM7 inhibitor FTY720 in round chondrocytes. Wild-type bone slices were pretreated with CNP, and then subjected to Ca2+ imaging. Representative recording traces are shown (left panel), and the effects of FTY720 are summarized (right graphs). Significant FTY720-induced shifts are marked with asterisks (**p < 0.01 in t-test). The data are presented as the means ± standard error of the mean (SEM) with n values indicating the number of examined mice. (B) Ca2+ fluctuations facilitated by the TRPM7 channel activator NNC550396 in Npr2-deficient round chondrocytes. Bone slices were prepared from the chondrocyte-specific Npr2-knockout and control embryos, and NNC550396-induced effects were examined in Ca2+ imaging. Representative recording traces are shown (left panels) and the effects of NNC550396 on Ca2+ fluctuations are summarized (right graphs). Significant NNC550396-induced shifts in each genotype are marked with asterisks (**p < 0.01 in one-way analysis of variance [ANOVA] and Tukey’s test). The data are presented as the means ± SEM with n values indicating the number of examined mice.
-
Figure 5—source data 1
Related to Figure 5A.
- https://cdn.elifesciences.org/articles/71931/elife-71931-fig5-data1-v1.xlsx
-
Figure 5—source data 2
Related to Figure 5B.
- https://cdn.elifesciences.org/articles/71931/elife-71931-fig5-data2-v1.xlsx
Figure 6
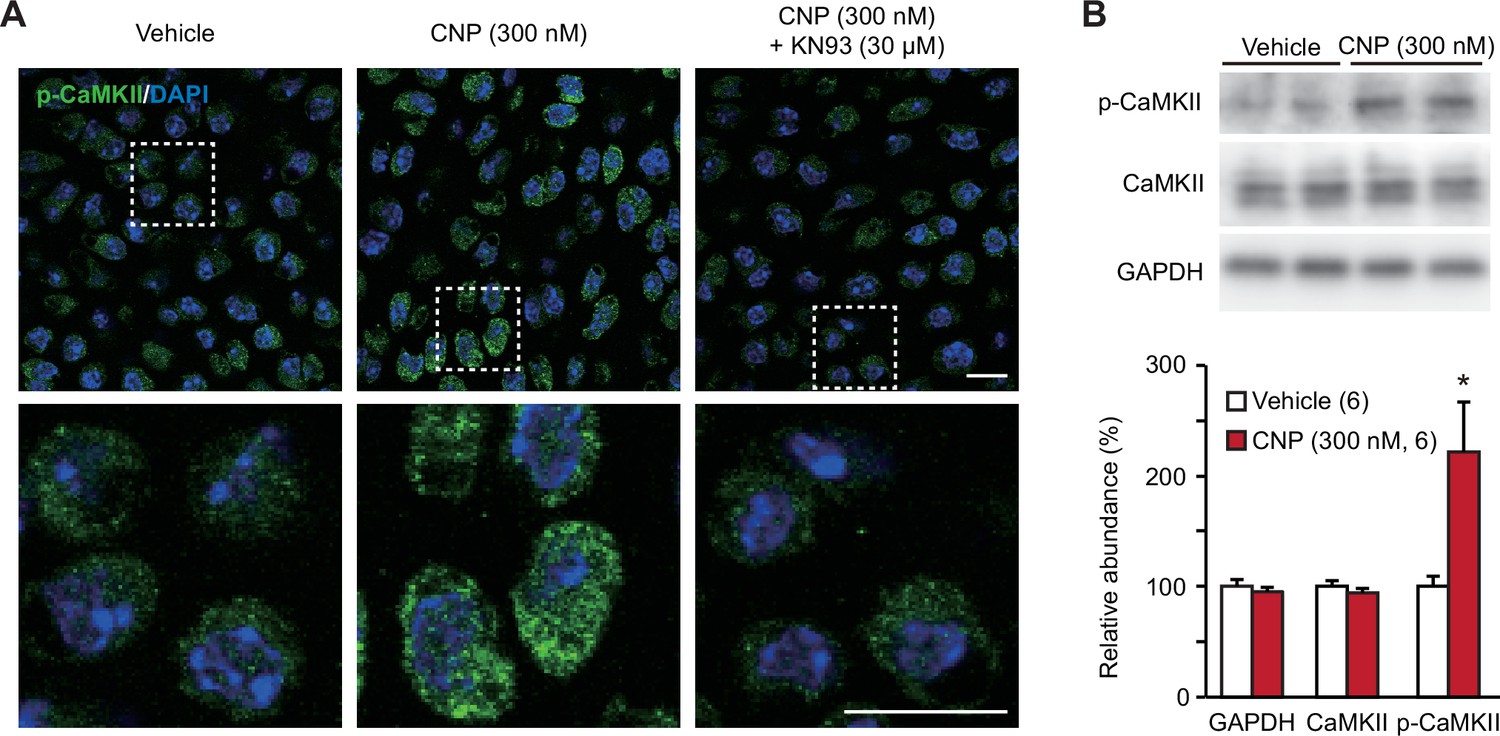
CaMKII activation in C-type natriuretic peptide (CNP)-treated round chondrocytes.
(A) Immunohistochemical staining against phospho-CaMKII (p-CaMKII) in round chondrocytes. Wild-type bone slices were pretreated with or without CNP and the CaMKII inhibitor KN93, and then subjected to immunostaining with antibody to p-CaMKII. DAPI (4′,6-diamidino-2-phenylindole) was used for nuclear staining. Lower panels show high-magnification views of white-dotted regions in upper panels (scale bars, 10 μm). (B) Immunoblot analysis of total CaMKII and p-CaMKII in growth plate cartilage. Growth plate lysates were prepared from wild-type bone slices pretreated with or without CNP, and subjected to immunoblot analysis with antibodies against total CaMKII and p-CaMKII (upper panel). Glyceraldehyde-3-phosphate dehydrogenase (GAPDH) was also analyzed as a loading control. The immunoreactivities observed were densitometrically quantified and are summarized (lower graph). A significant difference between CNP- and vehicle pretreatments is marked with an asterisk (*p < 0.05 in one-way analysis of variance [ANOVA] and Tukey’s test). The data are presented as the means ± standard error of the mean (SEM) with n values indicating the number of examined mice.
-
Figure 6—source data 1
Related to Figure 6B.
- https://cdn.elifesciences.org/articles/71931/elife-71931-fig6-data1-v1.zip
-
Figure 6—source data 2
Related to Figure 6B.
- https://cdn.elifesciences.org/articles/71931/elife-71931-fig6-data2-v1.xlsx
Figure 7 with 2 supplements
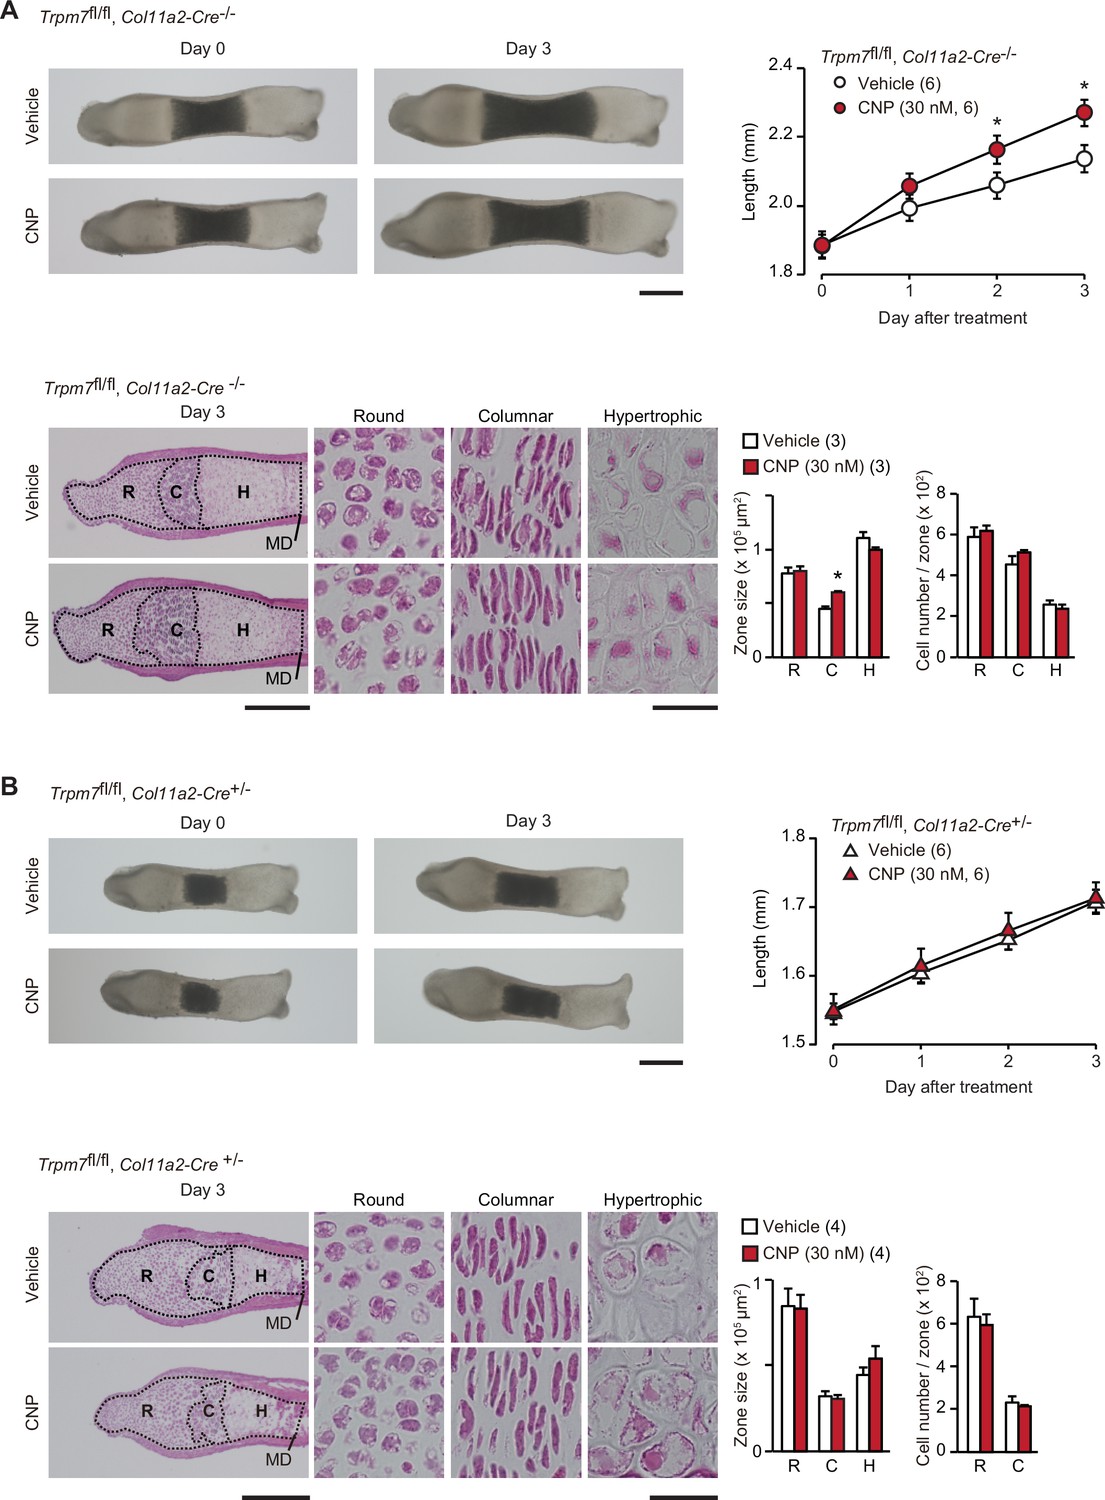
Contribution of TRPM7 channel to C-type natriuretic peptide (CNP)-facilitated bone outgrowth.
Loss of CNP-facilitated outgrowth in Trpm7-deficient bones. Metatarsal rudiments isolated from control (Trpm7fl/fl, Col11a2-Cre−/−) embryos (A) and chondrocyte-specific Trpm7-knockout (Trpm7fl/fl, Col11a2-Cre+/−) embryos (B) were precultured in normal medium for 6 days, and then cultured in medium supplemented with or without CNP for 3 days. Representative images of cultured metatarsals are shown (upper left panels; scale bar, 0.3 mm), and longitudinal bone outgrowth during the CNP-supplemented period was statistically analyzed in each genotype group (upper right graphs). Growth plate images in longitudinal sections of 3-day cultured bones with or without CNP treatments are presented in lower left panels (scale bar, 0.3 mm), and their high-magnification views in the round (R), columnar (C), and hypertrophic (H) chondrocyte zones are shown in lower right panels (scale bar, 30 μm). MD, mid-diaphysis. Summary of graphical representations of zonal sizes containing round, columnar, and hypertrophic chondrocytes and number of cells in each zone is shown in lower right graphs. Significant CNP-supplemented effects are marked with asterisks (*p < 0.05 in t-test). The data are presented as the means ± standard error of the mean (SEM) with n values indicating the number of examined mice.
-
Figure 7—source data 1
Related to Figure 7A.
- https://cdn.elifesciences.org/articles/71931/elife-71931-fig7-data1-v1.xlsx
-
Figure 7—source data 2
Related to Figure 7B.
- https://cdn.elifesciences.org/articles/71931/elife-71931-fig7-data2-v1.xlsx
Figure 7—figure supplement 1
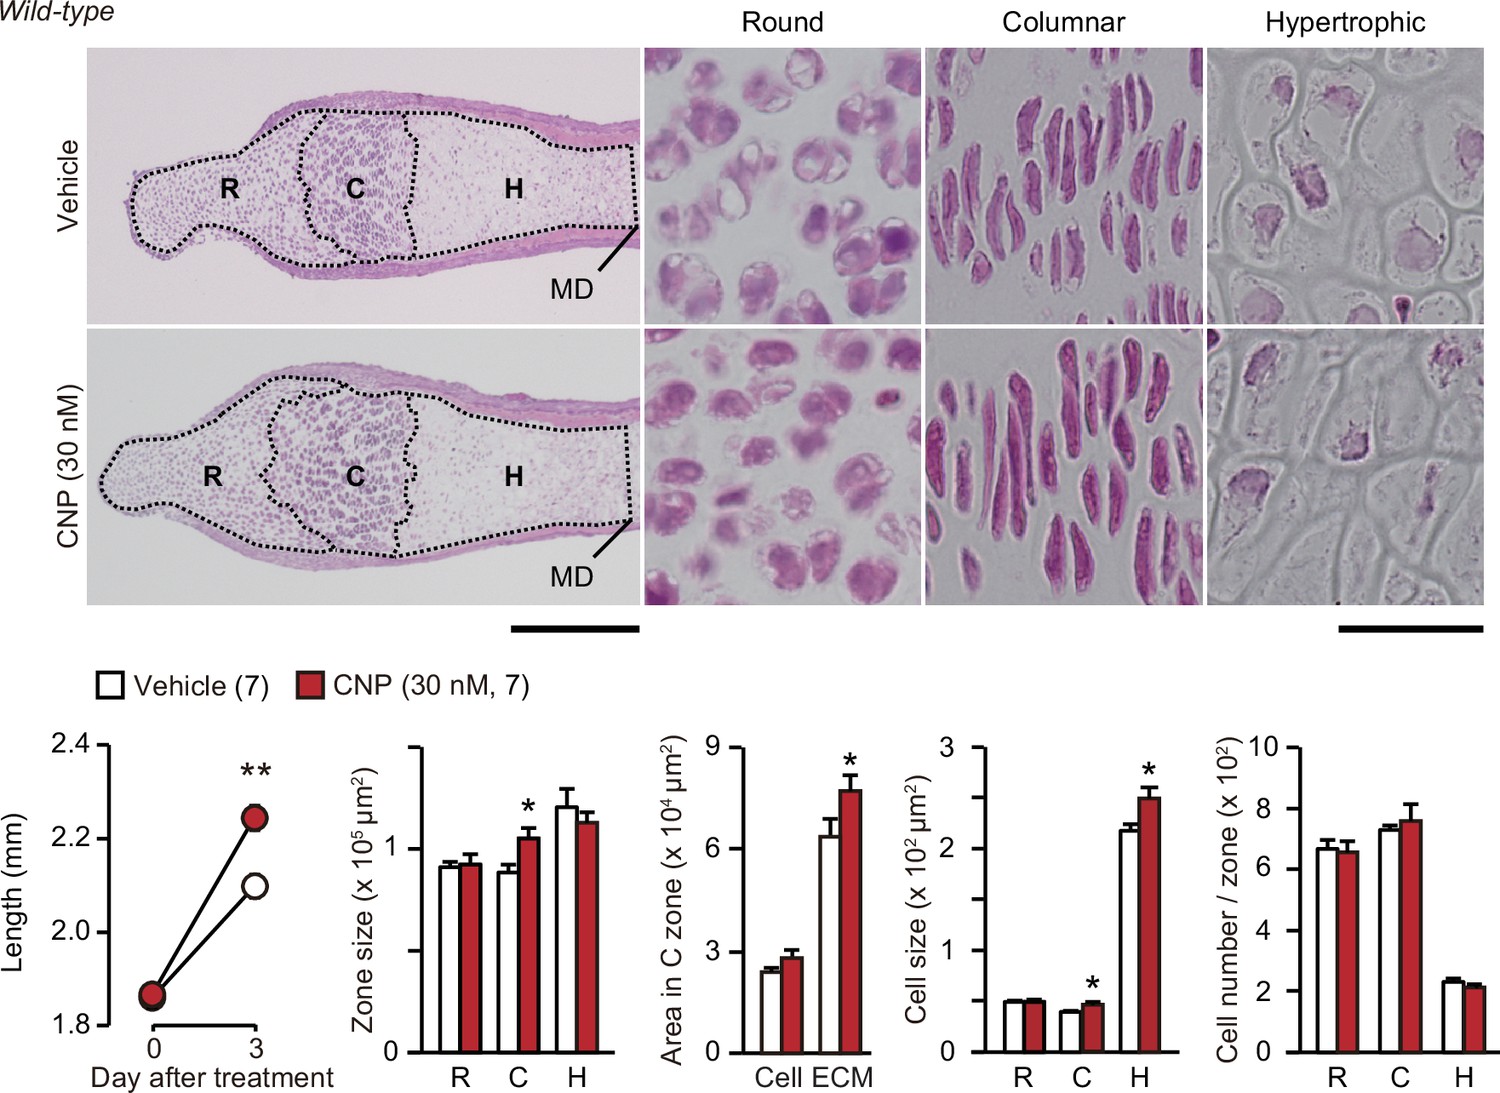
Histological analysis of metatarsal bones treated with C-type natriuretic peptide (CNP).
Metatarsal bones isolated from wild-type embryos were precultured in normal medium for 6 days, and then cultured in medium supplemented with or without CNP (30 nM) for 3 days. Longitudinal sections of cultured bones on day 3 after the CNP treatment are shown in upper left panels (scale bar, 0.3 mm), and high-magnification views of the round (R), columnar (C), and hypertrophic (H) chondrocyte zones in upper right panels (scale bar, 30 μm). MD, mid-diaphysis. Longitudinal bone outgrowth during the CNP-supplemented period was statistically analyzed in each group to present in the lower left graph. Histological observations are summarized in the lower right graphs; the zonal sizes, cellular (Cell) and extracellular matrix (ECM) areas within the columnar cell zone, cell sizes, and cell numbers were statistically analyzed. Data represent means ± standard error of the mean (SEM), and the numbers of mice examined are shown in parentheses in the keys. Significant differences between the groups are marked with asterisks (*p < 0.05, **p < 0.01 in t-test).
-
Figure 7—figure supplement 1—source data 1
Related to Figure 7—figure supplement 1.
- https://cdn.elifesciences.org/articles/71931/elife-71931-fig7-figsupp1-data1-v1.xlsx
Figure 7—figure supplement 2
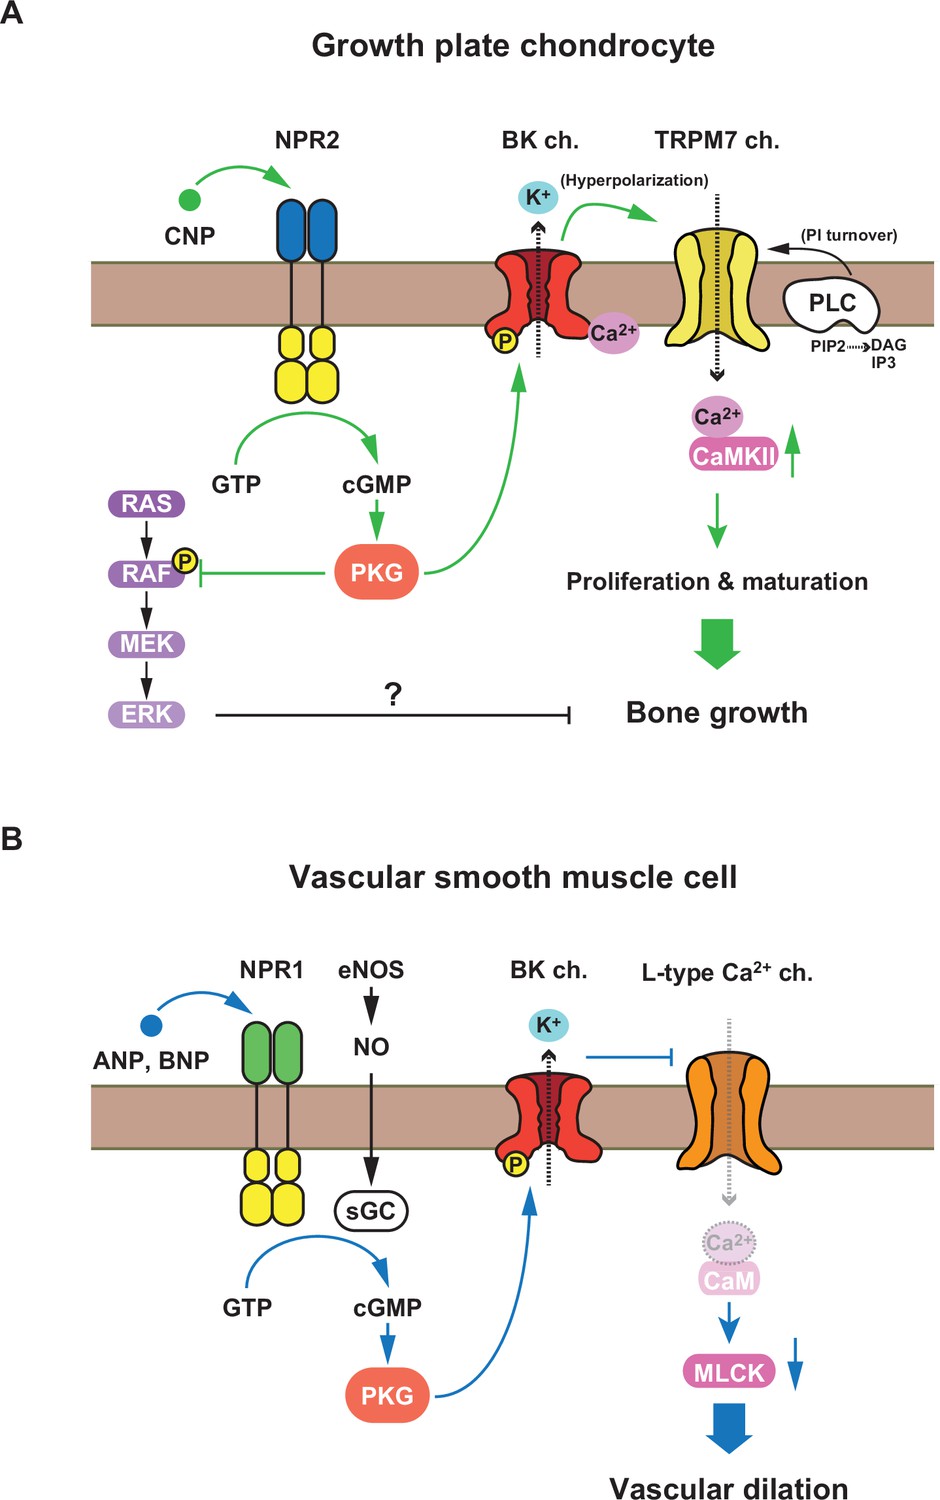
Proposed C-type natriuretic peptide (CNP)-evoked signaling in growth plate chondrocytes.
(A) The schematic diagram representing the NPR2-PKG-BK channel–TRPM7 channel–CaMKII axis proposed as an essential CNP signaling cascade in growth plate chondrocytes. Previous studies proposed that the RAF–MEK–ERK axis is also involved in growth plate CNP signaling (Krejci et al., 2005). (B) The schematic diagram representing the nitric oxide (NO- and atrial natriuretic peptide) (ANP)/brain natriuretic peptide (BNP)-induced relaxation signaling in vascular smooth muscle.
Figure 8
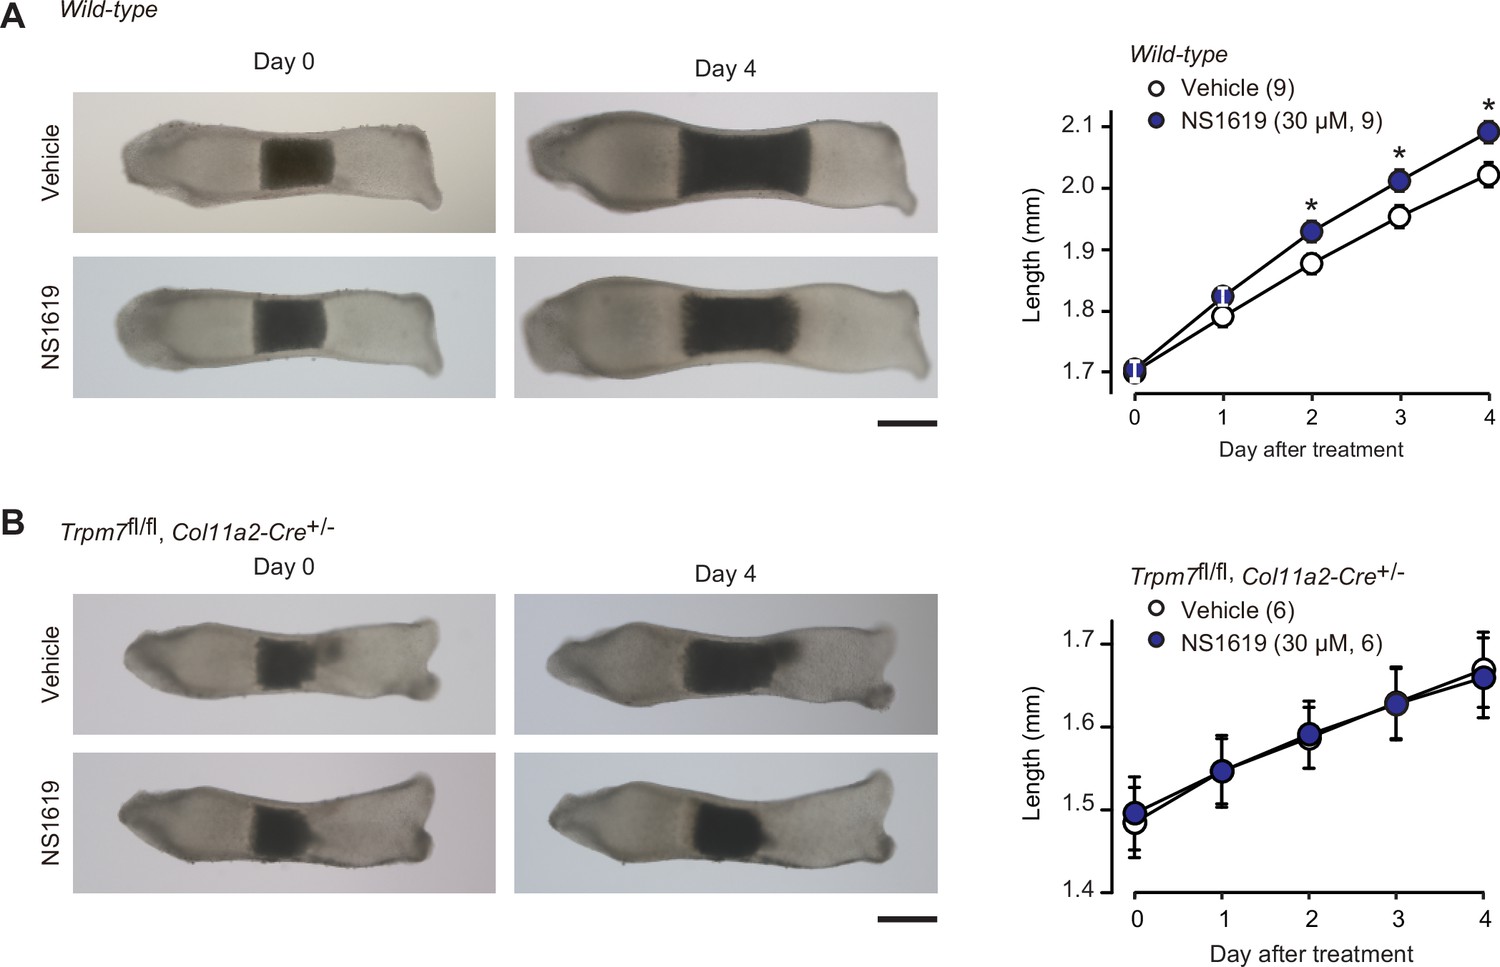
Facilitated bone outgrowth by BK channel activator.
Stimulated bone outgrowth by the BK channel activator NS1619. Metatarsal rudiments isolated from wild-type (A) and the chondrocyte-specific Trpm7-knockout embryos (B) were precultured in normal medium for 5 days, and then cultured in medium supplemented with or without NS1619 for 4 days. Representative images of cultured metatarsals are shown (left panels; scale bar, 0.3 mm), and longitudinal bone outgrowth during the NS1619-supplemented period was statistically analyzed in each genotype group (right graphs). A significant NS1619-supplemented effect is marked with asterisks (*p < 0.05 in t-test). The data are presented as the means ± standard error of the mean (SEM) with n values indicating the number of examined mice.
-
Figure 8—source data 1
Related to Figure 8A.
- https://cdn.elifesciences.org/articles/71931/elife-71931-fig8-data1-v1.xlsx
-
Figure 8—source data 2
Related to Figure 8B.
- https://cdn.elifesciences.org/articles/71931/elife-71931-fig8-data2-v1.xlsx
Author response image 1
Total RNAs were prepared from growth plate sections packed with round chondrocytes or enriched with columnar and hypertrophic chondrocytes from wild-type mice and subjected to quantitative RT-PCR analysis.
The data represent the mean ± SEM, and the numbers of mice examined are shown in parentheses. Significant differences between the growth plate sections are marked with asterisks (*p<0.05 and **p<0.01 in t-test).
Author response image 2
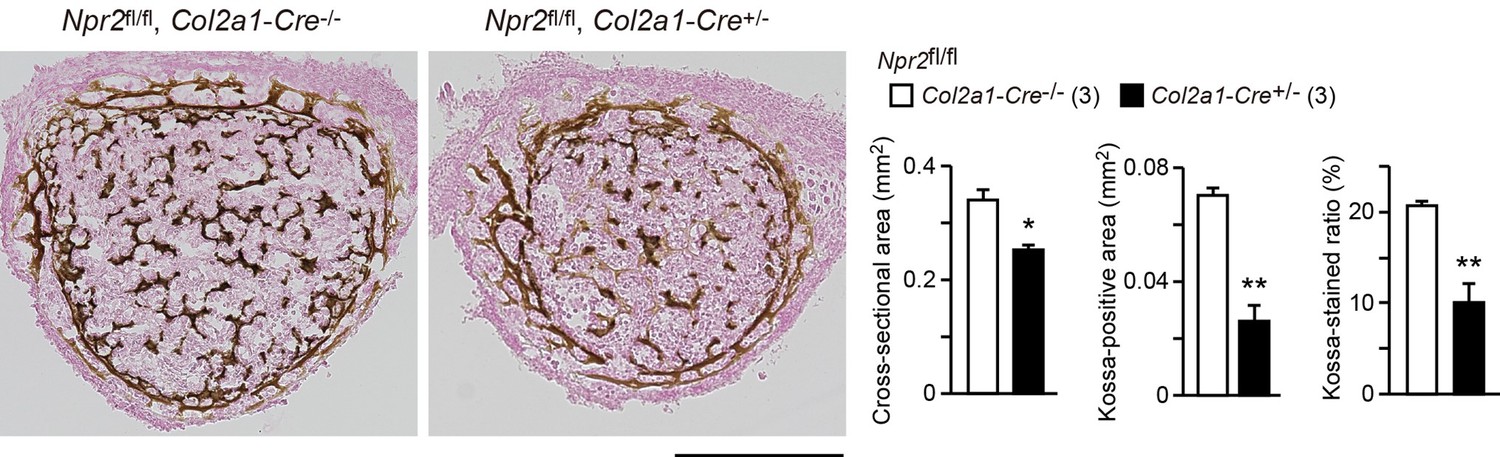
Impaired bone mineralization in the chondrocyte-specific Npr2-knockout embryos.
Kossa-stained mid-cross sections of femoral bones from the chondrocyte-specific Npr2-knockout (Npr2fl/fl, Col2a1-Cre+/-) and control (Npr2fl/fl, Col2a1-Cre-/-) E17.5 embryos. Scale bar, 0.3 mm. Both the cross-sectional area and Kossa-positive area were determined from digitalized images, and the Kossa-positive fraction in the cross-sectional area (Kossa-stained ratio) was calculated (graphs). n values represent the numbers of mice examined and are shown in parentheses. Significant differences between the groups are marked with asterisks (*p< 0.05, **p<0.01 in t-test).
Author response image 3
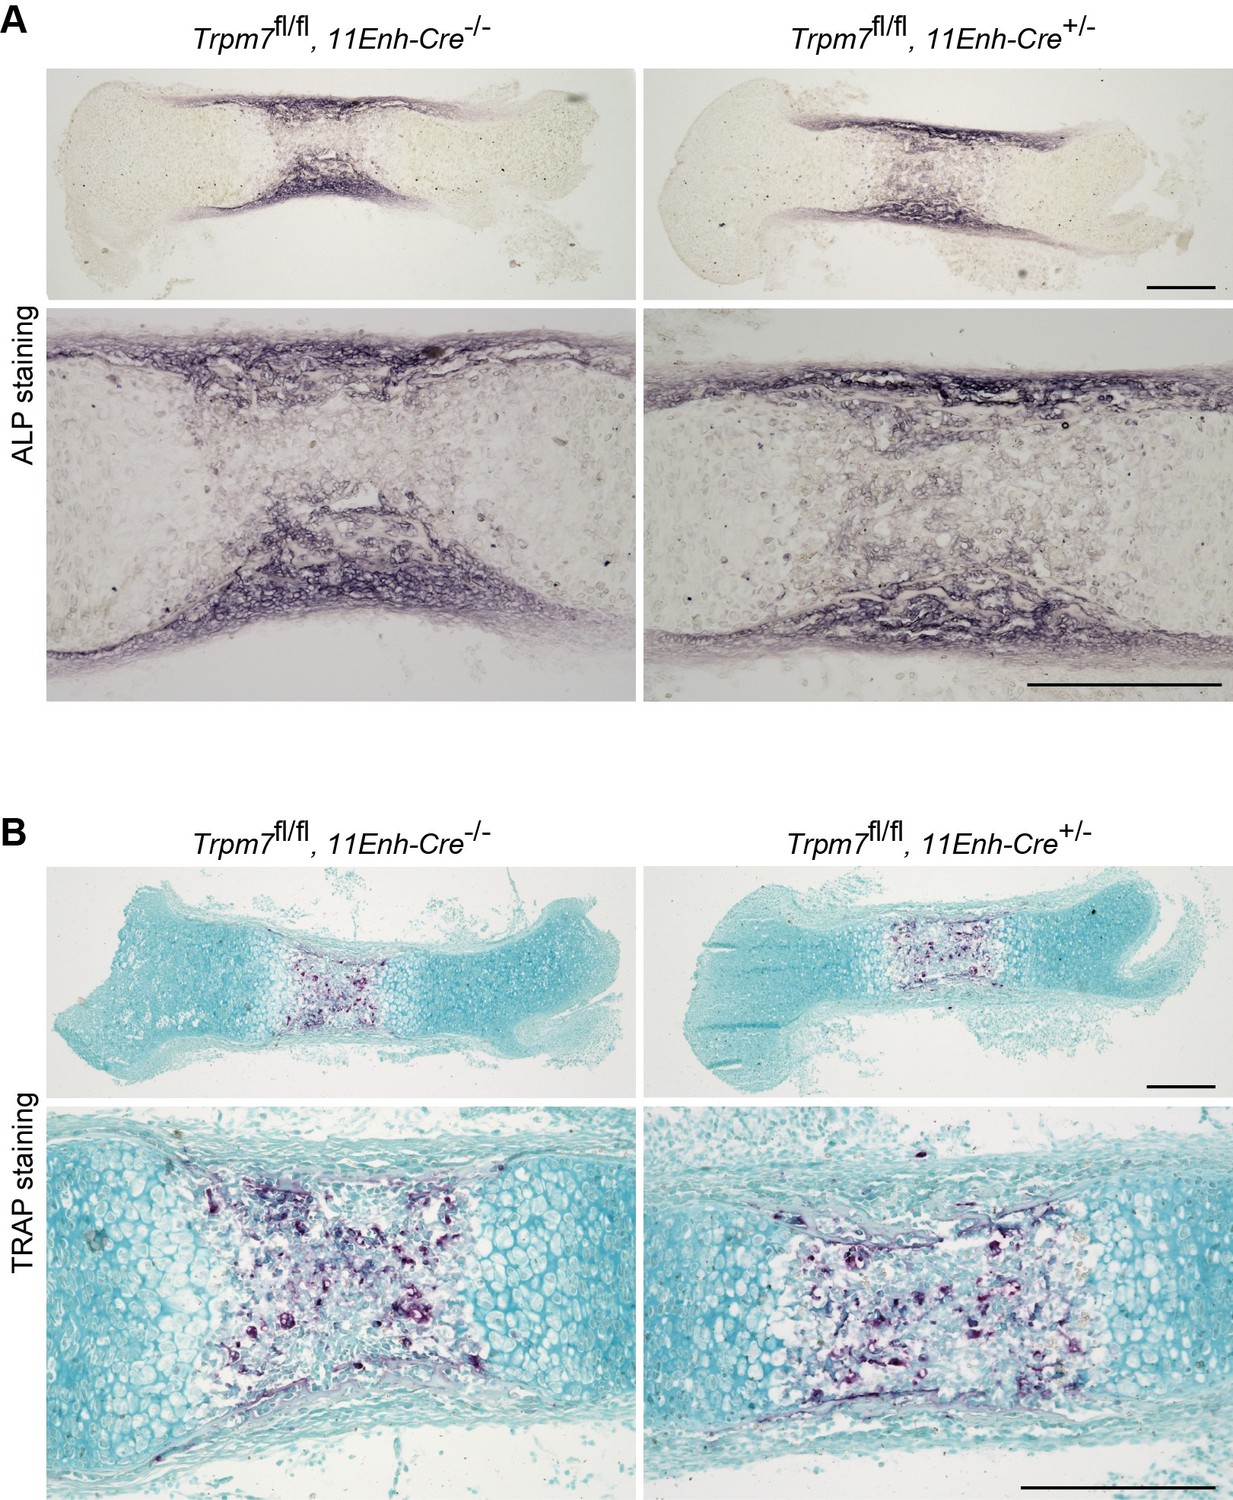
Histological analysis in femoral bone of chondrocyte-specific Trpm7-knockout mice.
Histological analysis of osteoblasts (ALP staining, A) and osteoclasts (TRAP staining, B) in longitudinal sections of femurs from the chondrocyte-specific Trpm7-knockout (Trpm7fl/fl, 11Enh-Cre+/-) and control (Trpm7fl/fl, 11Enh-Cre-/-) E15.5 embryos. Higher-magnification views are also shown in the lower panels. Scale bar, 0.3 mm.
Tables
Key resources table
| Reagent type (species) or resource | Designation | Source or reference | Identifiers | Additional information |
|---|---|---|---|---|
| Strain, strain background (Mus musculus) | Mouse: C57BL/6J | The Jackson Laboratory | Jax: 000664 | |
| Strain, strain background (Mus musculus) | Trpm7fl/fl, Col11a2-Cre mice | Qian et al., 2019 | N/A | |
| Strain, strain background (Mus musculus) | Npr2fl/fl, Col2a1-Cre mice | Nakao et al., 2015 | N/A | |
| Antibody | Anti-phospho-CaMKII (Thr 286) (Rabbit monoclonal) | Cell Signaling Technology | Cat#12716; RRID: AB_2713889 | IF (1:200)WB (1:1000) |
| Antibody | Anti-CaMKII (Rabbit monoclonal) | Abcam | Cat#EP1829Y; RRID: AB_868641 | WB (1:1000) |
| Antibody | Anti-GAPDH (Rabbit polyclonal) | Sigma-Aldrich | Cat#G9545; RRID: AB_796208 | WB (1:10,000) |
| Antibody | Anti-rabbit IgG-HRP (Mouse monoclonal) | Santa Cruz | Cat#sc-2357; RRID: AB_628497 | 1:2000 |
| Antibody | Anti-rabbit Alexa Flour 488 (Goat polyclonal) | Invitrogen | Cat#A-11008; RRID: AB_143165 | 1:50 |
| Sequence-based reagent | Mouse Npr1_F | This paper | PCR primers | AACAAGGAGAACAGCAGCAAC |
| Sequence-based reagent | Mouse Npr1_R | This paper | PCR primers | TATCAAATGCCTCAGCCTGGA |
| Sequence-based reagent | Mouse Npr2_F | This paper | PCR primers | GGCCCCATCCCTGATGAAC |
| Sequence-based reagent | Mouse Npr2_R | This paper | PCR primers | CCTGGTACCCCCTTCCTGTA |
| Sequence-based reagent | Mouse Npr3_F | This paper | PCR primers | GGTATGGGGACTTCTCTGTG |
| Sequence-based reagent | Mouse Npr3_R | This paper | PCR primers | TCTGGTCTCATCTAGTCTCA |
| Sequence-based reagent | FlFor | This paper | PCR primers | GTAACCTGGGTAGACTAGTTGTTGG |
| Sequence-based reagent | DelFor | This paper | PCR primers | TGTTATTTTGTGAGATGACG |
| Sequence-based reagent | Rev | This paper | PCR primers | ATGGTGGAGGAGGTCTTTAATTCC |
| Sequence-based reagent | Col2a1-Cre_F | This paper | PCR primers | CGTTGTGAGTTGGATAGTTG |
| Sequence-based reagent | Col2a1-Cre_R | This paper | PCR primers | CATTGCTGTCACTTGGTCGT |
| Sequence-based reagent | Mouse Prkg1_F | This paper | PCR primers | ATGGACTTTTTGTGGGACTC |
| Sequence-based reagent | Mouse Prkg1_R | This paper | PCR primers | GGTTTTCATTGGATCTGGGC |
| Sequence-based reagent | Mouse Prkg2_F | This paper | PCR primers | TTGCGGAAGAAAATGATGTCG |
| Sequence-based reagent | Mouse Prkg2_R | This paper | PCR primers | GAATGGGGAGGTTGAGGAGAA |
| Sequence-based reagent | Mouse Kcnma_F | Liu et al., 2021 | PCR primers | AATGCACTTCGAGGAGGCTA |
| Sequence-based reagent | Mouse Kcnma_R | Liu et al., 2021 | PCR primers | CTCAGCCGGTAAATTCCAAA |
| Sequence-based reagent | Mouse Kcnmb1_F | This paper | PCR primers | ACAACTGTGCTGCCCCTCTA |
| Sequence-based reagent | Mouse Kcnmb1_R | This paper | PCR primers | CACTGTTGGTTTTGATCCCG |
| Sequence-based reagent | Mouse Kcnmb2_F | This paper | PCR primers | TCAGGAGACACCAACACTTC |
| Sequence-based reagent | Mouse Kcnmb2_R | This paper | PCR primers | AGTTAGTTTCACCATAGCAA |
| Sequence-based reagent | Mouse Kcnmb3_F | This paper | PCR primers | GTGGATGACGGGCTGGACTT |
| Sequence-based reagent | Mouse Kcnmb3_R | This paper | PCR primers | GCACTTGGGGTTGGTCCTGA |
| Sequence-based reagent | Mouse Kcnmb4_F | This paper | PCR primers | CTCCTGACCAACCCCAAGT |
| Sequence-based reagent | Mouse Kcnmb4_R | This paper | PCR primers | TAAAATAGCAAGTGAATGGC |
| Sequence-based reagent | Mouse Kcnn1_F | Liu et al., 2021 | PCR primers | TCAAAAATGCTGCTGCAAAC |
| Sequence-based reagent | Mouse Kcnn1_R | Liu et al., 2021 | PCR primers | TCGTTCACCTTCCCTTGTTC |
| Sequence-based reagent | Mouse Kcnn2_F | Liu et al., 2021 | PCR primers | GATCTGGCAAAGACCCAGAA |
| Sequence-based reagent | Mouse Kcnn2_R | Liu et al., 2021 | PCR primers | GAAGTCCCTTTGCTGCTGTC |
| Sequence-based reagent | Mouse Kcnn3_F | Liu et al., 2021 | PCR primers | ACTTCAACACCCGATTCGTC |
| Sequence-based reagent | Mouse Kcnn3_R | Liu et al., 2021 | PCR primers | GGAAAGGAACGTGATGGAGA |
| Sequence-based reagent | Mouse Kcnn4_F | Liu et al., 2021 | PCR primers | GGCACCTCACAGACACACTG |
| Sequence-based reagent | Mouse Kcnn4_R | Liu et al., 2021 | PCR primers | TTTCTCCGCCTTGTTGAACT |
| Sequence-based reagent | Mouse Plcb1_F | Yamazaki et al., 2011 | PCR primers | CCCAAGTTGCGTGAACTTCT |
| Sequence-based reagent | Mouse Plcb1_R | Yamazaki et al., 2011 | PCR primers | GTTGCCAAGCTGAAAACCTC |
| Sequence-based reagent | Mouse Plcb2_F | Yamazaki et al., 2011 | PCR primers | ACATCCAGGAAGTGGTCCAG |
| Sequence-based reagent | Mouse Plcb2_R | Yamazaki et al., 2011 | PCR primers | CGCACCGACTCCTTTACTTC |
| Sequence-based reagent | Mouse Plcb3_F | Yamazaki et al., 2011 | PCR primers | CAGGCCAGCACAGAGACATA |
| Sequence-based reagent | Mouse Plcb3_R | Yamazaki et al., 2011 | PCR primers | AGGATGCTGGCAATCAAATC |
| Sequence-based reagent | Mouse Plcg1_F | This paper | PCR primers | AACGCTTTGAGGACTGGAGA |
| Sequence-based reagent | Mouse Plcg1_R | This paper | PCR primers | CTCCTCAATCTCTCGCAAGG |
| Sequence-based reagent | Mouse Plcg2_F | This paper | PCR primers | AACCCCAACCCACACGAGTC |
| Sequence-based reagent | Mouse Plcg2_R | This paper | PCR primers | AATGTTTCACCTTGCCCCTG |
| Sequence-based reagent | Mouse Trpm7_F | Qian et al., 2019 | PCR primers | ATTGCTTAGTTTTGGTGTTC |
| Sequence-based reagent | Mouse Trpm7_R | Qian et al., 2019 | PCR primers | GATTGTCGGGAGAGTGGAGT |
| Sequence-based reagent | Mouse Camk2a_F | This paper | PCR primers | CACCACCATTGAGGACGAAG |
| Sequence-based reagent | Mouse Camk2a_R | This paper | PCR primers | GGTTCAAAGGCTGTCATTCC |
| Sequence-based reagent | Mouse Camk2b_F | This paper | PCR primers | AAGCAGATGGAGTCAAGCC |
| Sequence-based reagent | Mouse Camk2b_R | This paper | PCR primers | TGCTGTCGGAAGATTCCAGG |
| Sequence-based reagent | Mouse Camk2d_F | This paper | PCR primers | GATAAACAACAAAGCCAACG |
| Sequence-based reagent | Mouse Camk2d_R | This paper | PCR primers | GTAAGCCTCAAAGTCCCCAT |
| Sequence-based reagent | Mouse Camk2g_F | This paper | PCR primers | CAAGAACAGCAAGCCTATCC |
| Sequence-based reagent | Mouse Camk2g_R | This paper | PCR primers | CCTCTGACTGACTGGTGCGA |
| Sequence-based reagent | Mouse Pde2a_F | This paper | PCR primers | ATCTTTGACCACTTCTCTCG |
| Sequence-based reagent | Mouse Pde2a_R | This paper | PCR primers | CATAACCCACTTCAGCCATC |
| Sequence-based reagent | Mouse Pde3a_F | This paper | PCR primers | AACTATACCTGCTCGGACTC |
| Sequence-based reagent | Mouse Pde3a_R | This paper | PCR primers | TTCGTGCGGCTTTATGCTGG |
| Sequence-based reagent | Mouse Pde3b_F | This paper | PCR primers | ATTCCAAAGCAGAGGTCATC |
| Sequence-based reagent | Mouse Pde3b_R | This paper | PCR primers | GTTAGAGAGCCAGCAGACAC |
| Sequence-based reagent | Mouse Pde5a_F | This paper | PCR primers | GACCCTTGCGTTGCTCATTG |
| Sequence-based reagent | Mouse Pde5a_R | This paper | PCR primers | TGATGGAGTGACAGTACAGC |
| Sequence-based reagent | Mouse Pde6a_F | This paper | PCR primers | AACCCACCCGCTGACCACTG |
| Sequence-based reagent | Mouse Pde6a_R | This paper | PCR primers | CTCTTCCTTCTTGTTGACGA |
| Sequence-based reagent | Mouse Pde6b_F | This paper | PCR primers | TCCGGGCCTATCTAAACTGC |
| Sequence-based reagent | Mouse Pde6b_R | This paper | PCR primers | AGAAGACAATTTCCCGGCCAT |
| Sequence-based reagent | Mouse Pde6c_F | This paper | PCR primers | TTGCTCAGGAAATGGTTATG |
| Sequence-based reagent | Mouse Pde6c_R | This paper | PCR primers | GAAACAGAACTCGTACAGGT |
| Sequence-based reagent | Mouse Pde6d_F | This paper | PCR primers | CCCAAGAAAATCCTCAAGTG |
| Sequence-based reagent | Mouse Pde6d_R | This paper | PCR primers | ACAAAGCCAAACTCGAAGAA |
| Sequence-based reagent | Mouse Pde6g_F | This paper | PCR primers | AAGGGTGAGATTCGGTCAGC |
| Sequence-based reagent | Mouse Pde6g_R | This paper | PCR primers | TCATCCCCAAACCCTTGCAC |
| Sequence-based reagent | Mouse Pde6h_F | This paper | PCR primers | GGCAGACTCGACAGTTCAAGA |
| Sequence-based reagent | Mouse Pde6h_R | This paper | PCR primers | CTCCAGATGGCTGAACGCT |
| Sequence-based reagent | Mouse Pde10a_F | This paper | PCR primers | CATCCGCAAAGCCATCATCG |
| Sequence-based reagent | Mouse Pde10a_R | This paper | PCR primers | TCTCATCACCCTCAGCCCAG |
| Sequence-based reagent | Mouse Lpar1_F | This paper | PCR primers | GCTTGGTGCCTTTATTGTCT |
| Sequence-based reagent | Mouse Lpar1_R | This paper | PCR primers | GGTAGGAGTAGATGATGGGG |
| Sequence-based reagent | Mouse Lpar2_F | This paper | PCR primers | AGTGTGCTGGTATTGCTGAC |
| Sequence-based reagent | Mouse Lpar2_R | This paper | PCR primers | TTTGATGGAGAGCCTGGCAG |
| Sequence-based reagent | Mouse Lpar3_F | This paper | PCR primers | ACTTTCCCTTCTACTACCTG |
| Sequence-based reagent | Mouse Lpar3_R | This paper | PCR primers | GTCTTTCCACAGCAATAACC |
| Sequence-based reagent | Mouse Lpar4_F | This paper | PCR primers | CCTCAGTGGTGGTATTTCAG |
| Sequence-based reagent | Mouse Lpar4_R | This paper | PCR primers | CACAGAAGAACAAGAAACAT |
| Sequence-based reagent | Mouse Lpar5_F | This paper | PCR primers | AACACGACTTCTACCAACAG |
| Sequence-based reagent | Mouse Lpar5_R | This paper | PCR primers | AAGACCCAGAGAGCCAGAGC |
| Sequence-based reagent | Mouse Lpar6_F | This paper | PCR primers | TACTTTGCCATTTCGGATTT |
| Sequence-based reagent | Mouse Lpar6_R | This paper | PCR primers | GCACTTCCTCCCATCACTGT |
| Sequence-based reagent | Mouse Atp2a1_F | Liu et al., 2021 | PCR primers | CAAAACAGGGACCCTCACCA |
| Sequence-based reagent | Mouse Atp2a1_R | Liu et al., 2021 | PCR primers | GCCAGTGATGGAGAACTCGT |
| Sequence-based reagent | Mouse Atp2a2_F | Liu et al., 2021 | PCR primers | AAACCAGATGTCCGTGTGCA |
| Sequence-based reagent | Mouse Atp2a2_R | Liu et al., 2021 | PCR primers | TGATGGCACTTCACTGGCTT |
| Sequence-based reagent | Mouse Atp2a3_F | Liu et al., 2021 | PCR primers | CCTCGGTCATCTGCTCTGAC |
| Sequence-based reagent | Mouse Atp2a3_R | Liu et al., 2021 | PCR primers | CGTGGTACCCGAAATGGTGA |
| Sequence-based reagent | Mouse Pln_F | This paper | PCR primers | TACCTCACTCGCTCGGCTAT |
| Sequence-based reagent | Mouse Pln_R | This paper | PCR primers | TGACGGAGTGCTCGGCTTTA |
| Sequence-based reagent | Mouse Sox9_F | Qian et al., 2019 | PCR primers | AGGAAGCTGGCAGACCAGTA |
| Sequence-based reagent | Mouse Sox9_R | Qian et al., 2019 | PCR primers | CGTTCTTCACCGACTTCCTC |
| Sequence-based reagent | Mouse Sox5_F | Qian et al., 2019 | PCR primers | CTCGCTGGAAAGCTATGACC |
| Sequence-based reagent | Mouse Sox5_R | Qian et al., 2019 | PCR primers | GATGGGGATCTGTGCTTGTT |
| Sequence-based reagent | Mouse Sox6_F | Qian et al., 2019 | PCR primers | GGATTGGGGAGTACAAGCAA |
| Sequence-based reagent | Mouse Sox6_R | Qian et al., 2019 | PCR primers | CATCTGAGGTGATGGTGTGG |
| Sequence-based reagent | Mouse Runx2_F | Qian et al., 2019 | PCR primers | GCCGGGAATGATGAGAACTA |
| Sequence-based reagent | Mouse Runx2_R | Qian et al., 2019 | PCR primers | GGACCGTCCACTGTCACTTT |
| Sequence-based reagent | Mouse Pthlh_F | Qian et al., 2019 | PCR primers | CTCCCAACACCAAAAACCAC |
| Sequence-based reagent | Mouse Pthlh_R | Qian et al., 2019 | PCR primers | GCTTGCCTTTCTTCTTCTTC |
| Sequence-based reagent | Mouse Acan_F | Qian et al., 2019 | PCR primers | CCTCACCATCCCCTGCTACT |
| Sequence-based reagent | Mouse Acan_R | Qian et al., 2019 | PCR primers | ACTTGATTCTTGGGGTGAGG |
| Sequence-based reagent | Mouse Col10a1_F | Qian et al., 2019 | PCR primers | CAAGCCAGGCTATGGAAGTC |
| Sequence-based reagent | Mouse Col10a1_R | Qian et al., 2019 | PCR primers | AGCTGGGCCAATATCTCCTT |
| Sequence-based reagent | Mouse Col2a1_F | Qian et al., 2019 | PCR primers | CACACTGGTAAGTGGGGCAAGACCG |
| Sequence-based reagent | Mouse Col2a1_R | Qian et al., 2019 | PCR primers | GGATTGTGTTGTTTCAGGGTTCGGG |
| Sequence-based reagent | Mouse 18 S_F | Qian et al., 2019 | PCR primers | AGACAAATCGCTCCACCAAC |
| Sequence-based reagent | Mouse 18 S_R | Qian et al., 2019 | PCR primers | CTCAACACGGGAAACCTCAC |
| Sequence-based reagent | Mouse Actb_F | Qian et al., 2019 | PCR primers | CATCCGTAAAGACCTCTATGCCAAC |
| Sequence-based reagent | Mouse Actb_R | Qian et al., 2019 | PCR primers | ATGGAGCCACCGATCCACA |
| Sequence-based reagent | Mouse Gapdh_F | Qian et al., 2019 | PCR primers | TGTGTCCGTCGTGGATCTGA |
| Sequence-based reagent | Mouse Gapdh_R | Qian et al., 2019 | PCR primers | TTGCTGTTGAAGTCGCAGGAG |
| Peptide, recombinant protein | ANP (Human, 1–28) | Peptide Institute | Cat#4135 | |
| Peptide, recombinant protein | CNP-22 (Human) | Peptide Institute | Cat#4229 | |
| Commercial assay or kit | Amersham ECL Prime Western Blotting Detection Reagent | Cytiva | Cat#RPN2232 | |
| Commercial assay or kit | ISOGEN | NipponGene | Cat#319-90211 | |
| Commercial assay or kit | ReverTra Ace qPCR RT Master Mix with gDNA Remover | TOYOBO | Cat#FSQ-301 | |
| Chemical compound, drug | FTY720 | Sigma-Aldrich | SML0700; CAS: 162359-56-0 | |
| Chemical compound, drug | Fura-2 AM | DOJINDO | F025; CAS: 108964-32-5 | |
| Chemical compound, drug | Hyaluronidase from sheep testes | Sigma-Aldrich | H2126; CAS: 37326-33-3 | |
| Chemical compound, drug | KN93 | WAKO | 115-00641; CAS: 139298-40-1 | |
| Chemical compound, drug | KT5823 | Cayman Chemical | 10010965; CAS: 126643-37-6 | |
| Chemical compound, drug | NNC 550396 dihydrochloride | Tocris Bioscience | 2268; CAS: 357400-13-6 | |
| Chemical compound, drug | NS1619 | Sigma-Aldrich | N170; CAS: 153587-01-0 | |
| Chemical compound, drug | 1-Oleoyl lysophosphatidic acid | Cayman Chemical | 62215: CAS: 325465-93-8 | |
| Chemical compound, drug | Oxonol VI | Sigma-Aldrich | 75926; CAS: 64724-75-0 | |
| Chemical compound, drug | Paxilline | Tocris Bioscience | 2006; CAS: 57186-25-1 | |
| Chemical compound, drug | 8-pCPT-cGMP | Biolog | C009; CAS: 51239-26-0 | |
| Chemical compound, drug | Thapsigargin | Nacalai Tesque | 33637-31; CAS: 67526-95-8 | |
| Chemical compound, drug | U73122 | Sigma-Aldrich | U6756; CAS: 112648-68-7 | |
| Software, algorithm | Adobe Ilustrator | Adobe Systems | http://www.adobe.com/products/illustrator.html | |
| Software, algorithm | GraphPad Prism v7 | GraphPad | https://www.graphpad.com/ | |
| Software, algorithm | ImageJ | N/A | https://imagej.nih.gov/ij/ | |
| Software, algorithm | Leica Application Suite X | Leica MIcrosystems | https://www.leica-microsystems.com/products/microscope-software/p/leica-las-x-ls/ |
Additional files
Download links
A two-part list of links to download the article, or parts of the article, in various formats.
Downloads (link to download the article as PDF)
Open citations (links to open the citations from this article in various online reference manager services)
Cite this article (links to download the citations from this article in formats compatible with various reference manager tools)
C-type natriuretic peptide facilitates autonomic Ca2+ entry in growth plate chondrocytes for stimulating bone growth
eLife 11:e71931.
https://doi.org/10.7554/eLife.71931


