C-type natriuretic peptide facilitates autonomic Ca2+ entry in growth plate chondrocytes for stimulating bone growth
- Graduate School of Pharmaceutical Sciences, Kyoto University, Japan
- Graduate School of Medicine, Kyoto University, Japan
- Graduate School of Engineering, Kyoto University, Japan
- Graduate School of Medicine, Gifu University, Japan
- Medical Innovation Center, Kyoto University, Japan
Abstract
The growth plates are cartilage tissues found at both ends of developing bones, and vital proliferation and differentiation of growth plate chondrocytes are primarily responsible for bone growth. C-type natriuretic peptide (CNP) stimulates bone growth by activating natriuretic peptide receptor 2 (NPR2) which is equipped with guanylate cyclase on the cytoplasmic side, but its signaling pathway is unclear in growth plate chondrocytes. We previously reported that transient receptor potential melastatin-like 7 (TRPM7) channels mediate intermissive Ca2+ influx in growth plate chondrocytes, leading to activation of Ca2+/calmodulin-dependent protein kinase II (CaMKII) for promoting bone growth. In this report, we provide evidence from experiments using mutant mice, indicating a functional link between CNP and TRPM7 channels. Our pharmacological data suggest that CNP-evoked NPR2 activation elevates cellular cGMP content and stimulates big-conductance Ca2+-dependent K+ (BK) channels as a substrate for cGMP-dependent protein kinase (PKG). BK channel-induced hyperpolarization likely enhances the driving force of TRPM7-mediated Ca2+ entry and seems to accordingly activate CaMKII. Indeed, ex vivo organ culture analysis indicates that CNP-facilitated bone growth is abolished by chondrocyte-specific Trpm7 gene ablation. The defined CNP signaling pathway, the NPR2-PKG-BK channel–TRPM7 channel–CaMKII axis, likely pinpoints promising target proteins for developing new therapeutic treatments for divergent growth disorders.
Editor's evaluation
With the new additional data and descriptions, the paper in its current state is well organized and data presented add a new information on the role of C-type natriuretic peptide and how it facilitates autonomic Ca2+ entry in chondrocytes and modulates bone growth.
https://doi.org/10.7554/eLife.71931.sa0Introduction
The development of skeletal long bones occurs through endochondral ossification processes, during which chondrocyte layers form the growth plates at both ends of bone rudiments, and then the expanded cartilage portions are gradually replaced by trabecular bones through the action of osteoclasts and osteoblasts (Berendsen and Olsen, 2015). Therefore, bone size largely depends on the proliferation of growth plate chondrocytes during endochondral development. On the other hand, atrial (ANP), brain (BNP), and C-type (CNP) natriuretic peptides regulate diverse cellular functions by activating the receptor guanylate cyclases, NPR1 and NPR2 (Nakao et al., 1996). Of the natriuretic peptides, CNP exclusively stimulates bone development by acting on growth plate chondrocytes expressing the CNP-specific receptor NPR2 (Nakao et al., 1996; Wit and Camacho-Hübner, 2011; Peake et al., 2014). Indeed, loss- and gain-of-function mutations in the human NPR2 gene cause acromesomelic dysplasia and skeletal overgrowth disorder, respectively (Vasques et al., 2014; Wit et al., 2016). Furthermore, translational studies have been probing the benefits of CNP treatments in various animal models with impaired skeletal growth, and a phase III clinical trial of CNP therapy has recently been completed and approved for treatment of achondroplasia patients primarily resulting from mutations in the FGFR3 gene (Savarirayan et al., 2020). It is thus likely that NPR2 guanylate cyclase controls chondrocytic cGMP content during growth plate development. Downstream of NPR2 activation, cGMP-dependent protein kinase (PKG) seems to phosphorylate target proteins to facilitate growth plate chondrogenesis (Peake et al., 2014). Activated PKG is postulated to stimulate the biosynthesis of growth plate extracellular matrix by playing an inhibitory role in the mitogen-activated protein kinase Raf–MEK–ERK cascade (Krejci et al., 2005). In parallel, glycogen synthase kinase 3β (GSK3β) is likely activated by PKG-mediated phosphorylation, leading to the hypertrophic maturation of growth plate chondrocytes (Kawasaki et al., 2008). However, it is still unclear how CNP promotes bone growth at the molecular level, and it is important to further address CNP signaling cascade in growth plate chondrocytes.
In the transient receptor potential channel superfamily, the melastatin subfamily member 7 (TRPM7) forms a mono- and divalent cation-permeable channel in various cell types and participates in important cellular processes including cell growth and adhesion (Fleig and Chubanov, 2014). We recently reported that growth plate chondrocytes generate autonomic intracellular Ca2+ fluctuations, which are generated by the intermittent gating of TRPM7 channels, and also that TRPM7-mediated Ca2+ entry activates Ca2+/calmodulin-dependent protein kinase II (CaMKII), facilitating endochondral bone growth (Qian et al., 2019). Based on these observations, we explored the link between CNP signaling and TRPM7-mediated Ca2+ entry through the experiments described in this report. Our data obtained clearly indicate that big-conductance Ca2+-dependent K+ (BK) channels play a key role in the functional coupling between NPR2 and TRPM7 channels in growth plate chondrocytes.
Results
CNP facilitates spontaneous Ca2+ fluctuations in growth plate chondrocytes
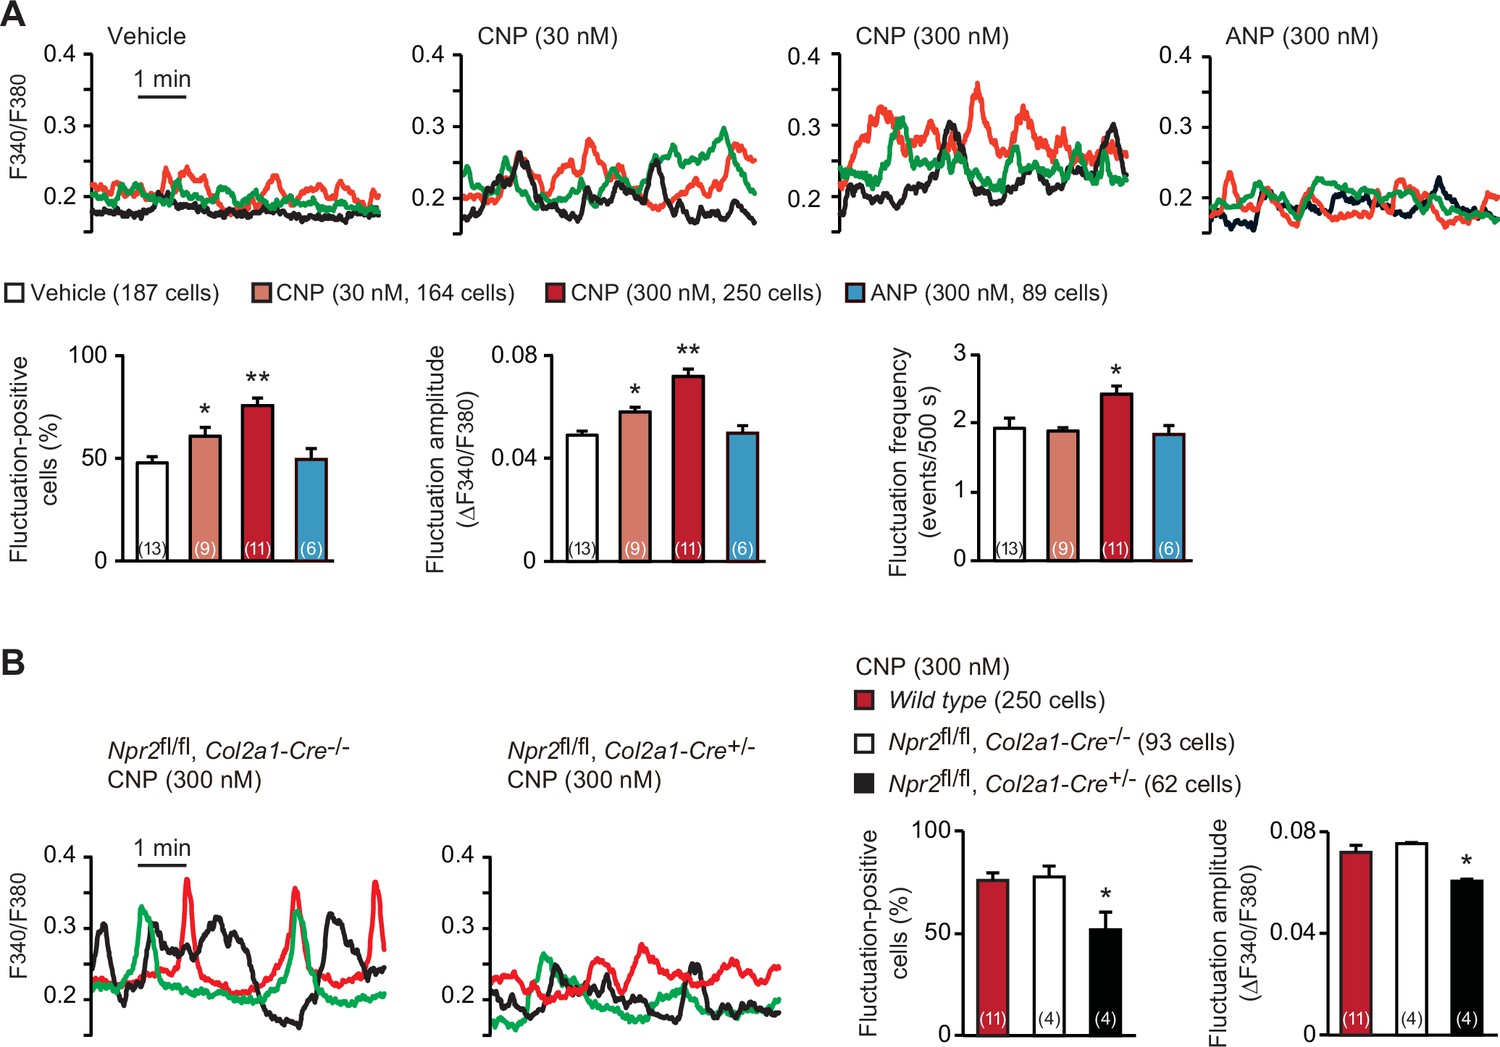
In the growth plates of developing bones, proliferating cartilage cells, designated as round and columnar chondrocytes, frequently exhibit weak increases and decreases in intracellular Ca2+ concentration under resting conditions (Qian et al., 2019). On the other hand, previous in vivo studies demonstrated that CNP application (>1 μmol/kg) stimulates endochondral bone growth (Nakao et al., 1996). In our Fura-2 imaging of round chondrocytes within femoral bone slices prepared from wild-type mice, CNP pretreatments (30–300 nM for 1 hr) dose-dependently facilitated spontaneous Ca2+ fluctuations (Figure 1A). In particular, fluctuation-positive cell ratio and fluctuation amplitude were remarkably elevated in response to the CNP treatments. In contrast, ANP treatments exerted no effects on Ca2+ fluctuations in growth plate chondrocytes.
Figure 1 with 2 supplements see all
C-type natriuretic peptide (CNP)-induced facilitation of Ca2+ fluctuations in growth plate chondrocytes.
(A) Fura-2 imaging of round chondrocytes pretreated with or without natriuretic peptides. Femoral bone slices prepared from wild-type C57BL embryos were pretreated with or without CNP and atrial natriuretic peptide (ANP), and subjected to Ca2+ imaging. Representative recording traces from three cells are shown in each pretreatment group (upper panels). The effects of CNP and ANP pretreatments on spontaneous Ca2+ fluctuations are summarized (lower graphs). The fluctuation-positive cell ratio, fluctuation amplitude and frequency were statistically analyzed, and significant differences from the control vehicle pretreatment are marked with asterisks (*p < 0.05 and **p < 0.01 in one-way analysis of variance (ANOVA) and Dunnett’s test). The data are presented as the means ± standard error of the mean (SEM). with n values indicating the number of examined mice. (B) Fura-2 imaging of round chondrocytes prepared from chondrocyte-specific Npr2-knockout (Npr2fl/fl, Col2a1-Cre+/−) and control (Npr2fl/fl, Col2a1-Cre−/−) mice. The bone slices were pretreated with CNP, and then subjected to Ca2+ imaging. Representative recording traces are shown (left panels) and the CNP-pretreated effects are summarized (right graphs); significant differences from the wild-type group are marked with asterisks (*p < 0.05 in one-way ANOVA and Tukey’s test). The data are presented as the means ± SEM with n values indicating the number of examined mice.
-
Figure 1—source data 1
Related to Figure 1A.
- https://cdn.elifesciences.org/articles/71931/elife-71931-fig1-data1-v1.xlsx
-
Figure 1—source data 2
Related to Figure 1B.
- https://cdn.elifesciences.org/articles/71931/elife-71931-fig1-data2-v1.xlsx
In chondrocyte-specific Npr2-knockout mice (Npr2fl/fl, Col2a1-Cre+/−), Cre recombinase is expressed under the control of the collagen type 2α1 gene promoter and thus inactivates the floxed Npr2 alleles in a chondrocyte-specific manner (Nakao et al., 2015). Our RT-PCR analysis indicated that the floxed Npr2 gene was largely inactivated in the growth plates prepared from the E17.5 mutant embryos, but such recombination events were not detected in other tissues examined (Figure 1—figure supplement 1A, B). Accordingly, Npr2 mRNA contents in the mutant growth plates were reduced to less than 40% of controls (Figure 1—figure supplement 1C), despite the growth plate preparations contain not only chondrocytes but also perichondrium-resident cells including undifferentiated mesenchymal cells and immature chondroblasts. Further RT-PCR analysis detected similar expression of representative chondrogenic marker genes between chondrocyte-specific Npr2-knockout and control bones, suggesting that the Npr2 deficiency does not affect fundamental chondrogenesis in growth plates (Figure 1—figure supplement 1D). In contrast to the imaging observations in wild-type and control bone slices, CNP treatments failed to enhance Ca2+ fluctuations in the mutant round chondrocytes prepared from the chondrocyte-specific Npr2-knockout mice (Figure 1B). Therefore, CNP seems to facilitate spontaneous Ca2+ fluctuations downstream of NPR2 activation in growth plate chondrocytes.
Activated PKG facilitates spontaneous Ca2+ fluctuations
CNP binds to NPR2 to activate its intrinsic guanylate cyclase and thus stimulates PKG by elevating cellular cGMP contents (Nakao et al., 1996). CNP also binds to NPR3 which acts as a decoy receptor for ligand clearance, but the Npr3 gene seemed to be inactive in growth plate chondrocytes (Figure 1—figure supplement 2). Next, we pharmacologically verified the contribution of PKG to CNP-facilitated Ca2+ fluctuations. The cGMP analog 8-(4-chlorophenylthio)-cyclic GMP (8-pCPT-cGMP) is widely used as a PKG-selective activator, while KT5823 is a typical PKG inhibitor. In wild-type growth plate chondrocytes pretreated with 8-pCPT-cGMP (100 μM for 1 hr), spontaneous Ca2+ fluctuations were remarkably facilitated (Figure 2A); both fluctuation-positive cell rate and fluctuation amplitude were highly increased. In contrast, the bath application of KT5823 (2 μM) clearly attenuated CNP-facilitated Ca2+ fluctuations within a short time frame (Figure 2B). Therefore, PKG activation seems to be essential for CNP-facilitated Ca2+ fluctuations in growth plate chondrocytes.
Figure 2

Contribution of cGMP-dependent protein kinase (PKG) to C-type natriuretic peptide (CNP)-facilitated Ca2+ fluctuations.
(A) Facilitated Ca2+ fluctuations in round chondrocytes pretreated with the PKG activator 8-pCPT-cGMP. Wild-type bone slices were pretreated with or without the cGMP analog, and then subjected to Ca2+ imaging. Representative recording traces are shown (left panels), and the pharmacological effects are summarized (right graphs). Significant differences between control and 8-pCPT-cGMP pretreatments are marked with asterisks (**p < 0.01 in t-test). The data are presented as the means ± standard error of the mean (SEM) with n values indicating the number of examined mice. (B) Attenuation of CNP-facilitated Ca2+ fluctuations by the PKG inhibitor KT5823. Wild-type bone slices were pretreated with CNP, and then subjected to Ca2+ imaging. Representative recording traces are shown (left panel), and KT5823-induced effects are summarized (right graphs). Significant KT5823-induced shifts are marked with asterisks (**p < 0.01 in t-test). The data are presented as the means ± SEM with n values indicating the number of examined mice.
-
Figure 2—source data 1
Related to Figure 2A.
- https://cdn.elifesciences.org/articles/71931/elife-71931-fig2-data1-v1.xlsx
-
Figure 2—source data 2
Related to Figure 2B.
- https://cdn.elifesciences.org/articles/71931/elife-71931-fig2-data2-v1.xlsx
Activated BK channels contribute to CNP-facilitated Ca2+ fluctuations
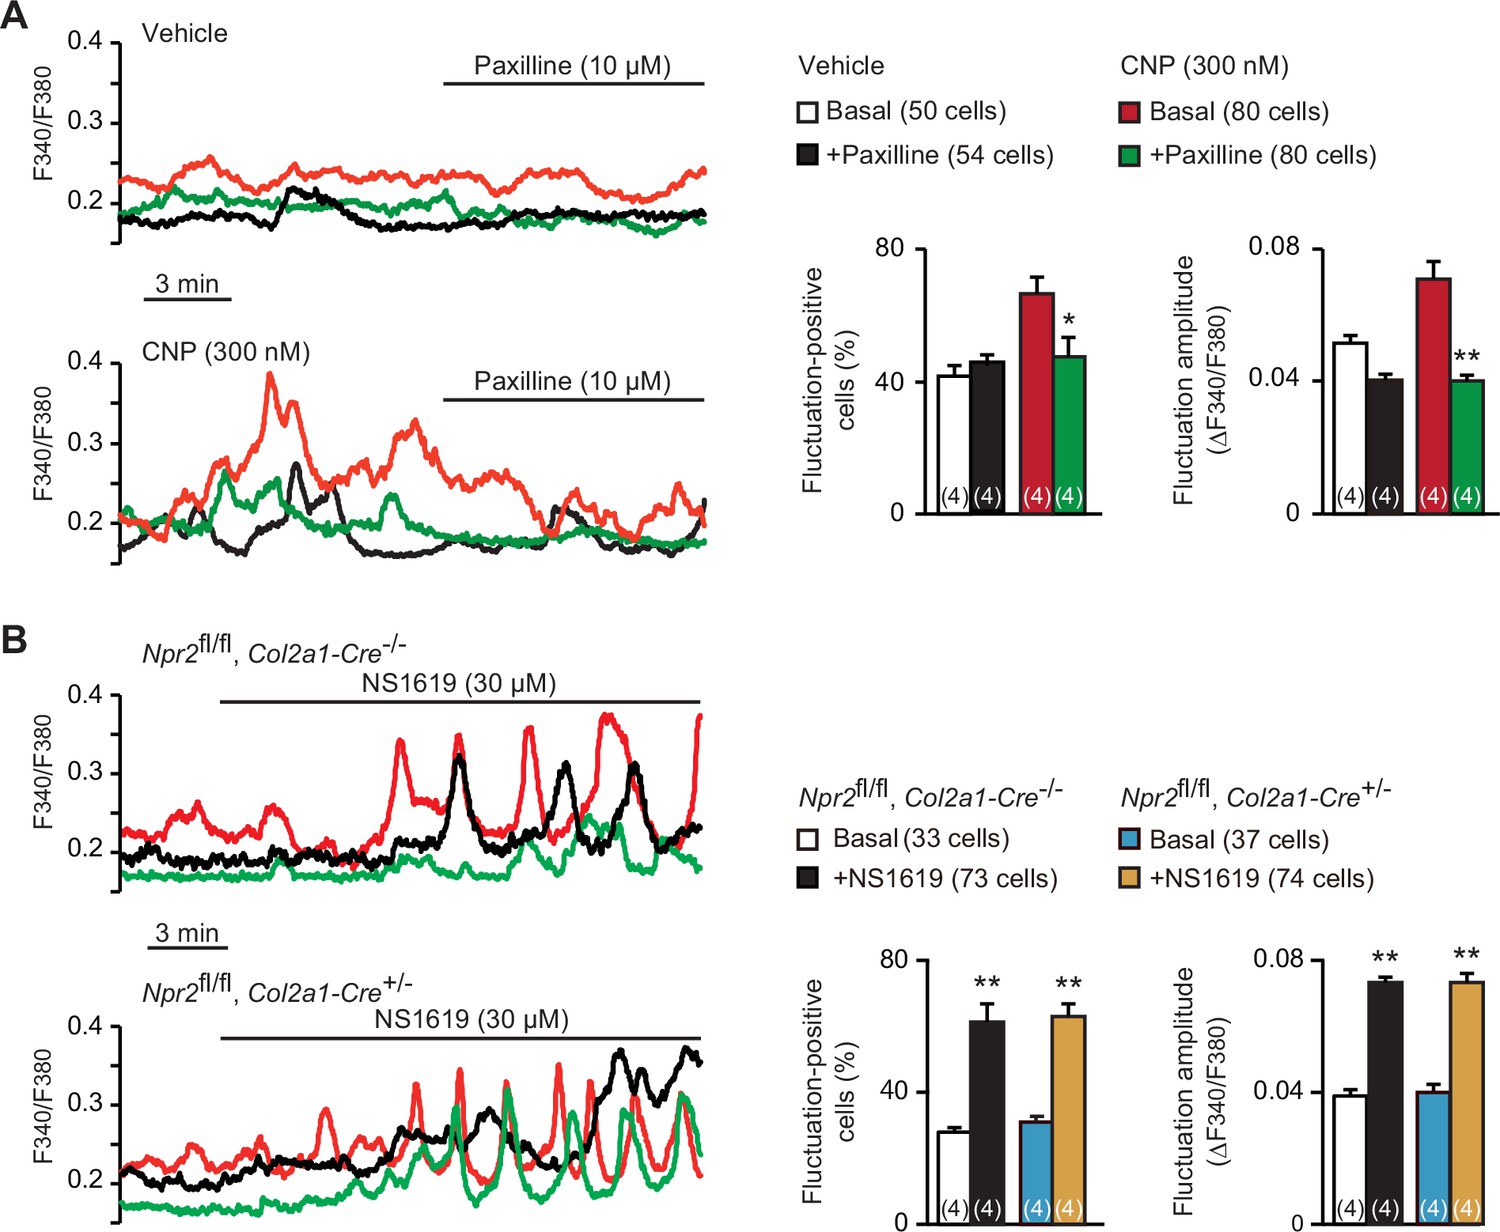
Spontaneous Ca2+ fluctuations are facilitated by activated BK channels in growth plate chondrocytes (Qian et al., 2019). Previous studies have established a functional link between PKG and BK channels in several cell types including smooth muscle and endothelial cells; activated PKG enhances BK channel gating by directly phosphorylating the α subunit KCNMA1 protein (Dong et al., 2008; Fukao et al., 1999; White et al., 2000). We thus examined whether altered BK channel activity is associated with CNP-facilitated Ca2+ fluctuations. The BK channel inhibitor paxilline (10 μM) exerted no obvious effects on basal Ca2+ fluctuations in nontreated chondrocytes. However, the same paxilline treatments remarkably inhibited CNP-facilitated Ca2+ fluctuations (Figure 3A); both fluctuation-positive cell ratio and fluctuation amplitude were clearly decreased after paxilline application. On the other hand, the BK channel activator NS1619 (30 μM) stimulated basal Ca2+ fluctuations in the growth plate chondrocytes prepared from control mice. The NS1619-induced effects were preserved in the mutant chondrocytes prepared from chondrocyte-specific Npr2-knockout mice (Figure 3B). Therefore, BK channel activation is likely involved in CNP-facilitated Ca2+ fluctuations in growth plate chondrocytes.
Figure 3 with 2 supplements see all
Contribution of BK channels to C-type natriuretic peptide (CNP)-facilitated Ca2+ fluctuations.
(A) Attenuation of CNP-facilitated Ca2+ fluctuations by the BK channel inhibitor paxilline in round chondrocytes. Wild-type bone slices were pretreated with or without CNP, and then subjected to Ca2+ imaging. Representative recording traces are shown (left panels), and paxilline-induced effects are summarized (right graphs). Significant paxilline-induced shifts are marked with asterisks (*p < 0.05 and **p < 0.01 in one-way analysis of variance (ANOVA) and Tukey’s test). The data are presented as the means ± standard error of the mean (SEM) with n values indicating the number of examined mice. (B) Ca2+ fluctuations facilitated by the BK channel activator NS1619 in Npr2-deficient chondrocytes. Bone slices were prepared from the chondrocyte-specific Npr2-knockout and control embryos, and NS1619-induced effects were examined in Ca2+ imaging. Representative recording traces are shown (left panels), and the effects of NS1619 are summarized (right graphs). Significant NS1619-induced shifts are marked with asterisks (**p < 0.01 in one-way ANOVA and Tukey’s test). The data are presented as the means ± SEM with n values indicating the number of examined mice.
-
Figure 3—source data 1
Related to Figure 3A.
- https://cdn.elifesciences.org/articles/71931/elife-71931-fig3-data1-v1.xlsx
-
Figure 3—source data 2
Related to Figure 3B.
- https://cdn.elifesciences.org/articles/71931/elife-71931-fig3-data2-v1.xlsx
Phospholipase C seems unrelated to CNP-facilitated Ca2+ fluctuations
Ca2+ fluctuations are maintained by phosphatidylinositol (PI) turnover in growth plate chondrocytes (Qian et al., 2019). Although it has been reported that activated PKG inhibits phospholipase C (PLC) in smooth muscle (Guo et al., 2018; Huang et al., 2007; Nalli et al., 2014; Xia et al., 2001), it might be possible that NPR2 activation enhances basal PLC activity to facilitate Ca2+ fluctuations. The PLC inhibitor U73122 (10 μM) remarkably inhibited basal Ca2+ fluctuations in nontreated chondrocytes: the fluctuation-positive cell ratio and fluctuation amplitude reduced less than half in response to U73122 application (Figure 3—figure supplement 1). U73122 was also effective for CNP-facilitated Ca2+ fluctuations, but the inhibitory efficiency seemed relatively weak compared to those on basal fluctuations. Given the different inhibitory effects, it is rather unlikely that PLC activation accompanies CNP-facilitated Ca2+ fluctuations.
PKG stimulates sarco/endoplasmic reticulum Ca2+-ATPase (SERCA) by phosphorylating the Ca2+ pump regulatory peptide phospholamban (PLN) in smooth and cardiac muscle cells (Bibli et al., 2015; Raeymaekers et al., 1988; Lalli et al., 1999), and activated Ca2+ pumps generally elevate stored Ca2+ contents and thus stimulate store Ca2+ release. RT-PCR data suggested that the Pln gene and the Atp2a2 gene encoding SERCA2 are weakly active in growth plate chondrocytes (Figure 1—figure supplement 2). To examine the effects of CNP treatments on Ca2+ stores, we examined Ca2+ responses to the activation of Gq-coupled lysophosphatidic acid (LPA) receptors (Figure 3—figure supplement 2A) and the Ca2+ pump inhibitor thapsigargin (Figure 3—figure supplement 2B). CNP- and vehicle-pretreated chondrocytes exhibited similar LPA-induced Ca2+ release and thapsigargin-induced Ca2+ leak responses. Therefore, CNP treatments seem ineffective for store Ca2+ pumps in growth plate chondrocytes. Moreover, the dose dependency of Ca2+ release by LPA (1–10 μM) was not altered between CNP- and vehicle-pretreated chondrocytes, implying that CNP does not affect basal PLC activity.
Among diverse Ca2+ handling-related proteins, PLC, PLN, and BK channels have been reported as PKG substrates, however, our observations suggested that both PLC and PLN receive no obvious functional regulation in CNP-treated chondrocytes. On the other hand, the paxilline treatments diminished CNP-facilitated Ca2+ fluctuations down to nontreated basal levels (Figure 3A), suggesting that activated BK channels predominantly contribute to CNP-facilitated Ca2+ fluctuations in growth plate chondrocytes.
CNP induces BK channel-mediated hyperpolarization
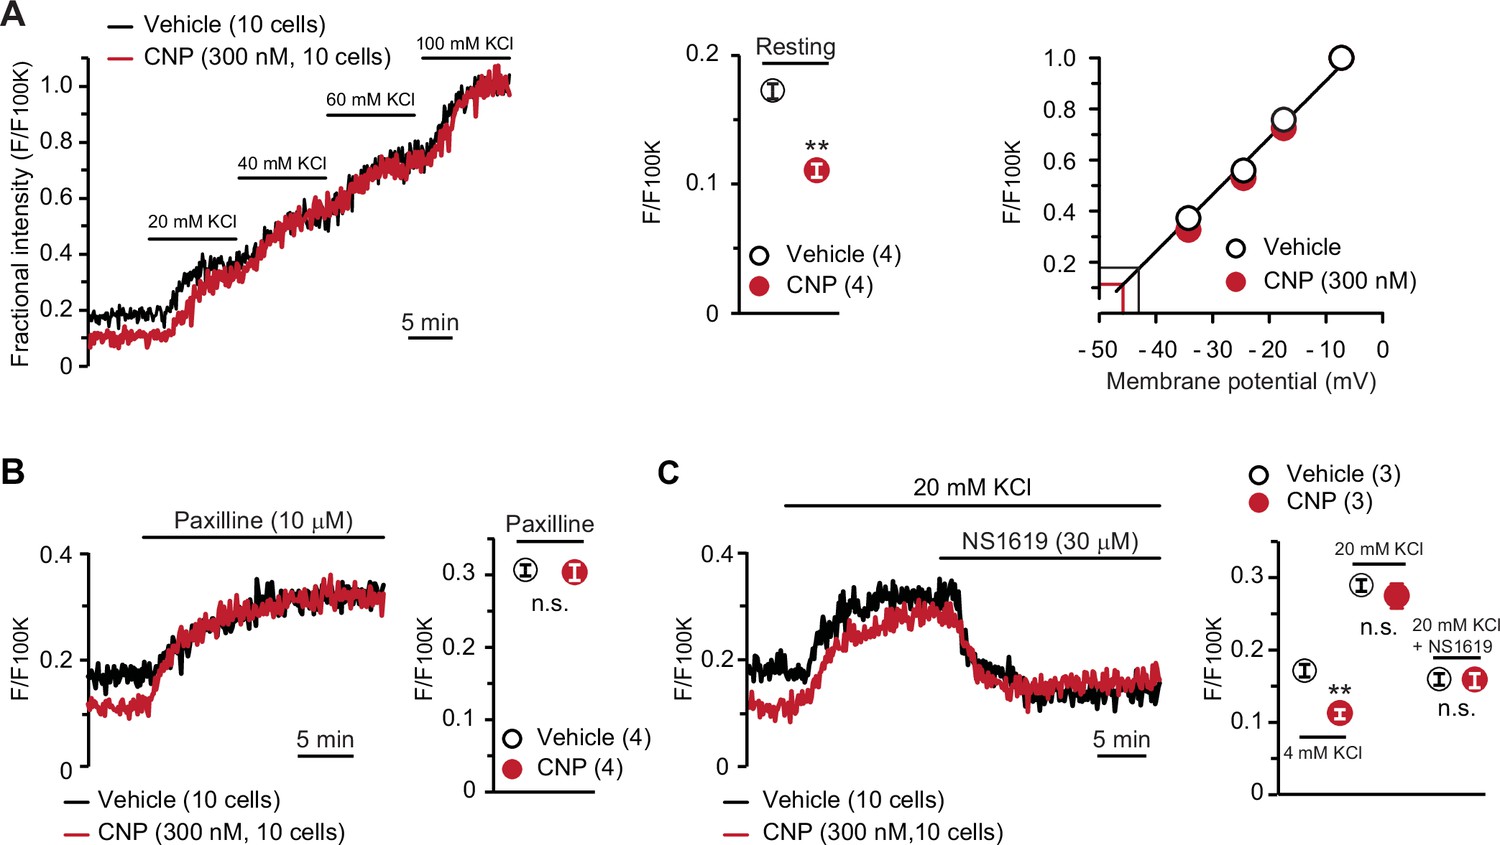
To confirm the contribution of activated BK channels to CNP-facilitated Ca2+ fluctuations, we conducted confocal imaging using the voltage-dependent dye oxonol VI. In this imaging analysis, depolarization results in the accumulation of the dye into cells, in which the fractional fluorescence intensity, normalized to the maximum intensity monitored in the bath solution containing 100 mM KCl, is thus increased (Figure 4A, left panel). The fractional intensity of CNP-pretreated cells was significantly lower than that of nontreated cells in a normal bath solution (Figure 4A, middle graph), although both cells exhibited similar intensity shifts in high K+ bath solutions. Based on the recording data, we prepared a calibration plot for the relationship between the fractional intensity and theoretical membrane potential (Figure 4A, right panel). In the tentative linear correlation, resting potentials of −46.4 ± 0.2 and −43.6 ± 0.3 mV were estimated in CNP- and nontreated cells, respectively. The estimated potentials closely approximate the reported value from monitoring articular chondrocytes using sharp microelectrodes (Clark et al., 2010).
Figure 4
BK channel-mediated hyperpolarization induced by C-type natriuretic peptide (CNP).
(A) Oxonol VI imaging of round chondrocytes pretreated with or without CNP. Wild-type bone slices were pretreated with or without CNP, and then subjected to membrane potential imaging. During contiguous treatments with high-K+ solutions, cellular fluorescence intensities were monitored and normalized to the maximum value in the 100 mM KCl-containing solution to yield the fractional intensity (left panel). The resting fractional intensities were quantified and statistically analyzed in CNP- and vehicle-pretreated cells (middle graph). For preparing the calibration plot (right panel), the data from 10 cells in bathing solutions containing 4 (normal solution), 20, 40, 60, and 100 mM KCl are summarized; red and black lines indicate the estimated resting membrane potentials of CNP- and vehicle-pretreated cells, respectively. (B) Effects of the BK channel inhibitor paxilline on resting membrane potential in round chondrocytes. Recording data from 10 cells pretreated with or without CNP were averaged (left panel), and the fractional intensities elevated by paxilline are summarized (right graph). (C) Effects of the BK channel activator NS1619 on membrane potential in round chondrocytes. Recording data from 10 cells pretreated with or without CNP were averaged (left panel), and the fractional intensities in normal, 20 mM KCl and NS1619-containing 20 mM KCl solutions are summarized (right graph). Significant differences between CNP- and vehicle-pretreated cells are indicated by asterisks in (A) (**p < 0.01 in t-test) and in (C) (**p < 0.01 in one-way analysis of variance [ANOVA] and Dunn’s test). The data are presented as the means ± standard error of the mean (SEM) with n values indicating the number of examined mice.
-
Figure 4—source data 1
Related to Figure 4A.
- https://cdn.elifesciences.org/articles/71931/elife-71931-fig4-data1-v1.xlsx
-
Figure 4—source data 2
Related to Figure 4B.
- https://cdn.elifesciences.org/articles/71931/elife-71931-fig4-data2-v1.xlsx
-
Figure 4—source data 3
Related to Figure 4C.
- https://cdn.elifesciences.org/articles/71931/elife-71931-fig4-data3-v1.xlsx
In pharmacological assessments, paxilline elevated fractional intensities to the same levels in CNP- and nontreated chondrocytes (Figure 4B). Moreover, NS1619 decreased fractional intensities to the same levels in both cells under 20 mM KCl bathing conditions, which enabled us to reliably evaluate the reducing intensity shifts (Figure 4C). The oxonol VI imaging data suggested that CNP treatments induce BK channel-mediated hyperpolarization and thus facilitate spontaneous Ca2+ fluctuations by enhancing Ca2+-driving forces in growth plate chondrocytes.
CNP enhances TRPM7-mediated Ca2+ entry and CaMKII activity
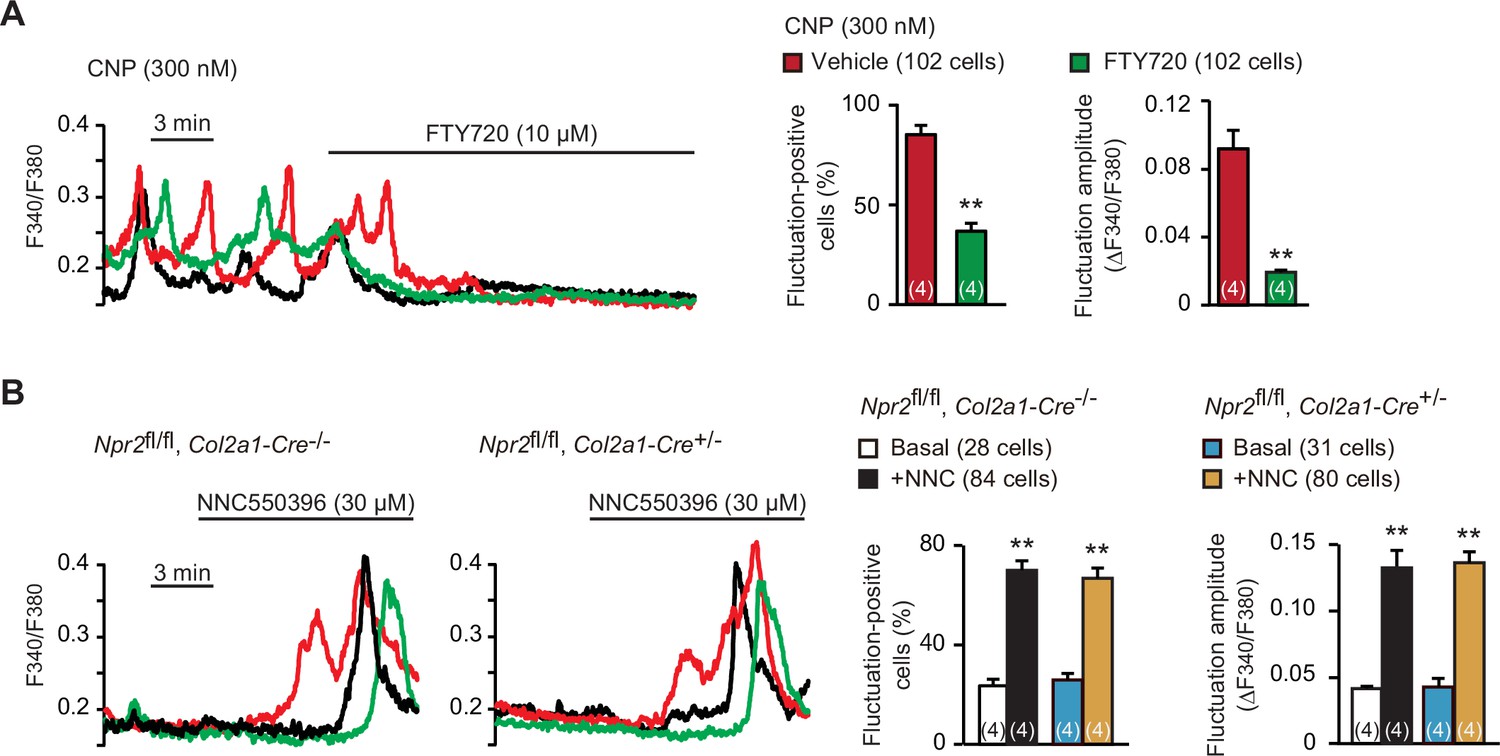
Spontaneous Ca2+ fluctuations are predominantly attributed to the intermissive gating of cell-surface TRPM7 channels in growth plate chondrocytes (Qian et al., 2019). For pharmacological characterization of TRPM7 channels, FTY720 is used as a typical inhibitor, while NNC550396 is an activator. As reasonably expected, bath application of FTY720 (10 μM) clearly diminished CNP-facilitated Ca2+ fluctuations (Figure 5A). On the other hand, NNC550396 (30 μM) remarkably facilitated Ca2+ fluctuations in nontreated chondrocytes, and this facilitation was preserved in the mutant chondrocytes prepared from chondrocyte-specific Npr2-knockout mice (Figure 5B). Therefore, CNP treatments likely facilitate TRPM7-mediated Ca2+ influx in growth plate chondrocytes.
Figure 5
Enhanced TRPM7-mediated Ca2+ entry by C-type natriuretic peptide (CNP) treatments.
(A) Inhibition of CNP-facilitated Ca2+ fluctuations by the TRPM7 inhibitor FTY720 in round chondrocytes. Wild-type bone slices were pretreated with CNP, and then subjected to Ca2+ imaging. Representative recording traces are shown (left panel), and the effects of FTY720 are summarized (right graphs). Significant FTY720-induced shifts are marked with asterisks (**p < 0.01 in t-test). The data are presented as the means ± standard error of the mean (SEM) with n values indicating the number of examined mice. (B) Ca2+ fluctuations facilitated by the TRPM7 channel activator NNC550396 in Npr2-deficient round chondrocytes. Bone slices were prepared from the chondrocyte-specific Npr2-knockout and control embryos, and NNC550396-induced effects were examined in Ca2+ imaging. Representative recording traces are shown (left panels) and the effects of NNC550396 on Ca2+ fluctuations are summarized (right graphs). Significant NNC550396-induced shifts in each genotype are marked with asterisks (**p < 0.01 in one-way analysis of variance [ANOVA] and Tukey’s test). The data are presented as the means ± SEM with n values indicating the number of examined mice.
-
Figure 5—source data 1
Related to Figure 5A.
- https://cdn.elifesciences.org/articles/71931/elife-71931-fig5-data1-v1.xlsx
-
Figure 5—source data 2
Related to Figure 5B.
- https://cdn.elifesciences.org/articles/71931/elife-71931-fig5-data2-v1.xlsx
TRPM7-mediated Ca2+ entry activates CaMKII in growth plate chondrocytes toward bone outgrowth (Qian et al., 2019), and cellular CaMKII activity can be estimated by immunochemically quantifying its autophosphorylated form. In immunocytochemical analysis, CNP-pretreated growth plate chondrocytes were more decorated with the antibody against phospho-CaMKII than nontreated control cells (Figure 6A). This CNP-facilitated decoration was abolished by the cotreatment of the CaMKII inhibitor KN93 (30 μM). This observation was further confirmed by Western blot analysis; CNP treatments increased the phospho-CaMKII population without affecting total CaMKII content in the cell lysates prepared from growth plates (Figure 6B). Therefore, CaMKII is likely activated downstream of enhanced TRPM7-mediated Ca2+ entry in CNP-treated growth plate chondrocytes.
Figure 6
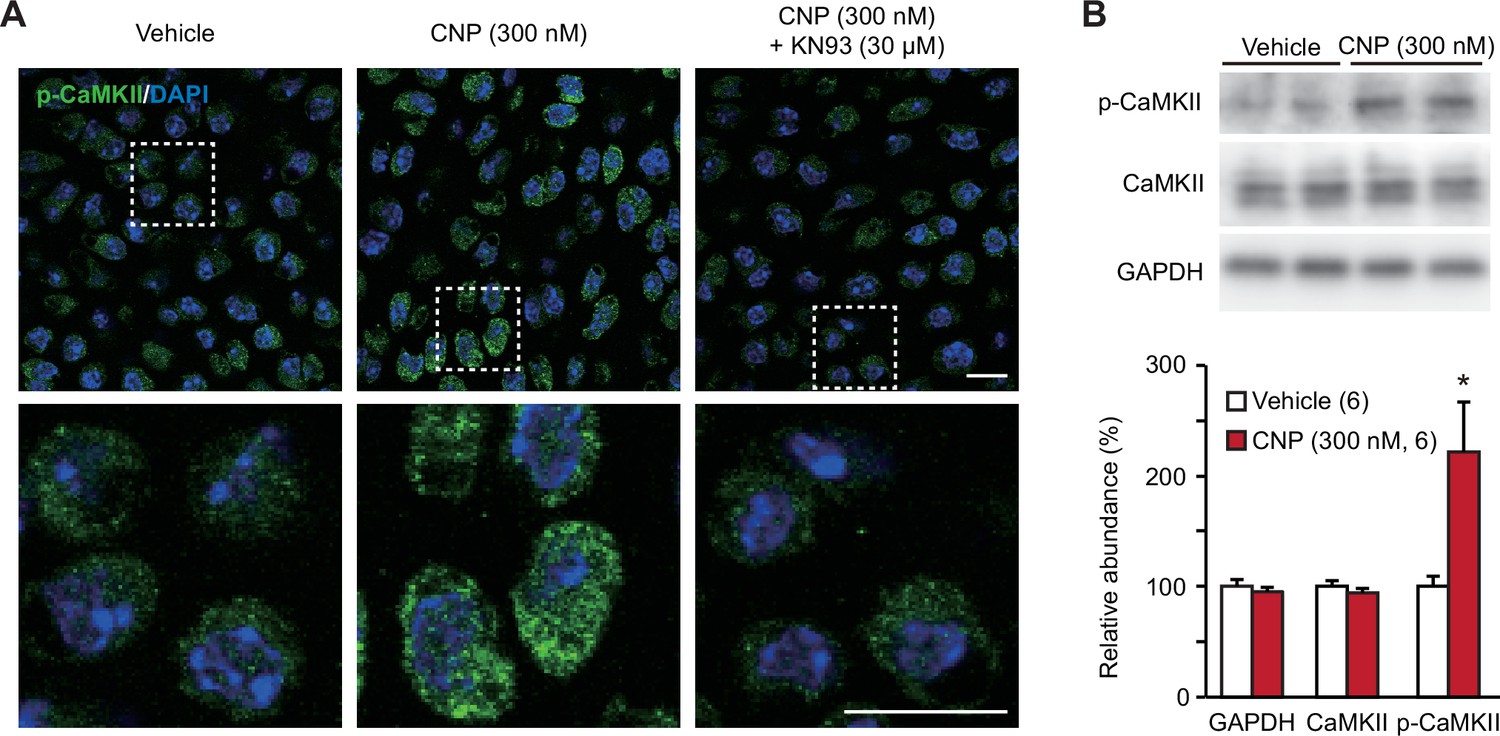
CaMKII activation in C-type natriuretic peptide (CNP)-treated round chondrocytes.
(A) Immunohistochemical staining against phospho-CaMKII (p-CaMKII) in round chondrocytes. Wild-type bone slices were pretreated with or without CNP and the CaMKII inhibitor KN93, and then subjected to immunostaining with antibody to p-CaMKII. DAPI (4′,6-diamidino-2-phenylindole) was used for nuclear staining. Lower panels show high-magnification views of white-dotted regions in upper panels (scale bars, 10 μm). (B) Immunoblot analysis of total CaMKII and p-CaMKII in growth plate cartilage. Growth plate lysates were prepared from wild-type bone slices pretreated with or without CNP, and subjected to immunoblot analysis with antibodies against total CaMKII and p-CaMKII (upper panel). Glyceraldehyde-3-phosphate dehydrogenase (GAPDH) was also analyzed as a loading control. The immunoreactivities observed were densitometrically quantified and are summarized (lower graph). A significant difference between CNP- and vehicle pretreatments is marked with an asterisk (*p < 0.05 in one-way analysis of variance [ANOVA] and Tukey’s test). The data are presented as the means ± standard error of the mean (SEM) with n values indicating the number of examined mice.
-
Figure 6—source data 1
Related to Figure 6B.
- https://cdn.elifesciences.org/articles/71931/elife-71931-fig6-data1-v1.zip
-
Figure 6—source data 2
Related to Figure 6B.
- https://cdn.elifesciences.org/articles/71931/elife-71931-fig6-data2-v1.xlsx
Pharmacologically activated BK channels facilitate bone outgrowth
Based on the present data from in vitro experiments, the novel CNP signaling route, represented as the NPR2-PKG-BK channel–TRPM7 channel–CaMKII axis, can be proposed in growth plate chondrocytes. We attempted to examine the proposed signaling axis in metatarsal bone culture, a widely used ex vivo model system for analyzing bone growth and endochondral ossification (Houston et al., 2016). CNP treatments expanded columnar chondrocytic zones without affecting cell densities to extend cultured wild-type metatarsal bones (Figure 7—figure supplement 1). The extension seemed to be mainly caused by enlarged extracellular matrix area, although CNP significantly dilated columnar cell sizes. In chondrocyte-specific Trpm7-knockout mice (Trpm7fl/fl, Col11a2-Cre+/−), Cre recombinase is expressed under the control of the collagen type XI gene enhancer and promoter, and thus inactivates the floxed Trpm7 alleles in cartilage cells (Qian et al., 2019). The bone rudiments prepared from control embryos (Trpm7fl/fl, Col11a2-Cre−/−) regularly elongated during ex vivo culture, and their outgrowth was significantly stimulated by the supplementation with CNP (30 nM) into the culture medium (Figure 7A). The histological observation of the growth plate regions demonstrated that the CNP treatment extended the columnar chondrocyte zone. In contrast, the mutant rudiments prepared from the chondrocyte-specific Trpm7-knockout embryos were reduced in initial size and did not respond to the CNP supplementation (Figure 7B). Therefore, CNP-facilitated bone outgrowth seems to require TRPM7 channels expressed in growth plate chondrocytes.
Figure 7 with 2 supplements see all
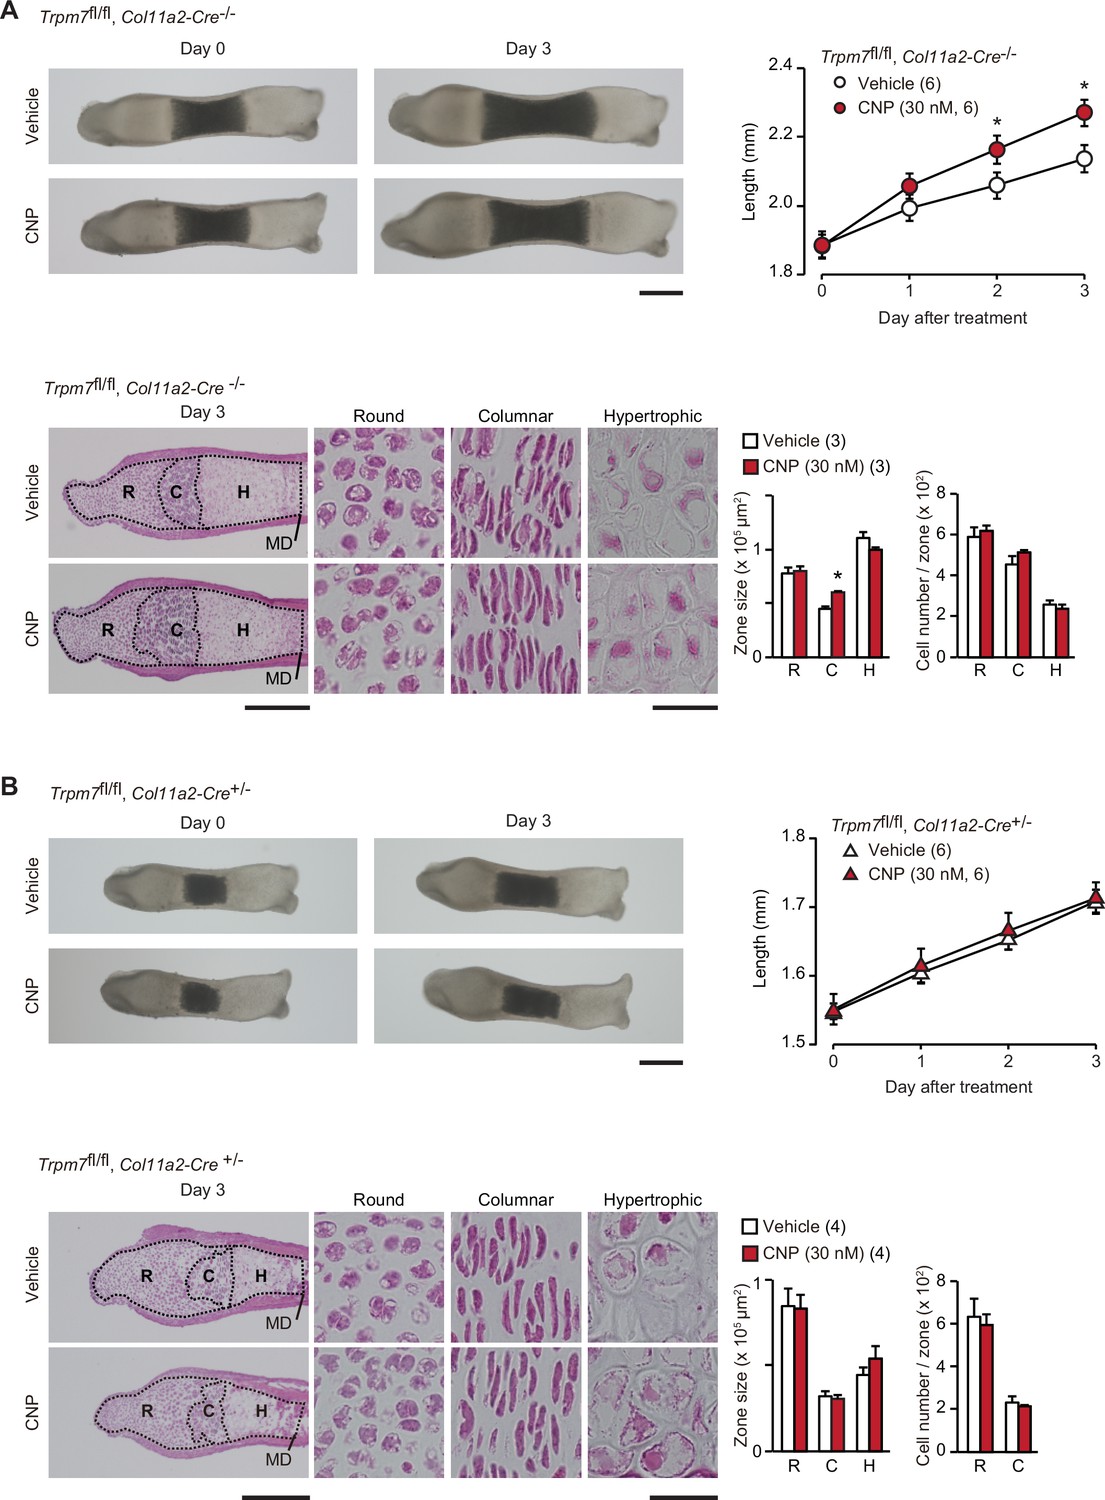
Contribution of TRPM7 channel to C-type natriuretic peptide (CNP)-facilitated bone outgrowth.
Loss of CNP-facilitated outgrowth in Trpm7-deficient bones. Metatarsal rudiments isolated from control (Trpm7fl/fl, Col11a2-Cre−/−) embryos (A) and chondrocyte-specific Trpm7-knockout (Trpm7fl/fl, Col11a2-Cre+/−) embryos (B) were precultured in normal medium for 6 days, and then cultured in medium supplemented with or without CNP for 3 days. Representative images of cultured metatarsals are shown (upper left panels; scale bar, 0.3 mm), and longitudinal bone outgrowth during the CNP-supplemented period was statistically analyzed in each genotype group (upper right graphs). Growth plate images in longitudinal sections of 3-day cultured bones with or without CNP treatments are presented in lower left panels (scale bar, 0.3 mm), and their high-magnification views in the round (R), columnar (C), and hypertrophic (H) chondrocyte zones are shown in lower right panels (scale bar, 30 μm). MD, mid-diaphysis. Summary of graphical representations of zonal sizes containing round, columnar, and hypertrophic chondrocytes and number of cells in each zone is shown in lower right graphs. Significant CNP-supplemented effects are marked with asterisks (*p < 0.05 in t-test). The data are presented as the means ± standard error of the mean (SEM) with n values indicating the number of examined mice.
-
Figure 7—source data 1
Related to Figure 7A.
- https://cdn.elifesciences.org/articles/71931/elife-71931-fig7-data1-v1.xlsx
-
Figure 7—source data 2
Related to Figure 7B.
- https://cdn.elifesciences.org/articles/71931/elife-71931-fig7-data2-v1.xlsx
In our proposed signaling axis, activated BK channels exert an essential role by converting the chemical signal into the electrical signal. We finally examined the effect of the BK channel activator NS1619 on bone outgrowth (Figure 8A). NS1619 supplementation (30 μM) significantly stimulated the outgrowth of wild-type bone rudiments. In contrast, under the same culture conditions, no stimulation was detected in the mutant rudiments from the chondrocyte-specific Trpm7-deficient embryos (Figure 8B). The observations seem to support our conclusion that CNP activates BK channels and thus facilitates TRPM7-mediated Ca2+ influx in growth plate chondrocytes for stimulating bone outgrowth.
Figure 8
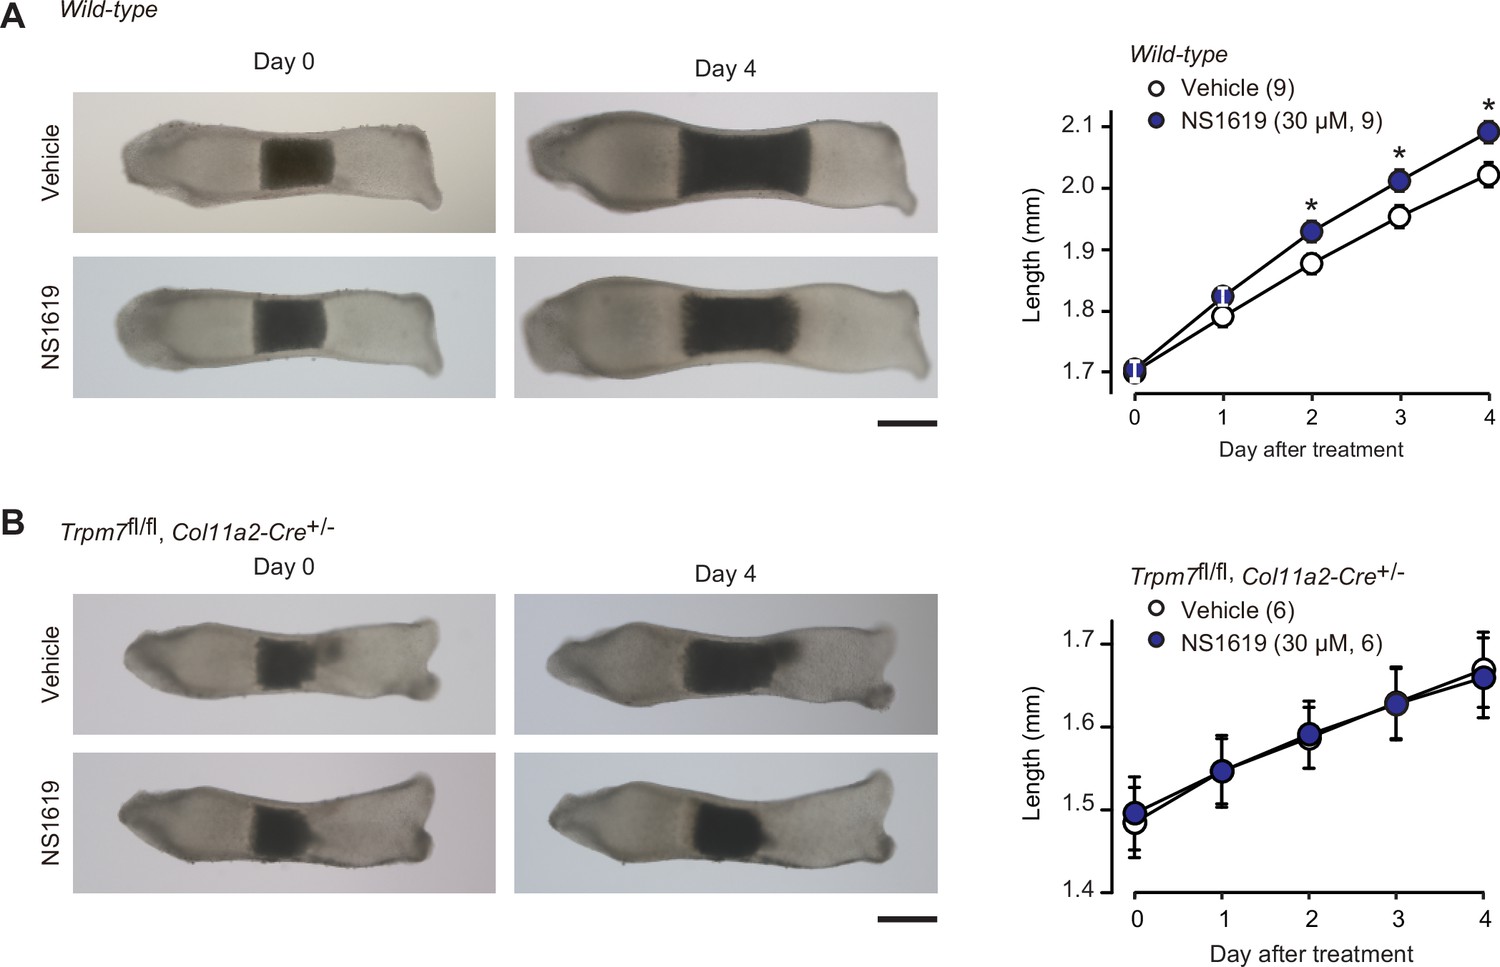
Facilitated bone outgrowth by BK channel activator.
Stimulated bone outgrowth by the BK channel activator NS1619. Metatarsal rudiments isolated from wild-type (A) and the chondrocyte-specific Trpm7-knockout embryos (B) were precultured in normal medium for 5 days, and then cultured in medium supplemented with or without NS1619 for 4 days. Representative images of cultured metatarsals are shown (left panels; scale bar, 0.3 mm), and longitudinal bone outgrowth during the NS1619-supplemented period was statistically analyzed in each genotype group (right graphs). A significant NS1619-supplemented effect is marked with asterisks (*p < 0.05 in t-test). The data are presented as the means ± standard error of the mean (SEM) with n values indicating the number of examined mice.
-
Figure 8—source data 1
Related to Figure 8A.
- https://cdn.elifesciences.org/articles/71931/elife-71931-fig8-data1-v1.xlsx
-
Figure 8—source data 2
Related to Figure 8B.
- https://cdn.elifesciences.org/articles/71931/elife-71931-fig8-data2-v1.xlsx
Discussion
We reported that in growth plate chondrocytes, PLC and BK channels maintain autonomic TRPM7-mediated Ca2+ fluctuations, which potentiate chondrogenesis and bone growth by activating CaMKII (Qian et al., 2019). Based on the present data, together with the previous reports, we proposed a new CNP signaling axis in growth plate chondrocytes (Figure 7—figure supplement 2A). CNP-induced NPR2 activation elevates cellular cGMP content and thus activates PKG, leading to the phosphorylation of BK channels. The resulting BK channel activation induces cellular hyperpolarization to facilitate TRPM7-mediated Ca2+ entry by enhancing the Ca2+-driving force, leading to CaMKII activation. Therefore, it is likely that CaMKII activity is physiologically regulated by BK channels as a key player of the CNP signaling cascade. In a recent genetic study, several patients carrying loss-of-function mutations in the KCNMA1 gene encoding BK channel α subunit were characterized by a novel syndromic growth deficiency associated with severe developmental delay, cardiac malformation, bone dysplasia, and dysmorphic features (Liang et al., 2019). In the KCNMA1-mutated disorder, CNP signaling likely fails to facilitate TRPM7-mediated Ca2+ fluctuations in growth plate chondrocytes and resulting insufficient Ca2+ entry may lead to systemic bone dysplasia associated with stunted growth plate cartilage. On the other hand, the origin of CNP may still be ambiguous in the signaling scheme. Transgenic mice overexpressing CNP in a chondrocyte-specific manner develop a prominent skeletal overgrowth phenotype, suggesting autocrine CNP signaling in developing bones (Yasoda et al., 2004). However, several genechip data in public databases indicate that prepro-CNP mRNA is abundantly expressed in the placenta among embryonic tissues (e.g., see the records under accession number GSE28277 in NCBI database). Therefore, it may be important to further examine which cell type primarily produces CNP to facilitate bone growth during embryonic development.
In our proposed CNP-signaling cascade, CaMKII is finally activated by TRPM7-mediated Ca2+ influx in both round and columnar chondrocytes. However, it is still unclear how activated CaMKII contributes to bone outgrowth. Our obeservations in cultured metatarsal bones suggest that CNP expanded the columnar chondrocyte zone by stimulating the cell growth and enlarging the extracellular matrix area toward bone extension (Figure 7). The observations are roughly consistent with the previous studies using cultured tibias treated with CNP (Yasoda et al., 1998; Miyazawa et al., 2002). Therefore, activated CaMKII by TRPM7-mediated Ca2+ influx probably phosphorylates key proteins controlling cell growth and extracellular matrix production in columner chondrocytes.
From a physiological point of view, it is interesting to note that the proposed CNP signaling axis has clear overlap with the nitric oxide (NO) and ANP/BNP signaling cascades for vascular relaxation (Martel et al., 2010; Zois et al., 2014; Kubacka et al., 2018). In blood vessels, NO is produced by endothelial cells in response to various stimuli including shear stress and acetylcholine, and activates soluble guanylate cyclase in neighboring vascular smooth muscle cells. ANP and BNP are released from the heart in response to pathological stresses, such as atrial distension and pressure overload, and are delivered to activate the receptor guanylate cyclase NPR1 in vascular muscle. In either case, the resulting cGMP elevation followed by PKG activation induces BK channel-mediated hyperpolarization and thus inhibits L-type Ca2+ channel gating, leading to vascular dilation due to decreased Ca2+ entry into vascular muscle. Therefore, activated BK channels inhibit the voltage-dependent Ca2+ influx in vascular muscle cells regarded as excitable cells (Figure 7—figure supplement 2B). In contrast, activated BK channels reversely stimulate TRPM7-mediated Ca2+ entry in growth plate chondrocytes classified as nonexcitable cells, because the channel activity is voltage independently maintained by the intrinsic PI turnover rate.
CNP is an effective therapeutic reagent for achondroplasia and divergent short statures (Yasoda et al., 2004; Ueda et al., 2016; Yamashita et al., 2020), and the phase III clinical trial of CNP therapy is completed successfully (Nakao et al., 1996). The proteins contributing to the CNP signaling axis may be new pharmaceutical targets for developing medications; in addition to NPR2, BK, and TRPM7 channels are reasonably considered promising targets. Moreover, phosphodiesterase subtypes might be useful targets, although the subtypes responsible for cGMP hydrolysis remain to be identified in growth plate chondrocytes. Chemical compounds specifically targeting the signaling axis defined in this study would be useful drugs for not only clinical treatment of developmental disorders but also artificially modifying body sizes in farm and pet animals.
Materials and methods
Key resources table
| Reagent type (species) or resource | Designation | Source or reference | Identifiers | Additional information |
|---|---|---|---|---|
| Strain, strain background (Mus musculus) | Mouse: C57BL/6J | The Jackson Laboratory | Jax: 000664 | |
| Strain, strain background (Mus musculus) | Trpm7fl/fl, Col11a2-Cre mice | Qian et al., 2019 | N/A | |
| Strain, strain background (Mus musculus) | Npr2fl/fl, Col2a1-Cre mice | Nakao et al., 2015 | N/A | |
| Antibody | Anti-phospho-CaMKII (Thr 286) (Rabbit monoclonal) | Cell Signaling Technology | Cat#12716; RRID: AB_2713889 | IF (1:200)WB (1:1000) |
| Antibody | Anti-CaMKII (Rabbit monoclonal) | Abcam | Cat#EP1829Y; RRID: AB_868641 | WB (1:1000) |
| Antibody | Anti-GAPDH (Rabbit polyclonal) | Sigma-Aldrich | Cat#G9545; RRID: AB_796208 | WB (1:10,000) |
| Antibody | Anti-rabbit IgG-HRP (Mouse monoclonal) | Santa Cruz | Cat#sc-2357; RRID: AB_628497 | 1:2000 |
| Antibody | Anti-rabbit Alexa Flour 488 (Goat polyclonal) | Invitrogen | Cat#A-11008; RRID: AB_143165 | 1:50 |
| Sequence-based reagent | Mouse Npr1_F | This paper | PCR primers | AACAAGGAGAACAGCAGCAAC |
| Sequence-based reagent | Mouse Npr1_R | This paper | PCR primers | TATCAAATGCCTCAGCCTGGA |
| Sequence-based reagent | Mouse Npr2_F | This paper | PCR primers | GGCCCCATCCCTGATGAAC |
| Sequence-based reagent | Mouse Npr2_R | This paper | PCR primers | CCTGGTACCCCCTTCCTGTA |
| Sequence-based reagent | Mouse Npr3_F | This paper | PCR primers | GGTATGGGGACTTCTCTGTG |
| Sequence-based reagent | Mouse Npr3_R | This paper | PCR primers | TCTGGTCTCATCTAGTCTCA |
| Sequence-based reagent | FlFor | This paper | PCR primers | GTAACCTGGGTAGACTAGTTGTTGG |
| Sequence-based reagent | DelFor | This paper | PCR primers | TGTTATTTTGTGAGATGACG |
| Sequence-based reagent | Rev | This paper | PCR primers | ATGGTGGAGGAGGTCTTTAATTCC |
| Sequence-based reagent | Col2a1-Cre_F | This paper | PCR primers | CGTTGTGAGTTGGATAGTTG |
| Sequence-based reagent | Col2a1-Cre_R | This paper | PCR primers | CATTGCTGTCACTTGGTCGT |
| Sequence-based reagent | Mouse Prkg1_F | This paper | PCR primers | ATGGACTTTTTGTGGGACTC |
| Sequence-based reagent | Mouse Prkg1_R | This paper | PCR primers | GGTTTTCATTGGATCTGGGC |
| Sequence-based reagent | Mouse Prkg2_F | This paper | PCR primers | TTGCGGAAGAAAATGATGTCG |
| Sequence-based reagent | Mouse Prkg2_R | This paper | PCR primers | GAATGGGGAGGTTGAGGAGAA |
| Sequence-based reagent | Mouse Kcnma_F | Liu et al., 2021 | PCR primers | AATGCACTTCGAGGAGGCTA |
| Sequence-based reagent | Mouse Kcnma_R | Liu et al., 2021 | PCR primers | CTCAGCCGGTAAATTCCAAA |
| Sequence-based reagent | Mouse Kcnmb1_F | This paper | PCR primers | ACAACTGTGCTGCCCCTCTA |
| Sequence-based reagent | Mouse Kcnmb1_R | This paper | PCR primers | CACTGTTGGTTTTGATCCCG |
| Sequence-based reagent | Mouse Kcnmb2_F | This paper | PCR primers | TCAGGAGACACCAACACTTC |
| Sequence-based reagent | Mouse Kcnmb2_R | This paper | PCR primers | AGTTAGTTTCACCATAGCAA |
| Sequence-based reagent | Mouse Kcnmb3_F | This paper | PCR primers | GTGGATGACGGGCTGGACTT |
| Sequence-based reagent | Mouse Kcnmb3_R | This paper | PCR primers | GCACTTGGGGTTGGTCCTGA |
| Sequence-based reagent | Mouse Kcnmb4_F | This paper | PCR primers | CTCCTGACCAACCCCAAGT |
| Sequence-based reagent | Mouse Kcnmb4_R | This paper | PCR primers | TAAAATAGCAAGTGAATGGC |
| Sequence-based reagent | Mouse Kcnn1_F | Liu et al., 2021 | PCR primers | TCAAAAATGCTGCTGCAAAC |
| Sequence-based reagent | Mouse Kcnn1_R | Liu et al., 2021 | PCR primers | TCGTTCACCTTCCCTTGTTC |
| Sequence-based reagent | Mouse Kcnn2_F | Liu et al., 2021 | PCR primers | GATCTGGCAAAGACCCAGAA |
| Sequence-based reagent | Mouse Kcnn2_R | Liu et al., 2021 | PCR primers | GAAGTCCCTTTGCTGCTGTC |
| Sequence-based reagent | Mouse Kcnn3_F | Liu et al., 2021 | PCR primers | ACTTCAACACCCGATTCGTC |
| Sequence-based reagent | Mouse Kcnn3_R | Liu et al., 2021 | PCR primers | GGAAAGGAACGTGATGGAGA |
| Sequence-based reagent | Mouse Kcnn4_F | Liu et al., 2021 | PCR primers | GGCACCTCACAGACACACTG |
| Sequence-based reagent | Mouse Kcnn4_R | Liu et al., 2021 | PCR primers | TTTCTCCGCCTTGTTGAACT |
| Sequence-based reagent | Mouse Plcb1_F | Yamazaki et al., 2011 | PCR primers | CCCAAGTTGCGTGAACTTCT |
| Sequence-based reagent | Mouse Plcb1_R | Yamazaki et al., 2011 | PCR primers | GTTGCCAAGCTGAAAACCTC |
| Sequence-based reagent | Mouse Plcb2_F | Yamazaki et al., 2011 | PCR primers | ACATCCAGGAAGTGGTCCAG |
| Sequence-based reagent | Mouse Plcb2_R | Yamazaki et al., 2011 | PCR primers | CGCACCGACTCCTTTACTTC |
| Sequence-based reagent | Mouse Plcb3_F | Yamazaki et al., 2011 | PCR primers | CAGGCCAGCACAGAGACATA |
| Sequence-based reagent | Mouse Plcb3_R | Yamazaki et al., 2011 | PCR primers | AGGATGCTGGCAATCAAATC |
| Sequence-based reagent | Mouse Plcg1_F | This paper | PCR primers | AACGCTTTGAGGACTGGAGA |
| Sequence-based reagent | Mouse Plcg1_R | This paper | PCR primers | CTCCTCAATCTCTCGCAAGG |
| Sequence-based reagent | Mouse Plcg2_F | This paper | PCR primers | AACCCCAACCCACACGAGTC |
| Sequence-based reagent | Mouse Plcg2_R | This paper | PCR primers | AATGTTTCACCTTGCCCCTG |
| Sequence-based reagent | Mouse Trpm7_F | Qian et al., 2019 | PCR primers | ATTGCTTAGTTTTGGTGTTC |
| Sequence-based reagent | Mouse Trpm7_R | Qian et al., 2019 | PCR primers | GATTGTCGGGAGAGTGGAGT |
| Sequence-based reagent | Mouse Camk2a_F | This paper | PCR primers | CACCACCATTGAGGACGAAG |
| Sequence-based reagent | Mouse Camk2a_R | This paper | PCR primers | GGTTCAAAGGCTGTCATTCC |
| Sequence-based reagent | Mouse Camk2b_F | This paper | PCR primers | AAGCAGATGGAGTCAAGCC |
| Sequence-based reagent | Mouse Camk2b_R | This paper | PCR primers | TGCTGTCGGAAGATTCCAGG |
| Sequence-based reagent | Mouse Camk2d_F | This paper | PCR primers | GATAAACAACAAAGCCAACG |
| Sequence-based reagent | Mouse Camk2d_R | This paper | PCR primers | GTAAGCCTCAAAGTCCCCAT |
| Sequence-based reagent | Mouse Camk2g_F | This paper | PCR primers | CAAGAACAGCAAGCCTATCC |
| Sequence-based reagent | Mouse Camk2g_R | This paper | PCR primers | CCTCTGACTGACTGGTGCGA |
| Sequence-based reagent | Mouse Pde2a_F | This paper | PCR primers | ATCTTTGACCACTTCTCTCG |
| Sequence-based reagent | Mouse Pde2a_R | This paper | PCR primers | CATAACCCACTTCAGCCATC |
| Sequence-based reagent | Mouse Pde3a_F | This paper | PCR primers | AACTATACCTGCTCGGACTC |
| Sequence-based reagent | Mouse Pde3a_R | This paper | PCR primers | TTCGTGCGGCTTTATGCTGG |
| Sequence-based reagent | Mouse Pde3b_F | This paper | PCR primers | ATTCCAAAGCAGAGGTCATC |
| Sequence-based reagent | Mouse Pde3b_R | This paper | PCR primers | GTTAGAGAGCCAGCAGACAC |
| Sequence-based reagent | Mouse Pde5a_F | This paper | PCR primers | GACCCTTGCGTTGCTCATTG |
| Sequence-based reagent | Mouse Pde5a_R | This paper | PCR primers | TGATGGAGTGACAGTACAGC |
| Sequence-based reagent | Mouse Pde6a_F | This paper | PCR primers | AACCCACCCGCTGACCACTG |
| Sequence-based reagent | Mouse Pde6a_R | This paper | PCR primers | CTCTTCCTTCTTGTTGACGA |
| Sequence-based reagent | Mouse Pde6b_F | This paper | PCR primers | TCCGGGCCTATCTAAACTGC |
| Sequence-based reagent | Mouse Pde6b_R | This paper | PCR primers | AGAAGACAATTTCCCGGCCAT |
| Sequence-based reagent | Mouse Pde6c_F | This paper | PCR primers | TTGCTCAGGAAATGGTTATG |
| Sequence-based reagent | Mouse Pde6c_R | This paper | PCR primers | GAAACAGAACTCGTACAGGT |
| Sequence-based reagent | Mouse Pde6d_F | This paper | PCR primers | CCCAAGAAAATCCTCAAGTG |
| Sequence-based reagent | Mouse Pde6d_R | This paper | PCR primers | ACAAAGCCAAACTCGAAGAA |
| Sequence-based reagent | Mouse Pde6g_F | This paper | PCR primers | AAGGGTGAGATTCGGTCAGC |
| Sequence-based reagent | Mouse Pde6g_R | This paper | PCR primers | TCATCCCCAAACCCTTGCAC |
| Sequence-based reagent | Mouse Pde6h_F | This paper | PCR primers | GGCAGACTCGACAGTTCAAGA |
| Sequence-based reagent | Mouse Pde6h_R | This paper | PCR primers | CTCCAGATGGCTGAACGCT |
| Sequence-based reagent | Mouse Pde10a_F | This paper | PCR primers | CATCCGCAAAGCCATCATCG |
| Sequence-based reagent | Mouse Pde10a_R | This paper | PCR primers | TCTCATCACCCTCAGCCCAG |
| Sequence-based reagent | Mouse Lpar1_F | This paper | PCR primers | GCTTGGTGCCTTTATTGTCT |
| Sequence-based reagent | Mouse Lpar1_R | This paper | PCR primers | GGTAGGAGTAGATGATGGGG |
| Sequence-based reagent | Mouse Lpar2_F | This paper | PCR primers | AGTGTGCTGGTATTGCTGAC |
| Sequence-based reagent | Mouse Lpar2_R | This paper | PCR primers | TTTGATGGAGAGCCTGGCAG |
| Sequence-based reagent | Mouse Lpar3_F | This paper | PCR primers | ACTTTCCCTTCTACTACCTG |
| Sequence-based reagent | Mouse Lpar3_R | This paper | PCR primers | GTCTTTCCACAGCAATAACC |
| Sequence-based reagent | Mouse Lpar4_F | This paper | PCR primers | CCTCAGTGGTGGTATTTCAG |
| Sequence-based reagent | Mouse Lpar4_R | This paper | PCR primers | CACAGAAGAACAAGAAACAT |
| Sequence-based reagent | Mouse Lpar5_F | This paper | PCR primers | AACACGACTTCTACCAACAG |
| Sequence-based reagent | Mouse Lpar5_R | This paper | PCR primers | AAGACCCAGAGAGCCAGAGC |
| Sequence-based reagent | Mouse Lpar6_F | This paper | PCR primers | TACTTTGCCATTTCGGATTT |
| Sequence-based reagent | Mouse Lpar6_R | This paper | PCR primers | GCACTTCCTCCCATCACTGT |
| Sequence-based reagent | Mouse Atp2a1_F | Liu et al., 2021 | PCR primers | CAAAACAGGGACCCTCACCA |
| Sequence-based reagent | Mouse Atp2a1_R | Liu et al., 2021 | PCR primers | GCCAGTGATGGAGAACTCGT |
| Sequence-based reagent | Mouse Atp2a2_F | Liu et al., 2021 | PCR primers | AAACCAGATGTCCGTGTGCA |
| Sequence-based reagent | Mouse Atp2a2_R | Liu et al., 2021 | PCR primers | TGATGGCACTTCACTGGCTT |
| Sequence-based reagent | Mouse Atp2a3_F | Liu et al., 2021 | PCR primers | CCTCGGTCATCTGCTCTGAC |
| Sequence-based reagent | Mouse Atp2a3_R | Liu et al., 2021 | PCR primers | CGTGGTACCCGAAATGGTGA |
| Sequence-based reagent | Mouse Pln_F | This paper | PCR primers | TACCTCACTCGCTCGGCTAT |
| Sequence-based reagent | Mouse Pln_R | This paper | PCR primers | TGACGGAGTGCTCGGCTTTA |
| Sequence-based reagent | Mouse Sox9_F | Qian et al., 2019 | PCR primers | AGGAAGCTGGCAGACCAGTA |
| Sequence-based reagent | Mouse Sox9_R | Qian et al., 2019 | PCR primers | CGTTCTTCACCGACTTCCTC |
| Sequence-based reagent | Mouse Sox5_F | Qian et al., 2019 | PCR primers | CTCGCTGGAAAGCTATGACC |
| Sequence-based reagent | Mouse Sox5_R | Qian et al., 2019 | PCR primers | GATGGGGATCTGTGCTTGTT |
| Sequence-based reagent | Mouse Sox6_F | Qian et al., 2019 | PCR primers | GGATTGGGGAGTACAAGCAA |
| Sequence-based reagent | Mouse Sox6_R | Qian et al., 2019 | PCR primers | CATCTGAGGTGATGGTGTGG |
| Sequence-based reagent | Mouse Runx2_F | Qian et al., 2019 | PCR primers | GCCGGGAATGATGAGAACTA |
| Sequence-based reagent | Mouse Runx2_R | Qian et al., 2019 | PCR primers | GGACCGTCCACTGTCACTTT |
| Sequence-based reagent | Mouse Pthlh_F | Qian et al., 2019 | PCR primers | CTCCCAACACCAAAAACCAC |
| Sequence-based reagent | Mouse Pthlh_R | Qian et al., 2019 | PCR primers | GCTTGCCTTTCTTCTTCTTC |
| Sequence-based reagent | Mouse Acan_F | Qian et al., 2019 | PCR primers | CCTCACCATCCCCTGCTACT |
| Sequence-based reagent | Mouse Acan_R | Qian et al., 2019 | PCR primers | ACTTGATTCTTGGGGTGAGG |
| Sequence-based reagent | Mouse Col10a1_F | Qian et al., 2019 | PCR primers | CAAGCCAGGCTATGGAAGTC |
| Sequence-based reagent | Mouse Col10a1_R | Qian et al., 2019 | PCR primers | AGCTGGGCCAATATCTCCTT |
| Sequence-based reagent | Mouse Col2a1_F | Qian et al., 2019 | PCR primers | CACACTGGTAAGTGGGGCAAGACCG |
| Sequence-based reagent | Mouse Col2a1_R | Qian et al., 2019 | PCR primers | GGATTGTGTTGTTTCAGGGTTCGGG |
| Sequence-based reagent | Mouse 18 S_F | Qian et al., 2019 | PCR primers | AGACAAATCGCTCCACCAAC |
| Sequence-based reagent | Mouse 18 S_R | Qian et al., 2019 | PCR primers | CTCAACACGGGAAACCTCAC |
| Sequence-based reagent | Mouse Actb_F | Qian et al., 2019 | PCR primers | CATCCGTAAAGACCTCTATGCCAAC |
| Sequence-based reagent | Mouse Actb_R | Qian et al., 2019 | PCR primers | ATGGAGCCACCGATCCACA |
| Sequence-based reagent | Mouse Gapdh_F | Qian et al., 2019 | PCR primers | TGTGTCCGTCGTGGATCTGA |
| Sequence-based reagent | Mouse Gapdh_R | Qian et al., 2019 | PCR primers | TTGCTGTTGAAGTCGCAGGAG |
| Peptide, recombinant protein | ANP (Human, 1–28) | Peptide Institute | Cat#4135 | |
| Peptide, recombinant protein | CNP-22 (Human) | Peptide Institute | Cat#4229 | |
| Commercial assay or kit | Amersham ECL Prime Western Blotting Detection Reagent | Cytiva | Cat#RPN2232 | |
| Commercial assay or kit | ISOGEN | NipponGene | Cat#319-90211 | |
| Commercial assay or kit | ReverTra Ace qPCR RT Master Mix with gDNA Remover | TOYOBO | Cat#FSQ-301 | |
| Chemical compound, drug | FTY720 | Sigma-Aldrich | SML0700; CAS: 162359-56-0 | |
| Chemical compound, drug | Fura-2 AM | DOJINDO | F025; CAS: 108964-32-5 | |
| Chemical compound, drug | Hyaluronidase from sheep testes | Sigma-Aldrich | H2126; CAS: 37326-33-3 | |
| Chemical compound, drug | KN93 | WAKO | 115-00641; CAS: 139298-40-1 | |
| Chemical compound, drug | KT5823 | Cayman Chemical | 10010965; CAS: 126643-37-6 | |
| Chemical compound, drug | NNC 550396 dihydrochloride | Tocris Bioscience | 2268; CAS: 357400-13-6 | |
| Chemical compound, drug | NS1619 | Sigma-Aldrich | N170; CAS: 153587-01-0 | |
| Chemical compound, drug | 1-Oleoyl lysophosphatidic acid | Cayman Chemical | 62215: CAS: 325465-93-8 | |
| Chemical compound, drug | Oxonol VI | Sigma-Aldrich | 75926; CAS: 64724-75-0 | |
| Chemical compound, drug | Paxilline | Tocris Bioscience | 2006; CAS: 57186-25-1 | |
| Chemical compound, drug | 8-pCPT-cGMP | Biolog | C009; CAS: 51239-26-0 | |
| Chemical compound, drug | Thapsigargin | Nacalai Tesque | 33637-31; CAS: 67526-95-8 | |
| Chemical compound, drug | U73122 | Sigma-Aldrich | U6756; CAS: 112648-68-7 | |
| Software, algorithm | Adobe Ilustrator | Adobe Systems | http://www.adobe.com/products/illustrator.html | |
| Software, algorithm | GraphPad Prism v7 | GraphPad | https://www.graphpad.com/ | |
| Software, algorithm | ImageJ | N/A | https://imagej.nih.gov/ij/ | |
| Software, algorithm | Leica Application Suite X | Leica MIcrosystems | https://www.leica-microsystems.com/products/microscope-software/p/leica-las-x-ls/ |
Reagents, primers, and mice
Request a detailed protocolReagents and antibodies used in this study, and synthetic primers used for RT-PCR analysis and mouse genotyping are listed in Key Resourses Table. C57BL mice were used as wild-type mice in this study. Chondrocyte-specific Trpm7-knockout mice with C57BL genetic background were generated by crossing Trpm7fl/fl mice (Qian et al., 2019) with transgenic mice carrying Col11a2-Cre, originally designated as 11Enh-Cre (Iwai et al., 2008) Using primer sets for detecting Col11a2-Cre transgene and Trpm7 alleles, we previously reported that Trpm7 is specifically inactivated in cartilage tissues from the Trpm7flfl, Col11a2-Cre+/− mice (Qian et al., 2019). Chondrocyte-specific Npr2-knockout mice with C57BL background were generated as previously described (Nakao et al., 2015), and we designed primers for detecting the Col2a1-Cre transgene and the floxed Npr2 gene in this study (Figure 1—figure supplement 1).
Bone slice preparations
Request a detailed protocolFemoral bones were isolated from E17.5 mice and immersed in a physiological salt solution (PSS): (in mM) 150 NaCl, 4 KCl, 1 MgCl2, 2 CaCl2, 5.6 glucose, and 5 2-[4-(2-Hydroxyethyl)-1-piperazinyl]ethanesulfonic acid (HEPES, pH 7.4). Longitudinal bone slices (~40 µm thickness) were prepared using a vibrating microslicer (DTK-1000N, Dosaka EM Co., Japan) as previously described (Qian et al., 2019).
Ca2+ imaging
Request a detailed protocolFura-2 Ca2+ imaging of bone slices was performed as previously described (Qian et al., 2019). Briefly, bone slices placed on glass-bottom dishes (Matsunami, Japan) were incubated in PSS containing 15 μM Fura-2AM for 1 hr at 37°C. Fluorescence microscopy distinguished round, columnar, and hypertrophic chondrocytes with characteristic morphological features in the bone slices loaded with Fura-2. For ratiometric imaging, excitation light of 340 and 380 nm was alternately delivered, and emission light of >510 nm was detected by a cooled EM-CCD camera (Model C9100-13; Hamamatsu Photonics, Japan) mounted on an upright fluorescence microscope (DM6 FS, Leica) using a ×40 water-immersion objective (HCX APO L, Leica). In typical measurements, ~30 round chondrocytes were randomly examined in each slice preparation to select the Ca2+ fluctuation-positive cells generating spontaneous events (>0.025 in Fura-2 ratio) using commercial software (Leica Application Suite X), and recording traces from the positive cells were then analyzed using Fiji/ImageJ software (US. NIH) for examining Ca2+ fluctuation amplitude and frequency. Imaging experiments were performed at room temperature (23–25°C) and PSS was used as the normal bathing solution. For the pretreatments of CNP, ANP, and 8-pCPT-cGMP, bone slices were immersed in PSS with the indicated compound for 1 hr at room temperature after Fura-2 loading.
Membrane potential monitoring
Request a detailed protocolBone slices were perfused with the PSS containing 200 nM oxonol VI at room temperature and analyzed as previously described (Yamazaki et al., 2011). To prepare the calibration plot showing the relationship between the fluorescence intensity and membrane potential, saline solutions containing 20, 40, 60, or 100 mM KCl were used as bathing solutions. Fluorescence images with excitation at 559 nm and emission at >606 nm were captured at a sampling rate of ~7.0 s using a confocal laser scanning microscope (FV1000; Olympus).
Immunochemical analysis of CaMKII
Request a detailed protocolBone slices were pretreated with or without CNP were subjected to immunochemical assessments as previously described (Li et al., 2011). Briefly, for immunohistochemical analysis, bone slices were fixed in 4% paraformaldehyde and treated with 1% hyaluronidase to enhance immunodetection (Ahrens and Dudley, 2011; Mouser et al., 2016). After blocking with fetal bovine serum-containing solution, bone slices were reacted with primary and Alexa 488-conjugated secondary antibodies and observed with a confocal microscope (FV1000; Olympus). For immunoblot analysis, bone slices were lysed in the buffer containing 4% sodium deoxycholate, 20 mM Tris–HCl (pH 8.8) and a phosphatase inhibitor cocktail (100 mM NaF, 10 mM Na3PO4, 1 mM Na2VO3, and 20 mM β-glycerophosphate). The resulting lysate proteins were electrophoresed on sodium dodecyl sulfate–polyacrylamide gels and electroblotted onto nylon membranes for immunodetection using primary and Horseradish peroxidase (HRP)-conjugated secondary antibodies. Antigen proteins were visualized using a chemiluminescence reagent and image analyzer (Amersham Imager 600, Cytiva). The immunoreactivities yielded were quantitatively analyzed by means of Fiji/ImageJ software.
Metatarsal organ culture
Request a detailed protocolMetatarsal bone rudiments were cultured as previously described (Houston et al., 2016). Briefly, the three central metatarsal rudiments were dissected from E15.5 mice and cultured in αMEM containing 5 μg/ml ascorbic acid, 1 mM β-glycerophosphate pentahydrate, 100 units/ml penicillin, 100 μg/ml streptomycin and 0.2% bovine serum albumin (fatty acid free). The explants were analyzed under a photomicroscope (BZ-X710, Keyence, Japan) for size measurements using Fiji/ImageJ software.
Histological analysis
Request a detailed protocolFor histological analysis, cultured bones were fixed in 4% paraformaldehyde, embedded in Super Cryoembedding Medium (Section-lab, Japan), and frozen in liquid nitrogen. Serial cryosections (6 μm in thickness) were prepared from the fixed specimens and stained with hematoxylin and eosin. In the sectional images, round, columnar, and hypertrophic chondrocytes were distinguished by their characteristic morphological features. Microscopic images were quantitatively analyzed using Fiji/ImageJ software.
Gene expression analysis
Request a detailed protocolQuantitative RT-PCR analysis was performed as previously described (Zhao et al., 2016). From femoral epiphyses, the terminal region containing round chondrocytes and the adjacent region enriched with columnar and hypertrophic chondrocytes were separated under stereo-microscope. Femoral and humeral speciemens were subjected to total RNA preparation using a commercial reagent (Isogen) for cDNA synthesis using a commercial kit (ReverTra ACE qPCR-RT kit). The resulting cDNAs were examined by real-time PCR (LightCycler 480 II, Roche), and the cycle threshold was determined from the amplification curve as an index for relative mRNA content in each reaction.
Quantification and statistical analysis
Request a detailed protocolAll data obtained are presented as the means ± standard error of the mean with n values indicating the number of examined mice. Student t-test and analysis of variance were used for two-group and multiple group comparisons, respectively (Prism 7, GraphPad Software Inc): p < 0.05 was considered to be statistically significant.
Data availability
All data generated or analysed during this study are included in the manuscript and supporting files. Source data files have been provided for Figures 1, 2, 3, 4, 5, 6, 7 and 8.
References
-
Chemical pretreatment of growth plate cartilage increases immunofluorescence sensitivityThe Journal of Histochemistry and Cytochemistry 59:408–418.https://doi.org/10.1369/0022155411400869
-
Cardioprotection by H2S engages a cGMP-dependent protein kinase G/phospholamban pathwayCardiovascular Research 106:432–442.https://doi.org/10.1093/cvr/cvv129
-
Voltage-gated K+ currents in mouse articular chondrocytes regulate membrane potentialChannels (Austin, Tex.) 4:179–191.https://doi.org/10.4161/chan.4.3.11629
-
Hydrogen peroxide stimulates the Ca(2+)-activated big-conductance K channels (BK) through cGMP signaling pathway in cultured human endothelial cellsCellular Physiology and Biochemistry 22:119–126.https://doi.org/10.1159/000149789
-
BookTRPM7In: Fleig A, editors. Handbook of Experimental Pharmacology. Springer. pp. 521–546.https://doi.org/10.1007/978-3-642-54215-2_21
-
Cyclic GMP-dependent protein kinase activates cloned BKCa channels expressed in mammalian cells by direct phosphorylation at serine 1072The Journal of Biological Chemistry 274:10927–10935.https://doi.org/10.1074/jbc.274.16.10927
-
Culture of Murine Embryonic Metatarsals: A Physiological Model of Endochondral OssificationJournal of Visualized Experiments 1:e54978.https://doi.org/10.3791/54978
-
Inhibition of Galphaq-dependent PLC-beta1 activity by PKG and PKA is mediated by phosphorylation of RGS4 and GRK2American Journal of Physiology. Cell Physiology 292:C200–C208.https://doi.org/10.1152/ajpcell.00103.2006
-
Smad7 Inhibits chondrocyte differentiation at multiple steps during endochondral bone formation and down-regulates p38 MAPK pathwaysThe Journal of Biological Chemistry 283:27154–27164.https://doi.org/10.1074/jbc.M801175200
-
Phosphorylation of GSK-3beta by cGMP-dependent protein kinase II promotes hypertrophic differentiation of murine chondrocytesThe Journal of Clinical Investigation 118:2506–2515.https://doi.org/10.1172/JCI35243
-
Involvement of the NO/sGC/cGMP/K+ channels pathway in vascular relaxation evoked by two non-quinazoline α1-adrenoceptor antagonistsBiomedicine & Pharmacotherapy = Biomedecine & Pharmacotherapie 103:157–166.https://doi.org/10.1016/j.biopha.2018.04.034
-
[Ca2+]i homeostasis and cyclic nucleotide relaxation in aorta of phospholamban-deficient miceThe American Journal of Physiology 277:H963–H970.https://doi.org/10.1152/ajpheart.1999.277.3.H963
-
Calcium/calmodulin-dependent protein kinase II activity regulates the proliferative potential of growth plate chondrocytesDevelopment (Cambridge, England) 138:359–370.https://doi.org/10.1242/dev.052324
-
Central role of guanylyl cyclase in natriuretic peptide signaling in hypertension and metabolic syndromeMolecular and Cellular Biochemistry 334:53–65.https://doi.org/10.1007/s11010-009-0326-8
-
The natriuretic peptide family Curr Opin Nephrol HypertensCurrent Opinion in Nephrology and Hypertension 5:4–11.https://doi.org/10.1097/00041552-199601000-00003
-
Role of C-type natriuretic peptide signalling in maintaining cartilage and bone functionOsteoarthritis and Cartilage 22:1800–1807.https://doi.org/10.1016/j.joca.2014.07.018
-
Role of the natriuretic peptide system in normal growth and growth disordersHormone Research in Paediatrics 82:222–229.https://doi.org/10.1159/000365049
-
Endocrine regulation of longitudinal bone growthEndocrine Development 21:30–41.https://doi.org/10.1159/000328119
-
MECHANISMS IN ENDOCRINOLOGY: Novel genetic causes of short statureEuropean Journal of Endocrinology 174:R145–R173.https://doi.org/10.1530/EJE-15-0937
-
Phosphorylation and regulation of G-protein-activated phospholipase C-beta 3 by cGMP-dependent protein kinasesThe Journal of Biological Chemistry 276:19770–19777.https://doi.org/10.1074/jbc.M006266200
-
Natriuretic Peptide Regulation of Endochondral OssificationJournal of Biological Chemistry 273:11695–11700.https://doi.org/10.1074/jbc.273.19.11695
-
Natriuretic peptides in cardiometabolic regulation and diseaseNature Reviews. Cardiology 11:403–412.https://doi.org/10.1038/nrcardio.2014.64
Article and author information
Author details
Funding
Japan Society for the Promotion of Science (21H02663)
- Hiroshi Takeshima
Japan Society for the Promotion of Science (20H03802)
- Atsuhiko Ichimura
Japan Society for the Promotion of Science (21K19565)
- Atsuhiko Ichimura
Japan Agency for Medical Research and Development (JP19am0101092j0003)
- Hiroshi Takeshima
Takeda Medical Research Foundation
- Atsuhiko Ichimura
Kobayashi International Scholarship Foundation
- Atsuhiko Ichimura
Nakatomi Foundation
- Atsuhiko Ichimura
Vehicle Racing Commemorative Foundation
- Hiroshi Takeshima
Mother and Child Health Foundation
- Atsuhiko Ichimura
The funders had no role in study design, data collection, and interpretation, or the decision to submit the work for publication.
Acknowledgements
We thank Jun Matsushita (Graduate School of Pharmaceutical Sciences, Kyoto University) for mouse in vitro fertilization. This work was supported in part by the MEXT/JSPS (KAKENHI Grant Number 21H02663, 20H03802, and 21K19565), Platform Project for Supporting Drug Discovery and Life Science Research (JP19am0101092j0003), Takeda Science Foundation, Kobayashi International Scholarship Foundation, the NAKATOMI Foundation, Vehicle Racing Commemorative Foundation, The Mother and Child Health Foundation, and Japan Foundation for Applied Enzymology. Y.M. is grateful for Fujita Jinsei Scholarship from Graduate School of Pharmaceutical Sciences, Kyoto University. F.L. is grateful for Scholarship from Graduate Program for Medical Innovation, Kyoto University, and Otsuka Toshimi Scholarship Foundation.
Ethics
All experiments in this study were conducted with the approval of the Animal Research Committee according to the regulations on animal experimentation at Kyoto University.
Copyright
© 2022, Miyazaki et al.
This article is distributed under the terms of the Creative Commons Attribution License, which permits unrestricted use and redistribution provided that the original author and source are credited.
Metrics
-
- 2,006
- views
-
- 310
- downloads
-
- 25
- citations
Views, downloads and citations are aggregated across all versions of this paper published by eLife.
Citations by DOI
-
- 25
- citations for umbrella DOI https://doi.org/10.7554/eLife.71931
Download links
A two-part list of links to download the article, or parts of the article, in various formats.
Downloads (link to download the article as PDF)
Open citations (links to open the citations from this article in various online reference manager services)
Cite this article (links to download the citations from this article in formats compatible with various reference manager tools)
C-type natriuretic peptide facilitates autonomic Ca2+ entry in growth plate chondrocytes for stimulating bone growth
eLife 11:e71931.
https://doi.org/10.7554/eLife.71931


