SARS-CoV-2 Nsp14 mediates the effects of viral infection on the host cell transcriptome
- Department of Biology, Brandeis University, United States
Figures
Figure 1
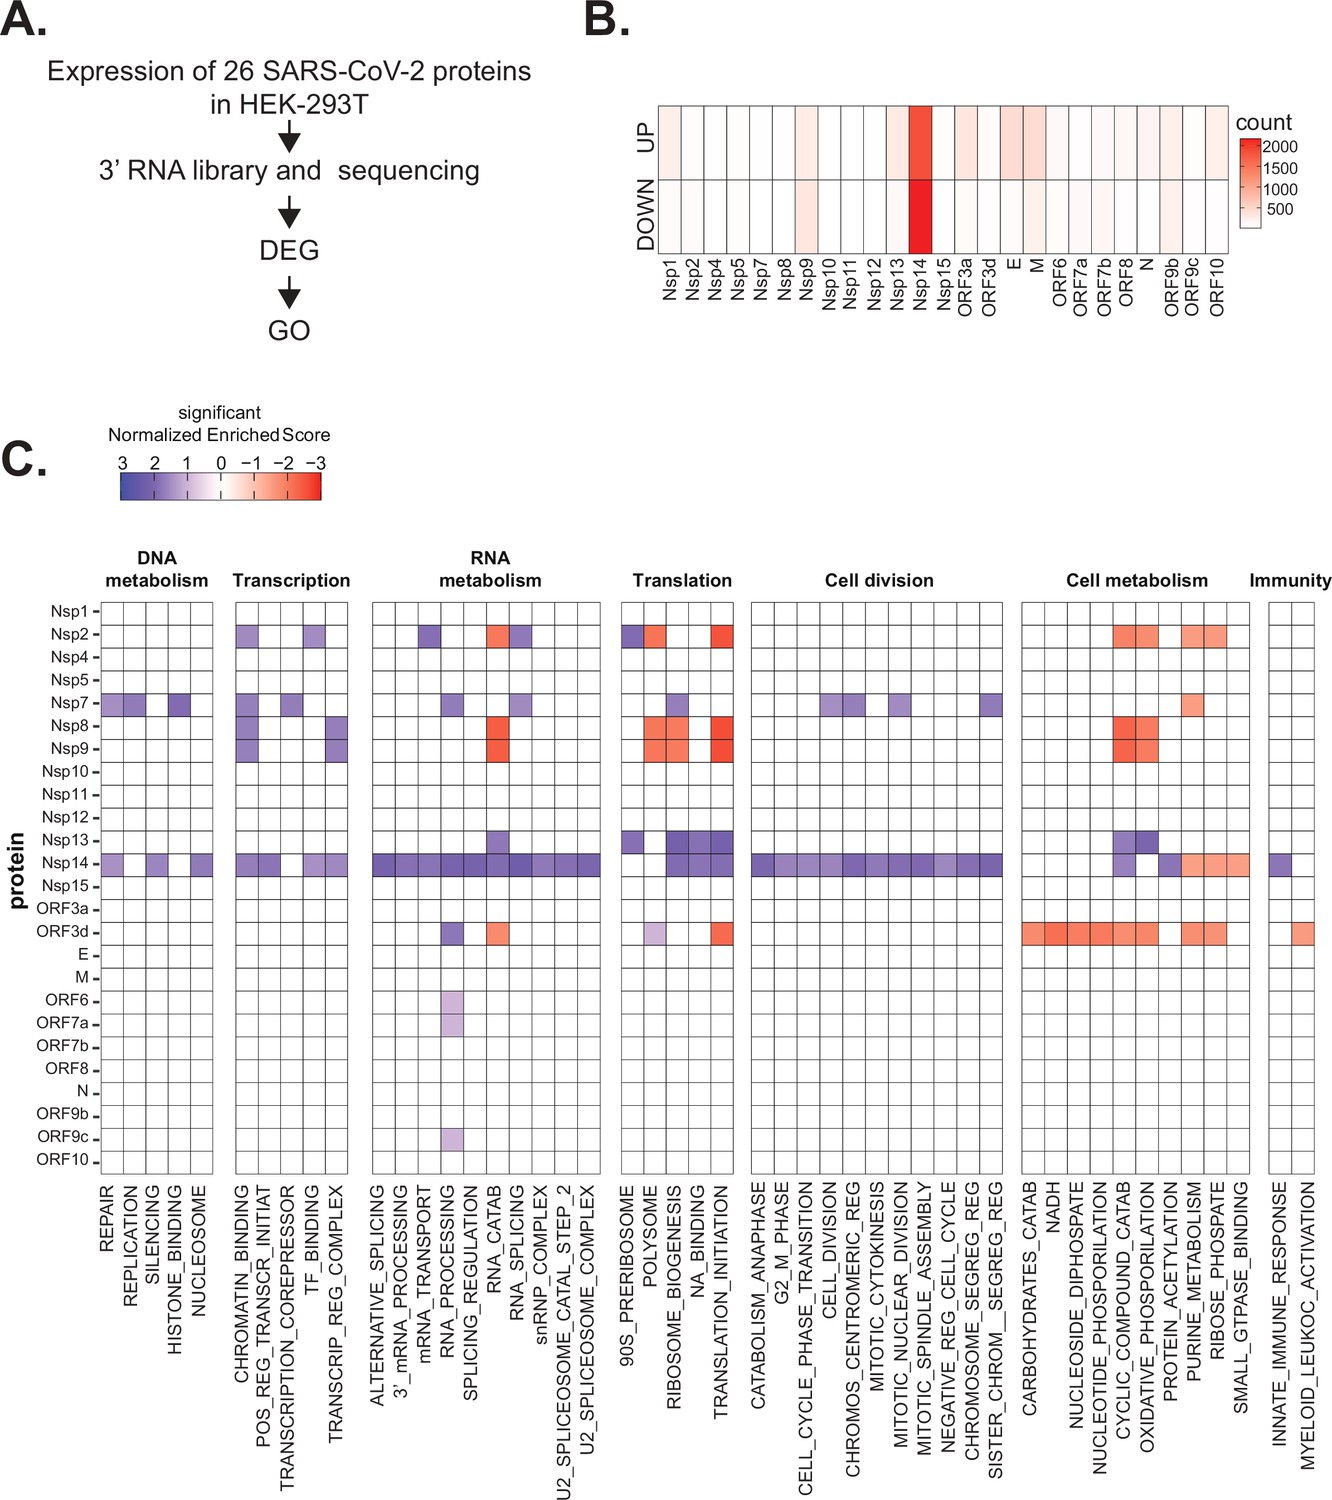
Severe acute respiratory syndrome coronavirus 2 (SARS-CoV-2) proteins alter gene expression distinctively.
(A) Scheme of the experimental approach. DEGs stands for differentially expressed genes and GO for Gene Ontology. (B) Heatmap showing the number of DEGs detected in 3’ RNA sequencing for each expressed SARS-CoV-2 protein. ‘Up’ stands for upregulated genes, ‘Down’ for downregulated genes. Lfc < 0.5, corrected p-value < 0.05. (C) Heatmap showing the GO analysis (colors represent the significant normalized enriched score).
Figure 2 with 2 supplements
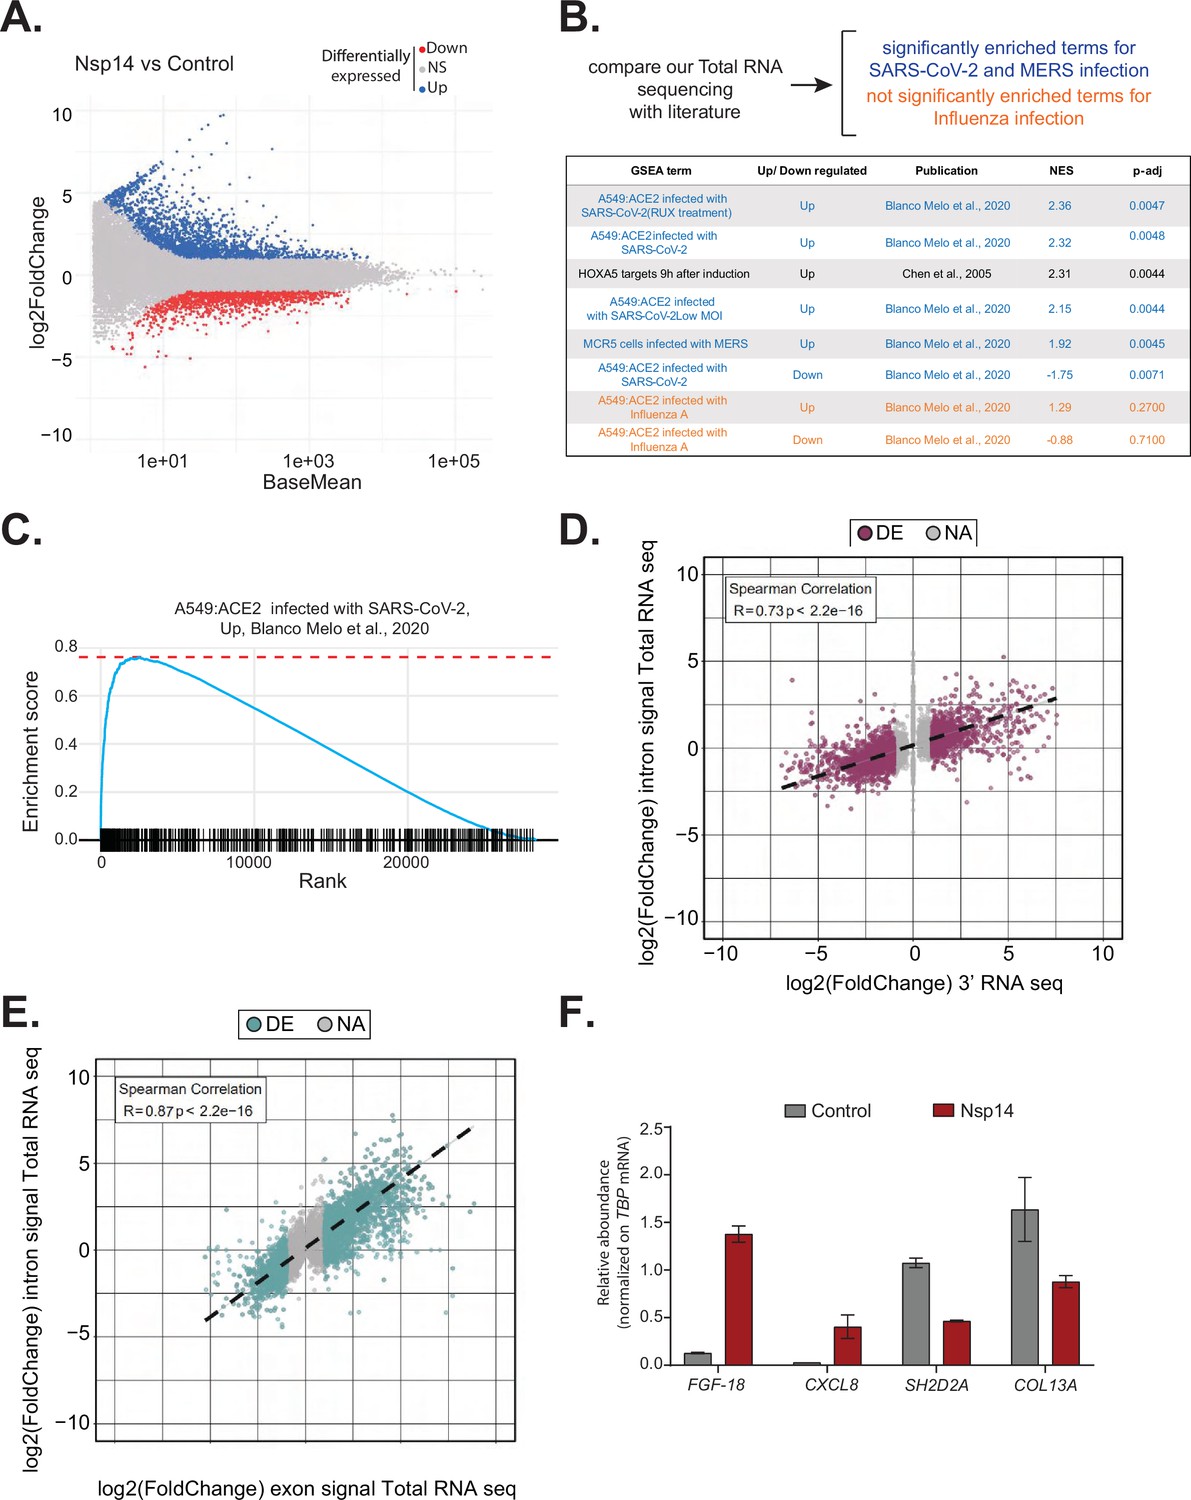
Expression of Nsp14 induces transcriptional changes like severe acute respiratory syndrome coronavirus 2 (SARS-CoV-2) infection.
(A) MA plot showing the fold change of expression in samples expressing Nsp14 compared to control detected in the total RNA sequencing (RNA-seq). In red significantly downregulated genes, in blue upregulated genes, and in gray non significantly deregulated genes. (B) Scheme representing the approach to determine the overlap with our total RNA-seq data and already published dataset (top). Table reporting the gene set enrichment analysis (GSEA) terms, up- or downregulation, publication, the normalized enriched score (NES), and adjusted p-value (p-adj) when comparing our total RNA-seq data with previously published datasets. Significant terms related to SARS-CoV-2 and MERS infection are indicated in blue, non-significant terms related to influenza A infection are indicated in orange (bottom). (C) Example of GSEA. (D) Nsp14 expression vs. control fold change of intronic signal from total RNA-seq vs. 3’ RNA-seq signal in logarithmic scale for each detected gene. Colored dots represent significantly changing genes (fold change = 2, adjusted p-value < 0.05, N = 3). (E) Nsp14 expression vs. control fold change of intronic signal from total RNA-seq vs. exonic signal from total RNA-seq in logarithmic scale for each detected gene. Colored dots represent significantly changing genes (fold change = 2, adjusted p-value < 0.05, N = 3). (F) RT-qPCR showing the abundance of FGF-18, CXCL8, SH2D2A, and COL13A in the chromatin-bound RNA fraction in cells transfected with an empty plasmid (control) or with Nsp14 (Nsp14). Data represented as mean ± SEM, N = 3.
Figure 2—figure supplement 1
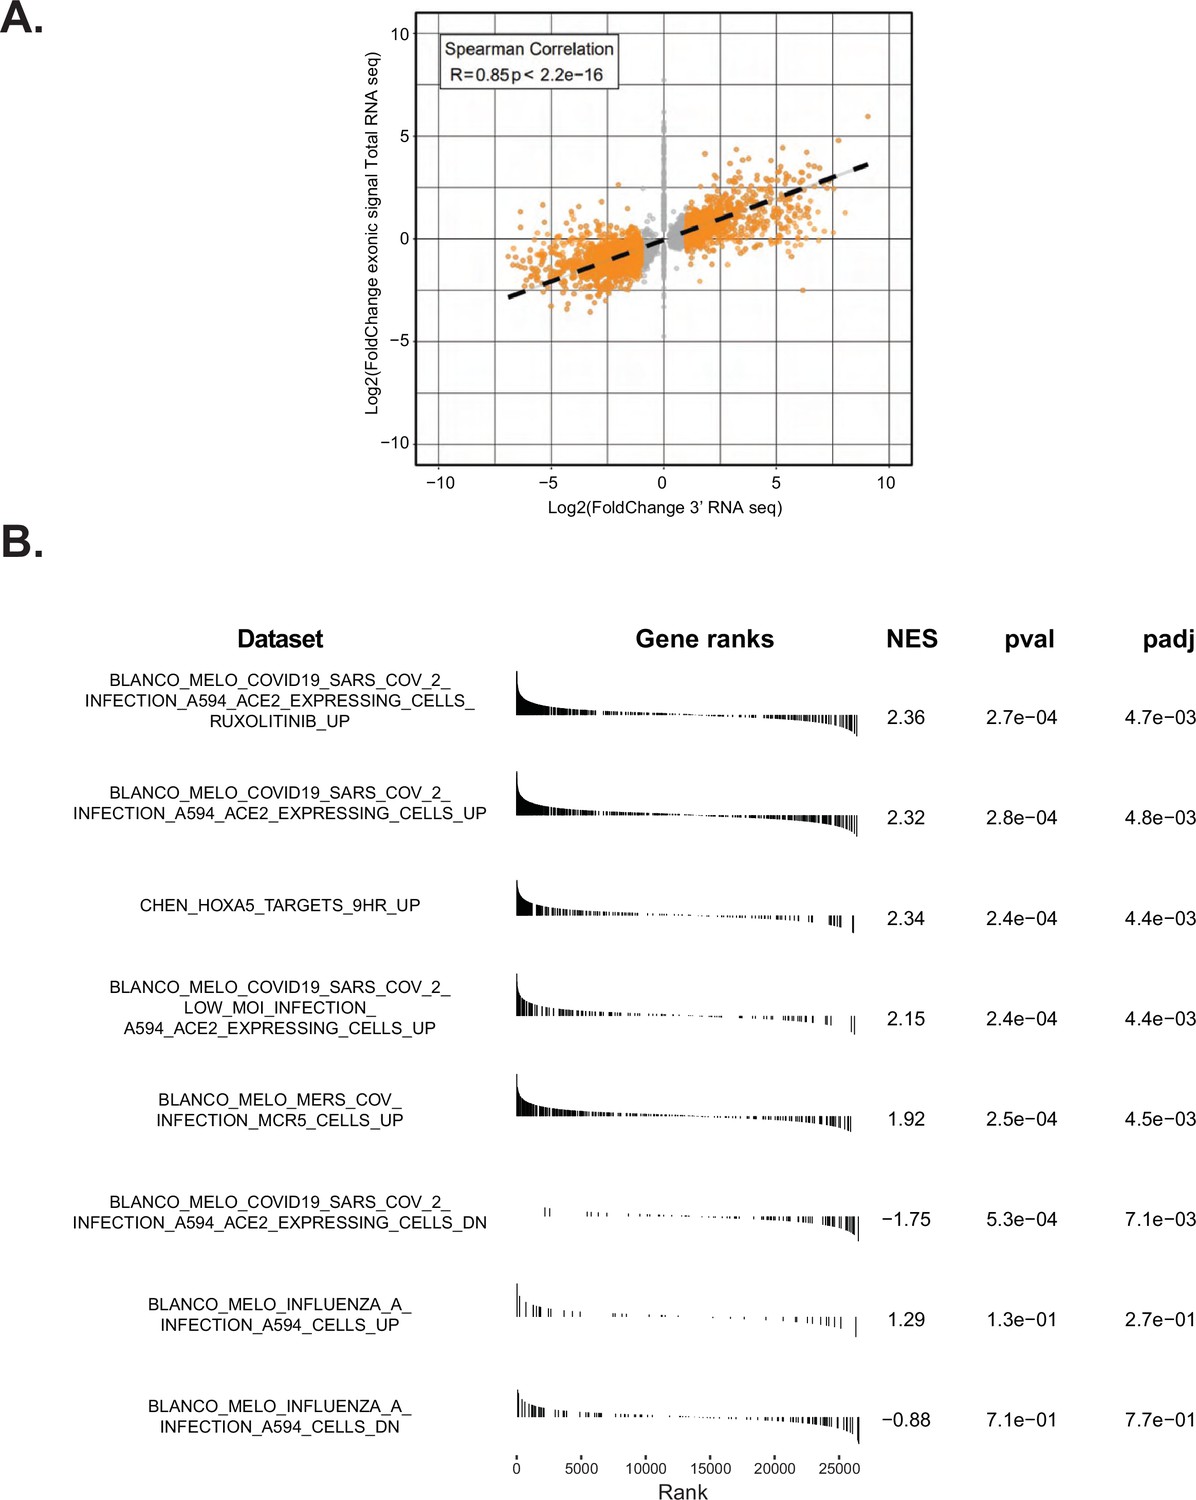
Expression of Nsp14 induces transcriptional changes as SARS-CoV2 infection.
(A) Plot showing the overlap between the 3’ RNA sequencing (RNA-seq) dataset and the total RNA-seq dataset. (B) Gene set enrichment analysis (GSEA) showing that Nsp14 expression resembles severe acute respiratory syndrome coronavirus 2 (SARS-CoV-2) infection.
Figure 2—figure supplement 2
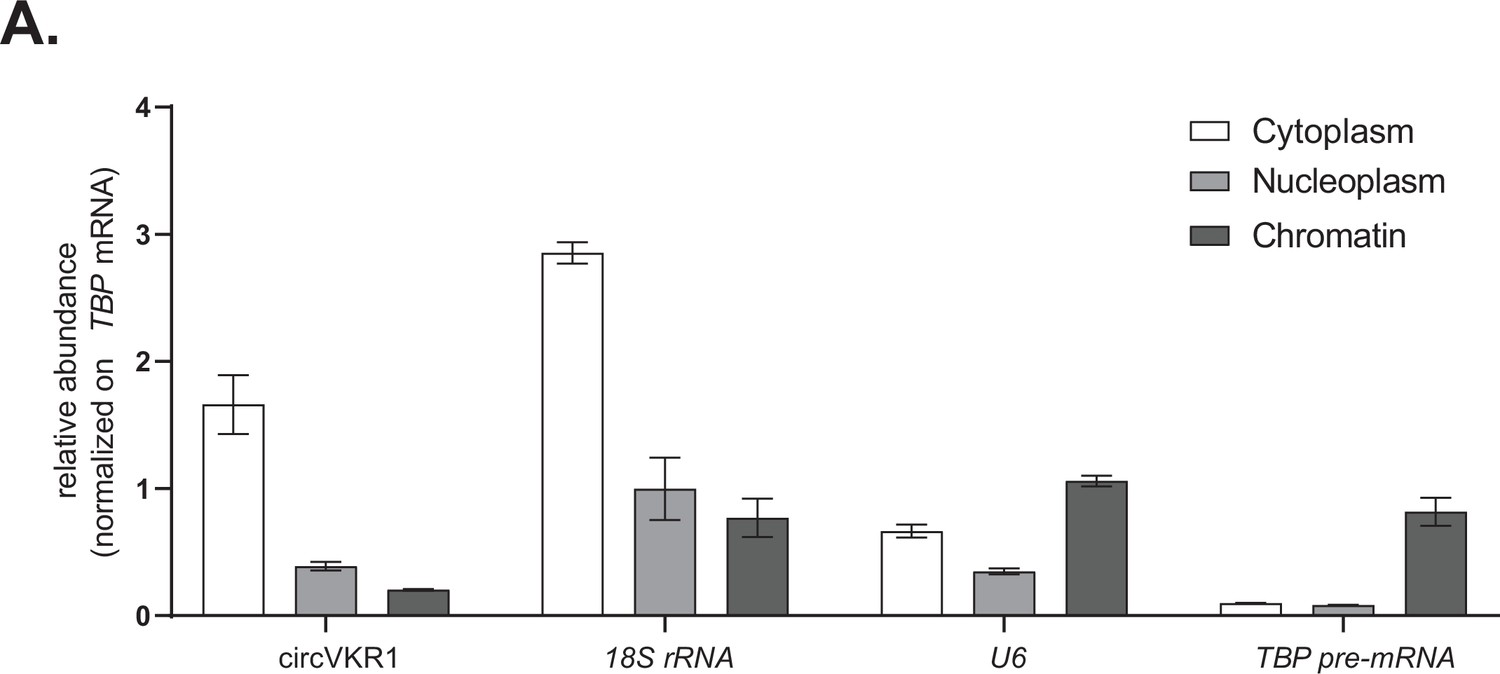
Controls for subcellular fractionations and nascent RNA extractions.
(A) Representative RT-qPCR showing the abundance of the indicated targets (circVKR1, 18S rRNA, U6, and TBP pre-mRNA) in the indicated subcellular fractions (cytoplasmatic RNA, nucleoplasm RNA, and chromatin-bound RNA) from cells transfected with an empty plasmid.
Data represented as mean ± SEM, N = 3.
Figure 3 with 1 supplement

Nsp14 expression alters the splicing of a subgroup of genes and increases circRNAs expression.
(A) Table summarizing splicing analysis comparison between Nsp14 expression and control. Thresholds used: ∆PSI (percentage of inclusion) > 15% and a non-overlapping distribution with minimum of 5% difference (N = 3). (B) Fold change vs. expression in logarithmic scale for the genes with upregulated intron retention. In red genes with increased expression and in blue the ones with downregulated expression (fold change = 2, adjusted p-value < 0.05, N = 3). (C) Representative IGV alignment tracks of on gene (PAXIP1) with intronic events differentially changing between conditions (control and Nsp14 expression). The box marks the changing event. On the right, quantification of PSI. (D) Pie chart representing number of alternative splicing events deregulated upon Nsp14 expression by gene; 1772 genes have only one alternative splicing event changing between conditions, 615 has two events and 243 genes have three alternative splicing events changing. (E) Number of circRNAs reads detected in the total RNA sequencing (RNA-seq) experiment. Data represented as mean ± SEM, N = 3, t-test, ***p-value < 0.0005. (F) Fold change vs. expression in logarithmic scale for circRNAs in Nsp14 expression vs. control. In red upregulated genes and in blue downregulated genes (fold change = 2, adjusted p-value < 0.05, N = 3). (G) Plot of fold change vs. expression in logarithmic scale for exonic signal detected in the total RNA-seq dataset in Nsp14 vs. control for genes with upregulated circRNA expression. In red genes with increased expression and (fold change = 2, adjusted p-value < 0.05, N = 3). (H) Plot of fold change vs. expression in logarithmic scale for intronic signal detected in the total RNA-seq dataset in Nsp14 vs. control for genes with upregulated circRNA expression. In red genes with increased expression and in gray non-significant ones (fold change = 2, adjusted p-value < 0.05, N = 3).
Figure 3—figure supplement 1
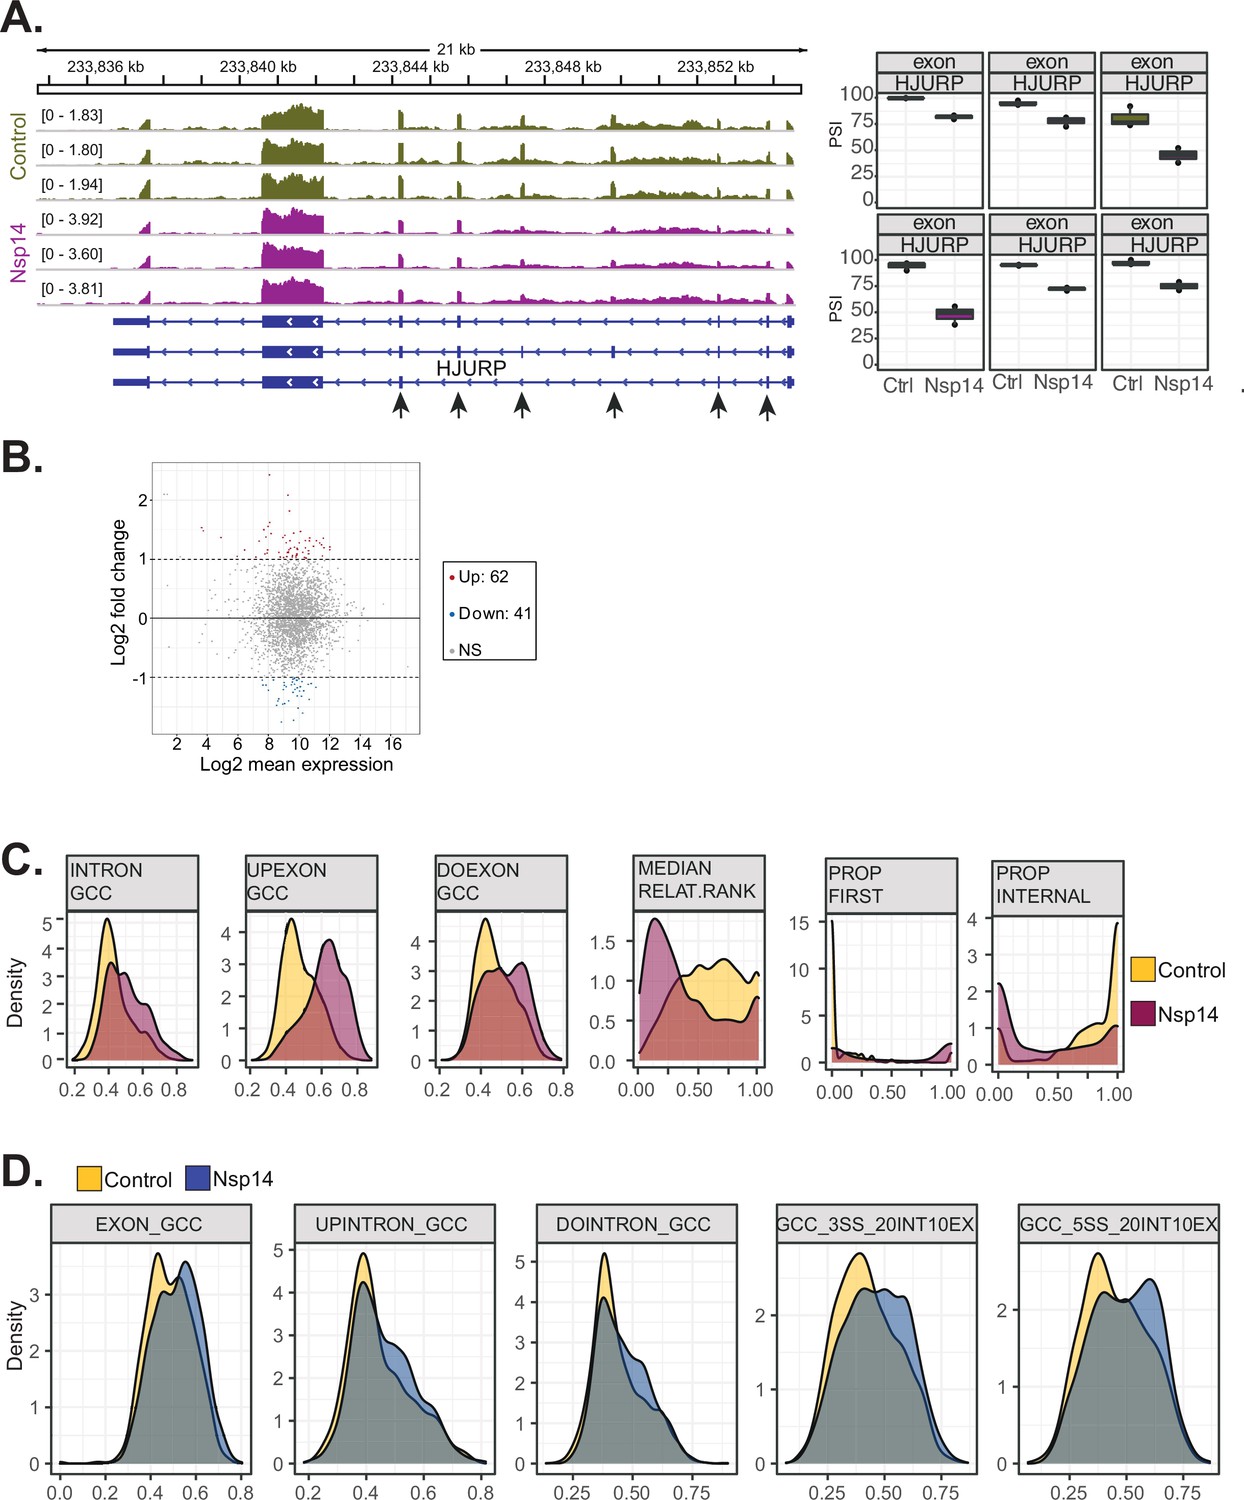
Examples and features of genes showing altered splicing upon Nsp14 expression.
(A) Representative IGV alignment tracks of on gene (HJURP) with multiple exonic events differentially changing between conditions (control and Nsp14expression). The box marks the changing event. On the right, quantification of percentage of inclusion (PSI). (B) Fold change vs. expression in logarithmic scale for the genes with altered splicing. In red genes with increased expression and in blue the ones with downregulated expression (fold change = 2, adjusted p-value < 0.05, N = 3). (C) Kernel density plot for six intronic features that are significantly changing (Mann Whitney U test, adjusted p-value < 0.05, N = 3) in upregulated intron retention upon Nsp14expression. Thresholds used: ∆PSI > 15% and a non-overlapping distribution with minimum of 5% difference (N = 3). (D) Kernel density plot of intron GC content. In gray the distribution for internal introns (never in first position). In blue introns that appear 10% of the times at first position and in red introns that are in first position in more than 10% of the transcripts.
Figure 4 with 2 supplements
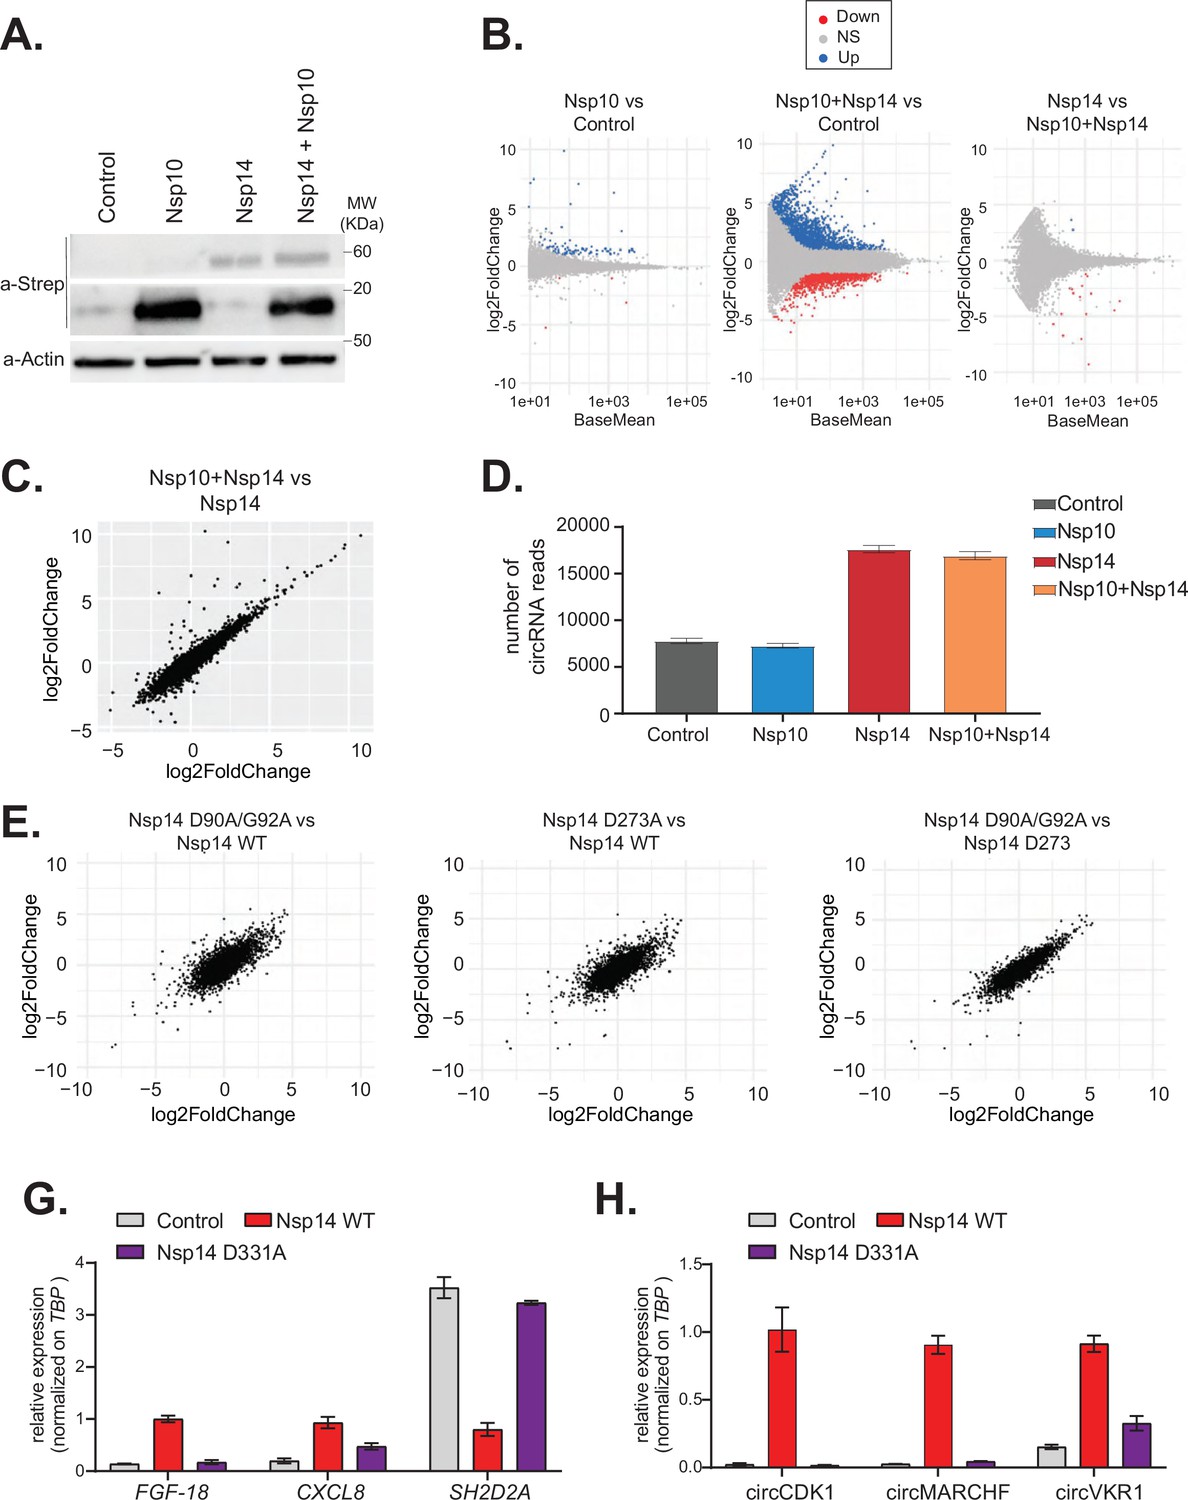
The N7-guanine-methyltransferase domain but not the exonuclease activity of Nsp14 is required for changing gene expression.
(A) Western blot in cells transfected with an empty plasmid (control), Nsp10, Nsp14, or co-expressing Nsp10 and Nsp14 (Nsp10 + Nsp14). Nsp10 and Nsp14 were detected through the Strep tag. Actin was used as loading control. See Figure 4—source data 1. (B) MA plots showing the expression fold change in-between the indicated conditions in the total RNA sequencing (RNA-seq) dataset. Significantly upregulated genes in blue, downregulated in red, and not significantly deregulated in gray. (C) Plot showing the fold change of deregulated genes in samples co-expressing Nsp10 and Nsp14 vs. control (on the y-axis) and Nsp14 vs. control (on the x-axis). (D) Number of circRNAs reads detected in each indicated condition. Data represented as mean ± SEM, N = 3. (E) Plots showing the fold change of deregulated genes in the indicated condition vs. control. (G) RT-qPCR showing the expression of FGF-18, CXCL8, and SH2D2A upon the transfection with an empty plasmid (control), Nsp14 WT, or Nsp14 D331A. Data represented as mean ± SEM, N = 3. (H) RT-qPCR showing the expression of circCDK1, circMARCHF7, and circVKR1 upon the transfection with an empty plasmid (control), Nsp14 WT, or Nsp14 D331A. Data represented as mean ± SEM, N = 3.
-
Figure 4—source data 1
Western blot data for Figure 4A.
- https://cdn.elifesciences.org/articles/71945/elife-71945-fig4-data1-v2.zip
Figure 4—figure supplement 1
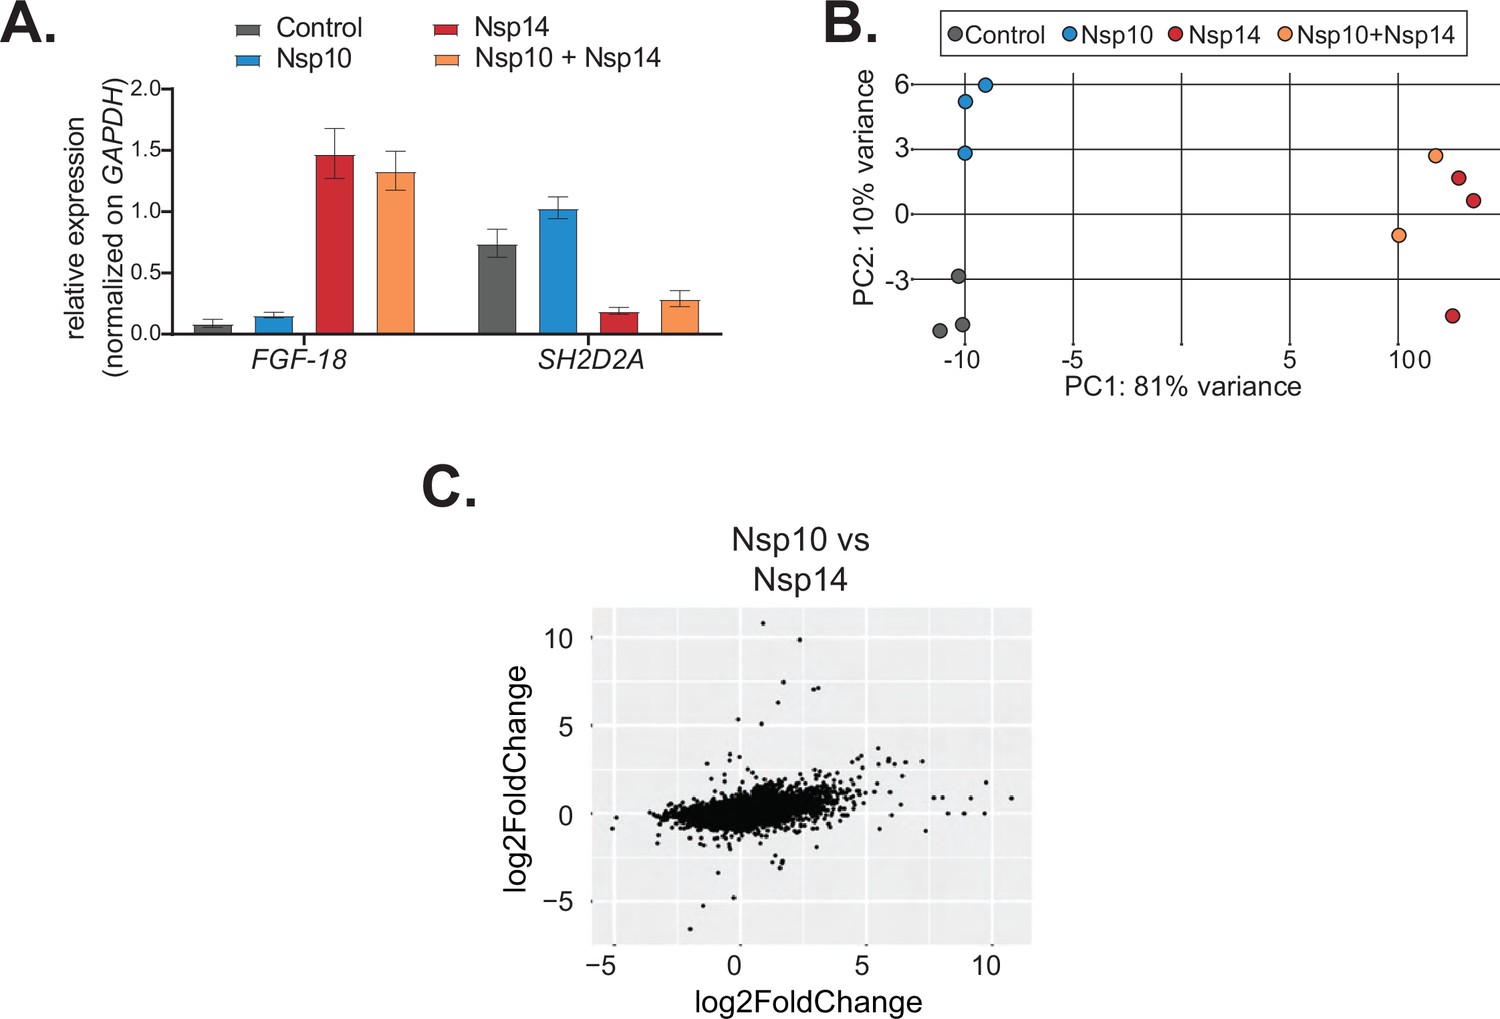
Co-expression of Nsp10 does not change the effects induced by Nsp14.
(A) RT-qPCR showing the expression of FGF-18 and SH2D2A in the indicated conditions. Data represented as mean ± SEM, N = 3. (B) Principal component analysis (PCA) for the 3’ RNA sequencing (RNA-seq) of the indicated samples. (C) Plot showing the fold change of deregulated genes in samples expressing Nsp10 vs. control (on the y-axis) and Nsp14 vs. control (on the x-axis).
Figure 4—figure supplement 2
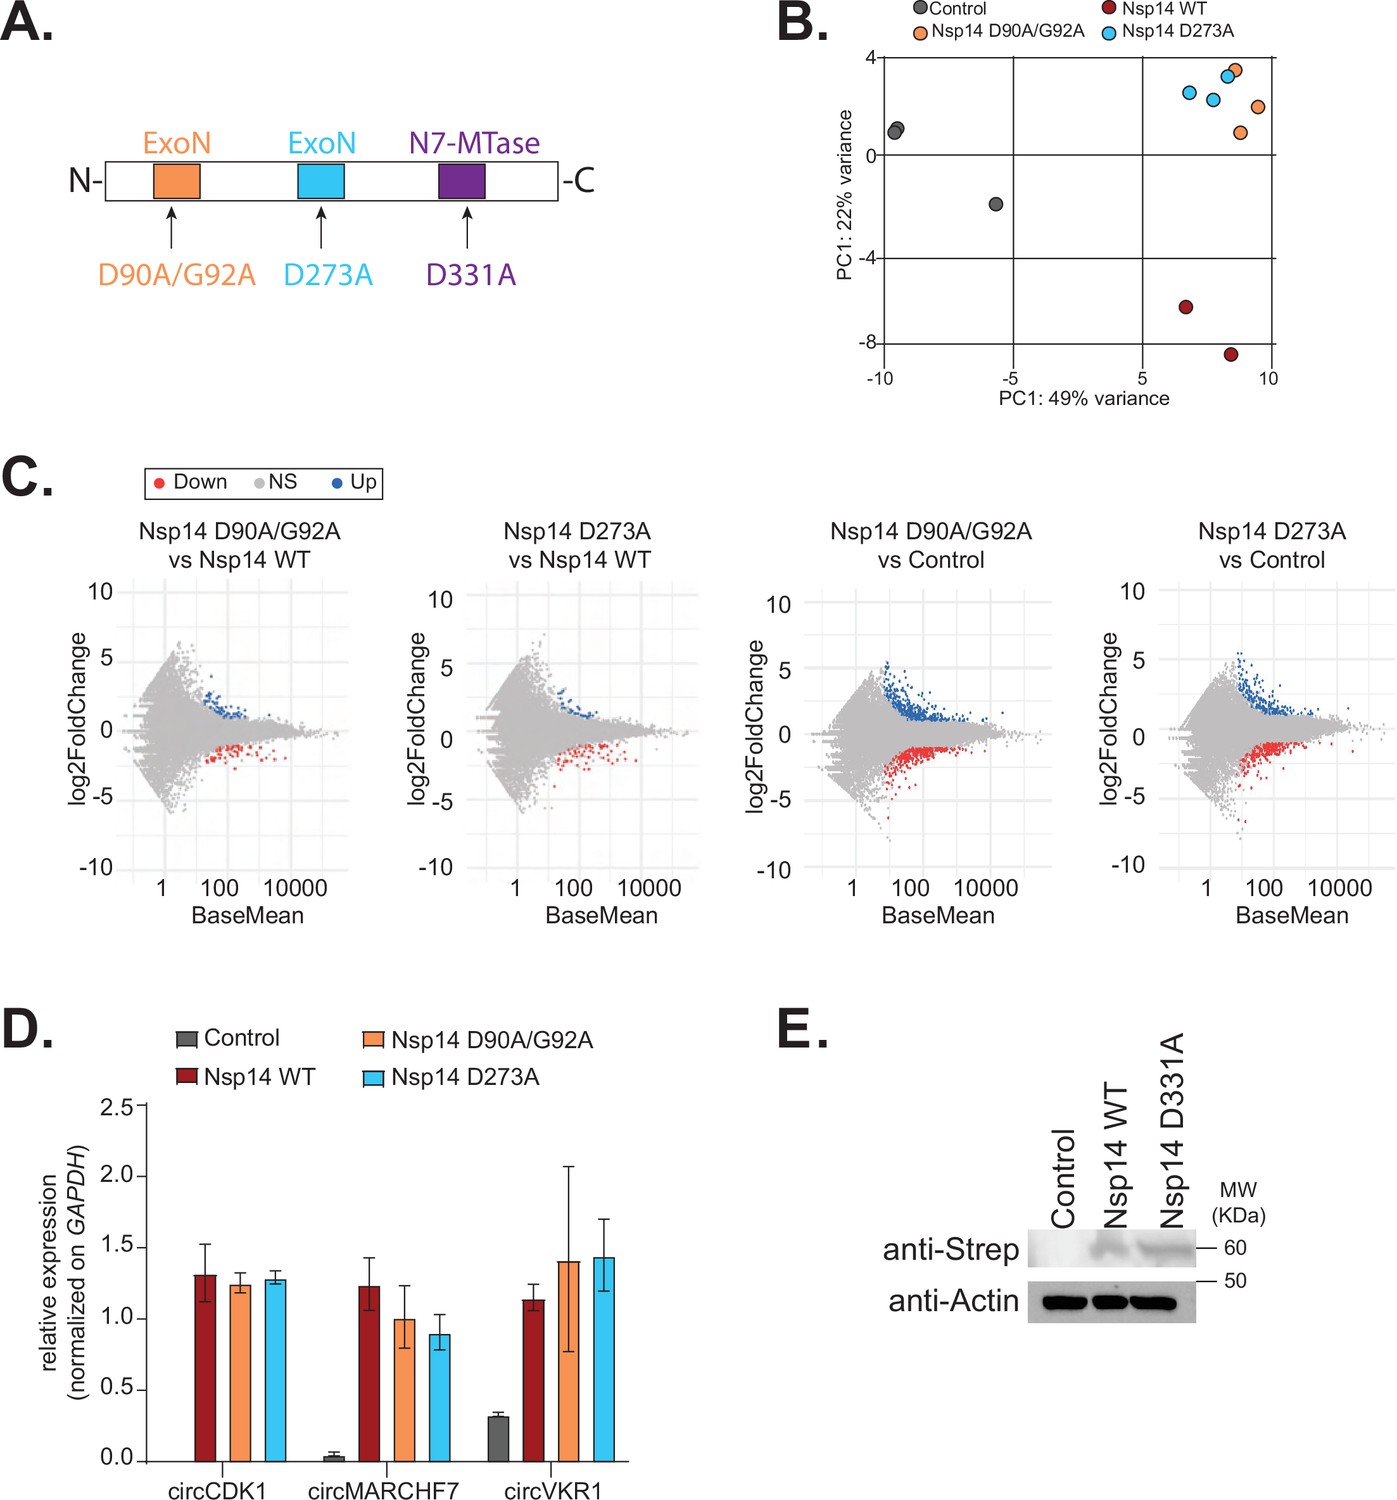
The N7-guanine-methyltransferase activity but not the exonuclease one of Nsp14 is required for changing gene expression.
(A) Scheme of the Nsp14 mutants generated in this study. (B) Principal component analysis (PCA) for the 3’ RNA sequencing (RNA-seq) of the indicated samples. (C) MA plots showing the expression fold change in-between the indicated conditions in 3’ RNA-seq. Significantly upregulated genes in blue, downregulated in red, and not significantly deregulated in gray. (D) RT-qPCR showing the expression of circCDK1, circMARCHF7, and circVKR1 in the indicated conditions. Data represented as mean ± SEM, N = 3. (E) Western blot showing the expression of Nsp14 WT and Nsp14 D331A, detected through the Strep tag. Actin was used as loading control. See Figure 4—figure supplement 2—source data 1.
-
Figure 4—figure supplement 2—source data 1
Western blot data for Figure 4—figure supplement 2E.
- https://cdn.elifesciences.org/articles/71945/elife-71945-fig4-figsupp2-data1-v2.zip
Figure 5 with 1 supplement
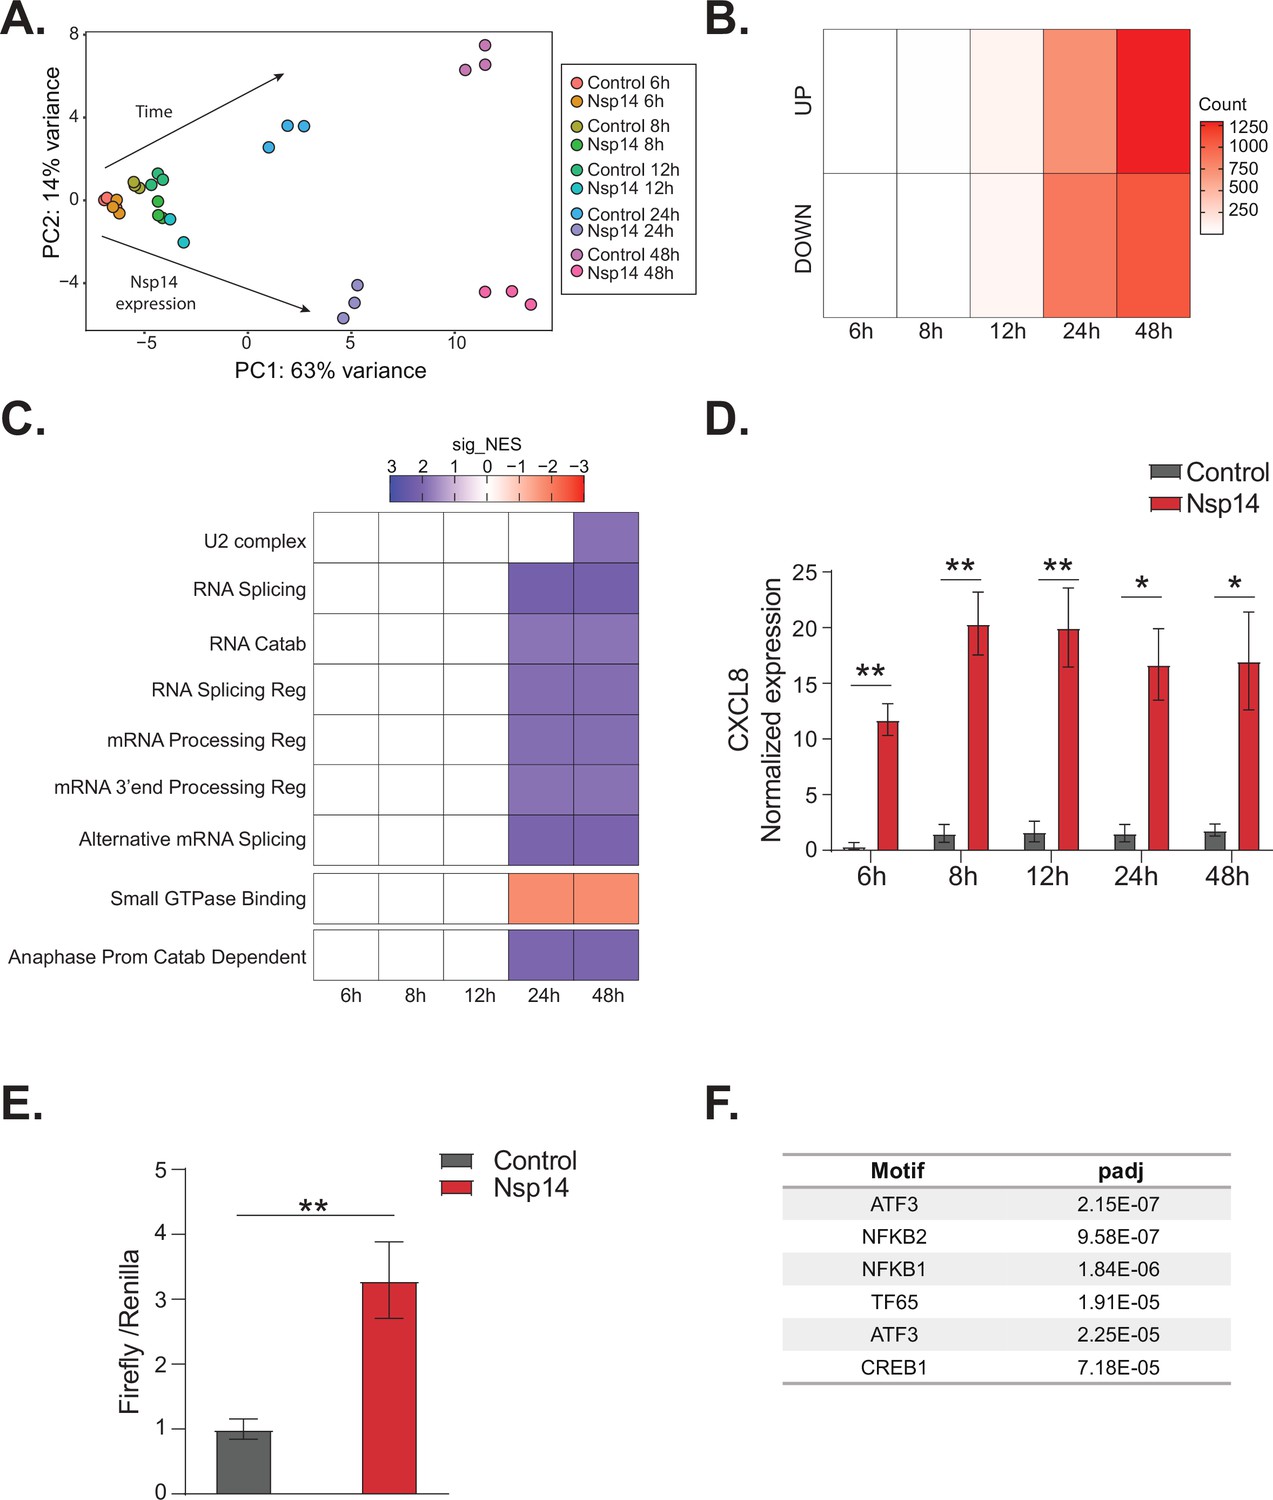
NFkB pathway is activated soon after Nsp14 transfection.
(A) Principal component analysis of the 3’ RNA sequencing (RNA-seq) of the time course experiment. Arrows indicate how samples separate according to the time point or condition (Nsp14 expression or control). (B) Heatmap showing increasing number of up- and downregulated genes at different time points after Nsp14 expression. (C) Heatmap representing the Gene Ontology analysis result at the indicated time points. (D) Expression of CXCL8 across the indicated time points in the 3’ RNA-seq data. Data represented as mean ± SEM, N = 3, t-test, **p-value < 0.005, *p-value < 0.05. (E) Luciferase assay showing that CXCL8 is transcriptionally activated after Nsp14 expression. Firefly expression is controlled by CXCL8 promoter, whereas Renilla is under the control of a constitutive promoter. Data represented as mean ± SEM, N = 6, t-test, **p-value < 0.005. (F) Table showing the enrichment for specific transcription factor (TF) binding sites in the promoter (100 bp upstream the transcription starting site of the upregulated genes) (lfc >0.8, adjusted p-value < 0.05) at 8 hr after Nsp14 transfection.
Figure 5—figure supplement 1
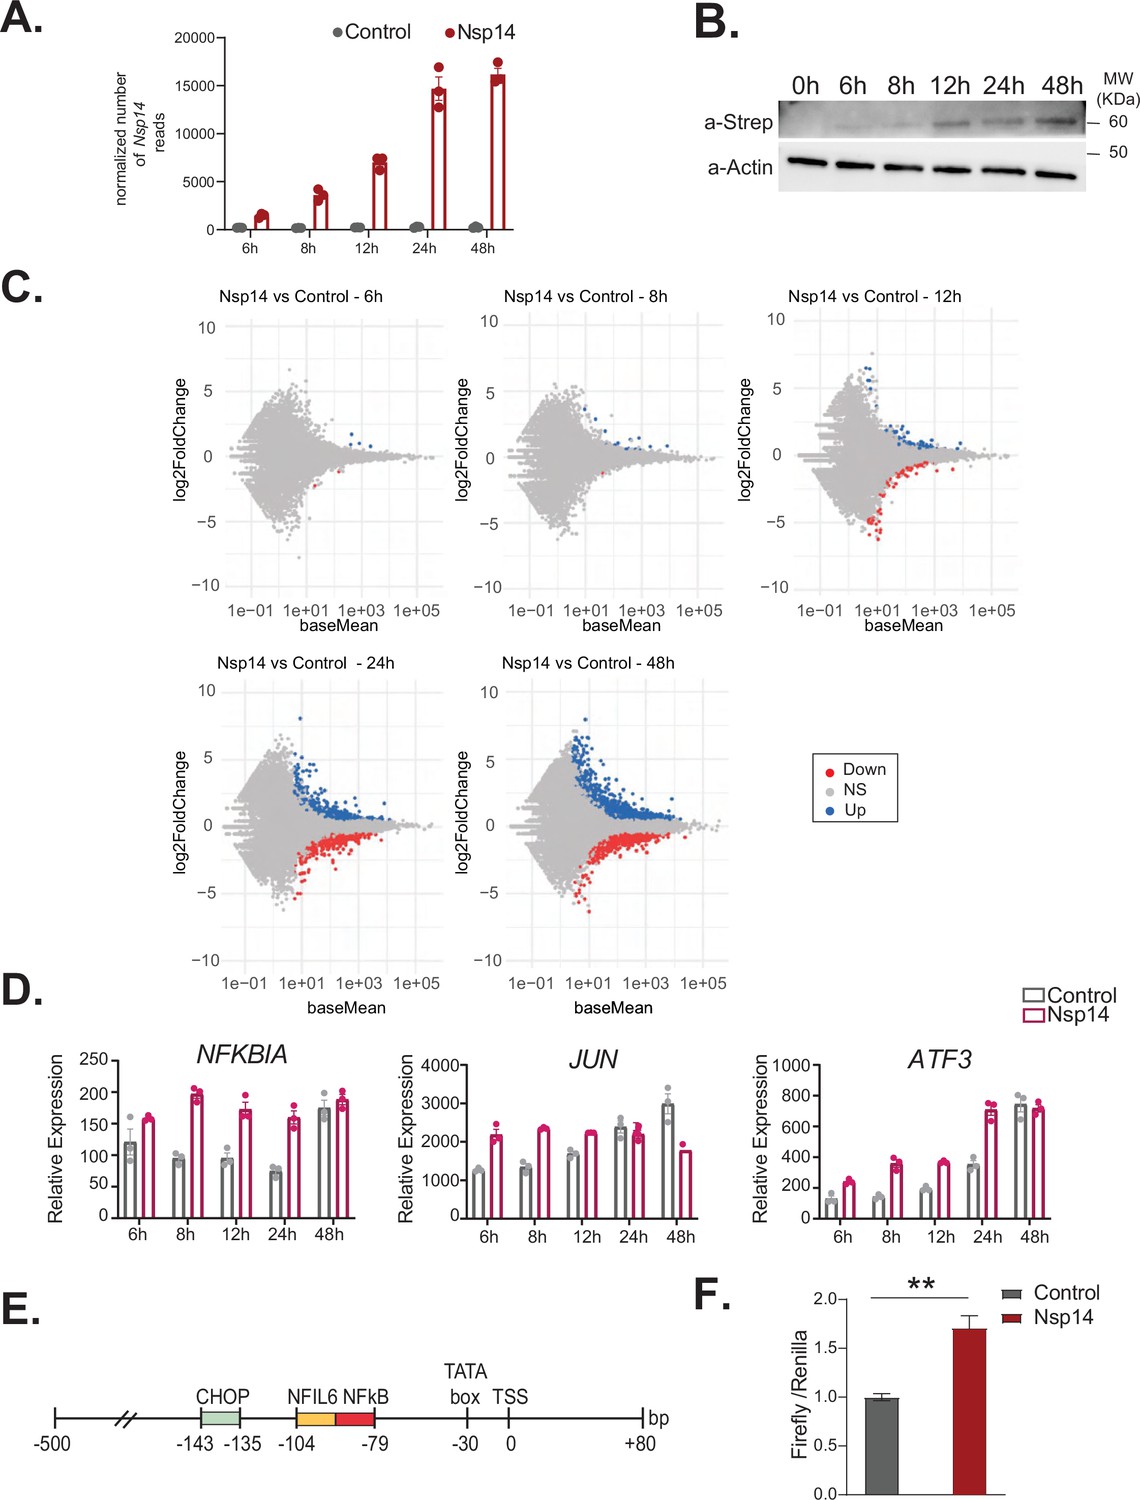
NFkB pathway is one of the first pathways activated after Nsp14 transfection.
(A) Plot showing the normalized number of Nsp14 reads from the 3’ RNA sequencing (RNA-seq) experiment, at the indicated time points, in cells transfect with a control plasmid (control), or the Nsp14 plasmid (Nsp14). (B) Western blot showing increasing amount of Nsp14 at the indicated time points in cells transfected with the Nsp14 plasmid. Nsp14 was detected through the Strep tag. Actin was used as loading control. See Figure 5—figure supplement 1—source data 1. (C) MA plots showing the expression fold change in-between the indicated conditions in 3’ RNA-seq. Significantly upregulated genes in blue, downregulated in red, and not significantly deregulated in gray. (D) Expression of selected genes across the indicated time points from the 3’ RNA-seq dataset. Data represented as mean ± SEM, N = 3. (E) Scheme of the CXCL8 promoter region used for the Firefly reporter. (F) Luciferase assay showing NFkB activation. Firefly expression is controlled by a minimal transcriptional activator recognized by NFkB, whereas Renilla is under the control of a ubiquitous promoter. Data represented as mean ± SEM, N = 6, t-test, **p-value < 0.005.
-
Figure 5—figure supplement 1—source data 1
Western blot data for Figure 5—figure supplement 1B.
- https://cdn.elifesciences.org/articles/71945/elife-71945-fig5-figsupp1-data1-v2.zip
Figure 6 with 2 supplements
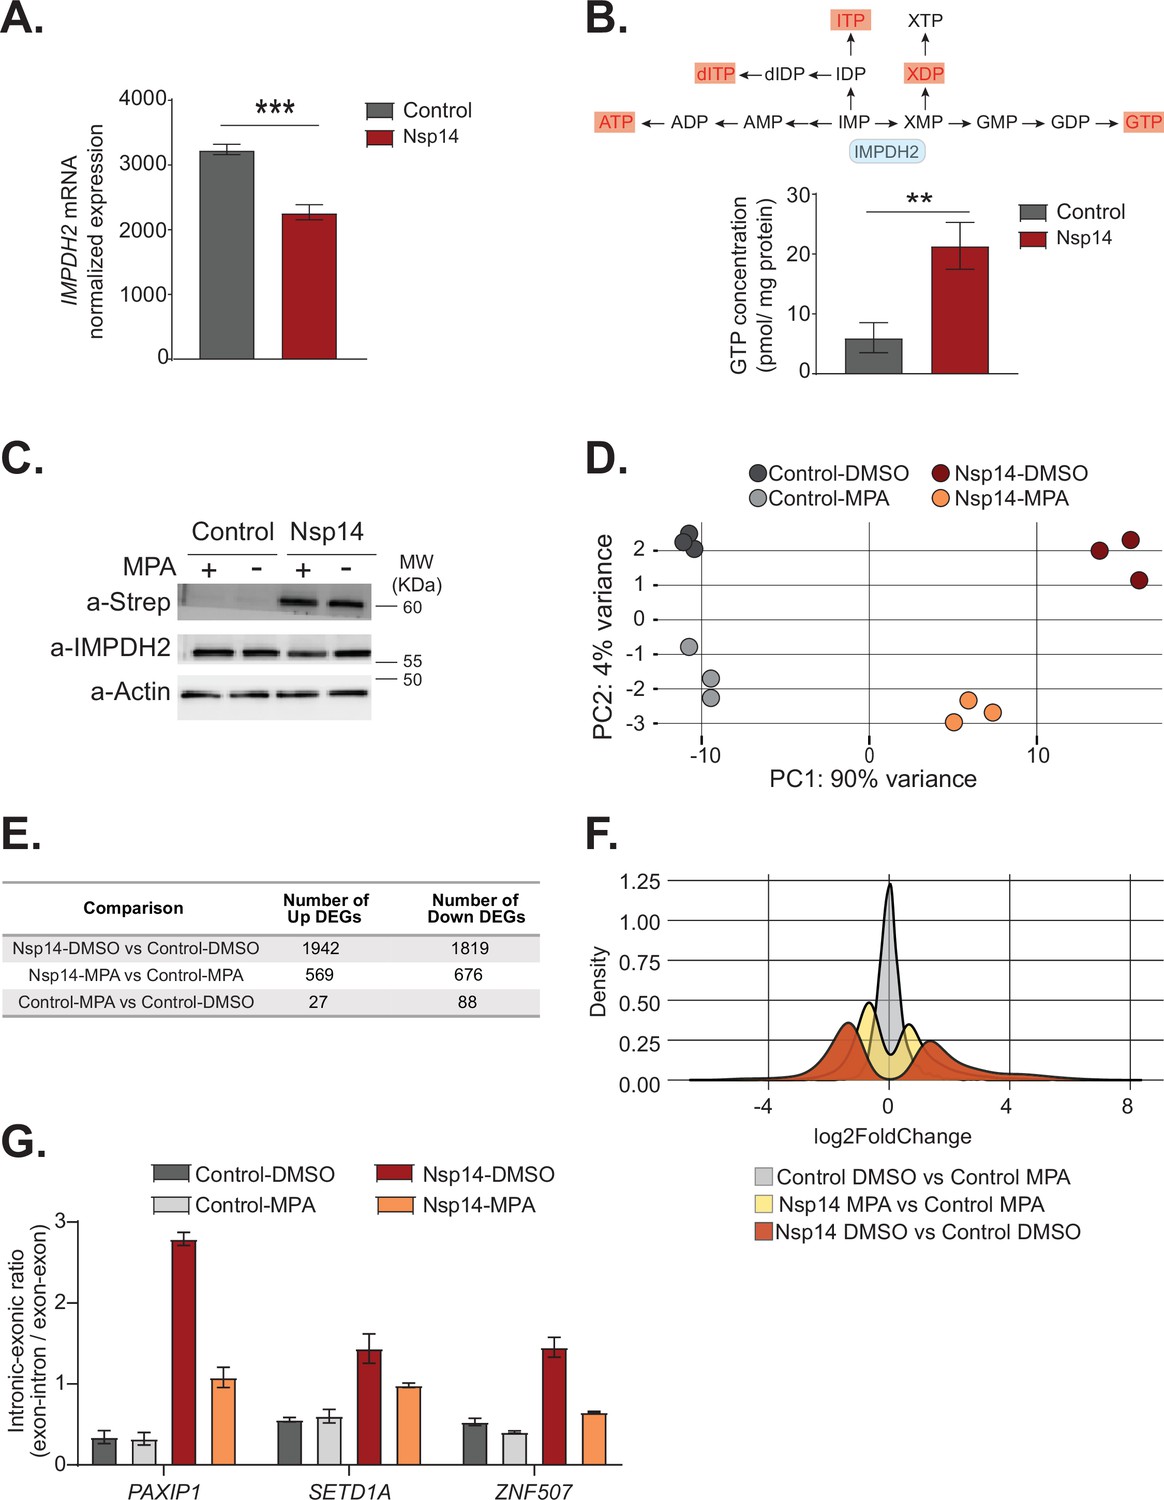
Pharmacological inhibition of inosine-monophosphate dehydrogenase 2 (IMPDH2) partially reverts the transcriptional changes induced by Nsp14.
(A) Expression of IMPDH2 mRNA is reduced upon Nsp14 expression. Data from the total RNA sequencing (RNA-seq) experiment. Data represented as mean ± SEM, N = 3, t-test, ***p-value < 0.0005. (B) In the upper panel, scheme reporting some of the tested metabolites deriving from inosine-5'-monophosphate (IMP) metabolism. IMPDH2 (highlighted in light blue) catalyzes the conversion of IMP to xanthine-5’-monophosphate (XMP), precursor of guanosine-5'-triphosphate (GTP). Significantly upregulated metabolites are highlighted in red. In the lower panel, GTP cellular concentration significantly increases in Nsp14-expressing cells. Data represented as mean ± SEM, N = 3, t-test, **p-value < 0.005. (C) Western blot showing that mycophenolic acid (MPA) treatment does not alter Nsp14 (detected through the Strep-tag) or IMPDH2 expression. Actin used as loading control. See Figure 6—source data 1. (D) Principal component analysis of the 3’ RNA-seq library of the indicated samples. (E) Table reporting the number of upregulated and downregulated genes in the indicated comparisons. (F) Plot showing the distribution of fold changes of all genes detected in the 3’ RNA-seq in the indicated conditions. (G) RT-qPCR showing the retention of the first intron for PAXIP1, SETD1A, and ZNF507 in the indicated conditions. Data represented as mean ± SEM, N = 3.
-
Figure 6—source data 1
Western blot data for Figure 6C.
- https://cdn.elifesciences.org/articles/71945/elife-71945-fig6-data1-v2.zip
Figure 6—figure supplement 1
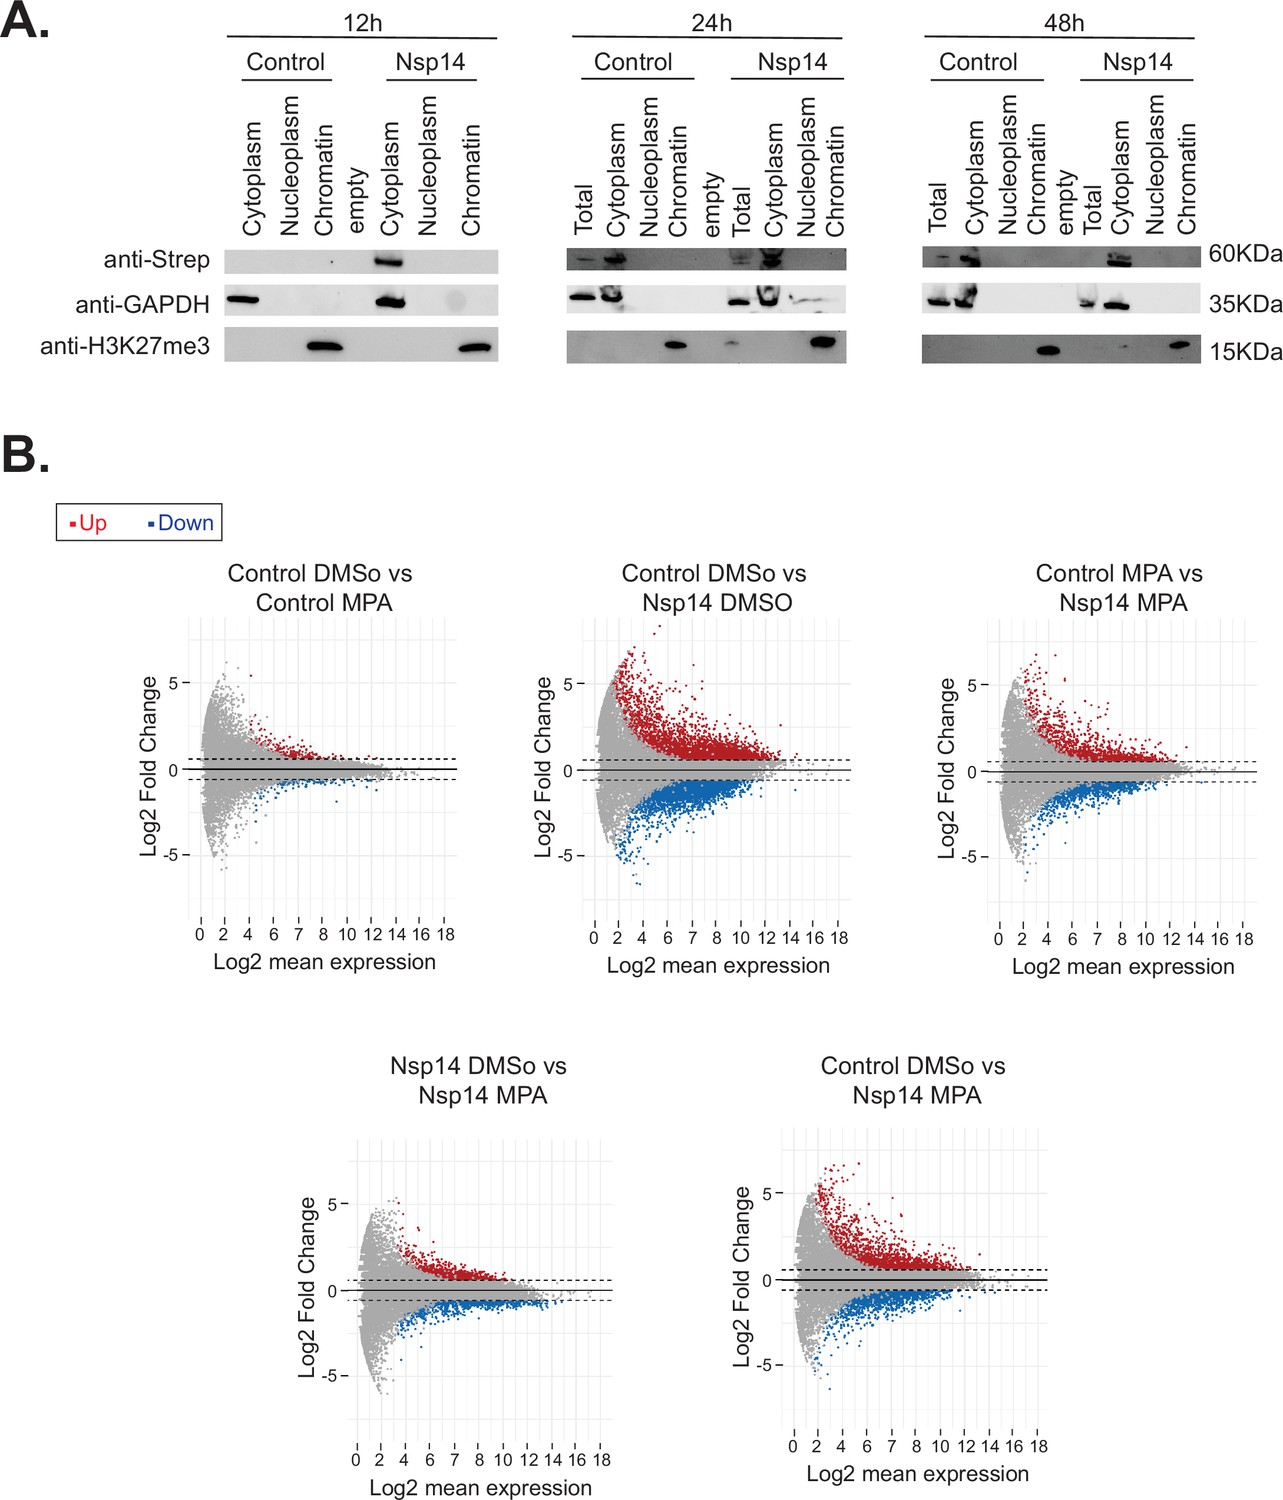
Nsp14 localizes in the cytoplasm and IMPDH2 mediates the effects induced by Nsp14.
(A) Western blots of the subcellular fractionation and chromatin precipitation at the indicated time points post transfection (12, 24, and 48 hr) in cells transfected with an empty plasmid (control), or Nsp14 (Nsp14). Nsp14 was detected through the Strep tag. GAPDH is used as cytoplasmatic marker, and H3K27me3 as a chromatin-bound marker. See Figure 6—figure supplement 1—source data 1. (B) MA plots relative to the 3’ RNA sequencing (RNA-seq) experiment of cells transfected with a control plasmid (control) or Nsp14 (Nsp14) and treated with the vehicle (DMSO) or mycophenolic acid (MPA) (MPA). Significantly upregulated genes in blue, downregulated in red, and not significantly deregulated in gray.
-
Figure 6—figure supplement 1—source data 1
Western blot data for Figure 6—figure supplement 1A.
- https://cdn.elifesciences.org/articles/71945/elife-71945-fig6-figsupp1-data1-v2.zip
Figure 6—figure supplement 2
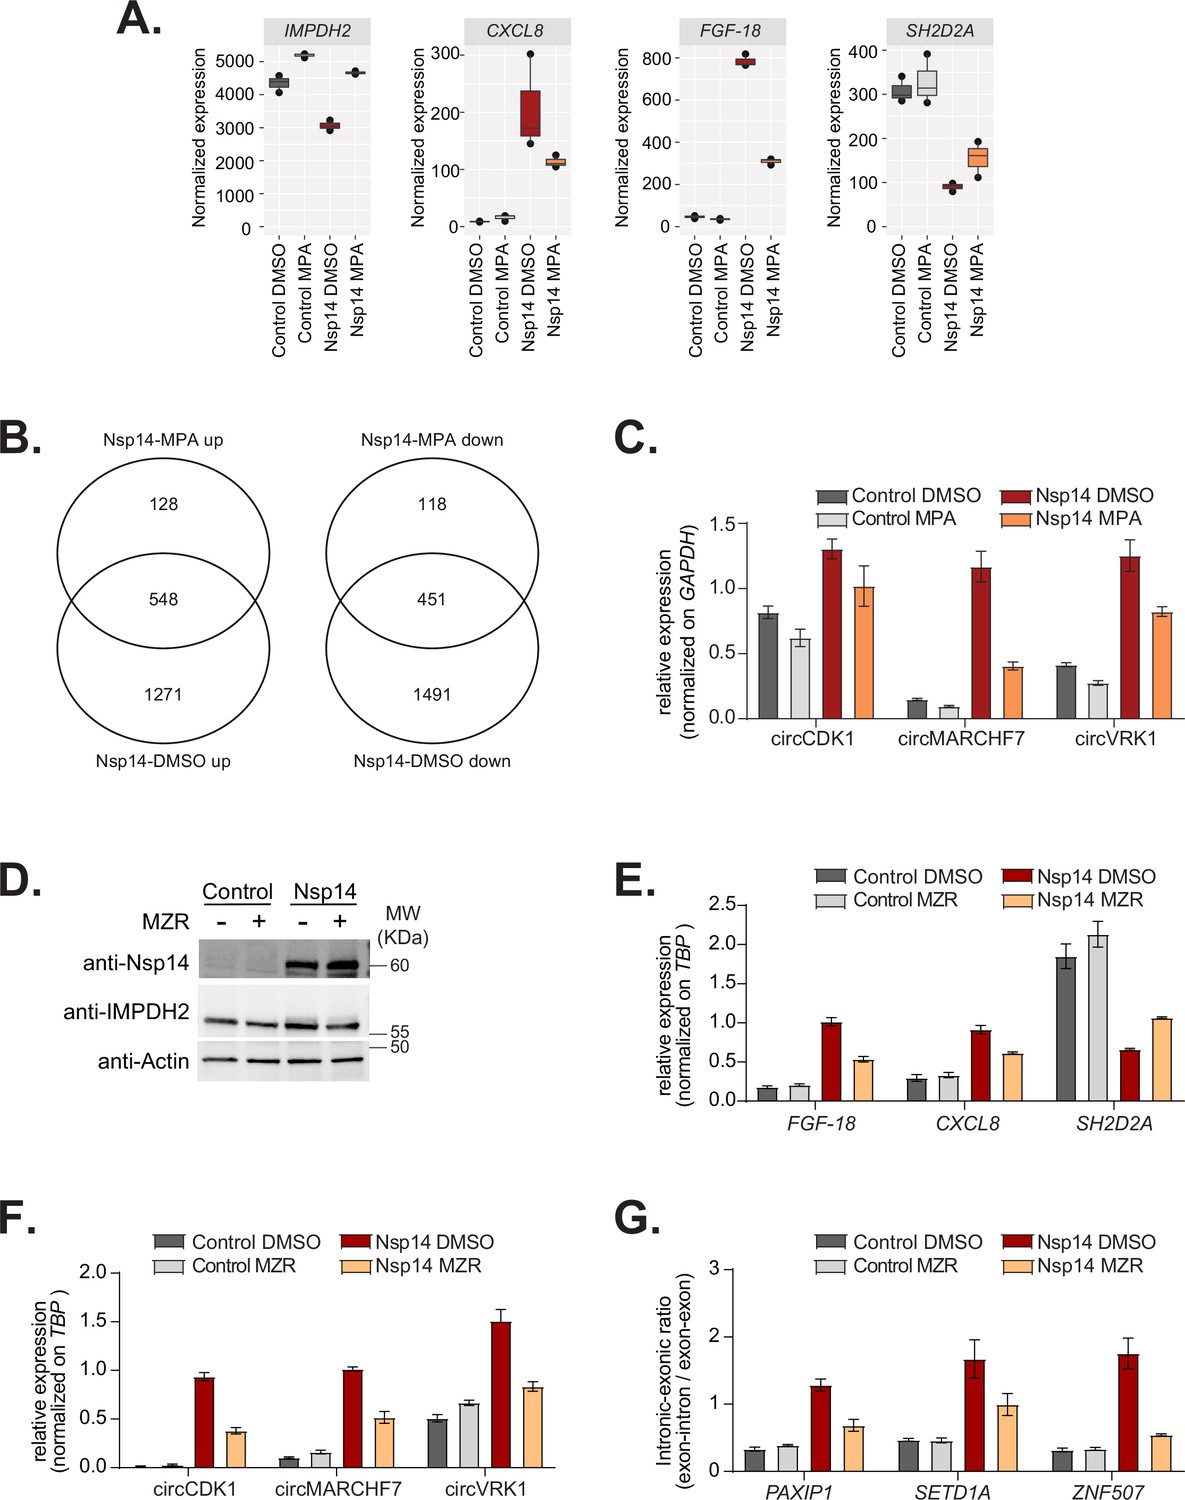
Inhibition of IMPDH2 partially reverts the changes induced by Nsp14.
(A) Expression of inosine-monophosphate dehydrogenase 2 (IMPDH2), FGF-18, SH2D2A, and CXCL8 in the 3’ RNA sequencing (RNA-seq) dataset in the indicated conditions. (B) Venn diagram showing the common genes upregulated (left) or downregulated (right) in samples expressing Nsp14 and treated with or without mycophenolic acid (MPA). (C) RT-qPCR showing the expression of circCDK1, circMARCHF7, and circVKR1 in the indicated conditions. Data represented as mean ± SEM, N = 3. (D) Western blot showing that mizoribine (MZR) treatment does not alter Nsp14 or IMPDH2 expression. Actin used as loading control. See Figure 6—figure supplement 2—source data 1. (E) RT-qPCR showing the expression of FGF-18, CXCL8, and SH2D2A, in the indicated conditions. Data represented as mean ± SEM, N = 3. (F) RT-qPCR showing the expression of circCDK1, circMARCHF7, and circVKR1 in the indicated conditions. Data represented as mean ± SEM, N = 3. (G) RT-qPCR showing the retention of the first intron for PAXIP1, SETD1A, and ZNF507 in the indicated conditions. Data represented as mean ± SEM, N = 3.
-
Figure 6—figure supplement 2—source data 1
Western blot data for Figure 6—figure supplement 2D.
- https://cdn.elifesciences.org/articles/71945/elife-71945-fig6-figsupp2-data1-v2.zip
Author response image 1
Tables
Key resources table
| Reagent type (species) or resource | Designation | Source or reference | Identifiers | Additional information |
|---|---|---|---|---|
| Gene(SARS-CoV-2) | Nsp14 | wuhCor1/SARS-CoV-2 | NC_045512 v2:18040–19620 | UCSC Genome Browser on SARS-CoV-2 Jan. 2020/NC_045512.2 Assembly (wuhCor1) |
| Gene(Homo sapiens) | IMPDH2 | UCSC Genome Browser on Human Feb. 2009 (GRCh37/hg19) Assembly | NM_000884 | |
| Strain, strain background (Escherichia coli) | DH5alpha | Rosbash Lab | Electrocompetent cells used for transformation of cloned plasmids | |
| Cell line(Homo sapiens) | HEK293T | This paper | Cell line obtained from Marr Lab Brandeis University. STR authenticated by ATCC, and mycoplasma tested. | |
| Transfected construct (SARS-CoV-2) | pLXV-EF1alpha-2XStrep-SARS-CoV2-nsp14-IRES-Puro | Addgene | Plasmid #141380 | Human codon optimized |
| Transfected construct (SARS-CoV-2) | pLXV-EF1alpha-2XStrep-SARS-CoV2-nsp10-IRES-Puro | Addgene | Plasmid #141376 | Human codon optimized |
| Transfected construct (jellyfish) | pLXV-EF1alpha-2XStrep-eGFP-IRES-Puro | Addgene | Plasmid #141395 | Human codon optimized |
| Transfected construct (SARS-CoV-2) | pLXV-EF1alpha-2XStrep-SARS-CoV2-nsp14-D331A-IRES-Puro | This paper | Human codon optimized, N7-guanine-methyltransferase mutant | |
| Transfected construct (SARS-CoV-2) | pLXV-EF1alpha-2XStrep-SARS-CoV2-nsp14-D273A-IRES-Puro | This paper | Human codon optimized, ExoN mutant | |
| Transfected construct (SARS-CoV-2) | pLXV-EF1alpha-2XStrep-SARS-CoV2-nsp14-D90A/G92A-IRES-Puro | This paper | Human codon optimized, ExoN mutant | |
| Antibody | Anti-Strep (Mouse monoclonal) | Quiagen | Cat#: 34850 | WB (1:1000) |
| Antibody | Anti-IMPDH2 (Rabbit polyclonal) | Proteintec | Cat#: 12948-1-AP | WB (1:1000) |
| Antibody | Anti-Actin (Mouse monoclonal) | Cell Signaling | Cat#: 3700 | WB (1:1000) |
| Antibody | Anti-Nsp14(Rabbit monoclonal) | Cell Signaling | Cat#: 99098 | WB (1:1000) |
| Antibody | Anti-Tubulin(Mouse monoclonal) | Sigma-Aldrich | Cat#: T5168 | WB (1:1000) |
| Antibody | Anti-Laminin B1(Rabbit monoclonal) | Abcam | Cat#: ab133741 | WB (1:1000) |
| Antibody | Anti-GAPDH(Rabbit monoclonal) | Cell Signaling | Cat#: 2118 | WB (1:1000) |
| Antibody | Anti-Tri-Methyl-Histone H3 (Lys27)(Rabbit monoclonal) | Cell Signaling | Cat#: 9733 | WB (1:1000) |
| Antibody | Anti-mouse IgG- HRP conjugated (Rabbit monoclonal) | Millipore | Cat#: ap160p | WB (1:10,000) |
| Antibody | Anti-rabbit IgG HRP conjugated (Mouse monoclonal) | Millipore | Cat#: AP188P | WB (1:10,000) |
| Chemical compound, drug | Mizoribine IMPDH inhibitor | Selleckchem | Cat#: 50924-49-7 | Used at 10 µM, dissolved in DMSO |
| Chemical compound, drug | Mycophenolic acid(MPA)IMPDH inhibitor | Sigma-Aldrich | Cat#: M5255 | Used at 0.5 µM, dissolved in DMSO |
| Software, algorithm | GraphPad Prism software | GraphPad Prism (https://graphpad.com) | RRID:SCR_002798 | |
| Software, algorithm | R Project for Statistical Computing | R Project for Statistical Computing (https://www.r-project.org/) | RRID:SCR_001905 |
Additional files
-
Supplementary file 1
Supplementary file 1a: List of differentially expressed genes (DEGs) in the screening described in Figure 1.
3' RNA-seq. Supplementary file 1b: List of Gene Ontology (GO) terms described in Figure 1. 3' RNA-seq. Supplementary file 1c: Gene set enrichment analysis (GSEA) described in Figure 2. Total RNA-seq. Supplementary file 1d: Differential gene expression results described in Figure 2. Supplementary file 1e: Alternative splicing analysis results described in Figure 3. Supplementary file 1f: Feature analysis with MATT for upregulated intron retentions and downregulated exon inclusion events described in Figure 3—figure supplement 1. Supplementary file 1g: Alternative splicing analysis on a published total RNA-seq dataset of HEK293T-hACE2 cells infected with severe acute respiratory syndrome coronavirus 2 (SARS-CoV-2) (Sun et al., 2021). Supplementary file 1h: Deregulated circRNAs described in Figure 3.
- https://cdn.elifesciences.org/articles/71945/elife-71945-supp1-v2.xlsx
-
Supplementary file 2
Supplementary file 2a: Differentially expressed gene (DEG) at different time points described in Figure 5.
3' RNA-seq. Supplementary file 2b: Gene Ontology (GO) described in Figure 5. 3' RNA-seq. Supplementary file 2c: AME analysis with 100 bp of promoter described in Figure 5. Supplementary file 2d: FIMO analysis with 100 bp promoter described in Figure 5. Supplementary file 2e: AME analysis with 1000 bp promoter described in Figure 5.
- https://cdn.elifesciences.org/articles/71945/elife-71945-supp2-v2.xlsx
-
Supplementary file 3
Supplementary file 3a: Concentrations of cellular metabolites detected by HPLC/MS.
Supplementary file 3b: List of plasmids used for severe acute respiratory syndrome coronavirus 2 (SARS-CoV-2) protein expression in the initial screening described in Figure 1. Supplementary file 3c: List of primers used for the RT-qPCR assays.
- https://cdn.elifesciences.org/articles/71945/elife-71945-supp3-v2.xlsx
-
Transparent reporting form
- https://cdn.elifesciences.org/articles/71945/elife-71945-transrepform1-v2.docx
Download links
A two-part list of links to download the article, or parts of the article, in various formats.
Downloads (link to download the article as PDF)
Open citations (links to open the citations from this article in various online reference manager services)
Cite this article (links to download the citations from this article in formats compatible with various reference manager tools)
SARS-CoV-2 Nsp14 mediates the effects of viral infection on the host cell transcriptome
eLife 11:e71945.
https://doi.org/10.7554/eLife.71945


