Aspirin’s effect on kinetic parameters of cells contributes to its role in reducing incidence of advanced colorectal adenomas, shown by a multiscale computational study
- Department of Mathematics, University of California Irvine, United States
- Department of Medicine, University of California San Diego School of Medicine, United States
- Department of Molecular Diagnostics and Experimental Therapeutics, Beckman Research Institute of City of Hope Comprehensive Cancer Center, United States
- Department of Population Health and Disease Prevention, University of California Irvine, United States
Figures
Figure 1
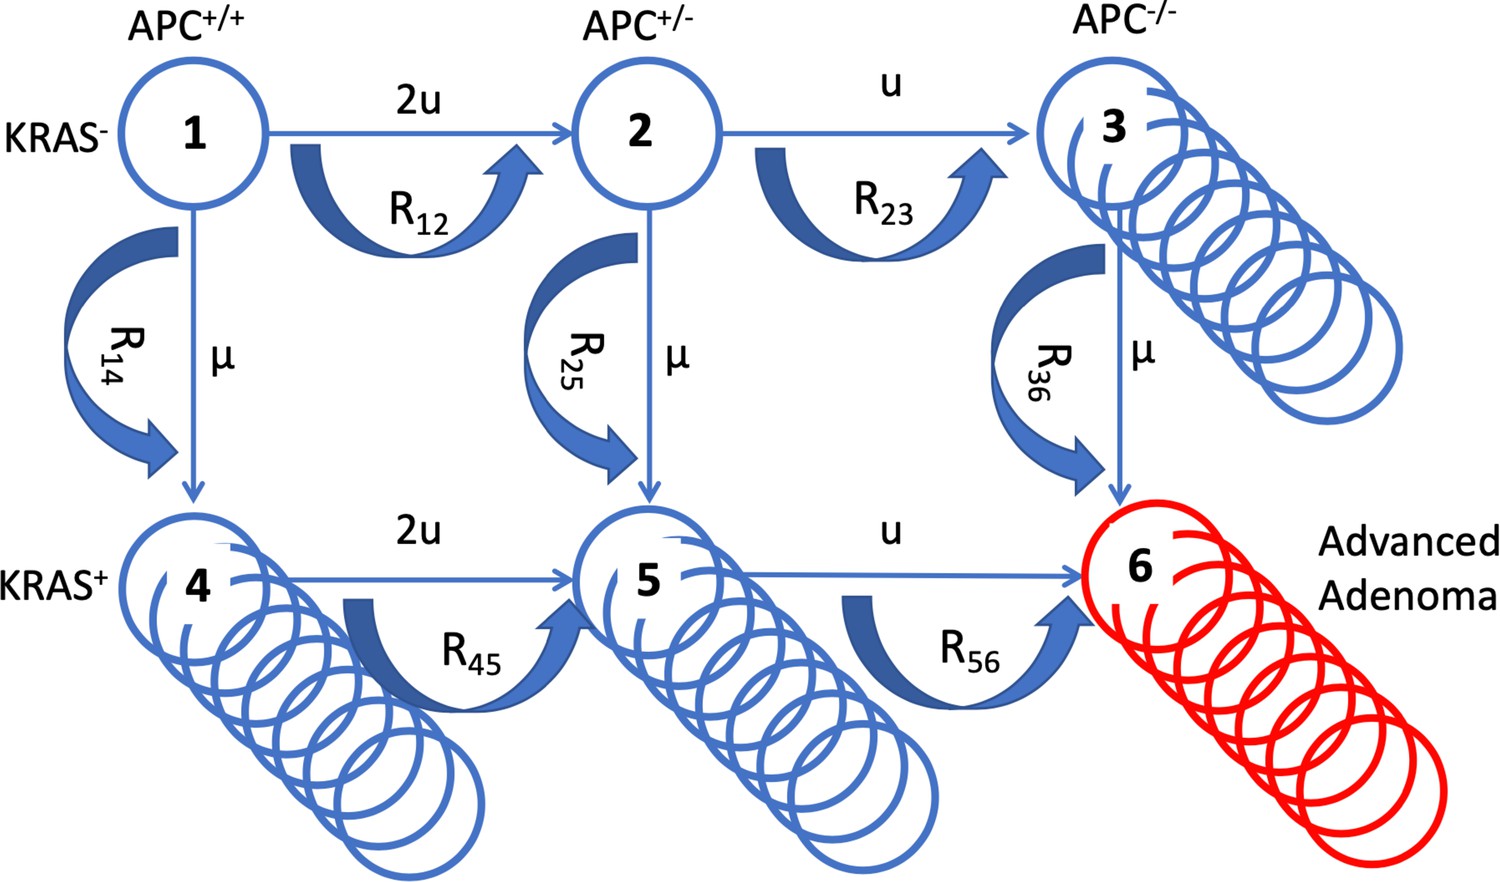
A schematic illustrating the mathematical model.
The six cell types are denoted by circles, the mutation rates that give rise to different types are marked by the straight arrows. Type 6 (late adenoma) is marked in red. Crypt conversion rates are indicated by circular arrows and crypt fission by multiple circles.
Figure 2
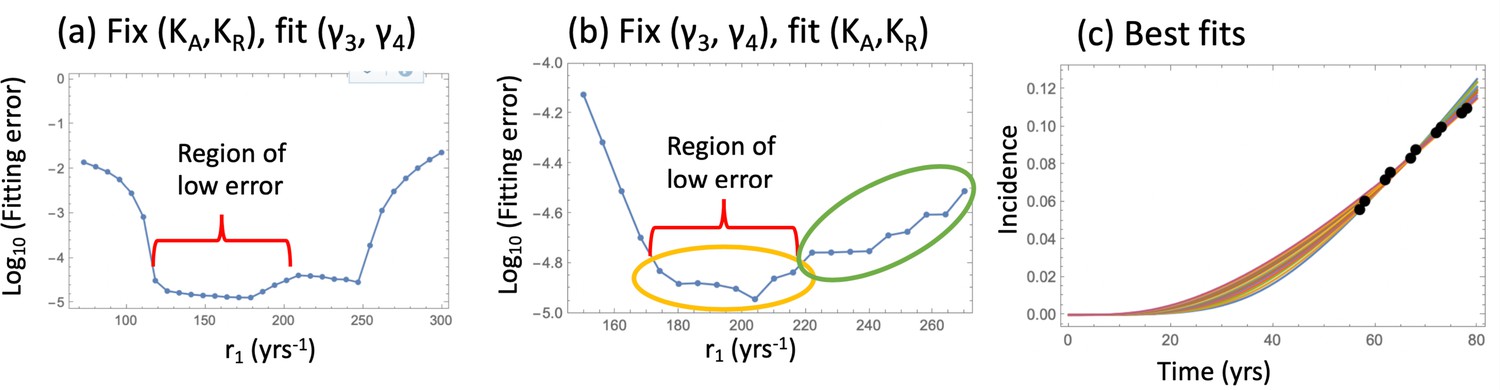
Fitting the nonlinear model to late adenoma incidence data.
(a) The fitting error as a function of r1, for the best fitting pairs (γ3 and γ4) with KA = KR = 1000; see Figure 2—source data 1. (b) The fitting error as a function of r1, for the best fitting values of (KA,KR). Two groups of fits are marked with yellow and green ovals for the analysis of pathways, Figure 3. See Figure 2—source data 2. (c) The best fitting curves corresponding to increasing SC division rates, r1, are plotted together with the epidemiological data (the values of r1 are taken from the Region of low error, panel (b)). In all panels, δ=δ6=0.05 yrs–1, γ6 = 1.01 yrs–1, expansion of n6 to N = 102 crypts, and the rest of the parameters are as in Appendix 1—table 2. The code for panels (a–c) is provided, see Source code 1.
-
Figure 2—source data 1
Data for Figure 2a.
- https://cdn.elifesciences.org/articles/71953/elife-71953-fig2-data1-v1.txt
-
Figure 2—source data 2
Data for Figure 2b.
- https://cdn.elifesciences.org/articles/71953/elife-71953-fig2-data2-v1.txt
Figure 3

Pathways to adenoma.
(a) A schematic representation of the two pathways. (b) For the two groups of fits in Figure 2(b), the pairs (KA,KR) are shown. The two groups are characterized by KA >KR and KA <KR, respectively. See Figure 3—source data 1. (c) The probabilities PAPC and PKRAS are plotted as functions of time for these two groups of fits. (d) The proportion of the APC-path is shown as a function of the crypt fission rates, γ3 and γ4=γ5. Expansion to 102 type-6 crypts is assumed (see Appendix 1—figure 10 for expansion to105 type-6 crypts); the rest of the parameters are as in Appendix 1—table 2. The code for panels (b–c) is provided, see Source code 1.
-
Figure 3—source data 1
Date for Figure 3b.
- https://cdn.elifesciences.org/articles/71953/elife-71953-fig3-data1-v1.txt
Figure 4
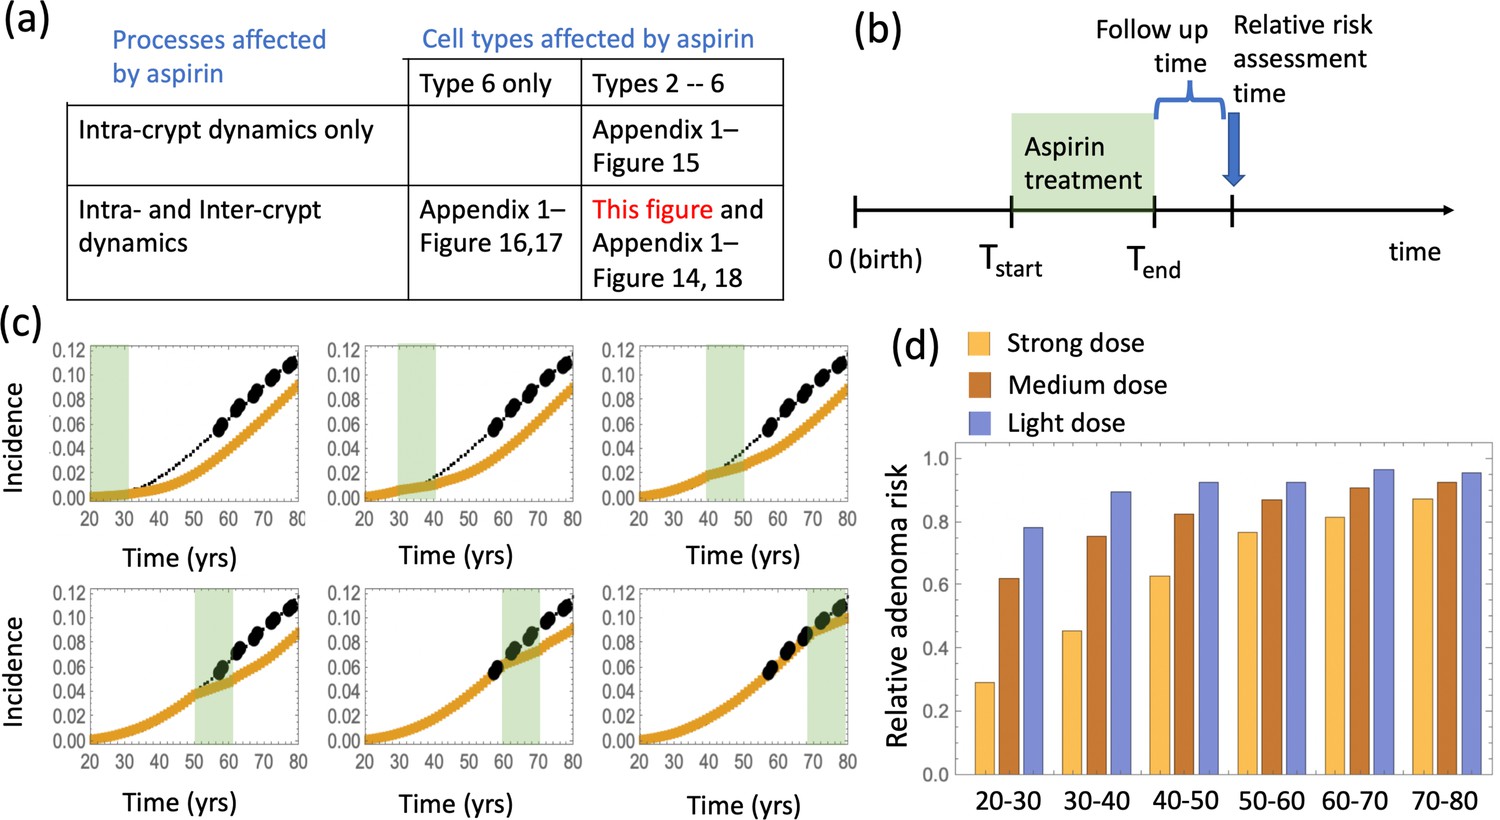
The effect of aspirin on the advanced adenoma incidence curve.
(a) Modeling assumptions and references to figures that present the results. (b) A schematic showing the timing of the model with aspirin treatment. (c) Predicted advanced adenoma incidence in the absence of aspirin treatment (thin black lines are the fitted curves and black dots are incidence data); and under aspirin treatment where the drug affects both inter- and intra-crypt dynamics of types 2 to –6 (yellow line). Each panel corresponds to aspirin treatment administered during one decade (20–30 years, 30–40 years, etc). The treatment period is shaded light green. See Figure 4—source data 1. (d) Relative incidence of advanced adenoma, where strong (yellow, the same as in panel (c)), medium (brown) and light (blue) aspirin treatment dose was used (Table 1). Treatment is applied for different decades (as marked under the bars), and the relative risk is evaluated at the end of the treatment decade (zero follow-up time). See Figure 4—source data 2. Parameter set #2 (Appendix 1—tables 1–3) was used. 2.5 × 10⁵ and 5 × 10⁵ independent simulations were used for each condition in panels (c) and (d) respectively. The code for panels (c–d) is provided, see Source code 2 (Mathematica). See also Source code 3 (Fortran), a stochastic simulation that produces simulated late adenoma incidence.
-
Figure 4—source data 1
Data for Figure 4c.
- https://cdn.elifesciences.org/articles/71953/elife-71953-fig4-data1-v1.txt
-
Figure 4—source data 2
Data for Figure 4d.
- https://cdn.elifesciences.org/articles/71953/elife-71953-fig4-data2-v1.txt
Appendix 1—figure 1
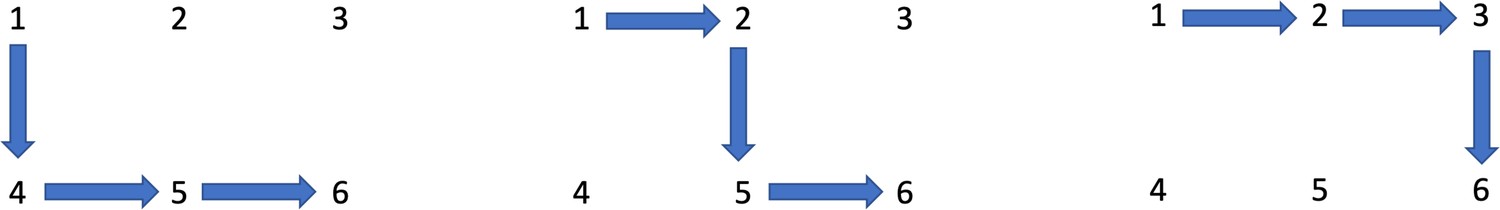
Three pathways to adenoma.
Appendix 1—figure 2
Model fitting to the incidence data.
(a) The best fitting curves corresponding to increasing SC division rates, r1, are plotted together with the epidemiological data. (b) The best fitting parameters and are shown for each value of r1. (c) The fitting error as a function of r1. The relative fitness values are fixed to . The rest of the parameters are as in Table Appendix 1—table 2.
Appendix 1—figure 3

Fitting the linear model.
Each panel shows fitting results for a particular parameter combination, (); the values of these two fitness parameters are indicated, and . The green lines show the log10(fitting error) as a function of r1. The fitted parameters and (multipied by 10) are shown as black (gray) lines. The rest of the parameters are as in Table Appendix 1—table 2.
Appendix 1—figure 4
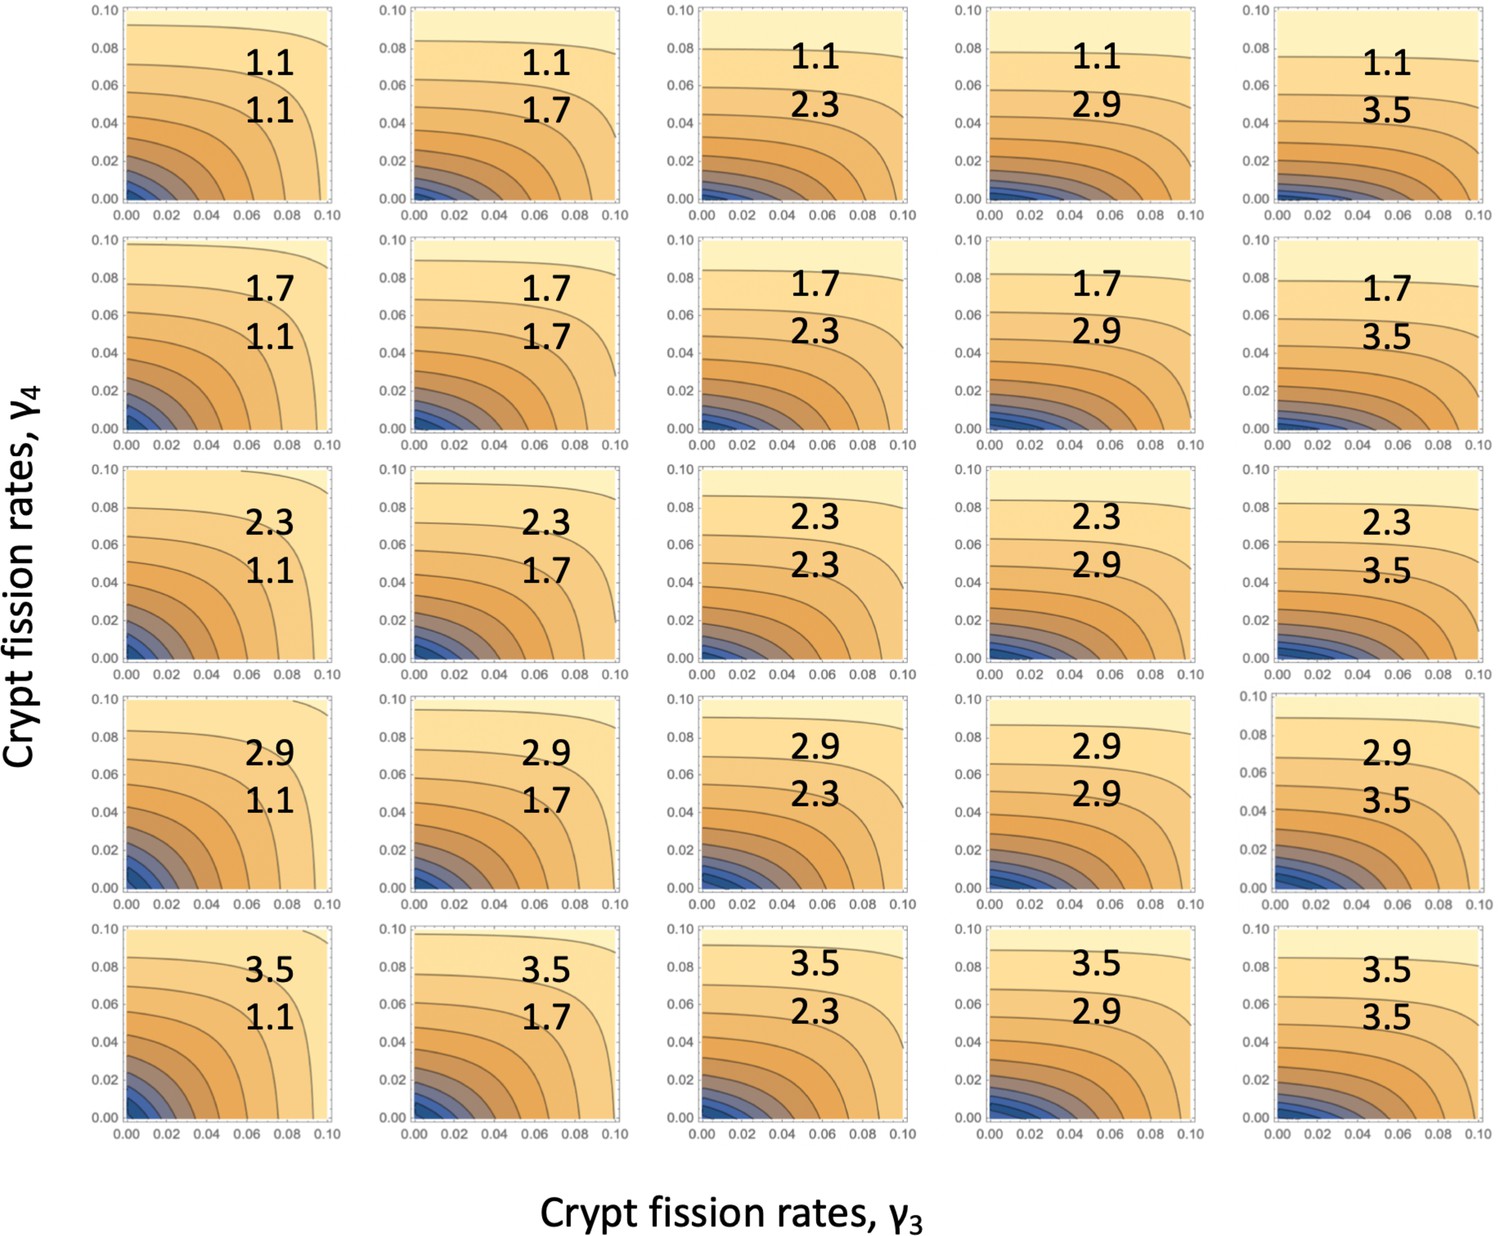
Fitting the linear system: for each parameter combination, (), of Appendix 1—figure 3, the error landscape is shown that corresponds to the best fitting r1 (see the minima of the green lines in Appendix 1—figure 3).
The contour plot represents log10(fitting error) as a function of and (darker colors correspond to lower values). The rest of the parameters are as in Table Appendix 1—table 2.
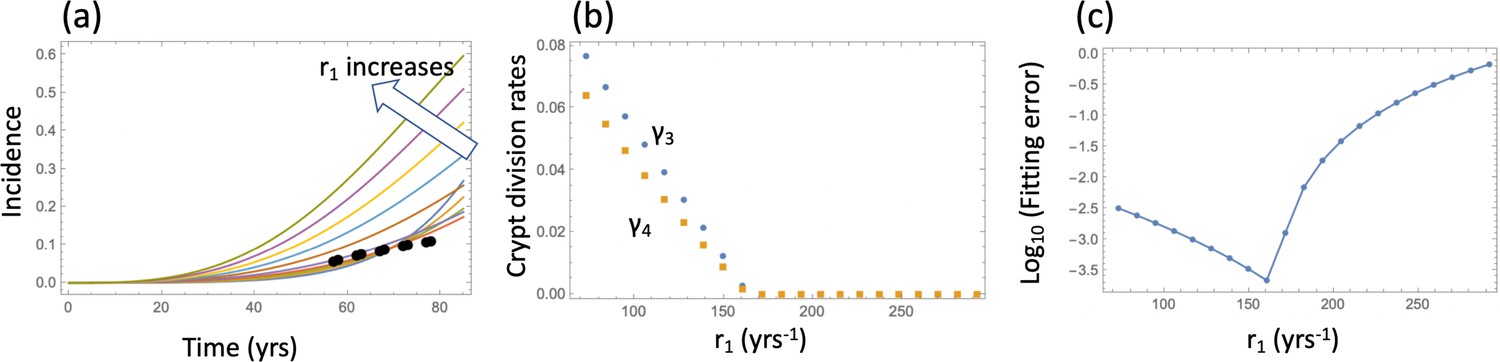
Appendix 1—figure 5
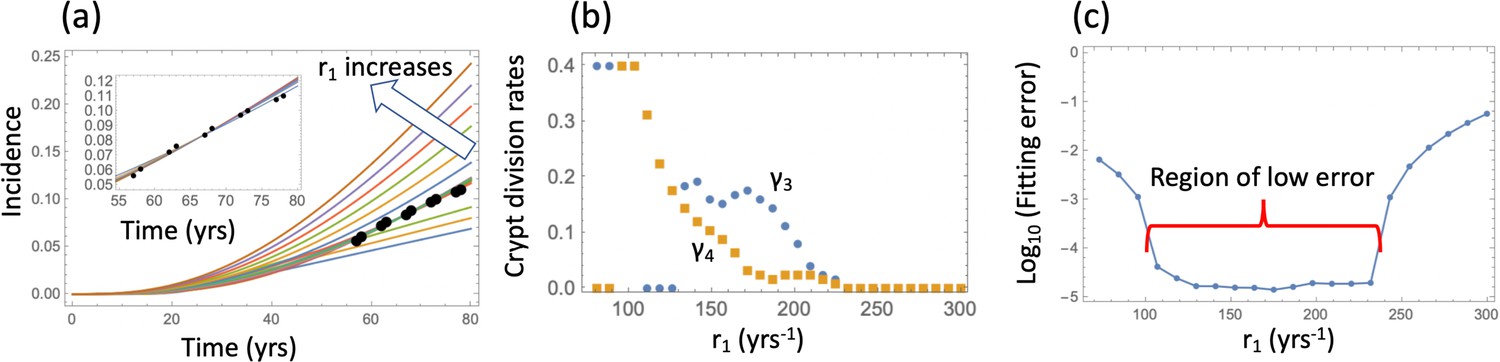
Nonlinear model fitting to the incidence data (fixing the crypt carrying capacity, varying crypt fission rates).
(a) The best fitting curves corresponding to increasing SC division rates, r1, are plotted together with the epidemiological data; inset: the best fitting curves corresponding to the values of r1 from the Region of low error, see panel (c). (b) The best fitting parameters and are shown for each value of r1. (c) The fitting error as a function of r1. The relative fitness values are fixed to . The rest of the parameters are as in Table Appendix 1—table 2.
Appendix 1—figure 6

Nonlinear model fitting to the incidence data (fixing crypt fission rates, varying the crypt carrying capacity).
Compared are the cases in the presence of a non-zero crypt death rate, yrs-1 (a–c), and in the absence of crypt death rate, yrs-1 (d-f). (a,d) The heatplot of the fitting error, where all parameters are fixed except and r1. Dark colors correspond to lower values of the error. (b,e) The fitting error as a function of r1. (c,f) The best fitting curves corresponding to increasing SC division rates, r1, are plotted together with the epidemiological data the value of r1 are taken from the Region of low error. Inset: The best fitting carrying capacity is shown for each value of r1. The rest of the parameter values are fixed to, and the rest as in Table Appendix 1—table 2.
Appendix 1—figure 7
Comparing deterministic solutions (system (LABEL:n1non-23, 12), solid lines) with the stochastic Gillespie simulations (symbols of the same color).
The three lines correspond to the different stopping conditions: (0) 1 crypt of type 6; (1) crypts of type 6, (2) crypts of type 6. The rest of the parameters are as in Appendix 1—figure 6a-c. 100,000 independent simulations were performed for each line, and the standard deviation bars are too small to see.
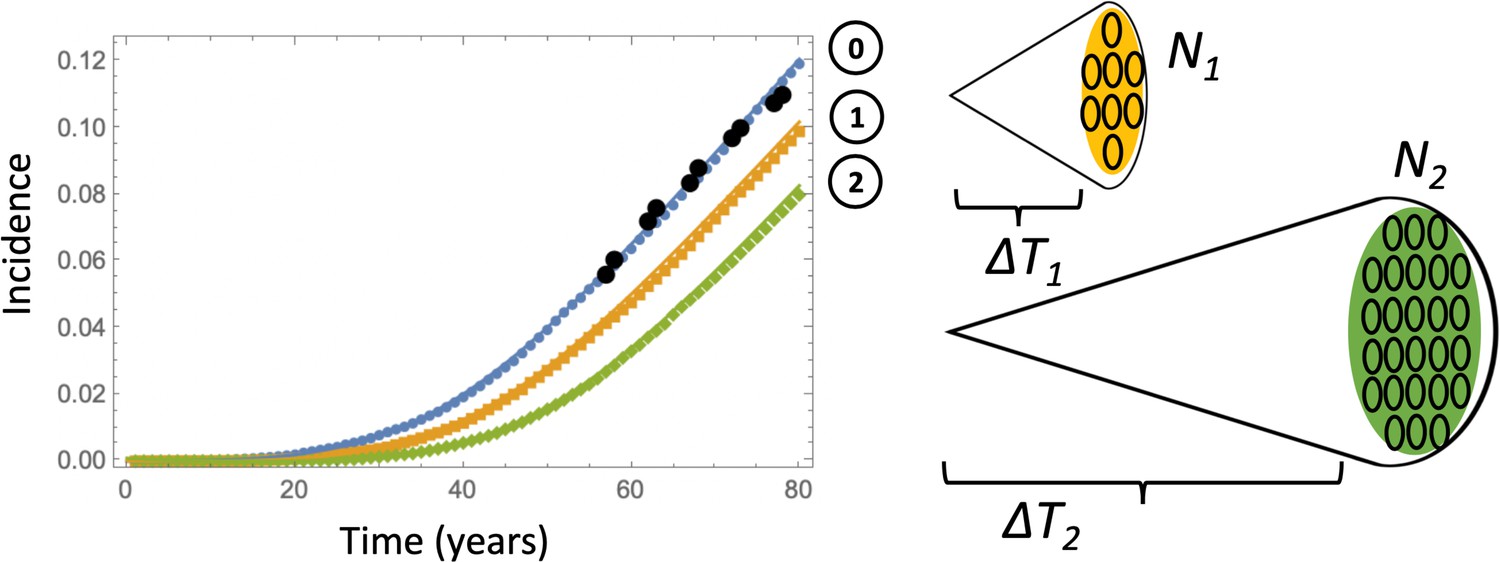
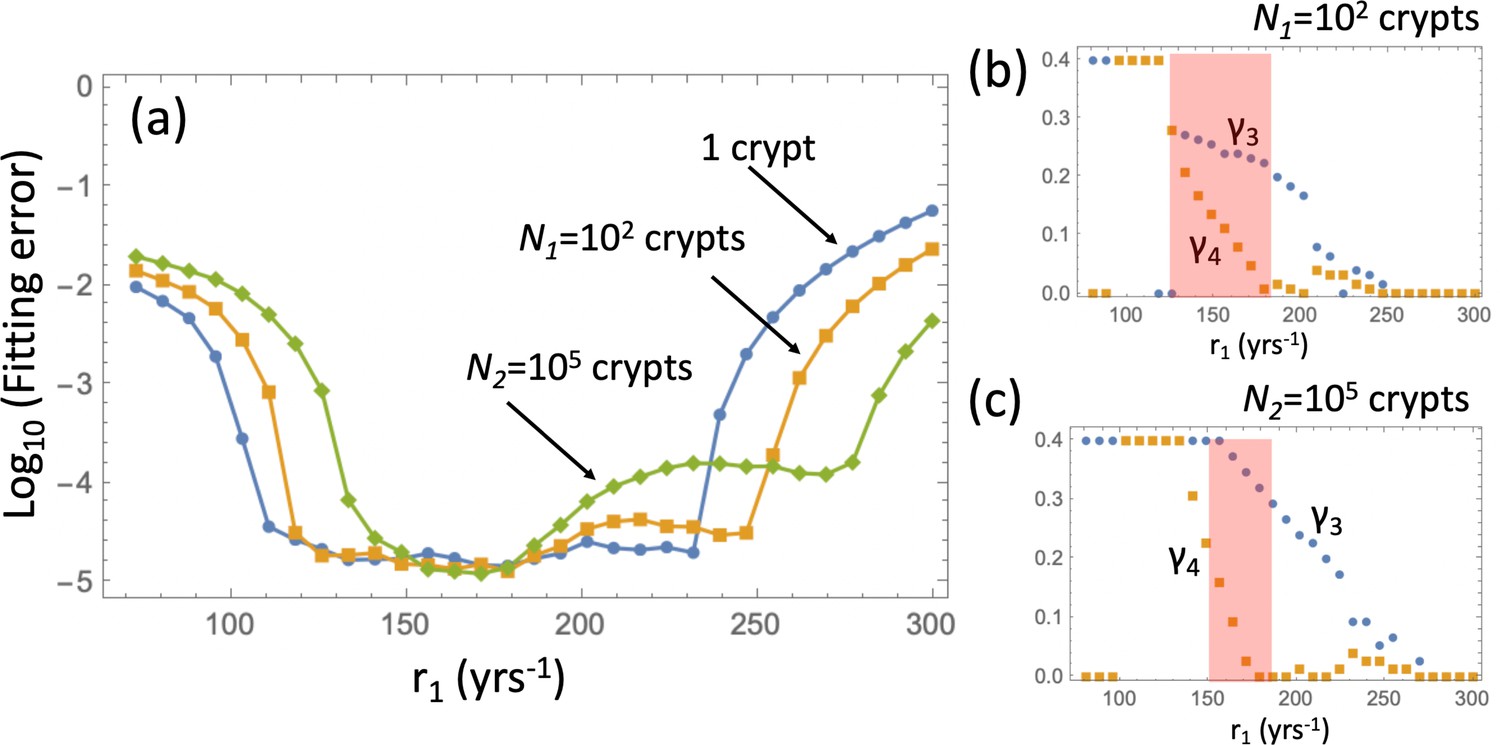
Appendix 1—figure 8
Fitting the adenoma incidence curve to the nonlinear model with an explicit expansion phase.
Under a fixed , for each value of r1 the best fitting values of and were found. (a) The fitting error is shown as a function of r1 for the original model (blue line, same as in Appendix 1—figure 5(c)); the model with expansion to N1 crypts (yellow curve), and the model with expansion to N2 crypts (green curve). (b) The best fitting values of crypt fission rates, and , for the model with expansion to N1 crypts. (b) The best fitting values of crypt fission rates, and, for the model with expansion to N2 crypts. The rest of the parameters are as in Appendix 1—figure 5.
Appendix 1—figure 9
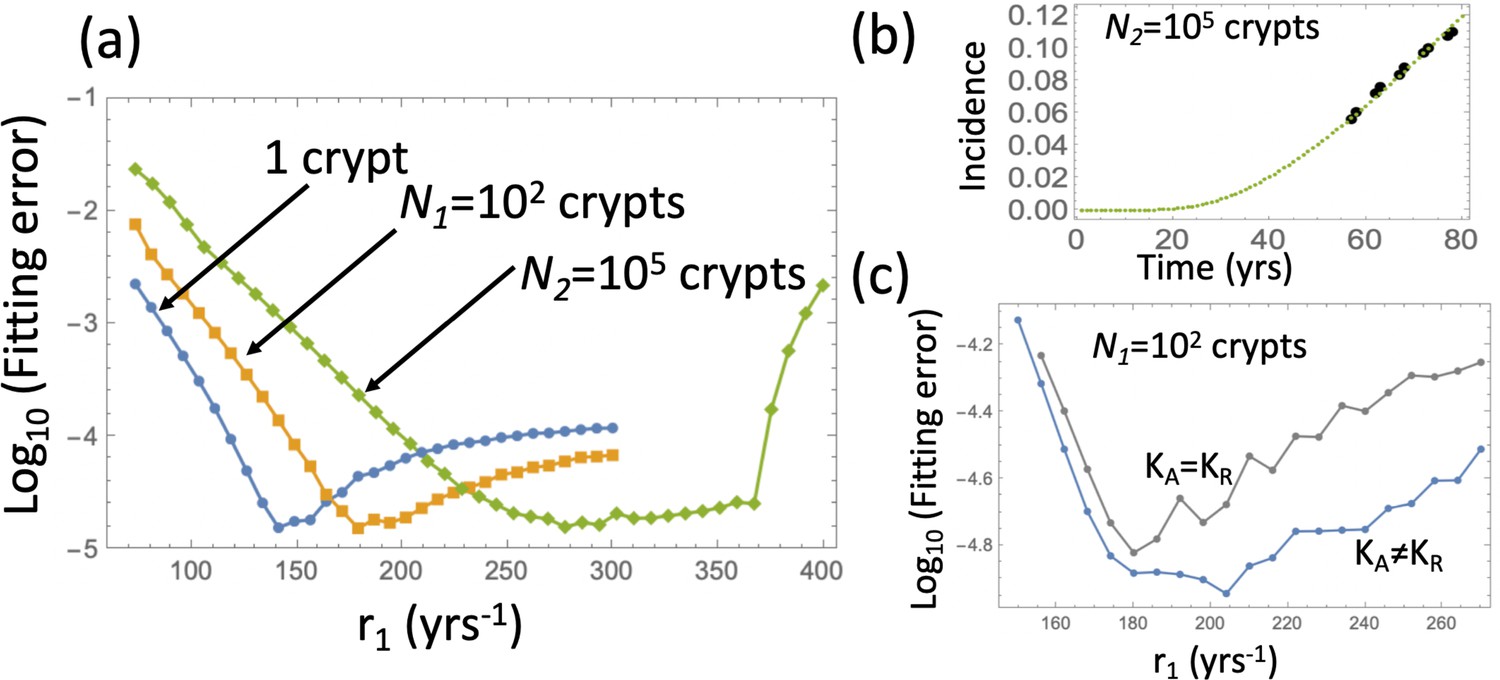
Fitting the adenoma incidence curve to the nonlinear model with an explicit expansion phase.
Under fixed crypt fission rates, for each value of r1 the best fitting value of was found. (a) The fitting error is shown as a function of r1 for the original model (blue line, same as in Appendix 1—figure 6(b)); the model with expansion to N1 crypts (yellow curve), and the model with expansion to N2 crypts (green curve). (b) The fitted incidence curve (Gillespie simulation) for the case of expansion to 105. The ODE prediction and the fitted curve for the expansion to 102 crypts look identical. (c) The reduction in error resulting from relaxing the restriction . The rest of the parameters are as in Appendix 1—figure 6(a-c).
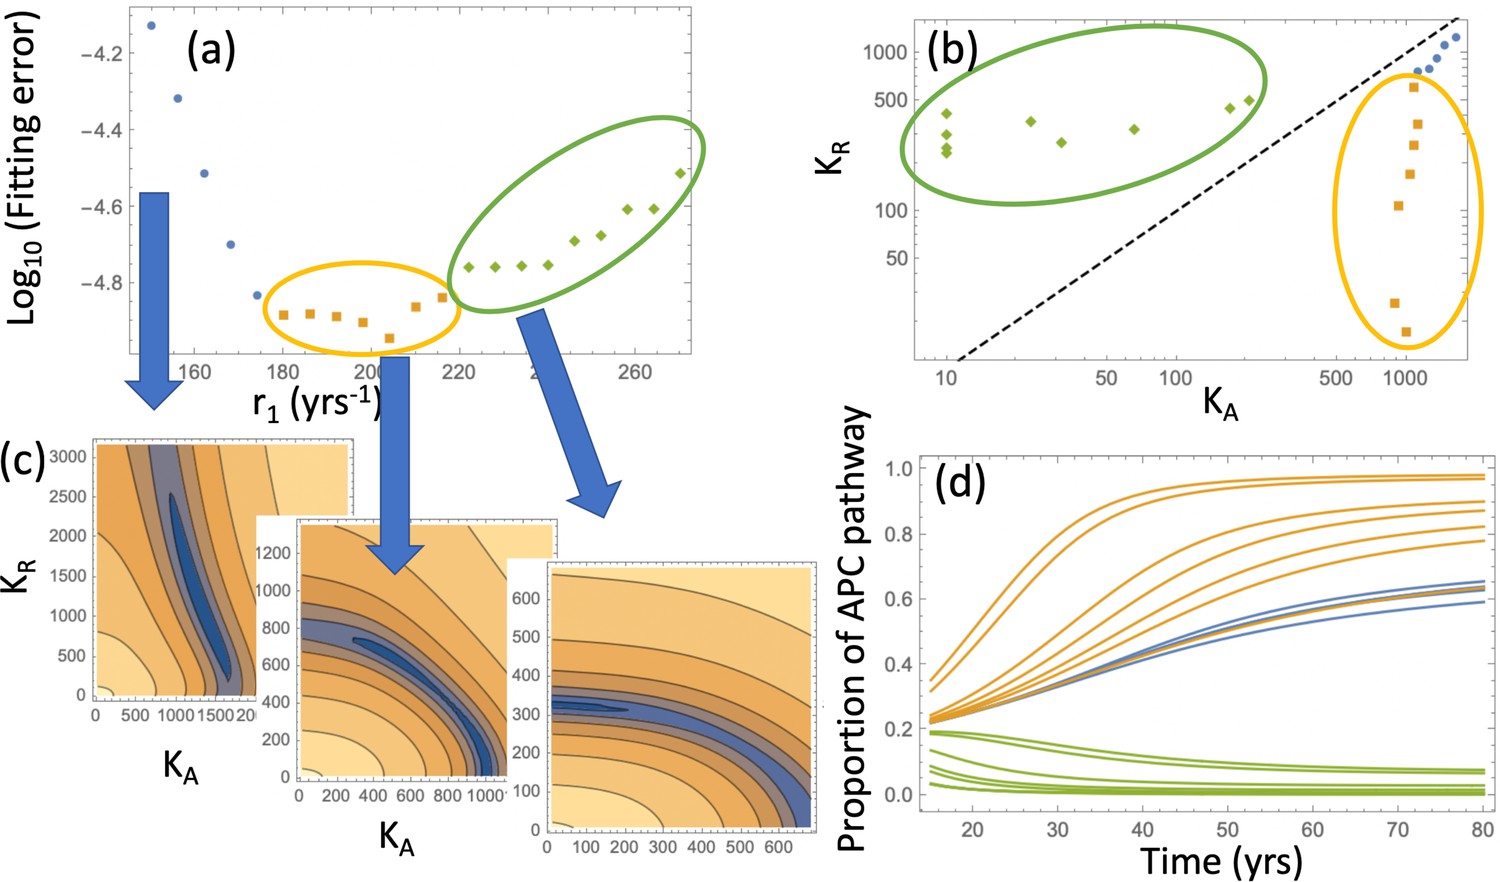
Appendix 1—figure 10
Pathways to adenoma: Fitting the incidence curve to the nonlinear model with an explicit expansion phase.
Under fixed crypt fission rates, for each value of r1 the best fitting pair ( was found. (a) The fitting error is shown as a function of r1; 3 groups of parameter combinations are marked by blue, orange, and green. (b) The best fitting pairs ( for each of the points in the three groups. (c) Heatplots of the fitting error as a function of (, for 3 different values of r1, one from each group. (d) Proportion of the APC pathway (formula Moolgavkar, 1978) plotted as a function of time for different values of r1, using the same color code for the three groups. Expansion to 102 crypts is assumed. The rest of the parameters are as in Appendix 1—figure 6a-c.
Appendix 1—figure 11
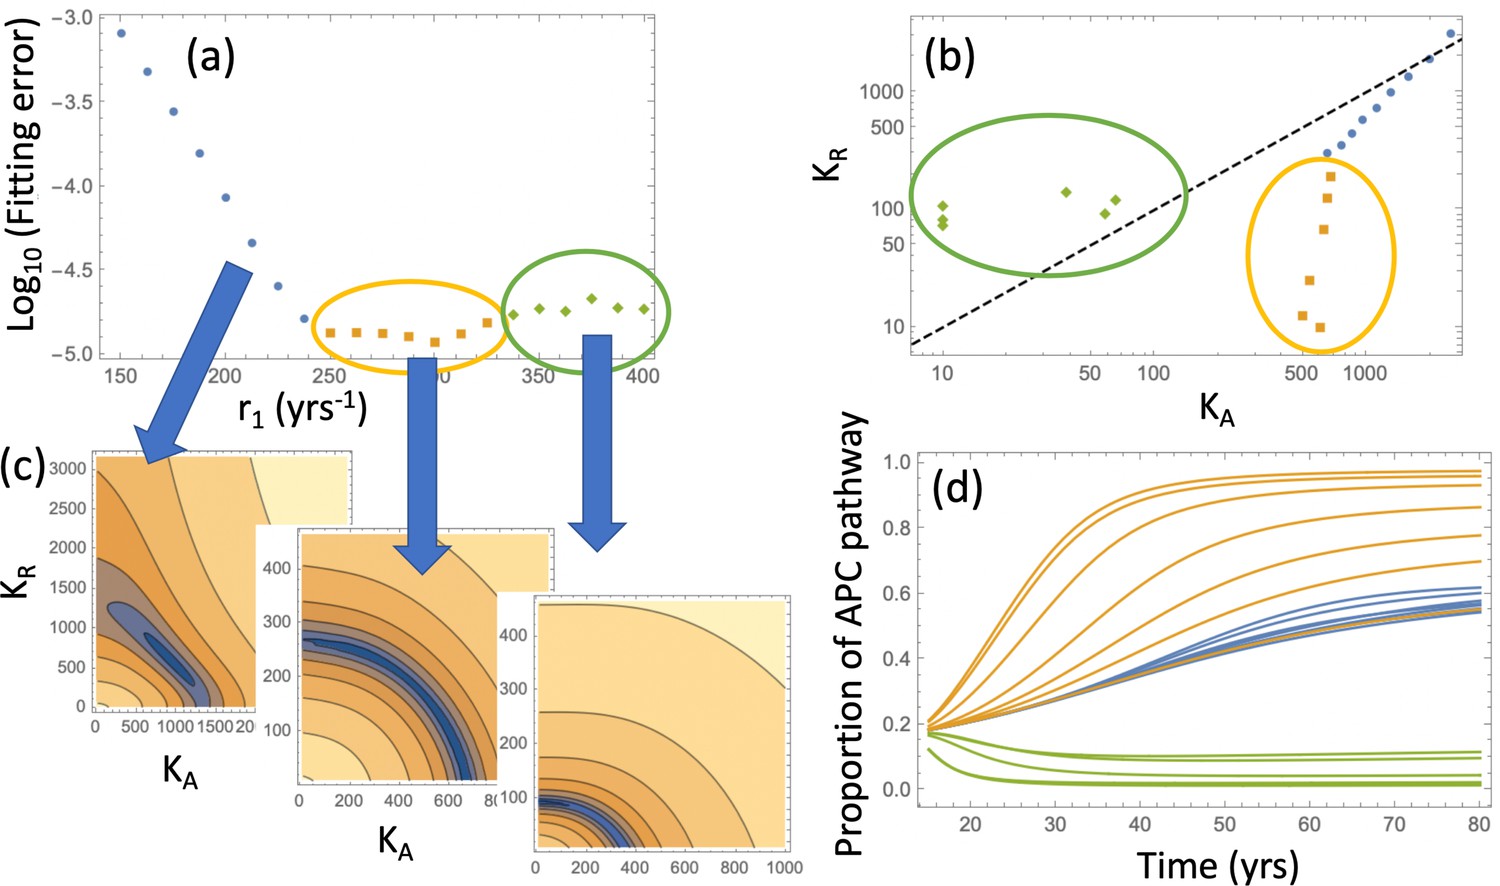
Same as Appendix 1—figure 10, except expansion to 105 crypts is assumed.
Appendix 1—figure 12
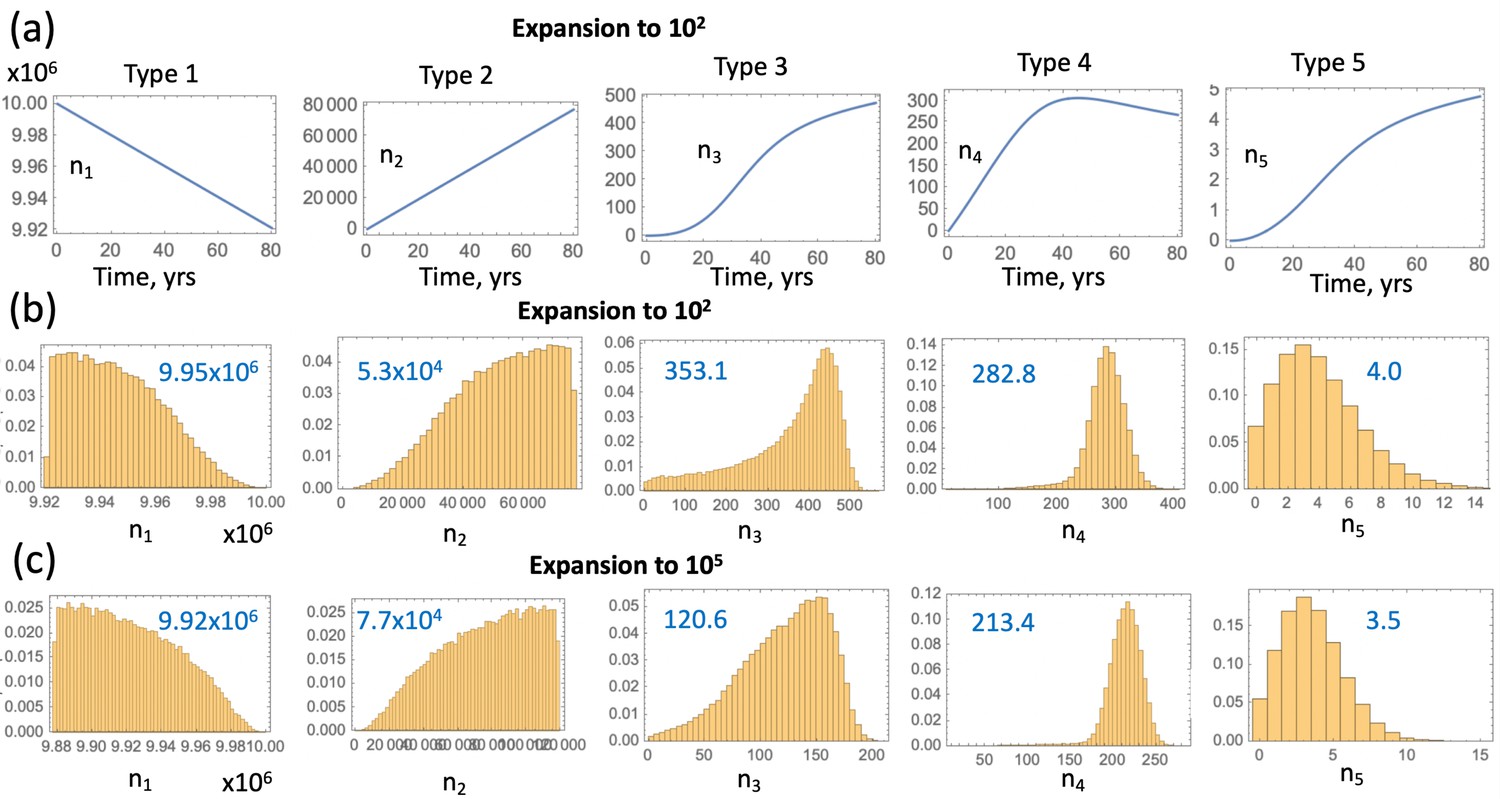
Compartment dynamics for the best fitting models with .
(a) The expected crypt numbers (using equations (LABEL:n1non-23)) for the 5 compartments are shown for the 2nd parameter set in table Appendix 1—figure 9(c) (expansion to 102 crypts). (b) For the same parameter values, probability distributions for the crypt numbers are shown at the time when the first type 6 crypt is created ( simulations were run); mean crypt numbers are shown in blue. (c) Same as (b) but for the 3rd parameter set in table Appendix 1—figure 9(c) (expansion to 105 crypts).
Appendix 1—figure 13
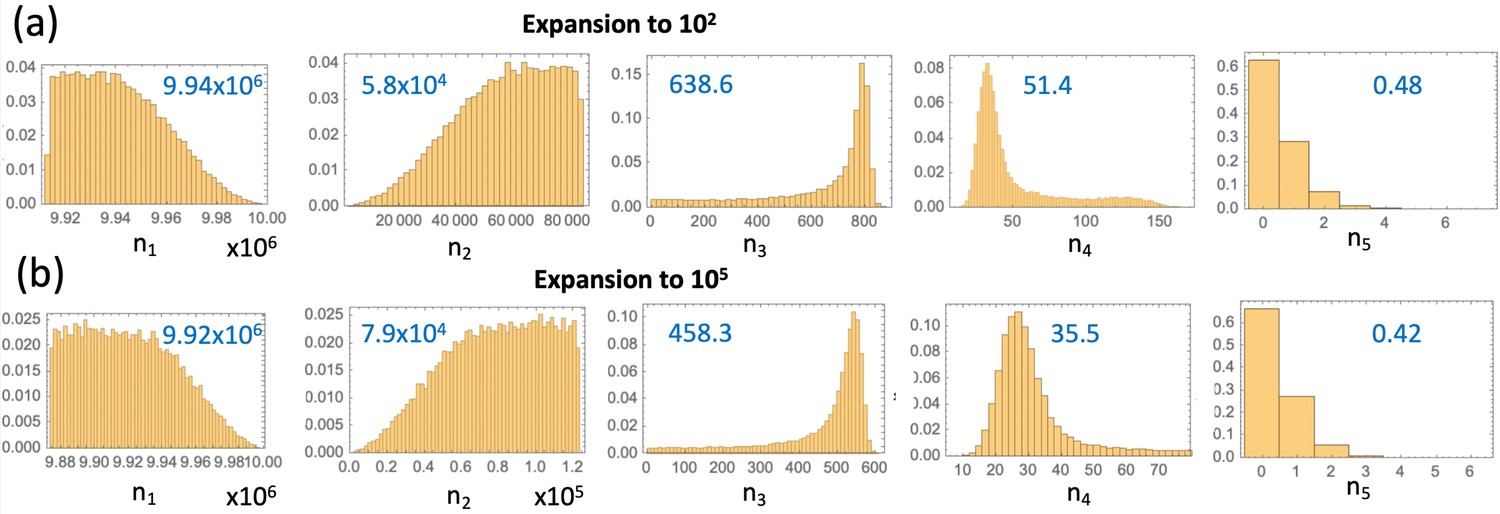
Same as Appendix 1—figure 12(b-c), but without the restriction .
(a) Parameter set #2 from Table Appendix 1—table 3 was used. (b) Parameter set #4 from Table Appendix 1—table 3 was used.
Appendix 1—figure 14
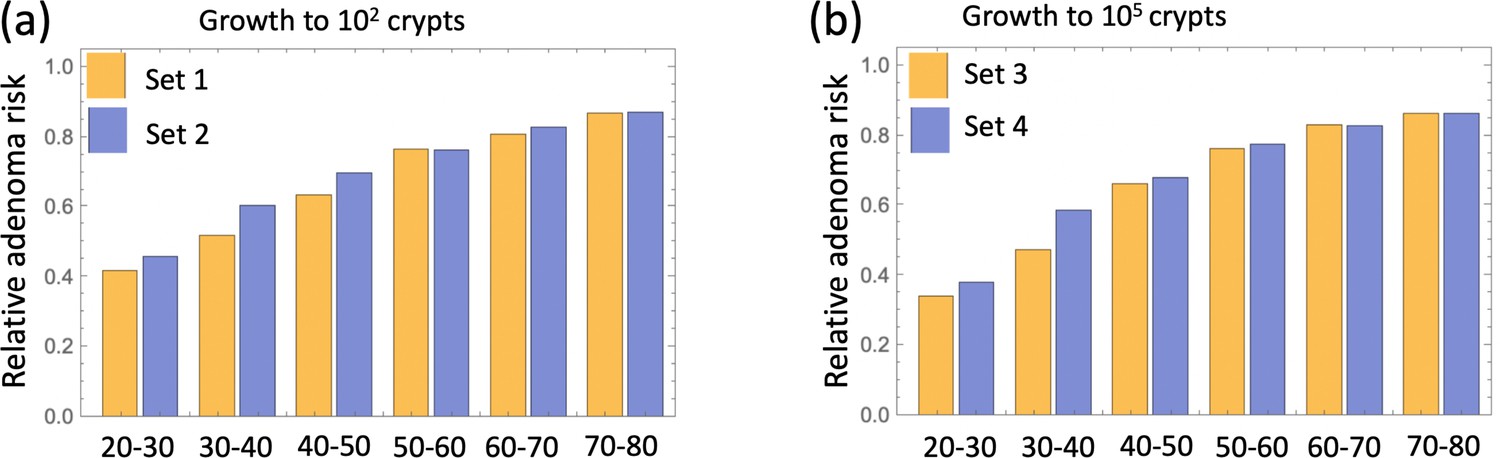
extends the results of main text Figure 4(a) and shows that relative adenoma risk predicted for each decade of treatment is very similar for all parameter sets (#1-4, Table Appendix 1—table 3).
Appendix 1—figure 15
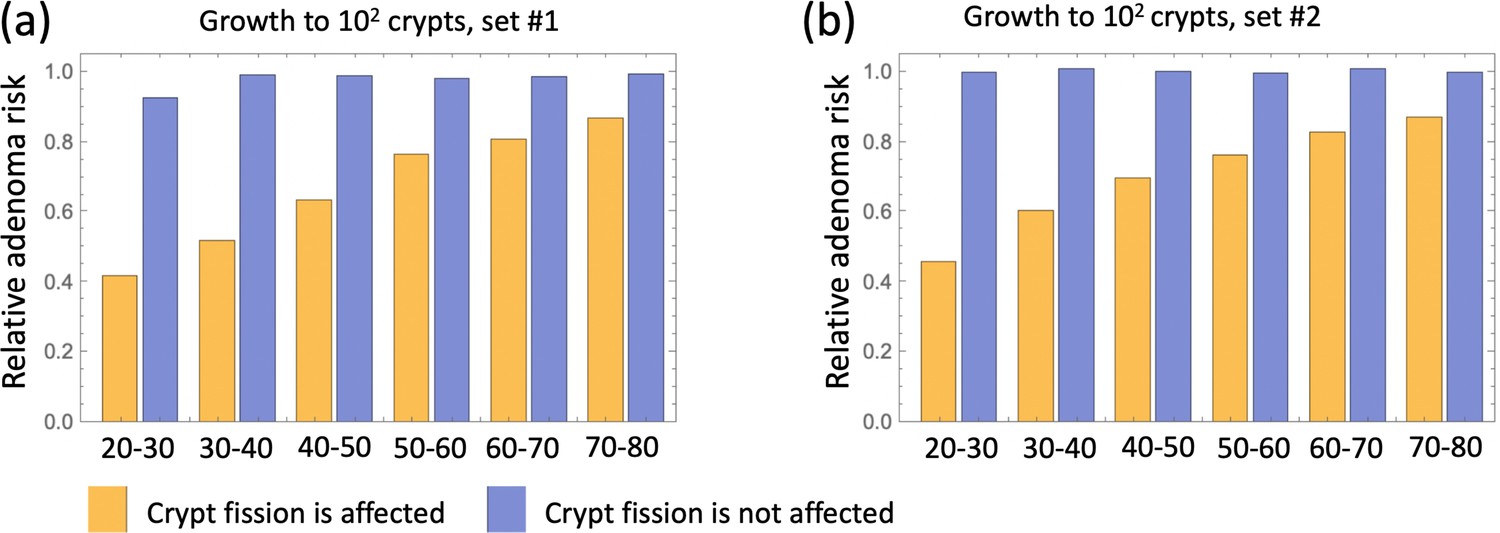
Relative incidence of advanced adenoma, where (a) parameter set #1 (Table Appendix 1—table 3) and (b) parameter sets #2 is used.
In each panel, a comparison is presented between the case where aspirin affects crypt fission/death rates (yellow) and where it does not affect crypt fission/death rates (blue). Aspirin affects cellular kinetics through conversion rates in all cases; types 2-6 are affected. independent simulations are used for each condition.
Appendix 1—figure 16
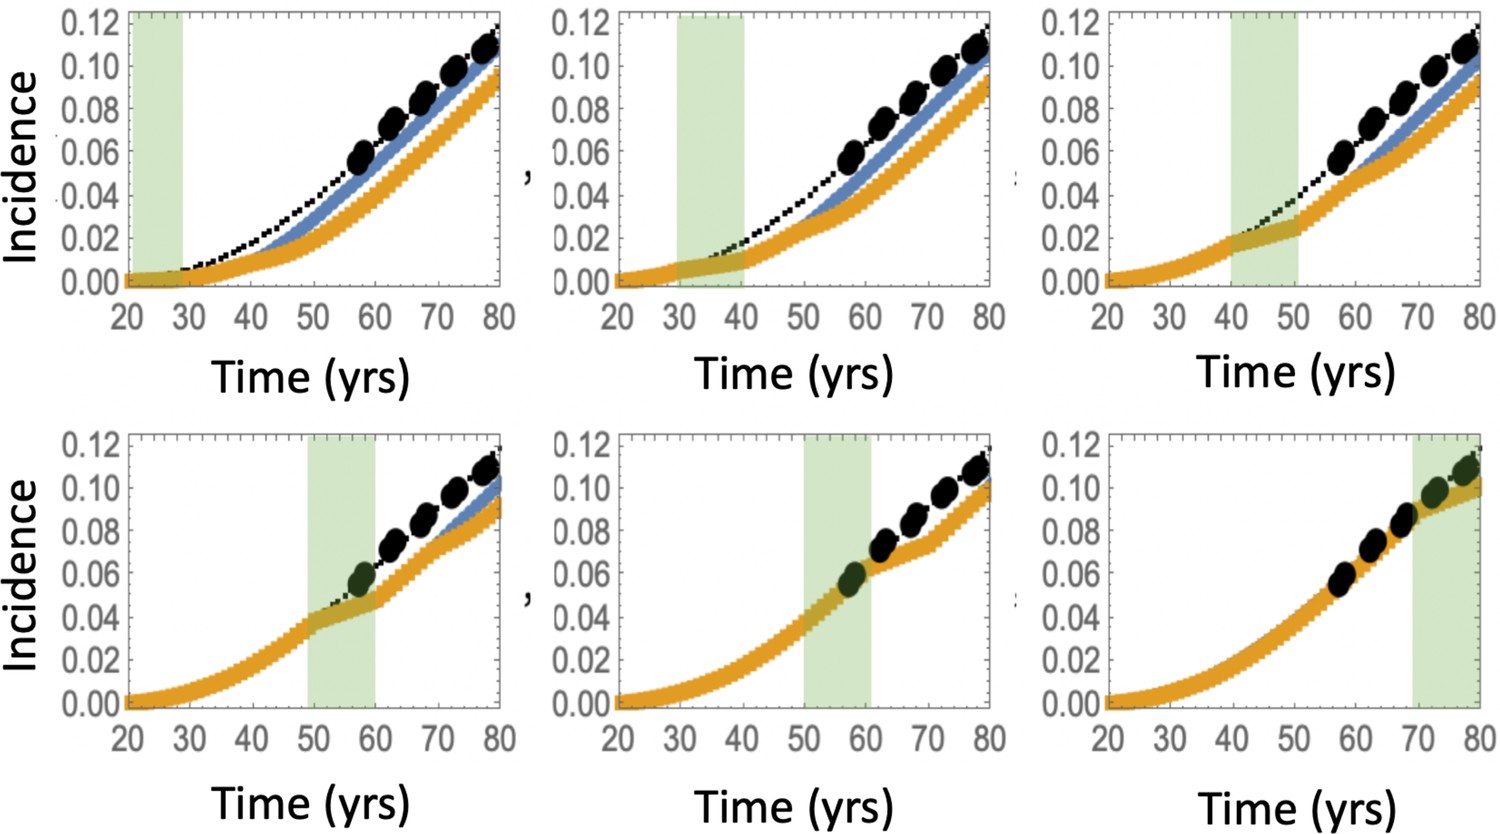
Predicted advanced adenoma incidence in the absence of aspirin treatment (thin black lines are the fitted curves and black dots are incidence data); under aspirin treatment where the drug affects types 2–6 (yellow lines), under aspirin treatment where the drug affects type 6 only (blue lines).
Each panel corresponds to aspirin treatment administered during one decade (20-30 years, 30–40 years, etc). The treatment period is shaded light green. It was assumed that type 6 crypts grow to 105, and set #4 in Table Appendix 1—table 3 was used. independent simulations are used for each condition.
Appendix 1—figure 17
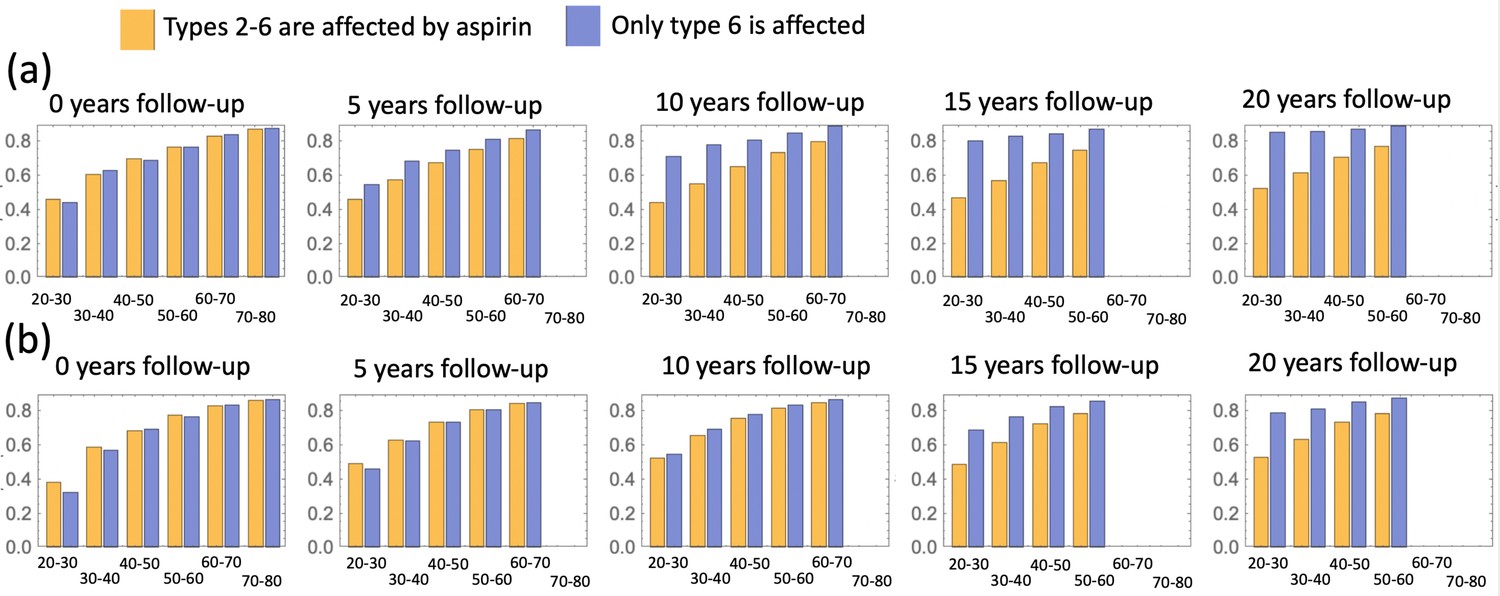
A comparison of predicted relative advanced adenoma risk under the assumption that cell types 2–6 (yellow bars) and only type 6 cells (blue bars) are affected by aspirin.
Aspirin is administered during different decades of patients’ life (as marked under each pair of bars), and different panels correspond to different durations of the follow-up period. (a) Parameter set #2, and (b) parameter set #4 (Table Appendix 1—table 3) is used; independent simulations are used for each condition.
Appendix 1—figure 18
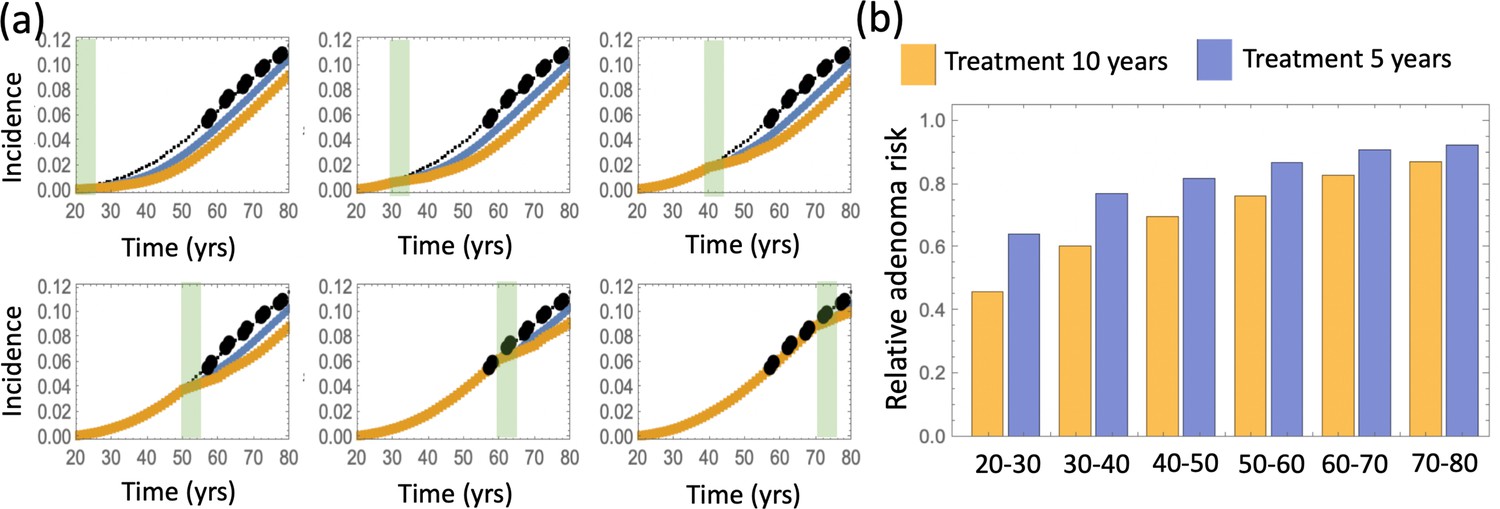
A comparison of predicted relative advanced adenoma risk under the assumption that aspirin treatment lasts 10 years (yellow) or 5 years (blue).
(a) Predicted advanced adenoma incidence in the absence of aspirin treatment (thin black lines are the fitted curves and black dots are incidence data); the incidence curve fo patients treated for 10 (yellow) and 5 (blue) years. Aspirin is administered during different decades of patients’ life (the shorter, 5 year intervals, are marked green). (b) A comparison of predicted relative advanced adenoma risk under the assumption of treatment for 10 years (yellow bars) and 5 years (blue bars). All cell types 2–6 are affected by aspirin (both through conversion and fission/death). Parameter set #2 is used; independent simulations are used for each condition.
Tables
Table 1
Aspirin doses in xenograft experiments, the equivalent human dose and the resulting changes in kinetic rates.
| Dose in xeno- grafts (mg/kg) | Equivalent dose in humans (325 cm pills per week) | Fold difference in division rate, Fr | Fold difference Un death rate, Fd | Fitness factor |
|---|---|---|---|---|
| 15 | 1.8 | 0.9 | 1.5 | 0.86 |
| 50 | 6.1 | 0.75 | 1.75 | 0.70 |
| 100 | 12.2 | 0.5 | 2.0 | 0.45 |
Appendix 1—table 1
Enumeration of the different genotypes.
| Mutations in APC | Mutations in KRAS | Type number |
|---|---|---|
| 0 | 0 | 1 |
| 1 | 0 | 2 |
| 2 | 0 | 3 |
| 0 | 1 | 4 |
| 1 | 1 | 5 |
| 2 | 1 | 6 |
Appendix 1—table 2
Parameters, notations, and their values.
| Parameter | Notation | Value/Range |
|---|---|---|
| Number of crypts | 107 | |
| Number of SCs per crypt | K | 7 |
| Rate of inactivation of APC (per cell division) | u | 10-7 |
| Rate of inactivation of APC (per cell division) | μ | 10-9 |
| Division rate of WT SCs (per year) | r1 | (18,365) |
| Relative fitness of APC +/- cells | 1.6 | |
| Relative fitness of APC-/- cells | 3.76 | |
| Relative fitness of KRAS+ cells | 3.54 | |
| Division rate of APC-/- crypts (per year) | 0.2 | |
| Division rate of KRAS+ crypts (per year) | 0.07 |
Appendix 1—table 3
Parameters obtained from the fitting procedures in Appendix 1—figure 10 and Appendix 1—figure 11.
| Parameter set # | (crypts) | (yrs) | r1(yrs-1) | Comment | ||
|---|---|---|---|---|---|---|
| 1 | 102 | 4.79 | 204 | 1000 | 17 | best fit |
| 2 | 102 | 4.79 | 198 | 1039 | 171 | 2nd best fit |
| 3 | 105 | 11.97 | 300 | 607 | 10 | best fit |
| 4 | 105 | 11.97 | 288 | 631 | 68 | 2nd best fit |
Additional files
-
Transparent reporting form
- https://cdn.elifesciences.org/articles/71953/elife-71953-transrepform1-v1.pdf
-
Source code 1
- https://cdn.elifesciences.org/articles/71953/elife-71953-code1-v1.zip
-
Source code 2
Mathematica code for Figure 4.
- https://cdn.elifesciences.org/articles/71953/elife-71953-code2-v1.zip
-
Source code 3
A Fortran code for stochastic simulations (e.g. Figure 4).
- https://cdn.elifesciences.org/articles/71953/elife-71953-code3-v1.zip
Download links
A two-part list of links to download the article, or parts of the article, in various formats.
Downloads (link to download the article as PDF)
Open citations (links to open the citations from this article in various online reference manager services)
Cite this article (links to download the citations from this article in formats compatible with various reference manager tools)
Aspirin’s effect on kinetic parameters of cells contributes to its role in reducing incidence of advanced colorectal adenomas, shown by a multiscale computational study
eLife 11:e71953.
https://doi.org/10.7554/eLife.71953


