Target-specific control of olfactory bulb periglomerular cells by GABAergic and cholinergic basal forebrain inputs
- Institut des Neurosciences Cellulaires et Intégratives, Centre National de la Recherche Scientifique, France
Figures
Figure 1
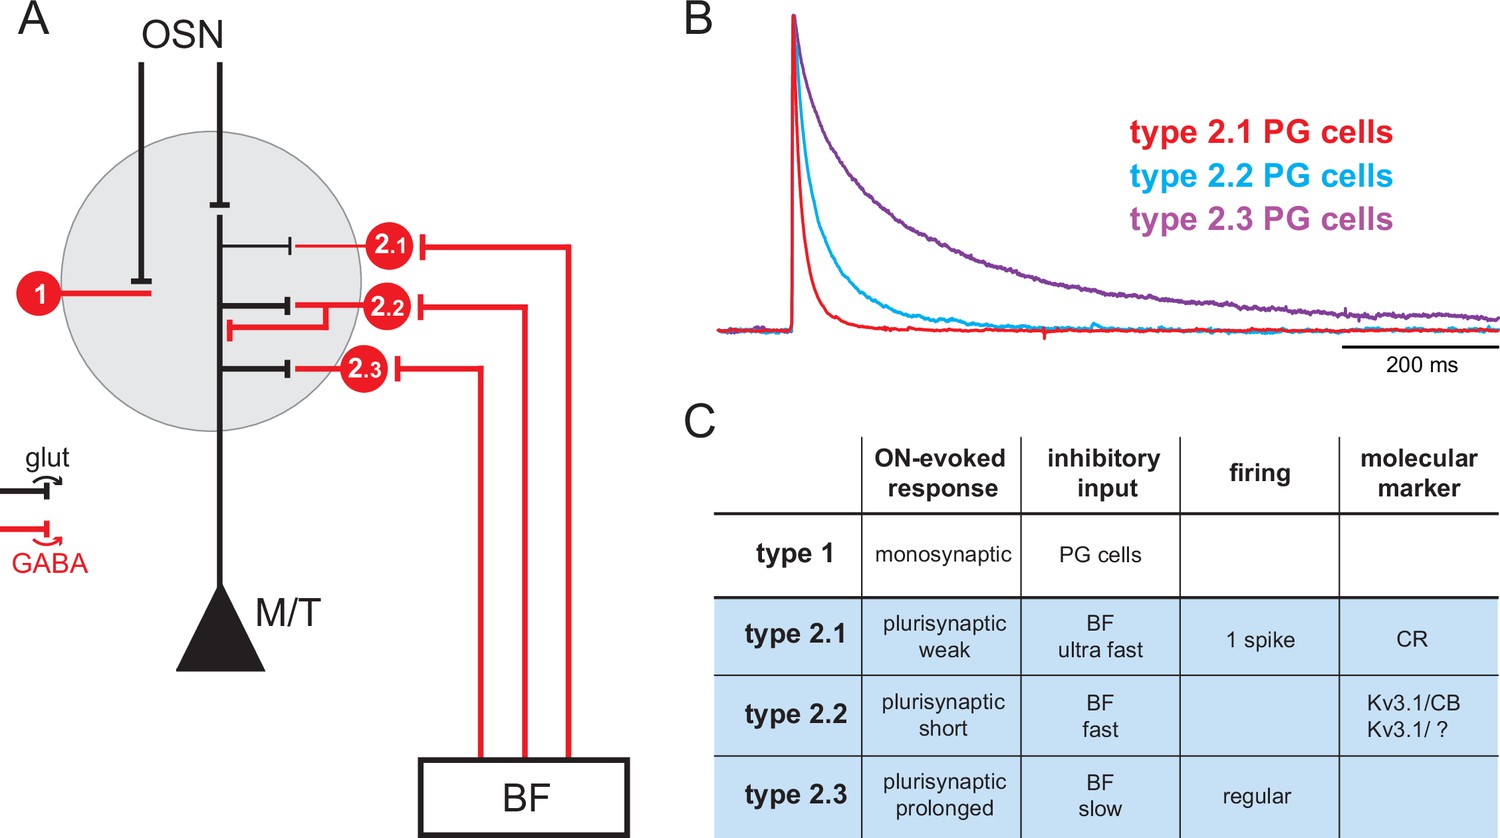
Basal forebrain (BF) GABAergic inputs define three subtypes of periglomerular (PG) cells.
(A) Diagram of the glomerular microcircuit. PG cells are small GABAergic interneurons (red) surrounding each glomerulus. Olfactory sensory neurons (OSNs)-innervated type 1 PG cells do not receive BF GABAergic inputs, whereas type 2 PG cells do. Three subtypes of type 2 PG cells have been identified in Sanz Diez et al., 2019 based on their synaptic, molecular, and intrinsic properties. See ‘Introduction’ for details. (B) Representative optogenetically evoked BF GABAergic inputs in the different subtypes of type 2 PG cells. Amplitudes are normalized for comparison. Data from Sanz Diez et al., 2019. (C) Summary table of the properties that distinguish different PG cell subtypes. Cases are left empty when the properties have not been determined, are diverse, or uncertain.
Figure 2 with 1 supplement
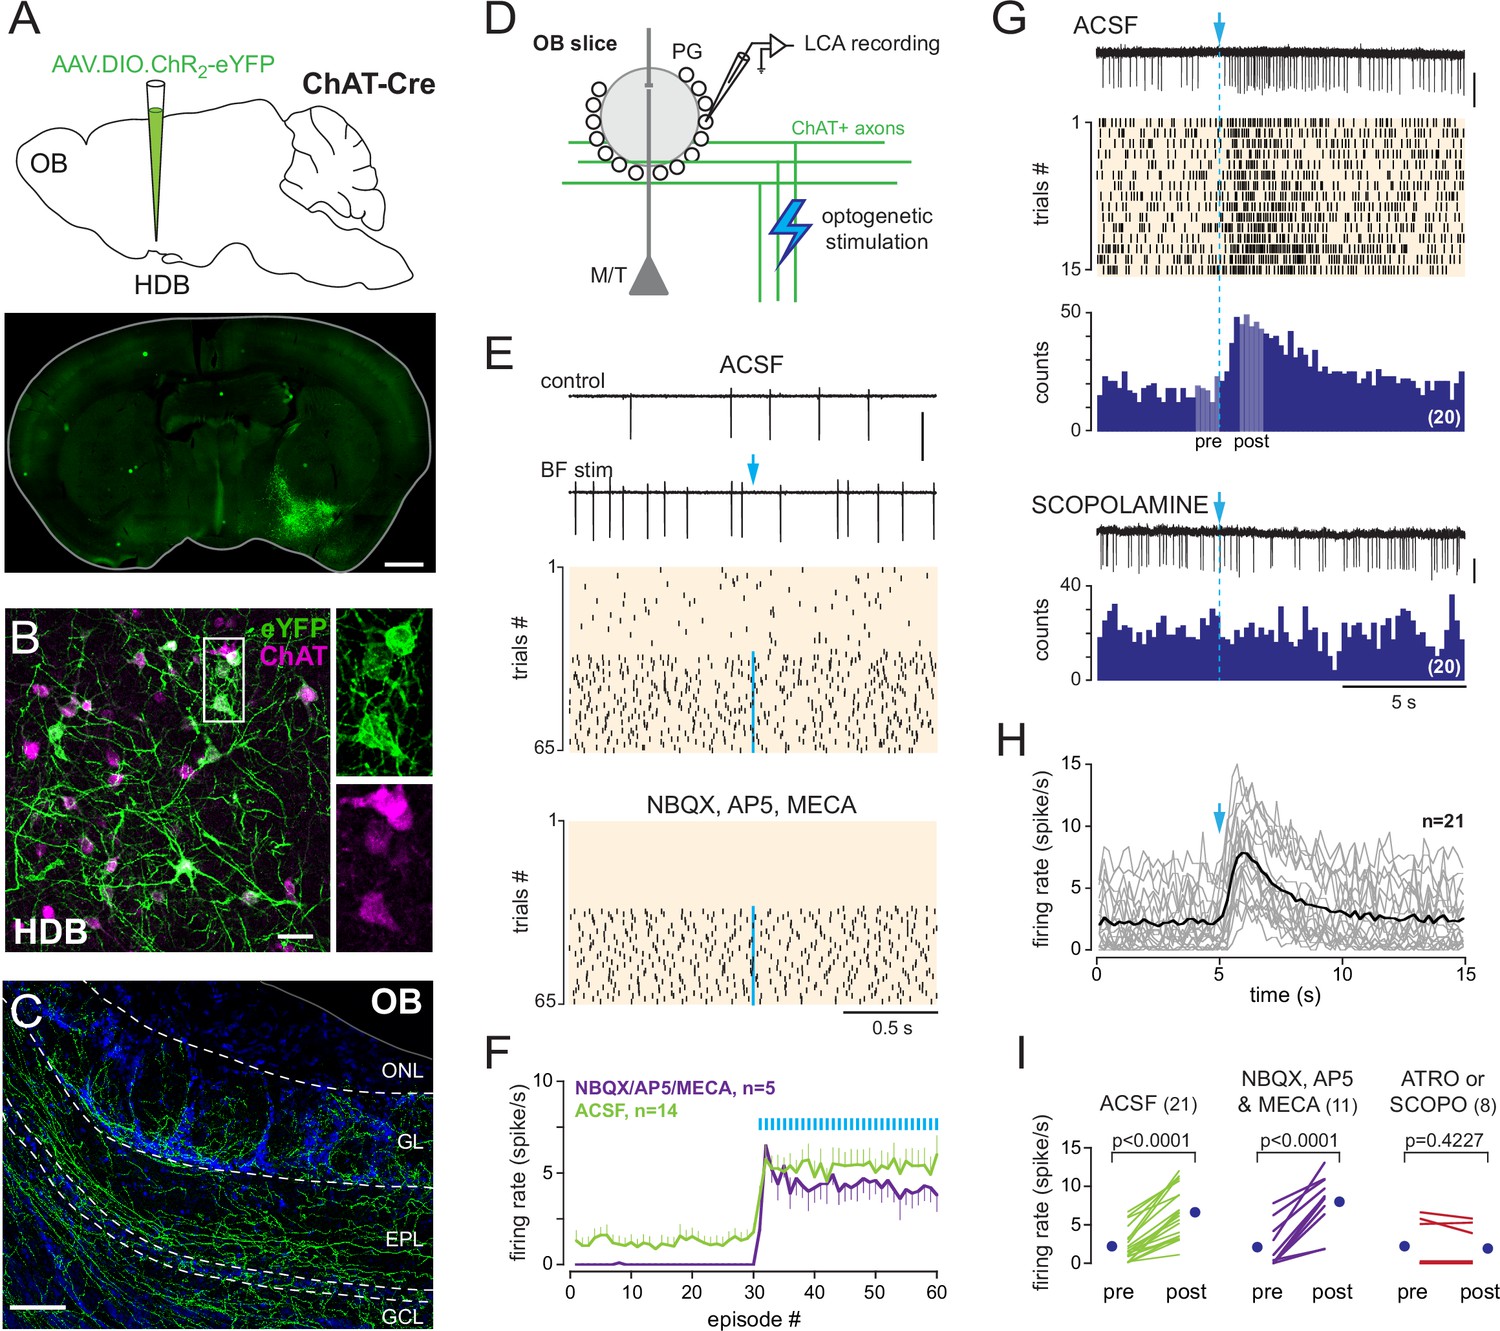
Basal forebrain (BF) cholinergic neurons activate a subset of periglomerular (PG) cells.
(A) Schematic of the virus injection in ChatCre mice (top) and coronal section (bottom), at about bregma –0.1 mm, 20 days after injection. (B) ChR2-eYFP expression (green) in choline acetyltransferase (ChAT)-expressing cholinergic neurons (magenta) in the BF. Scale bar 50 µm. Right panels: zoom on the boxed region. (C) ChR2-eYFP-expressing axons in the olfactory bulb (OB). Scale bar 100 µm. DAPI staining (blue) delimits layers (ONL: olfactory nerve layer; GL: glomerular layer; EPL: external plexiform layer; GCL: granule cell layer). Higher-resolution image in Figure 2—figure supplement 1. (D) Experimental design for recording BF-evoked responses in OB slices. (E) Top: two representative 2-s-long loose cell-attached (LCA) recording episodes (scale bar 200 pA) and raster plot of spiking activity in control condition and when BF axons were photostimulated every 2 s (blue arrow, 1 ms flash, 490 nm). Photostimulation started at episode 31 (one flash/episode, blue line). Bottom: raster plot for the same cell, same experiment in the presence of blockers. (F) Average firing rate per episode (2 s each) in artificial cerebrospinal fluid (ACSF) (green) or in the presence of blockers (violet). Low-frequency photostimulation (0.5 Hz) started at episode 31. (G) Representative recording (scale bar 50 pA), raster plot, and peri stimulus time histograms (PSTH) (20 consecutive trials, bin 200 ms) of an excitatory response evoked in ACSF by a single photostimulation of the BF cholinergic axons at blue arrow and dotted line. Pale areas within the PSTH indicate the two periods that were compared in (I). The nonselective muscarinic ACh receptor (mAChR) antagonist scopolamine (10 µM) blocked the evoked excitation (bottom, scale bar 50 pA). (H) Average firing rate per bin and per 15-s-long episode for 21 cells recorded in ACSF. Each gray line corresponds to a cell; the black line indicates the ensemble average. Photostimulation at blue arrow. (I) Firing rate before (pre) and after (post) photostimulation of BF axons in ACSF (green) in the presence of 6-nitro-7-sulfamoylbenzo[f]quinoxaline-2,3-dione (NBQX), D-2-amino-5-phosphonopentanoic acid (D-AP5), and mecamylamine (violet) or in the presence of the mAChR antagonist atropine (n = 4) or scopolamine (n = 4) (red). Each line indicates a cell; blue circles are the means. Paired t-test or Wilcoxon signed-rank-sum test (for atro/scopo).
Figure 2—figure supplement 1
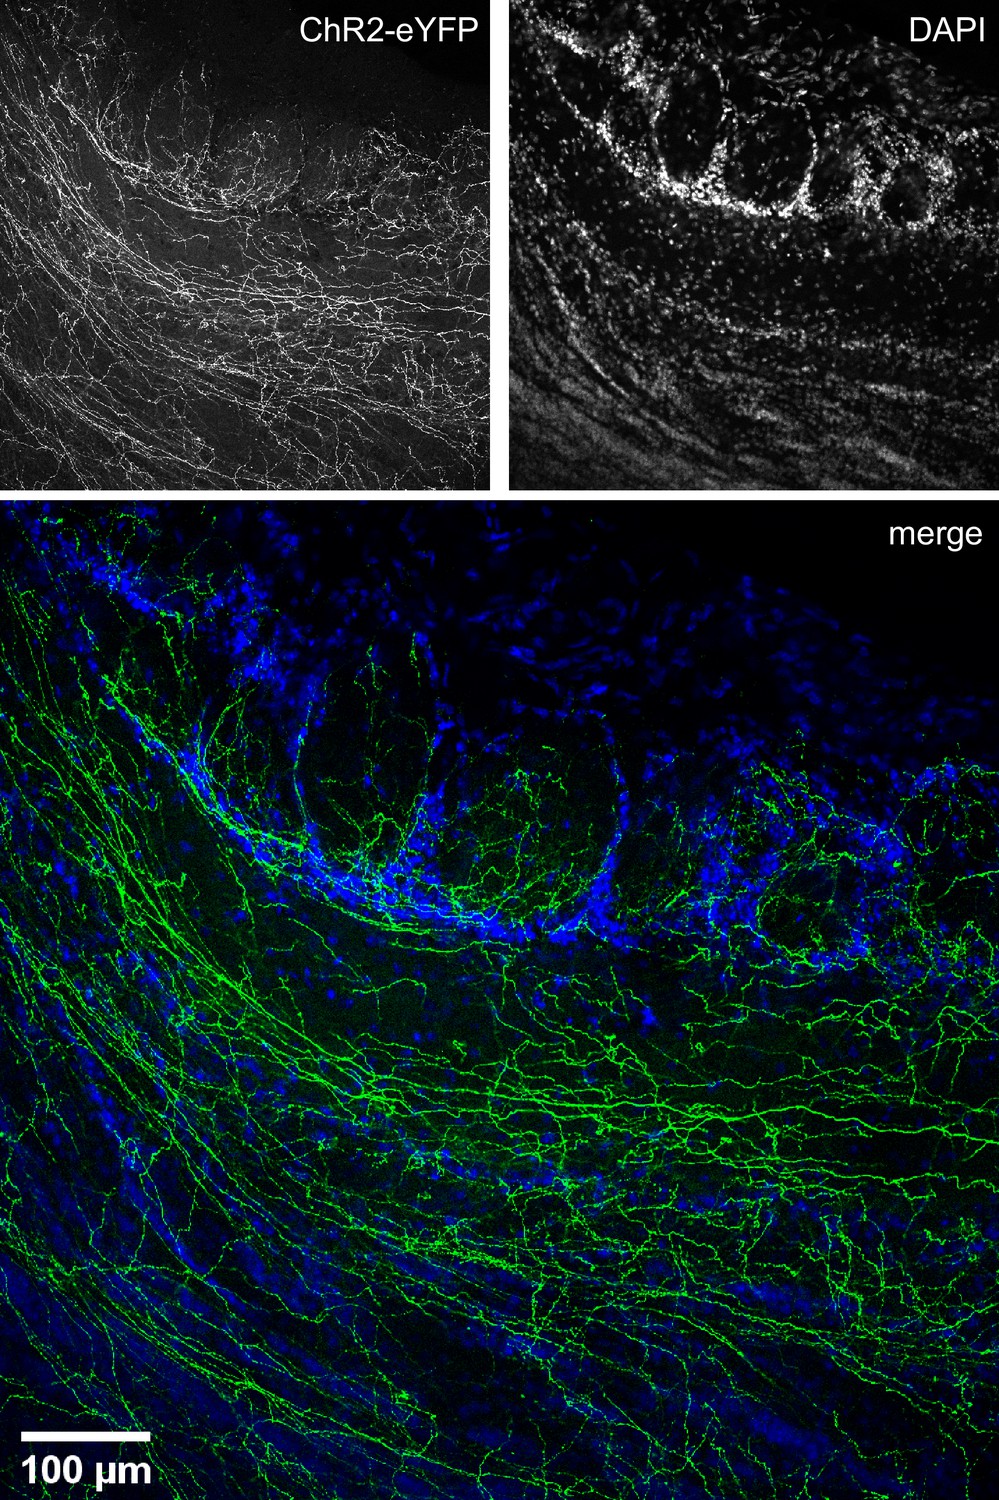
Higher-resolution image of Figure 2C showing the distribution in the olfactory bulb (OB) of choline acetyltransferase (ChAT) mice of eYFP-expressing axons from basal forebrain (BF) cholinergic neurons.
The two channels used to make this image are shown on top.
Figure 3 with 3 supplements
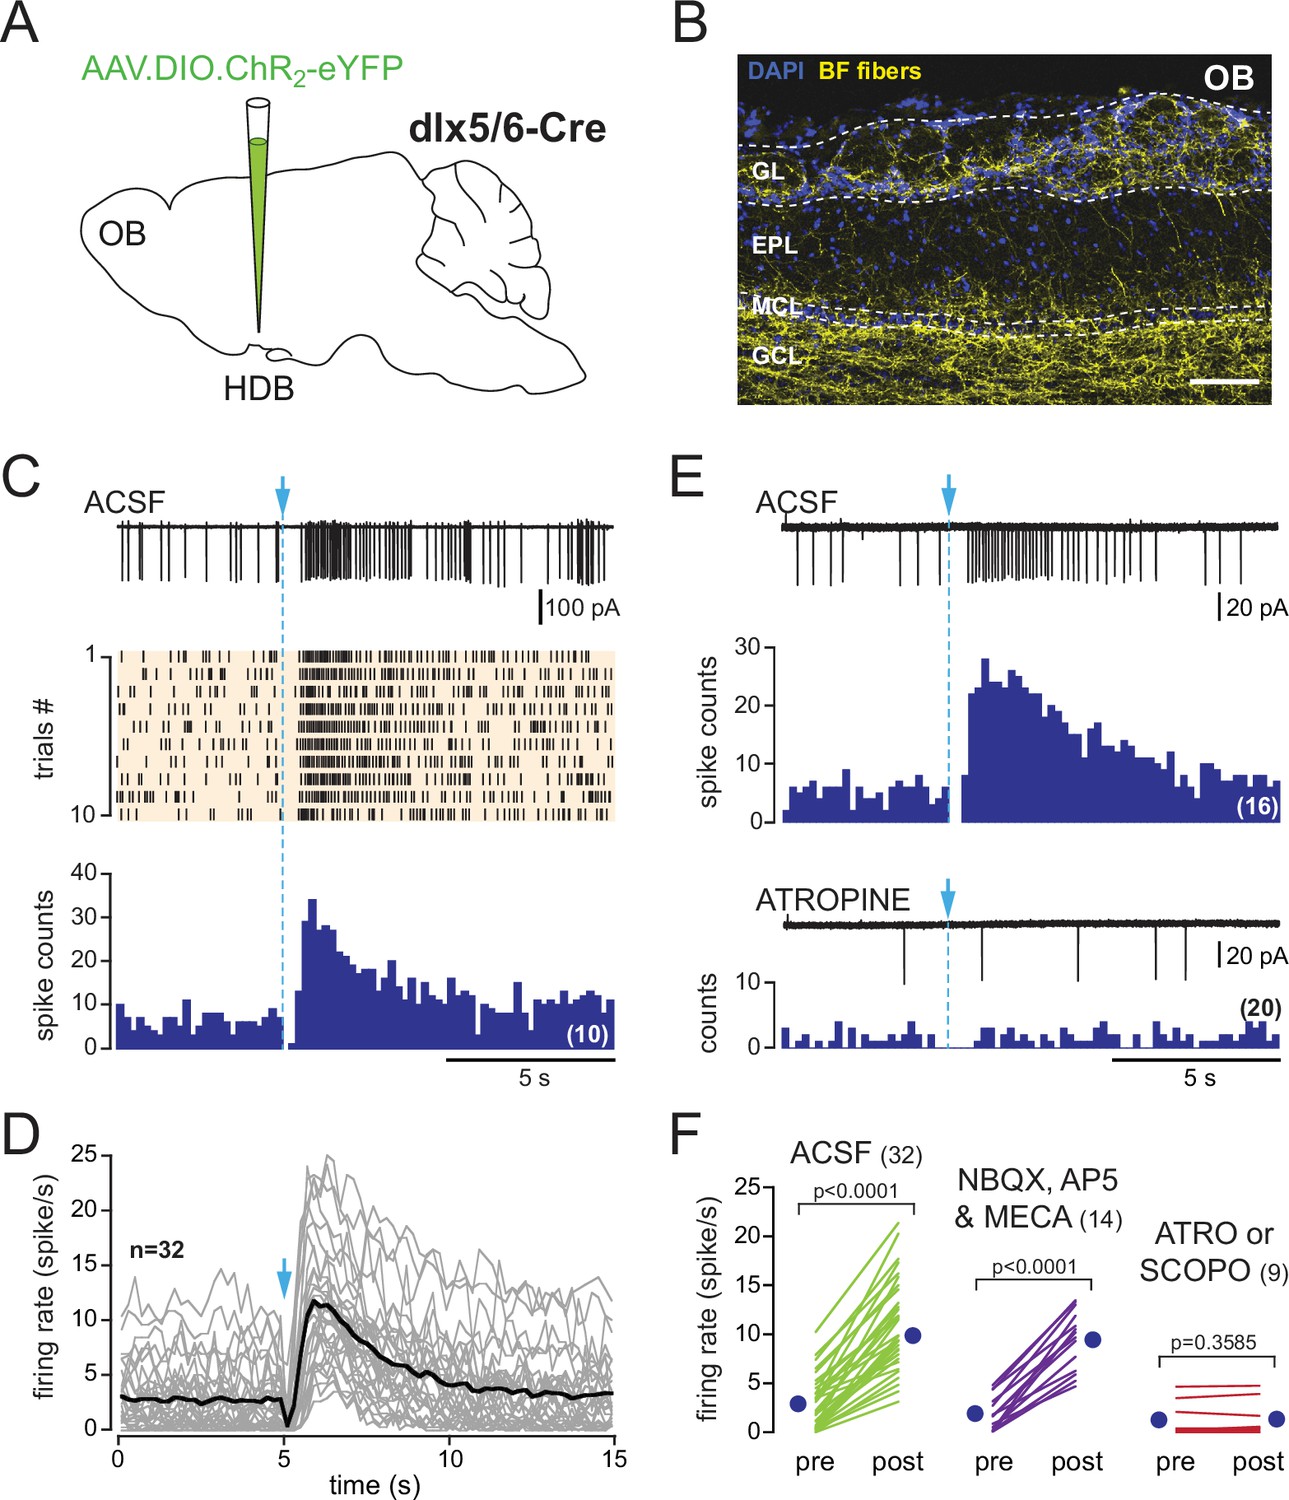
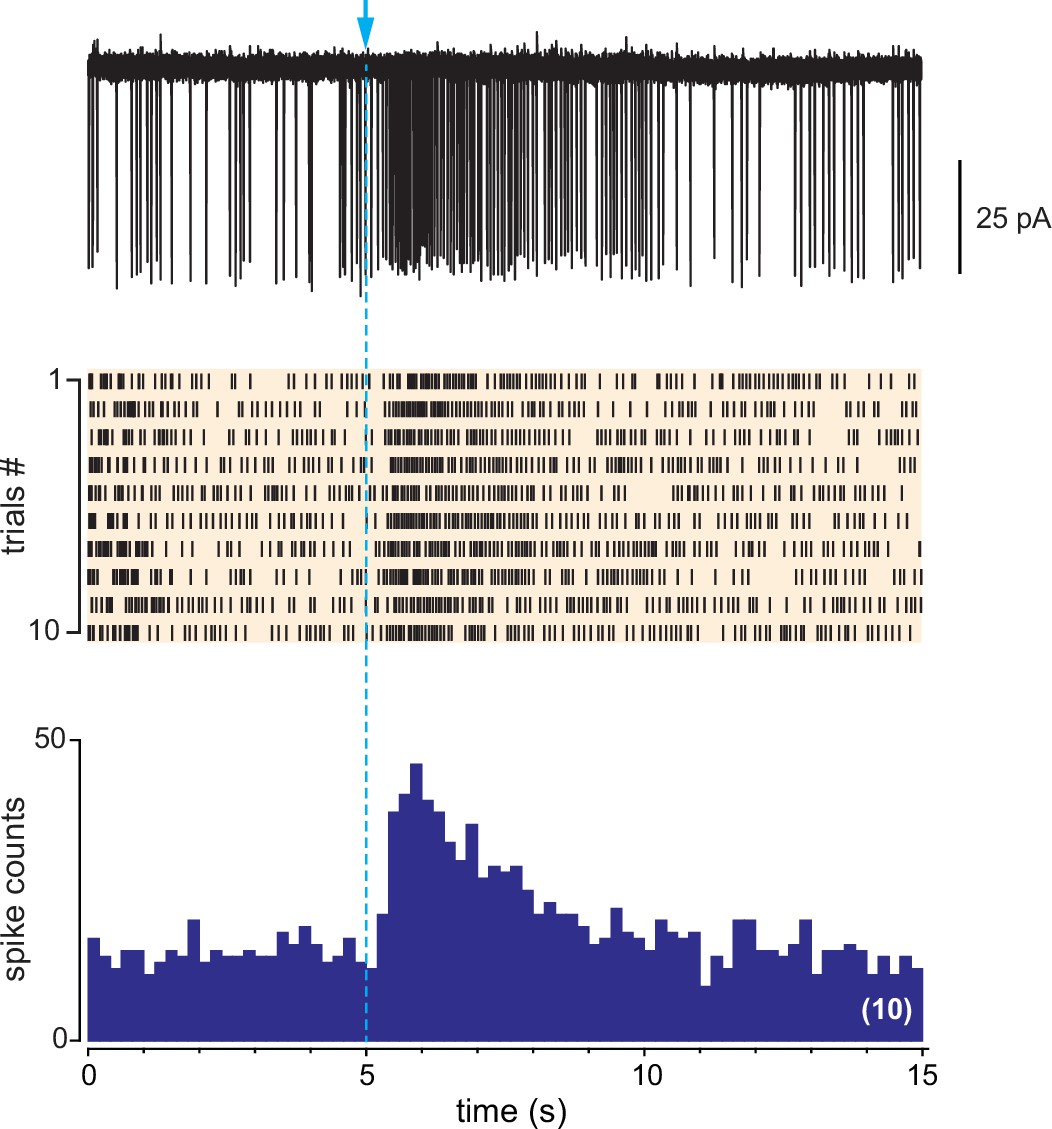
In dlx5/6 mice, a single photostimulation of basal forebrain (BF) axons evokes a biphasic inhibition-excitation response in periglomerular (PG) cells with a muscarinic excitation.
(A) Schematic of the virus injection in the horizontal limb of the diagonal band of Broca/magnocellular preoptic nucleus (HDB/MCPO) of dlx5/6Cre mice. (B) ChR2-eYFP expression in BF axons (yellow) in a sagittal section of the olfactory bulb (OB). DAPI staining (blue) delimits the different layers (GL: glomerular layer; EPL: external plexiform layer; MCL: mitral cell layer; GCL: granule cell layer). Scale bar 100 µm. Higher-resolution image in Figure 3—figure supplement 1. (C) Representative spiking response, raster plot, and cumulative peri stimulus time histogram (PSTH) (10 consecutive sweeps, 200 ms/bin) of a typical biphasic inhibition-excitation response evoked by a single photostimulation of BF fibers and recorded over 15 s in a PG cell from a dlx5/6 mouse. (D) Average spiking frequency per bin (200 ms) and per episode. Each gray line corresponds to a cell. The black line is the ensemble average. Photostimulation at blue arrow. Only one cell in the dataset responded with a long-lasting excitation that was not preceded by an inhibitory component (Figure 3—figure supplement 3). (E) The nonselective muscarinic ACh receptor (mAChR) antagonist atropine (10 µM) blocked BF-evoked excitation. (F) Firing rate before (pre) and after (post) photostimulation of BF axons in artificial cerebrospinal fluid (ACSF) (green) in the presence of 6-nitro-7-sulfamoylbenzo[f]quinoxaline-2,3-dione (NBQX), D-2-amino-5-phosphonopentanoic acid (D-AP5), and mecamylamine (violet) or in the presence of the muscarinic receptor antagonist atropine (n = 7) or scopolamine (n = 2) (red). Each line indicates a cell. Blue circles indicate means. Paired t-test.
Figure 3—figure supplement 1
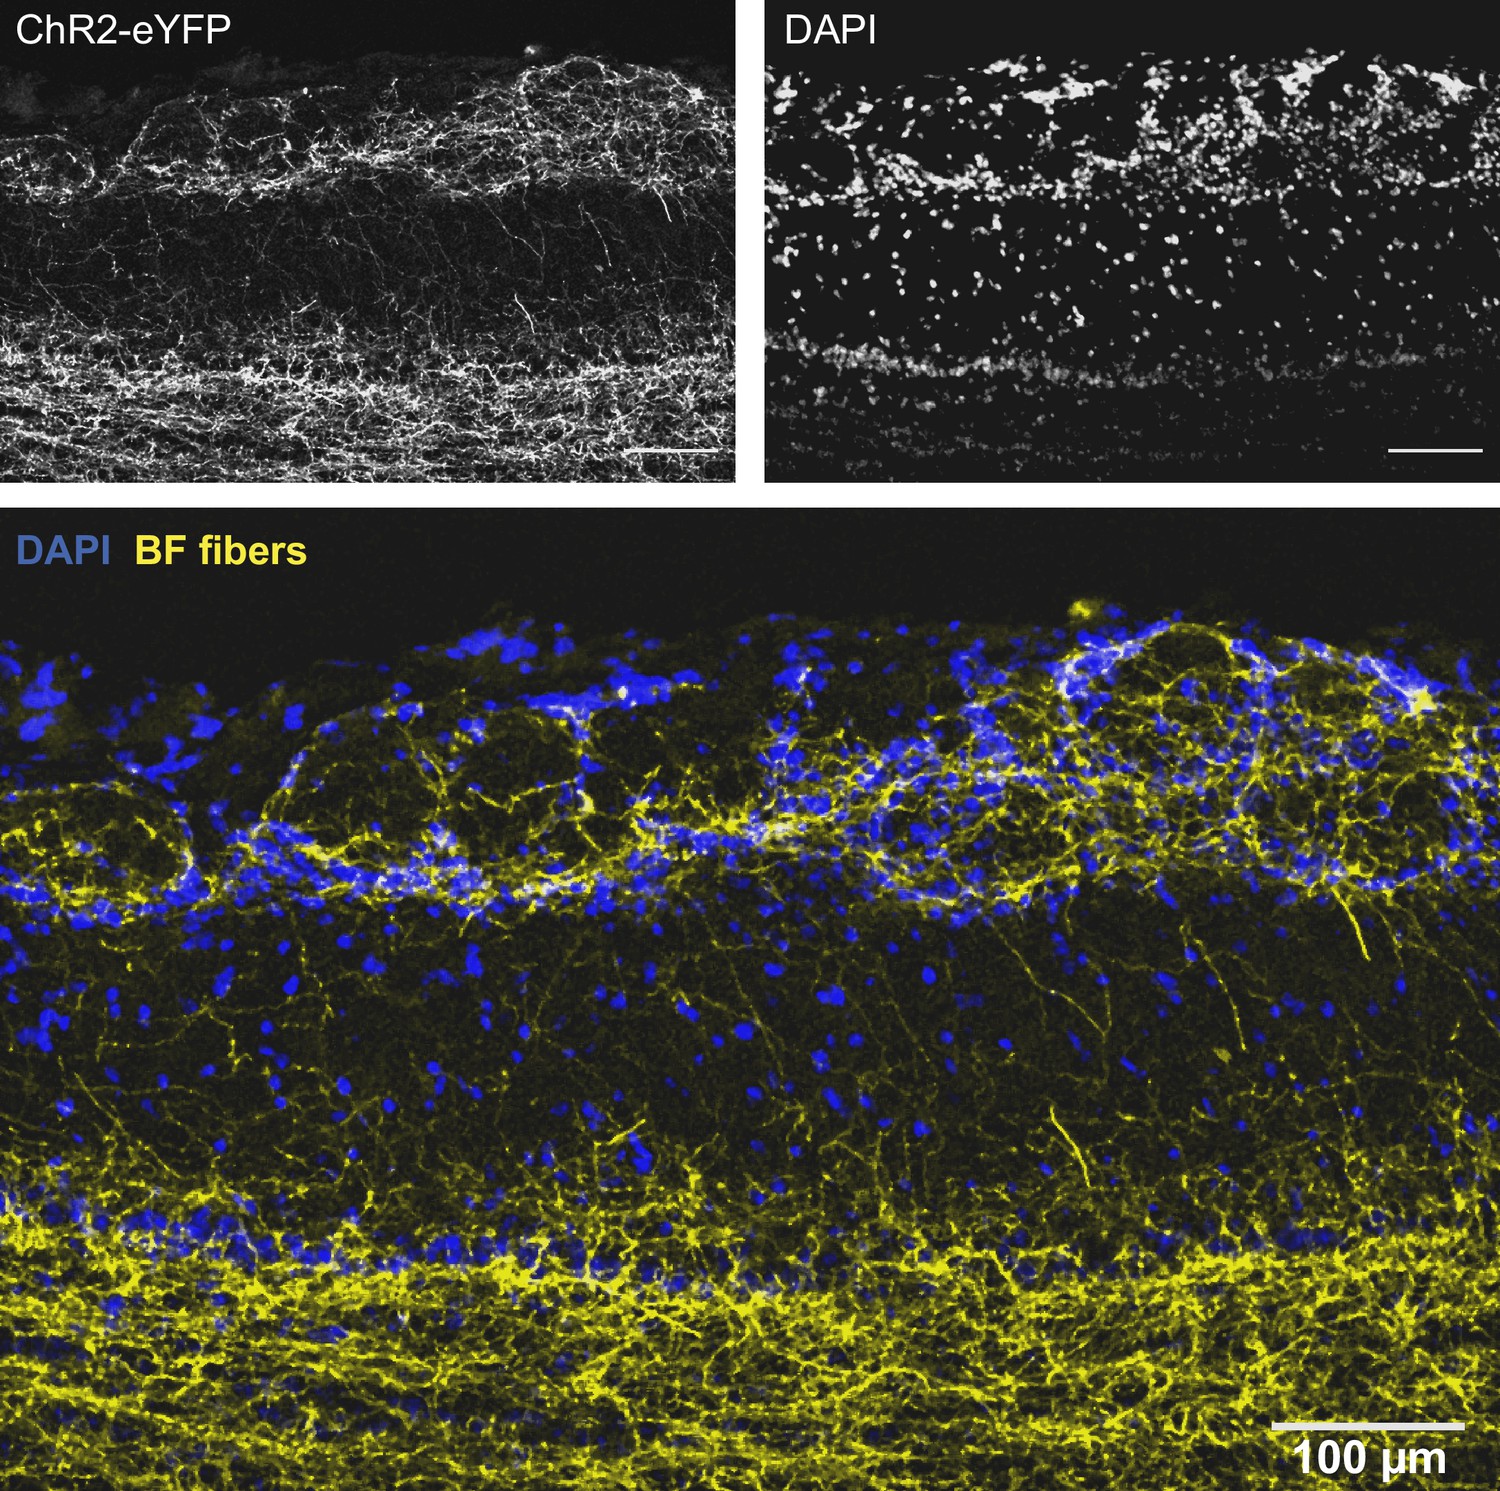
Higher-resolution image of Figure 3B showing the distribution in the olfactory bulb (OB) of a dlx5/6 mouse of eYFP-expressing axons from basal forebrain (BF) cholinergic and GABAergic neurons.
The two channels used to make this image are shown on top.
Figure 3—figure supplement 2
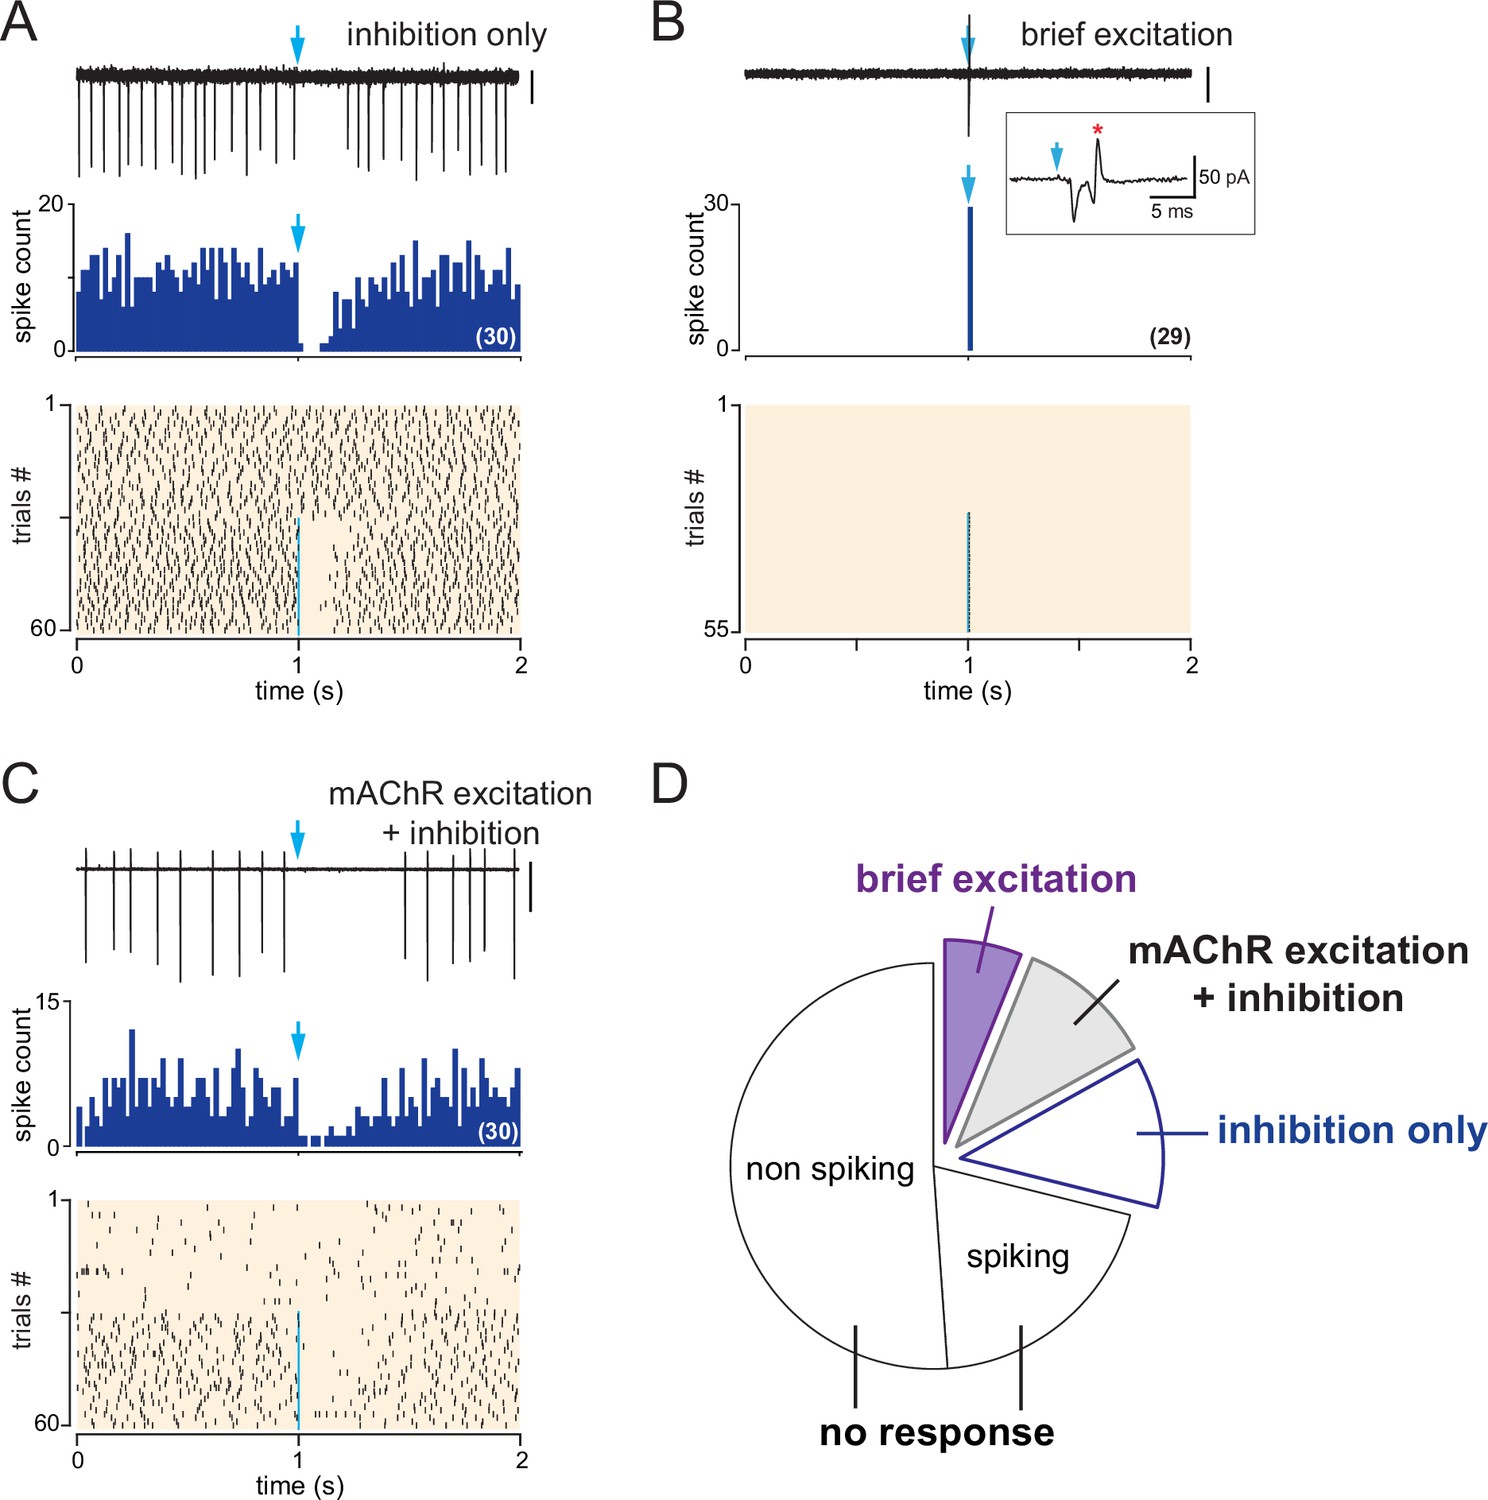
Basal forebrain (BF) inputs have various impacts on periglomerular (PG) cells activity in dlx5/6 mice.
(A) Example of an inhibitory response. In this cell, photostimulation of the BF fibers (blue arrow, 1 ms flash, 490 nm) transiently inhibited spiking. Top: a representative 2-s-long loose cell-attached (LCA) recording episode (scale bar 20 pA). Middle: cumulative peri stimulus time histogram (PSTH) (bin size 20 ms) in the same cell for 30 consecutive episodes with stimulation. Bottom: raster plot showing spiking activity in control condition (episodes 0–30) and while BF axons were photostimulated once per episode with a single flash (episodes 31–60, blue line). (B) Example of an excitatory response where BF fibers photostimulation (episode 27–55) induced an inward current and a spike (red star in the inset). Scale bar 30 pA. Corresponding PSTH and raster plot, same as in (A). (C) Example of a dual inhibition-excitation response where BF axons photostimulation inhibited spiking after the flash but also induced a muscarinic increase in baseline firing rate (see raster plot). Scale bar 200 pA. PSTH and raster plot, same as in (A) and (C). (D) Probability of occurrence of the various types of LCA responses induced on PG cells firing by a single optogenetic stimulation of the BF axons.
Figure 3—figure supplement 3
the unique example, in a dlx5/6 mouse, of a cell responding with a long-lasting excitation that was not accompanied by a transient inhibitory phase immediately after the flash.
Figure 4
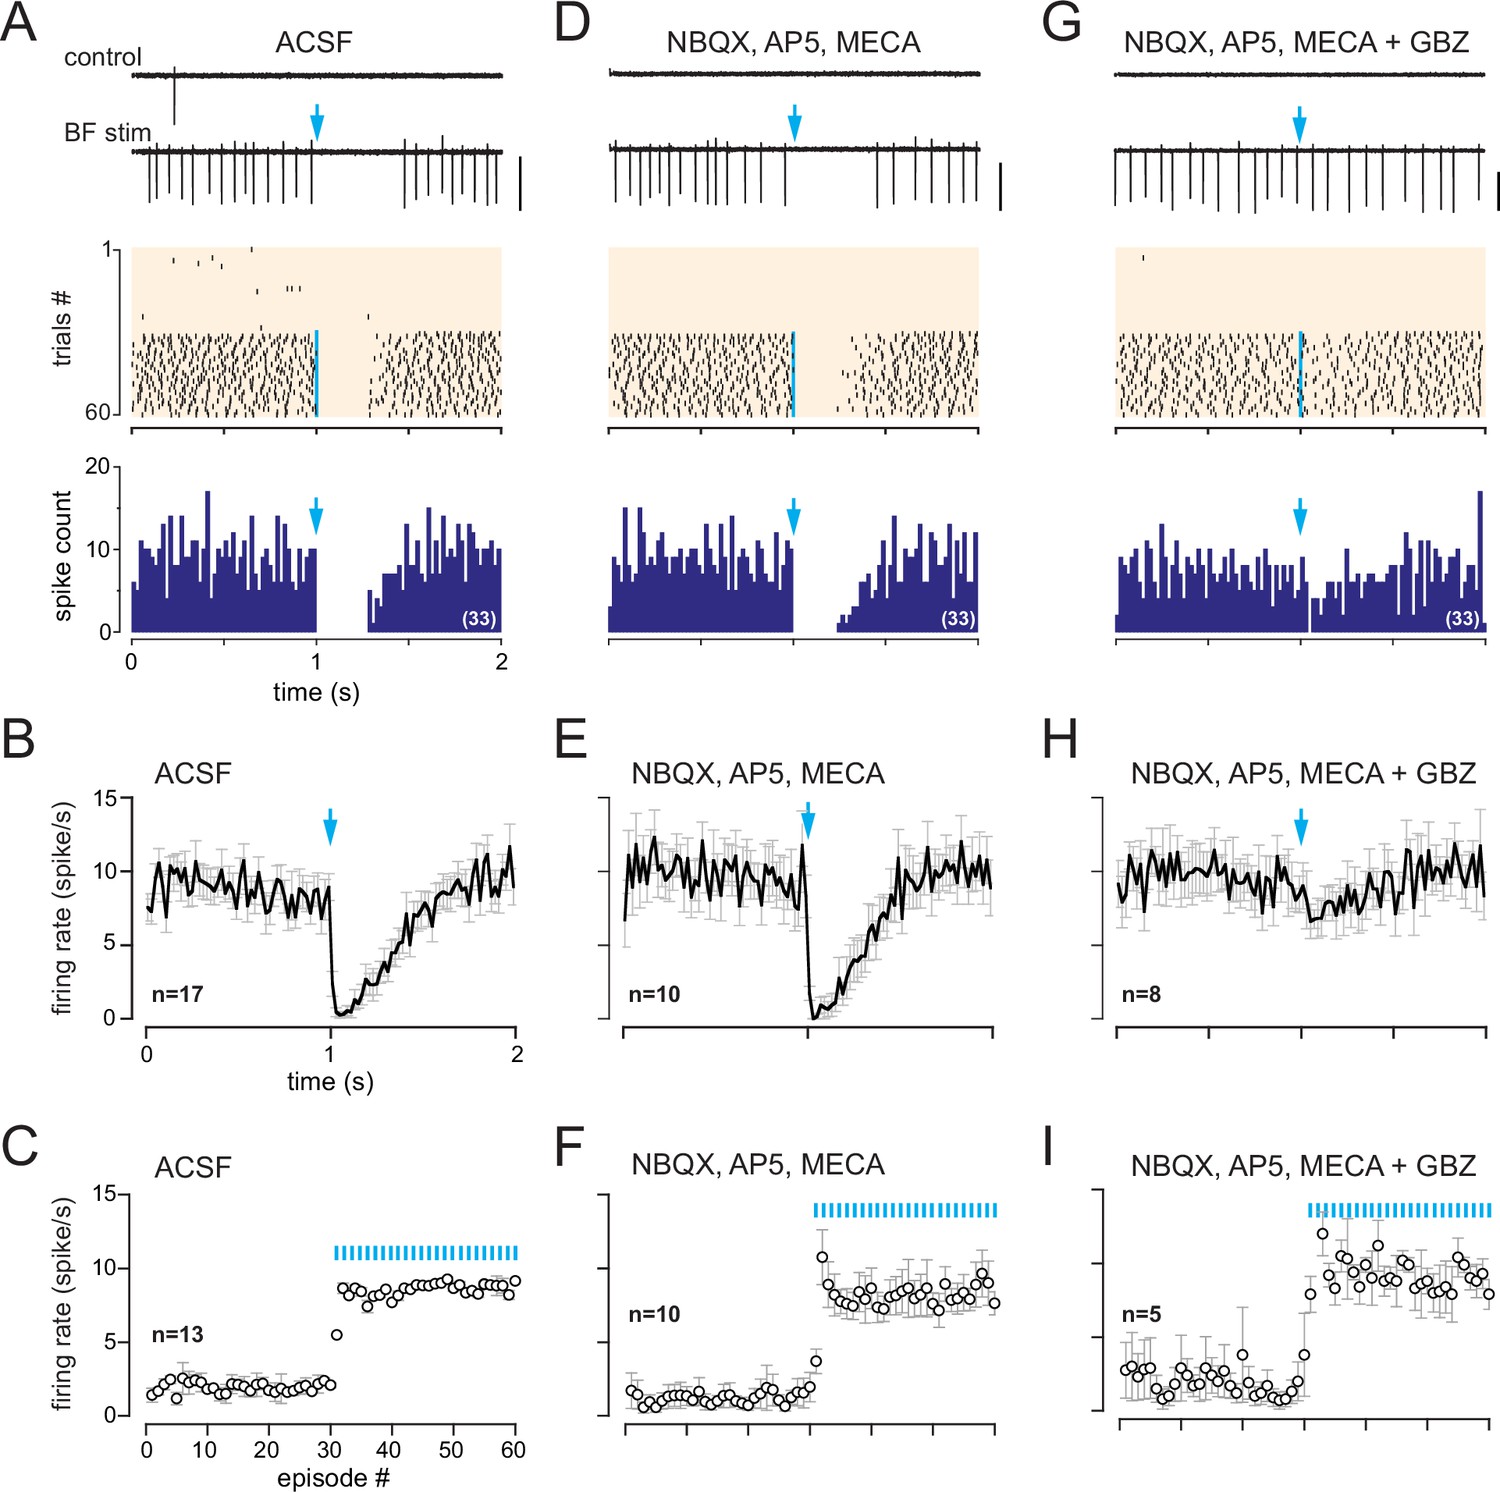
In dlx5/6 mice, a monosynaptic GABAergic input inhibits spiking in cells with a muscarinic response.
(A) Two representative traces (scale bar 100 pA) showing spiking activity in control condition and while basal forebrain (BF) axons were photostimulated with a single flash per episode every 2 s (blue arrow). Middle: corresponding raster plot. Photostimulations started at episode 31 (blue line). Bottom: cumulative peri stimulus time histogram (PSTH) (bin size 20 ms) in the same cell for the trials with a photostimulation (blue arrow). (B) Average firing rate per bin (20 ms) and per episode for 17 cells (± SEM, gray bars) while BF axons were photostimulated every 2 s with a single flash (at blue arrow). (C) Average firing frequency per episode (2 s each) for 13 cells recorded in artificial cerebrospinal fluid (ACSF) in control condition (no light, episodes 1–30) and during photostimulation of the BF afferents once per episode (31–60). (D–F) Same as in (A–C) in the presence of 6-nitro-7-sulfamoylbenzo[f]quinoxaline-2,3-dione (NBQX) (10 µM), D-2-amino-5-phosphonopentanoic acid (D-AP5) (50 µM),, and mecamylamine (MECA, 50 µM). Traces, raster plot, and PSTH in (D) are from the same cell as in (A). (G–I) Same as in (A–C) when gabazine (GBZ, 5 µM) was added to the cocktail of blockers. Traces, raster plot, and PSTH in (G) are from the same cell as in (A) and (D).
Figure 5
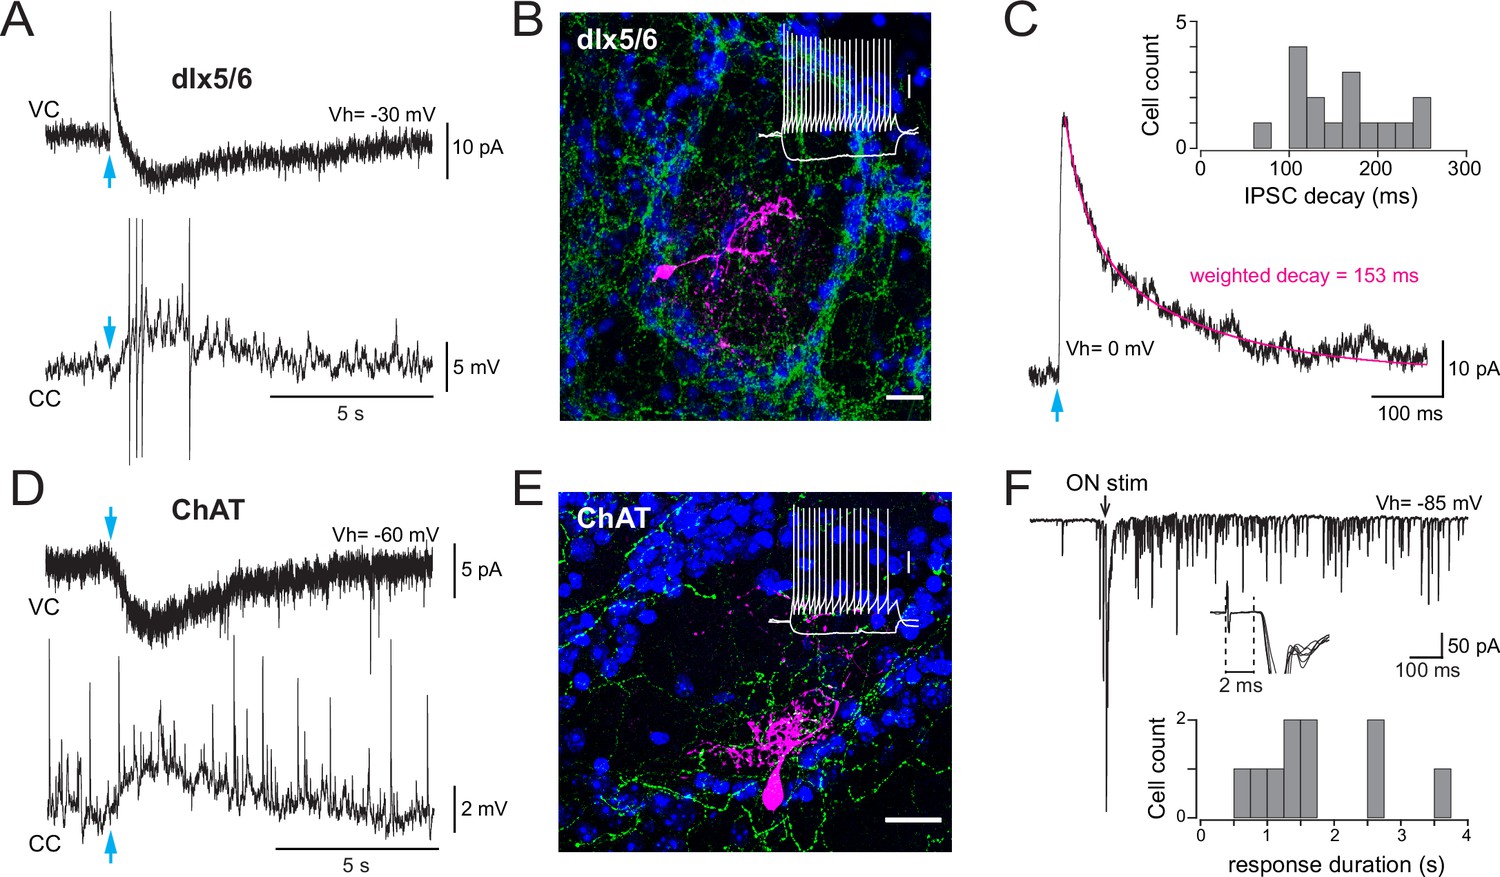
Basal forebrain (BF) cholinergic inputs produce a slow muscarinic EPSC in type 2.3 periglomerular (PG) cells.
(A) Biphasic GABAergic-muscarinic voltage-clamp (VC) and current-clamp (CC) whole-cell responses to a single photostimulation (blue arrow) of BF axons in a cell from a dlx5/6 mouse. Responses recorded in the presence of 6-nitro-7-sulfamoylbenzo[f]quinoxaline-2,3-dione (NBQX), D-2-amino-5-phosphonopentanoic acid (D-AP5), and mecamylamine. The current is an average of eight consecutive sweeps, the voltage response is a single trace eliciting four spikes (truncated for display). (B) Morphology of a biocytin-filled PG cell in which photostimulation of BF axons (eYFP-positive, green) produced a dual GABA-ACh response in a dlx5/6 mouse. DAPI staining (blue) shows the outline of the glomerulus. Scale bar 20 µm. Inset: voltage responses of this cell to depolarizing and hyperpolarizing current steps (20 pA, 500 ms). Scale bar 20 mV. (C) Photo-evoked GABAergic IPSC recorded in the same PG cell as in (A) at a holding potential of 0 mV. Average of 10 sweeps. The decay was best fitted with two exponentials (magenta) with a weighted decay time constant of 153 ms. Inset: distribution histogram of the decay time constants of photo-evoked GABAergic IPSCs in PG cells with a mixed GABA/ACh response in dlx5/6 mice. (D) Photo -evoked muscarinic EPSC (VC) and EPSP (CC) recorded in artificial cerebrospinal fluid (ACSF) in a PG cell from a choline acetyltransferase (ChAT) mouse. Average of six consecutive sweeps for the EPSC, single trace for the EPSP. (E) Morphology of a biocytin-filled cell that responded to the photostimulation of BF cholinergic axons with a muscarinic excitation in a ChAT mouse. Scale bar 20 µm. Blue: DAPI; green: eYFP-positive BF axons. Inset: membrane voltage responses of this cell to the injection of current steps (–20/+ 35 pA, 500 ms). Scale bar 20 mV. (F) Long-lasting barrage of EPSCs evoked by an electrical stimulation of the olfactory nerves (black arrow, 0.1 ms/100 µA) in the cell shown in (E). Inset: zoom on the earliest phase of the response (six consecutive traces, truncated for display). Responses had onset latencies > 2 ms. The distribution histogram shows the duration of the olfactory nerve (ON)-evoked response elicited in 10 cells receiving a muscarinic excitation (seven cells from dlx5/6 mice and three cells from ChAT mice).
Figure 6 with 1 supplement

M1 muscarinic ACh receptors (mAChRs) mediate basal forebrain (BF)-evoked excitation by closing M channels.
(A) Photo-evoked loose cell-attached (LCA) responses and cumulative peri stimulus time histograms (PSTHs) (over 22 consecutive sweeps, 200 ms/bin) recorded in a periglomerular (PG) cell from a dlx5/6 mouse in control condition (left) and in the presence of the M1 mAChR antagonist pirenzepine (2 µM). Scale bar for traces 50 pA. (B) Summary graphs. Firing rate before (pre) and after (post) photostimulation of BF fibers in control condition (left, paired t-test) and in the presence of pirenzepine (PIR, 1 or 2 µM, paired Wilcoxon signed-rank-sum test). Right graph shows that pirenzepine decreased BF-evoked excitation in every cell tested (paired t-test). Partial washout was obtained in five cells. Cells were recorded in choline acetyltransferase (ChAT) mice (n = 3, black lines) and dlx5/6 mice (n = 7, gray lines). (C) Photo-evoked LCA responses and cumulative PSTHs recorded in a PG cell from a dlx5/6 mouse showing the effects of the M-channel blocker XE-991 (10 µM) on spiking frequency. BF fibers were photostimulated with a single flash (blue arrow and dotted line). (D) XE-991 increased baseline spiking rate (blue line, measured during a 15 s time period preceding the flash) and decreased post-stimulus spike frequency (gray line). Average from 14 cells (eight in dlx5/6 mice, six in ChAT mice). Each episode was 30 s long. (E) Summary graph showing the two effects of XE-991 on each cell. Paired Wilcoxon signed-rank-sum tests. (F) Firing rate before (pre) and after (post) photostimulation of BF fibers in control condition (left, paired Wilcoxon signed-rank-sum test) and in the presence of XE-991 (t-test). Experiments were all done in the presence of 6-nitro-7-sulfamoylbenzo[f]quinoxaline-2,3-dione (NBQX) (10 µM), D-2-amino-5-phosphonopentanoic acid (D-AP5) (50 µM), and mecamylamine (50 µM). Means are the blue circles.
Figure 6—figure supplement 1
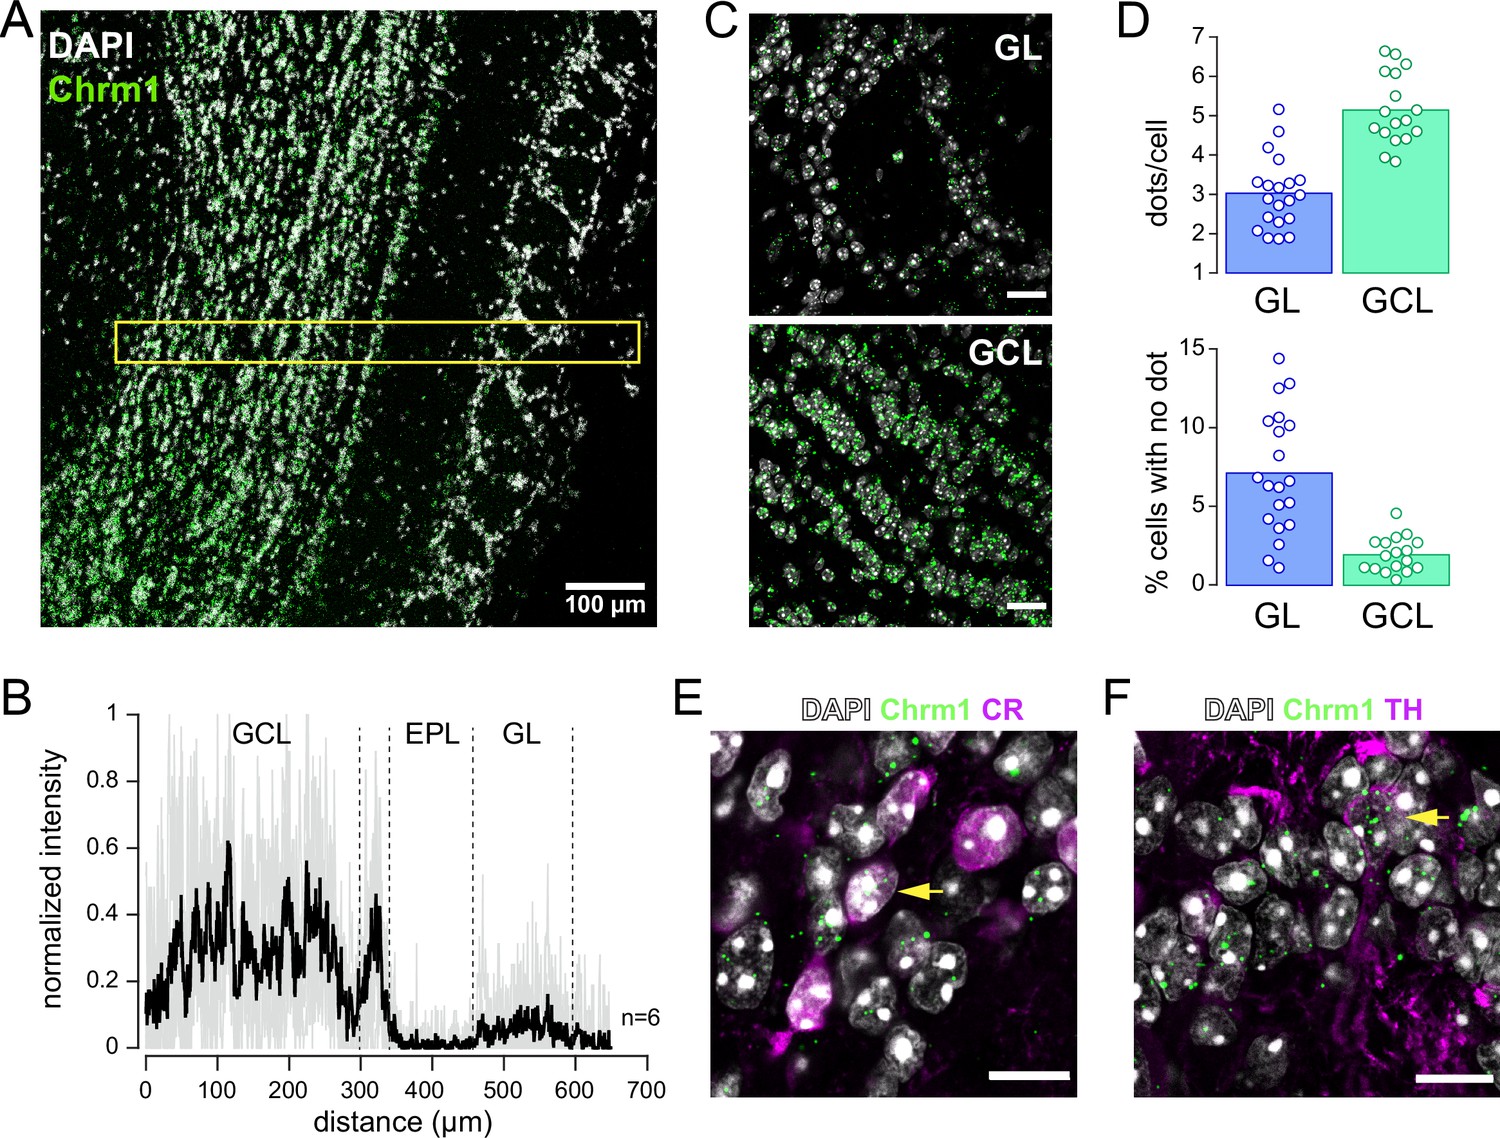
RNAscope imaging of Chrm1 mRNA expression in the olfactory bulb (OB).
(A) Widespread expression of Chrm1 mRNA in an OB section. Single mRNA molecules of Chrm1 appear as punctate green dots, DAPI staining in white. The yellow rectangle indicates the area where fluorescence was quantified in (B). (B) Normalized fluorescence intensity profile averaged across six OB sections of similar size. Quantification of fluorescence intensity was done within a 50 µm × 650 µm area centered on the mitral cell layer. The black trace is the average; the gray lines are the measures from each section. Dashed vertical lines show approximate borders of the granule cell layer (GCL), external plexiform layer (EPL), and glomerular layer (GL). (C) Zoom on one glomerulus in the GL (top) and on granule cells in the GCL (bottom). Images from the same section. Scale bars 20 µm. (D) Average number of dots per cell (top) and percentage of cells with no dot (bottom) in the GL and the GCL. Each point is from one OB section. Bars indicate the means. (E) Multiplexed fluorescence in situ hybridization (FISH) of the Chrm1 transcript (green dots) combined with the immunodetection of calretinin (CR) (magenta) in the GL. Arrow indicates CR-expressing cells containing >5 fluorescent dots. (F) Multiplexed FISH of the Chrm1 transcript (green dots) combined with the immunodetection of tyrosine hydroxylase (TH) (magenta) in the GL. Arrow indicates TH-expressing cells containing >5 fluorescent dots. Scale bars in (E) and (F) 10 µm.
Figure 7 with 1 supplement
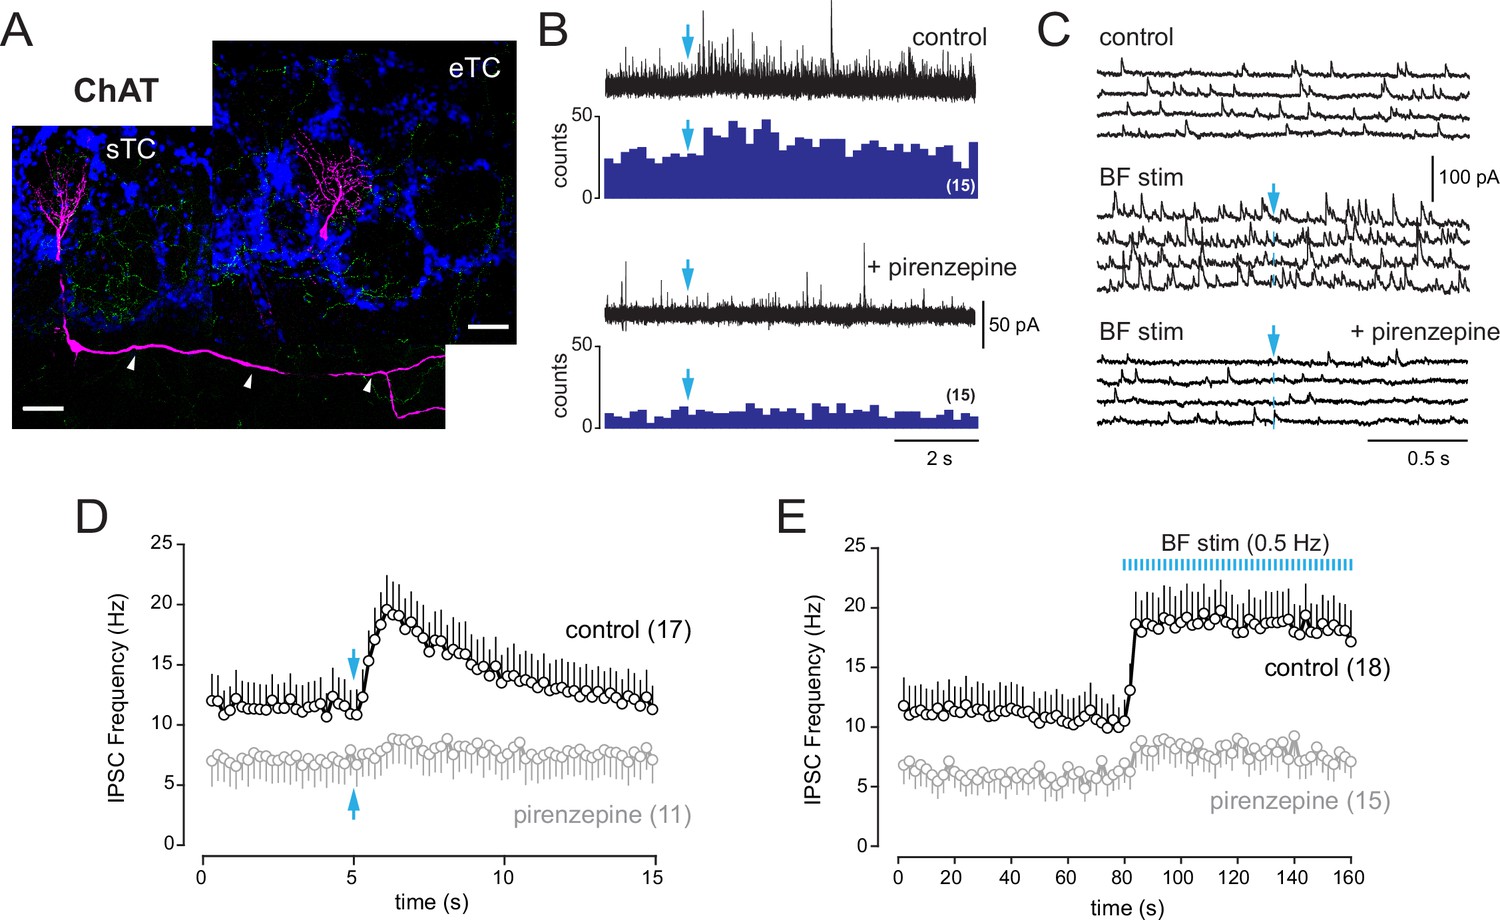
Basal forebrain (BF) muscarinic inputs lead to an increase of inhibitory synaptic inputs in tufted cells.
(A) Morphologies of two biocytin-filled tufted cells recorded in different slices from choline acetyltransferase (ChAT) mice. The localization of the soma and the presence or not of lateral dendrites in the external plexiform layer (arrowheads) distinguish a superficial tufted cell (sTC) (left) and an external tufted cell (eTC) (right). DAPI staining (blue) shows the outline of glomeruli. ChR2-eYFP-expressing cholinergic fibers are visible in green. Scale bars 50 µm. (B) Increase of inhibition evoked by a single photostimulation (blue arrow) of the cholinergic axons in an sTC (top). Pirenzepine (2 µM) blocked this response (bottom). Five traces are superimposed in each condition. Peri stimulus time histograms (PSTHs) show the cumulative number of IPSCs/bin (200 ms) across 15 consecutive trials. (C) Four consecutive traces of spontaneous IPSCs recorded in an eTC in control condition (top) and during low-frequency photostimulation of the cholinergic BF fibers (one flash every 2 s at blue arrow, middle). Pirenzepine (2 µM) blocked the increase of IPSC frequency evoked by the photostimulations (bottom). (D) Average IPSC frequency per 200 ms bin and per episode for 17 tufted cells (eight s/mTC and nine eTC). BF axons were photostimulated once (blue arrow). Pirenzepine was tested on 11/17 cells and reduced photo-evoked increase of IPSCs. (E) Average IPSC frequency per episode (2 s) for 18 cells (10 s/mTC and 8 eTC). Photostimulation of the cholinergic fibers at 0.5 Hz rapidly and persistently increased IPSC frequency. Pirenzepine was tested in 15/18 cells. Experiments were done in ChAT mice in the presence of 6-nitro-7-sulfamoylbenzo[f]quinoxaline-2,3-dione (NBQX), D-2-amino-5-phosphonopentanoic acid (D-AP5), and mecamylamine. Individual data points are shown in Figure 7—figure supplement 1.
Figure 7—figure supplement 1
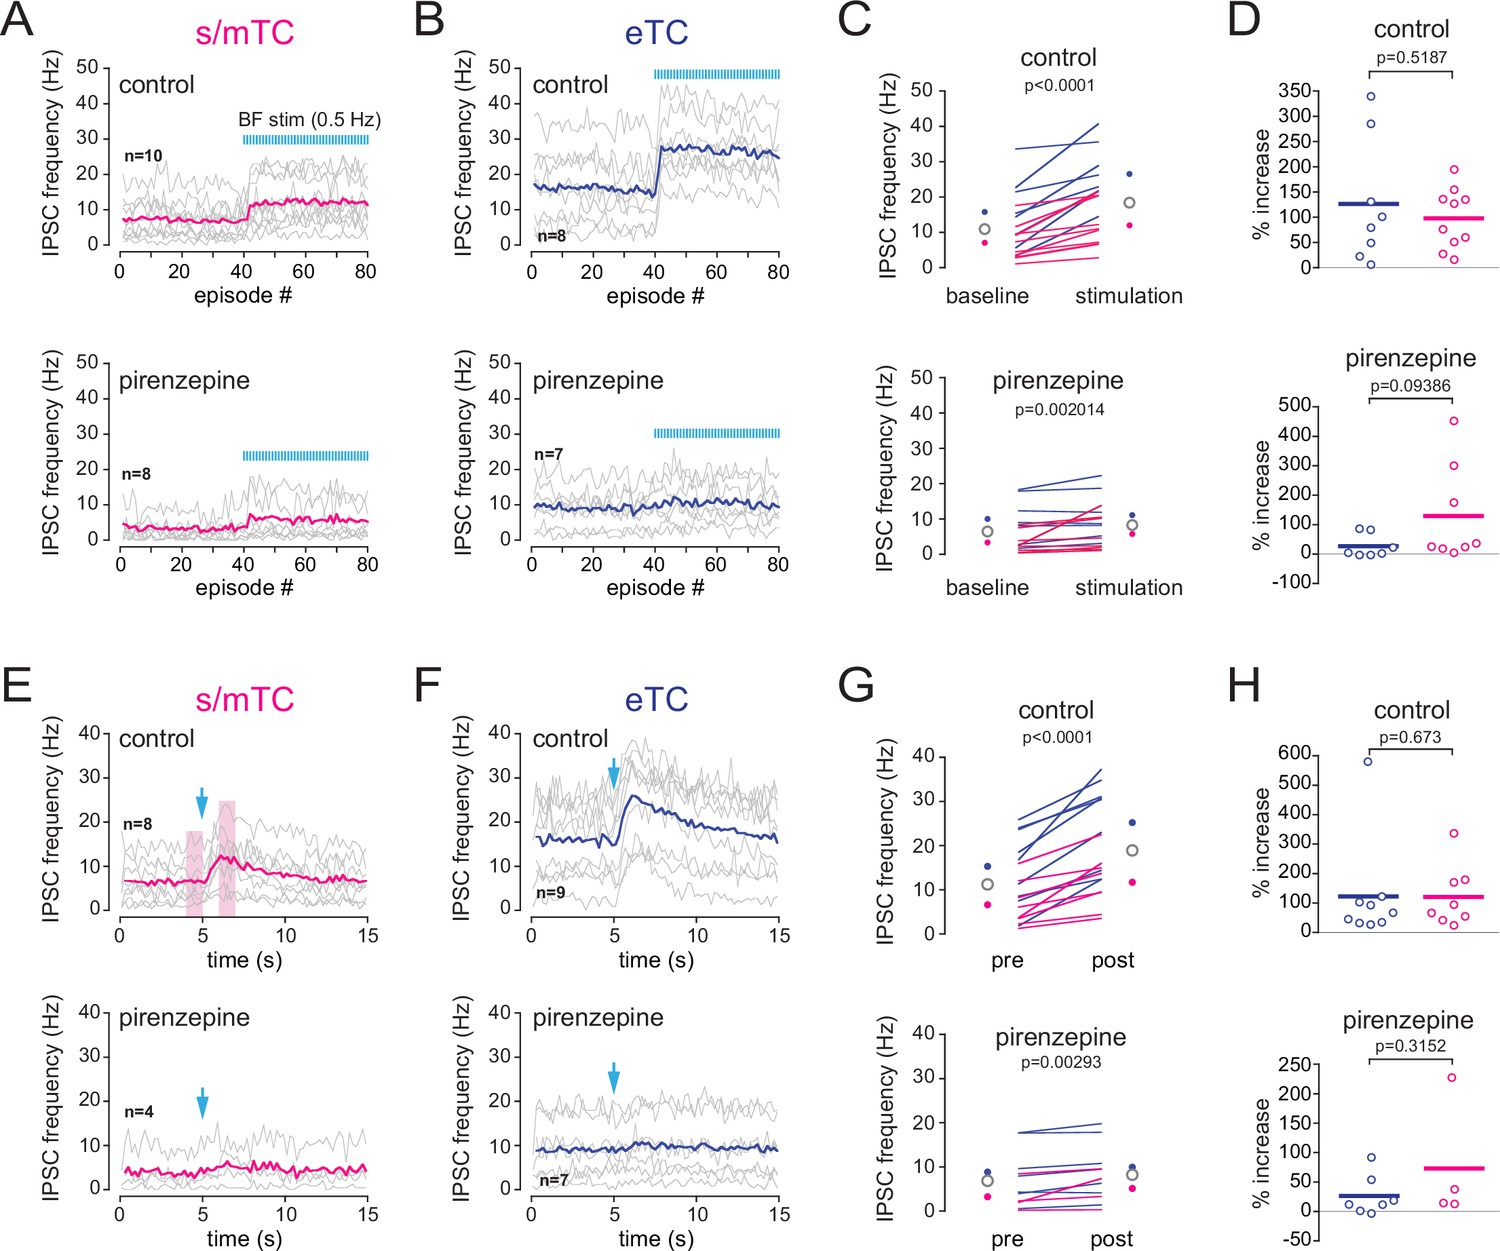
Comparison of basal forebrain (BF)-induced increase of IPSCs in external tufted cells (eTC) and superficial and middle tufted cells (s/mTC).
(A–D) Impact of a low-frequency (0.5 Hz) photostimulation of the BF cholinergic axons on IPSCs frequency in s/mTC and eTC in control condition (top) and in the presence of 2 µM pirenzepine (bottom). (A, B) Average IPSCs frequency per episode (2 s each). Photostimulation of BF axons (one flash/episode) starts at episode 41. Each line is a cell; colored lines are ensemble averages. (C) Average IPSCs frequency per cell when BF axons were not stimulated (baseline) and when BF cholinergic afferents were stimulated at 0.5 Hz (stimulation). Blue circles are the means for eTC, magenta circles are the means for s/mTC, and opened circles are the ensemble means. (D) Percent BF-induced increase of ISPCs frequency in eTC vs. in s/mTC. Horizontal lines are the averages. (E–G) Impact of a single photostimulation of the BF cholinergic axons on IPSCs frequency in s/mTC and eTC in control condition (top) and in the presence of pirenzepine (bottom). The boxed areas in (E) show the pre- and post-stimulus periods that were compared in (G) and (H). Data points were all collected in slices from choline acetyltransferase (ChAT) mice in the presence of 6-nitro-7-sulfamoylbenzo[f]quinoxaline-2,3-dione (NBQX), D-2-amino-5-phosphonopentanoic acid (D-AP5), and mecamylamine (control condition).
Figure 8 with 2 supplements

Type 2.2 periglomerular (PG) cells are inhibited by the basal forebrain (BF) GABAergic input.
(A) 10 superimposed loose cell-attached (LCA) traces and the corresponding peri stimulus time histogram (PSTH) for 44 consecutive trials (bin 20 ms) in a cell from a dlx5/6 mouse. Photostimulation of the BF fibers (blue arrow) transiently blocked spiking. Bottom: average firing frequency per bin (20 ms) and per episode for 28 cells that were inhibited by the BF input, without evidence of parallel cholinergic excitation (Figure 8—figure supplement 1). (B) BF-induced spiking inhibition persisted in the presence of 6-nitro-7-sulfamoylbenzo[f]quinoxaline-2,3-dione (NBQX), D-2-amino-5-phosphonopentanoic acid (D-AP5), and mecamylamine but was blocked by gabazine (GBZ). The two PSTHs are from the same cell as in (A) (bin 20 ms). Bottom: average firing rate per bin (20 ms) and per episode for seven cells in control conditions (gray line, six cells in the presence of blockers, one cell in artificial cerebrospinal fluid [ACSF]) and when GBZ (5 µM) was added (blue). (C) Duration of the post-stimulus spiking inhibition in cells with a BF-induced inhibitory response (blue) vs. in cells with a biphasic inhibition-muscarinic excitation response (gray). See also Figure 8—figure supplement 2 for caveats in these measurements. (D) Whole-cell characterization of a cell with an inhibitory response. Top: BF impact on firing (cell-attached recording, 38 episodes are superimposed) and BF-evoked IPSCs (whole-cell recording, 15 superimposed episodes). The histogram compares the decay time constants of photo-evoked GABAergic IPSCs in seven PG cells that were only inhibited (blue bars) vs. in cells with a mixed GABA/ACh response (gray bars). Bottom left: olfactory nerve (ON)-evoked EPSCs (left, four superimposed traces). Onset latencies > 2 ms (inset) are consistent with a plurisynaptic response. Bottom right: current-clamp voltage responses to current steps.
Figure 8—figure supplement 1
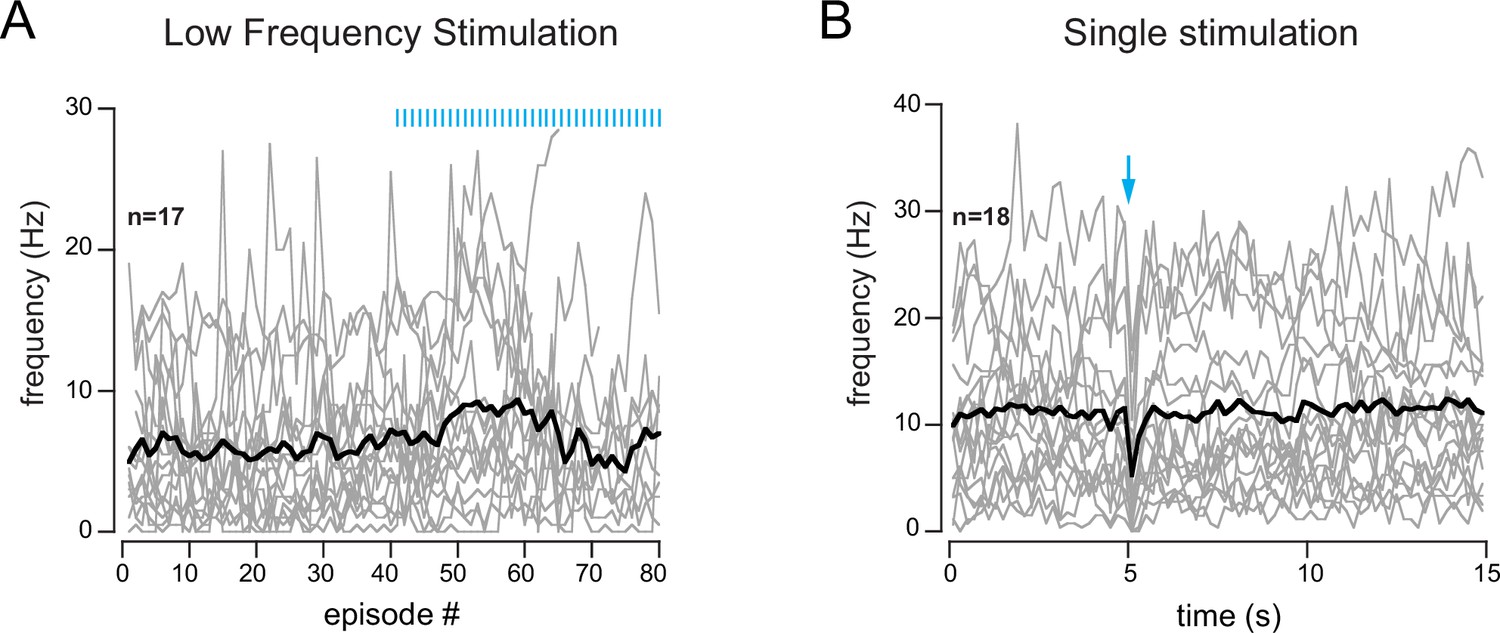
Absence of cholinergic excitation in periglomerular (PG) cells showing a transient inhibition of spiking.
(A) Low-frequency photostimulation of the basal forebrain (BF) axons (one flash per 2-s-long episode, starting at episode 41). (B) Single photostimulation (blue arrow). Each gray line is a cell, the black line is the ensemble average.
Figure 8—figure supplement 2
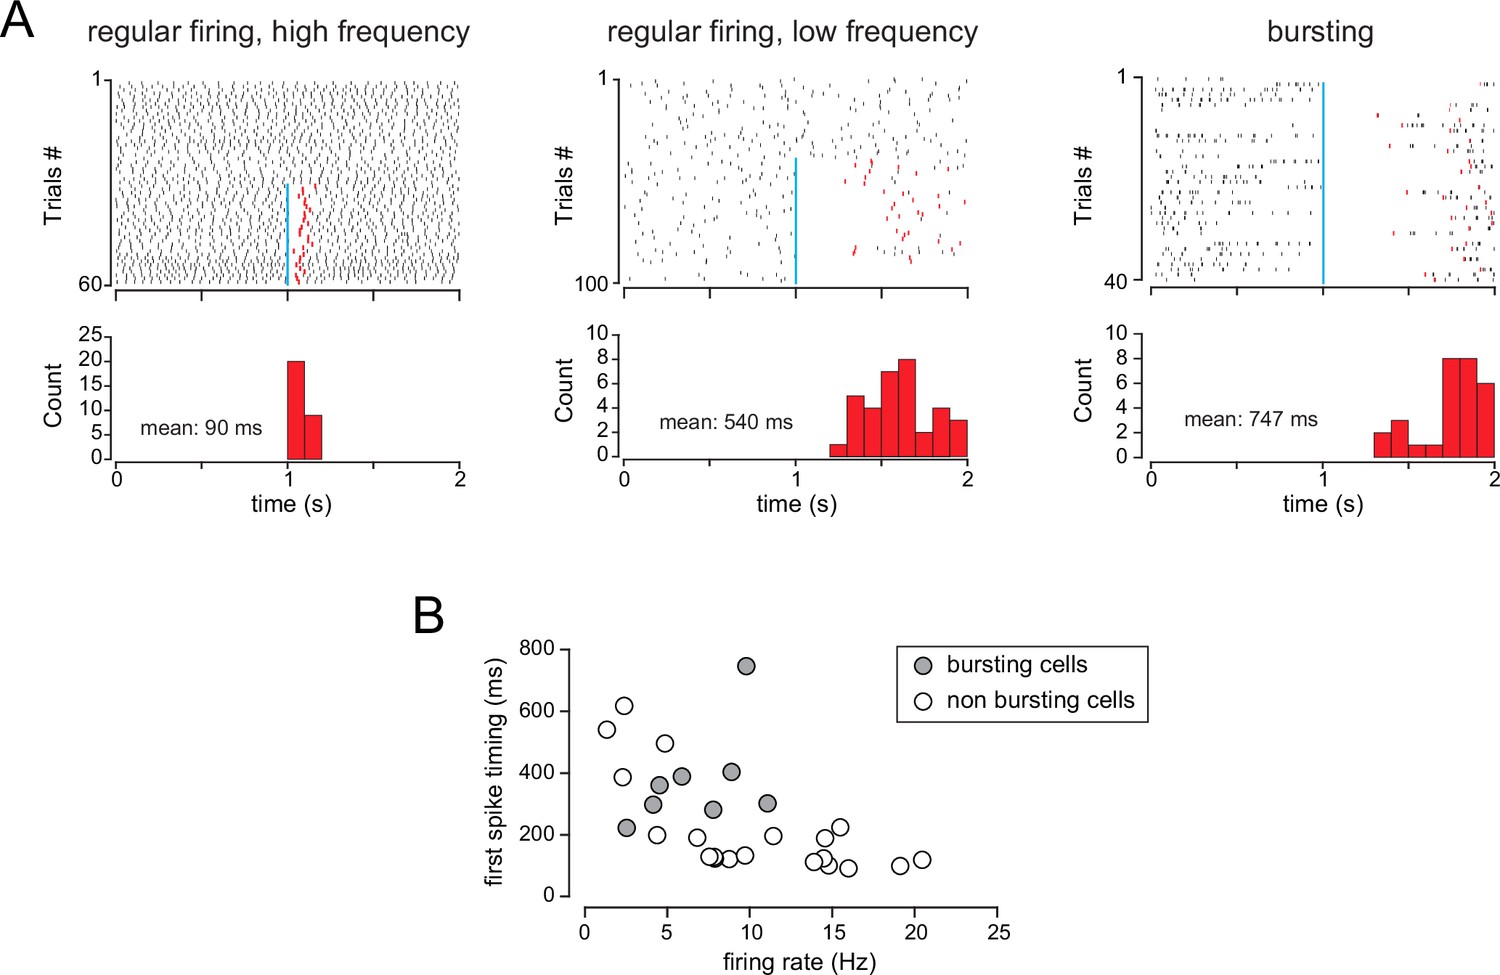
Caveats for the measurements of spiking inhibition duration.
(A) Raster plots from three example cells with various spiking activities that were inhibited by the basal forebrain (BF) input. The duration of the BF-induced inhibition was measured as the average time between the flash (blue bar) and the first spike after the flash (red tick). Histograms show the distribution of the first spike timing in each case and the calculated average duration. (B) Average first spike timing in all the cells used for Figure 8A as a function of their baseline firing frequency.
Figure 9
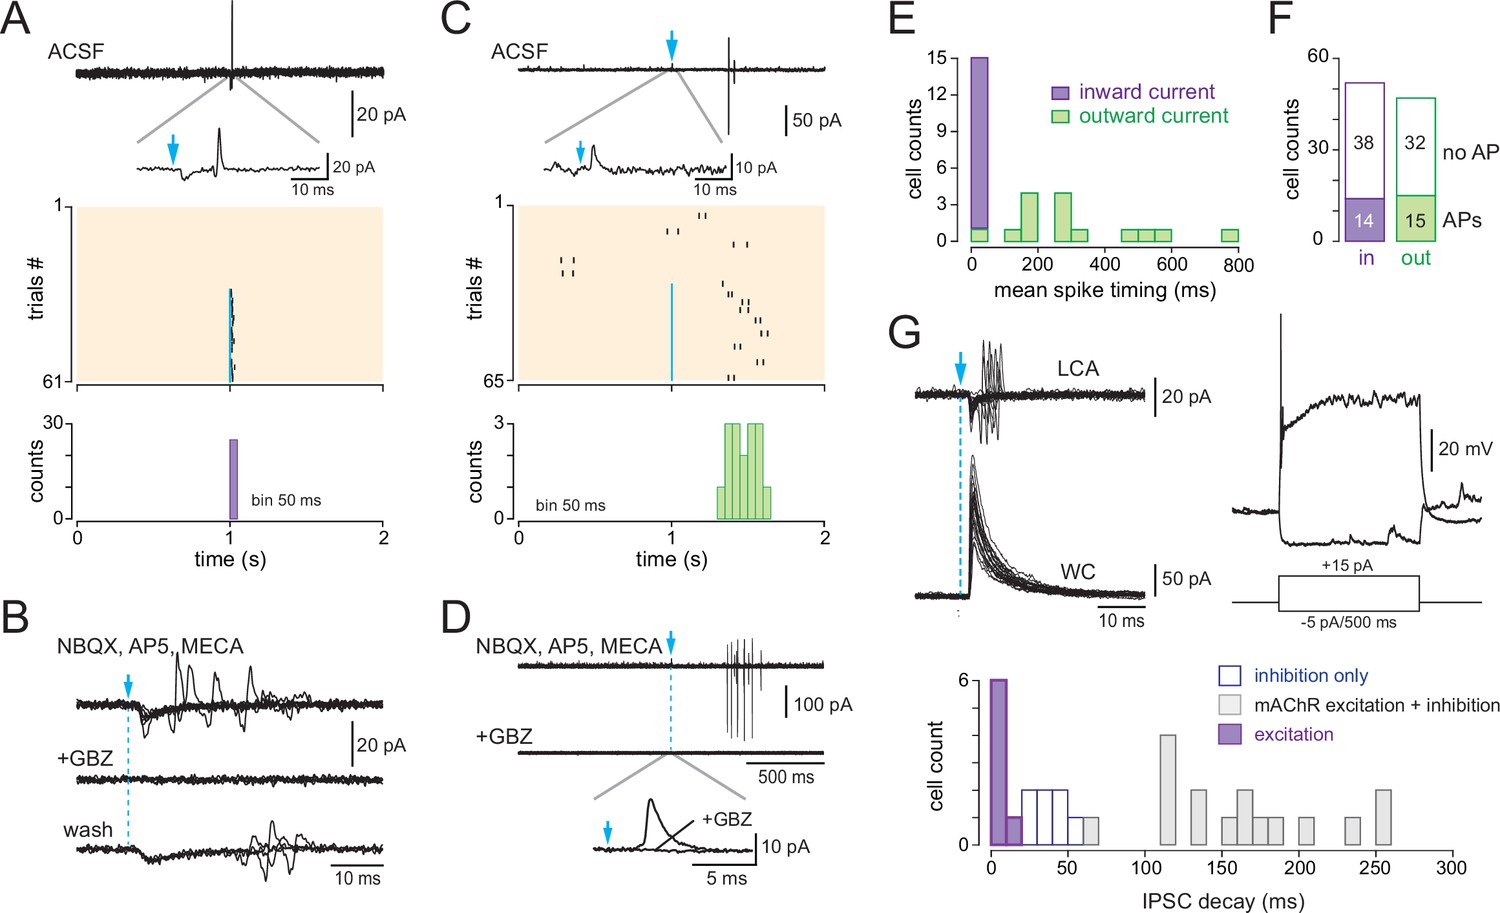
Basal forebrain (BF)-evoked GABAergic excitation in a fraction of type 2.1 periglomerular (PG) cells.
(A) Example of a BF-evoked excitatory response in a PG cell. One representative loose cell-attached (LCA) recording episode (duration 2 s) is shown on top. Photostimulation of the BF fibers (blue arrow) induced an inward current followed by a single spike (inset). Each tick is a spike in the raster plot of these cell responses (stimulation: episodes 31–61). Bottom: corresponding peri stimulus time histogram (PSTH). Note the temporal precision of the evoked spikes. Bin size 50 ms. (B) Same cell as in (A). The evoked inward current and the evoked spike both persisted in 6-nitro-7-sulfamoylbenzo[f]quinoxaline-2,3-dione (NBQX), D-2-amino-5-phosphonopentanoic acid (D-AP5), and mecamylamine but were blocked by gabazine. At least four traces are superimposed in each condition. (C) Another example of a PG cell responding to the photostimulation with action potentials. Photostimulation (blue arrow, episodes 31–65 in the raster plot) induced an outward current (inset) and, in some trials, a delayed doublet of spikes. Bottom: corresponding cumulative PSTH (bin size 50 ms). (D) Same cell as in (C). Gabazine blocked both the evoked outward current and the evoked spikes. (E) Distribution histogram of the average spike timing in each cell responding with spikes. Cells in which the stimulation evoked an inward capacitive current are in violet, and cells in which the stimulation evoked an outward current are in green. (F) Total number of cells responding with an inward (violet) or an outward (green) capacitive current followed or not with evoked spikes. (G) Whole-cell characterization of a cell excited by the BF input. Left: BF-evoked spike response (LCA recording, top, 20 consecutive episodes are superimposed) and BF-evoked IPSC (whole-cell recording, 20 consecutive responses). Right: current-clamp voltage responses to current steps in the same cell. The distribution histogram compares the decay time constants of photo-evoked GABAergic IPSCs in the seven PG cells that were excited (violet bars) vs. in type 2.2 cells with an inhibitory response (blue) and type 2.3 cells with a mixed GABA/ACh response (gray bars).
Author response image 1
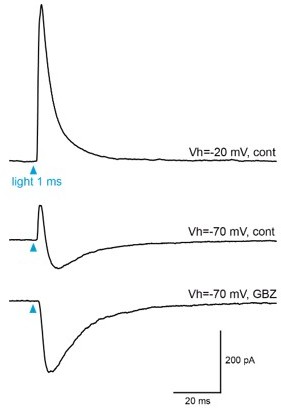
Light-evoked responses in BF-injected clx5/6 mice.
Example of light-evoked responses recorded at two potentials in a dSA cell. At Vh=-20 mV, the response was dominated by an outward IPSC (top trace). At Vh=-70 mV, the outward current is reduced and followed by an outward component (middle). The outward component was totally blocked by GBZ (bottom). The EPSC that persisted in the presence of GBZ is mostly likely mediated by nicotinic receptors (See Case et el, 2017).
Additional files
Download links
A two-part list of links to download the article, or parts of the article, in various formats.
Downloads (link to download the article as PDF)
Open citations (links to open the citations from this article in various online reference manager services)
Cite this article (links to download the citations from this article in formats compatible with various reference manager tools)
Target-specific control of olfactory bulb periglomerular cells by GABAergic and cholinergic basal forebrain inputs
eLife 11:e71965.
https://doi.org/10.7554/eLife.71965


