The evolution of division of labour in structured and unstructured groups
- St John's College, United Kingdom
- Department of Zoology, University of Oxford, United Kingdom
- Mathematical Institute, University of Oxford, United Kingdom
Figures
Figure 1
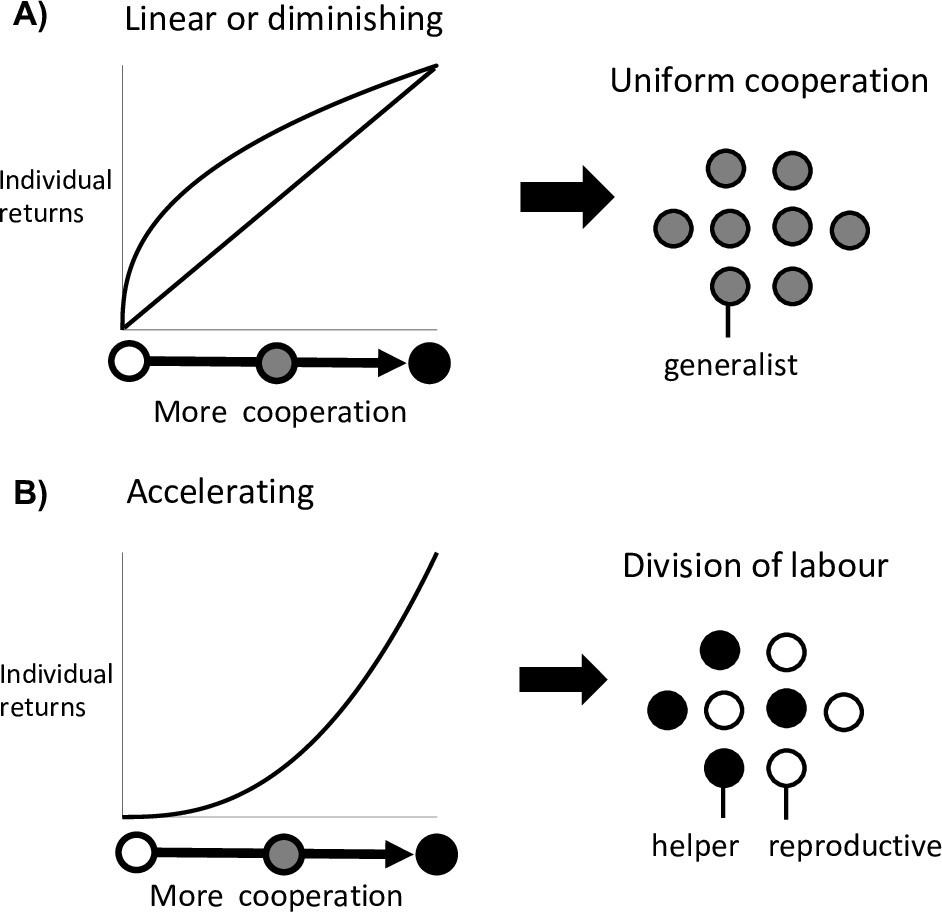
Division of labour is favoured by accelerating returns from individual specialisation.
(A) Theory has shown that either a linear or diminishing return from more cooperation (or reproduction) favours uniform cooperation, with all individuals investing the same amount of effort into cooperation and reproduction (i.e. no division of labour) (Cooper and West, 2018; Michod, 2006; Schiessl et al., 2019). (B) In contrast, an accelerating return from more cooperation (or reproduction) favours reproductive division of labour, with some individuals specialising in high levels of cooperation (helpers) and others in low levels of cooperation (reproductives) (Cooper and West, 2018; Michod, 2006; Schiessl et al., 2019).
Figure 2
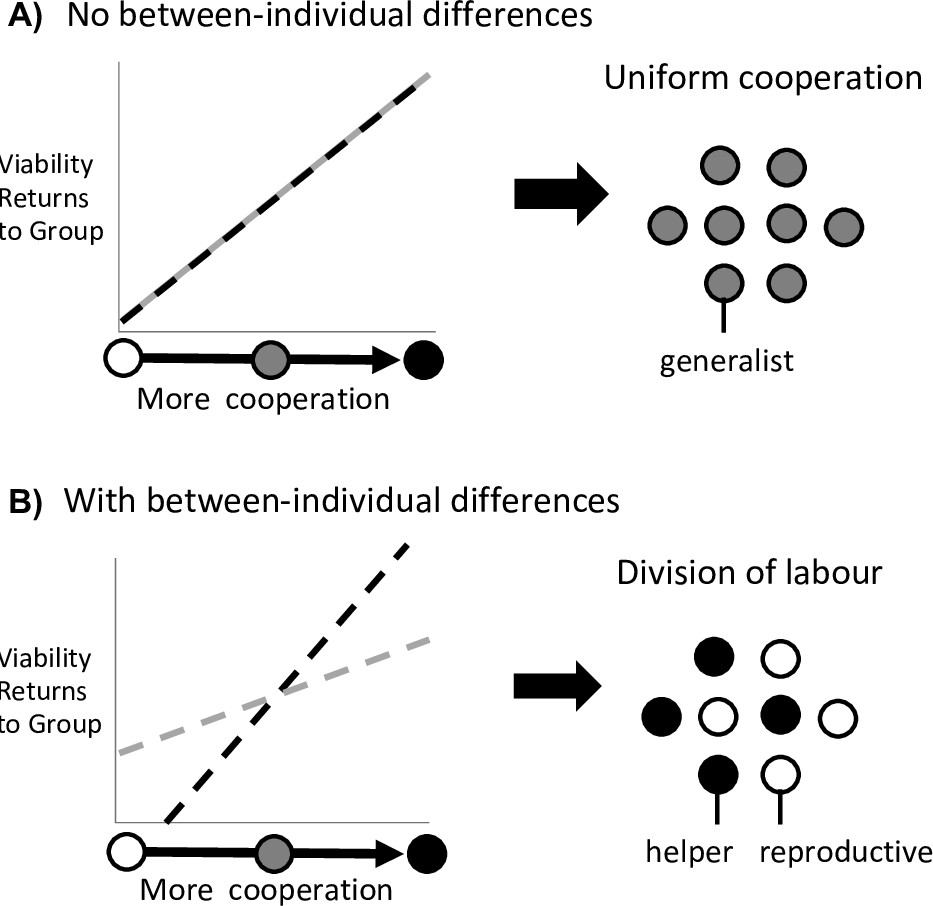
Division of labour is favoured by between-individual differences.
Division of labour is favoured if some individuals are predisposed to being reproductives or helpers. (A) In the absence of another mechanism, if there are no differences between individuals (black and grey lines), then division of labour is not favoured. (B) If some individuals can produce larger viability benefits than others (black line), or if some individuals can access greater fecundity benefits than others (grey line), then this predisposition favours division of labour.
Figure 3
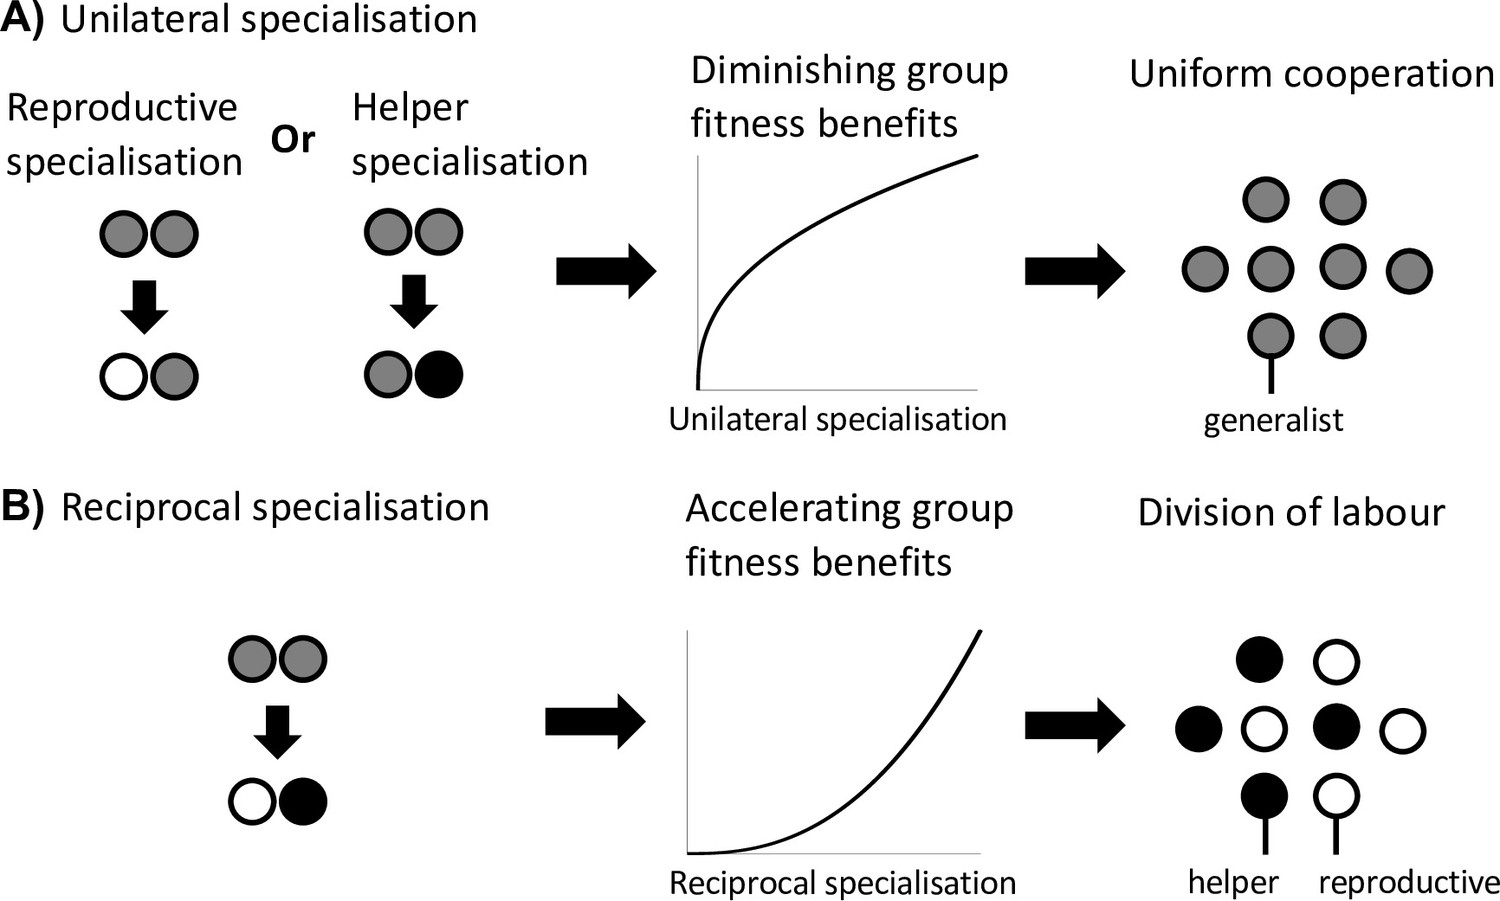
Division of labour is favoured by reciprocal specialisation.
We assume that there are diminishing returns from specialisation in either viability or fecundity (Figure 1A). (A) In this case, a unilateral increase in cooperation by helpers or a unilateral decrease in cooperation by reproductives leads to a diminishing fitness benefits to the group, which favours uniform cooperation (no division of labour). (B) In contrast, a reciprocal increase in cooperation by helpers (more viability benefits provided by helpers) and a decrease in cooperation by reproductives (larger reproductive fecundity) can produce an accelerating return to the fitness of the group if the benefits of increased cooperation are preferentially directed to reproductives. Thus, reciprocal specialisation can still favour division of labour, even though the returns from individual specialisation are diminishing. In the middle plots of (A) and (B), only the shape of the benefits from increased specialisation is plotted.
Figure 4
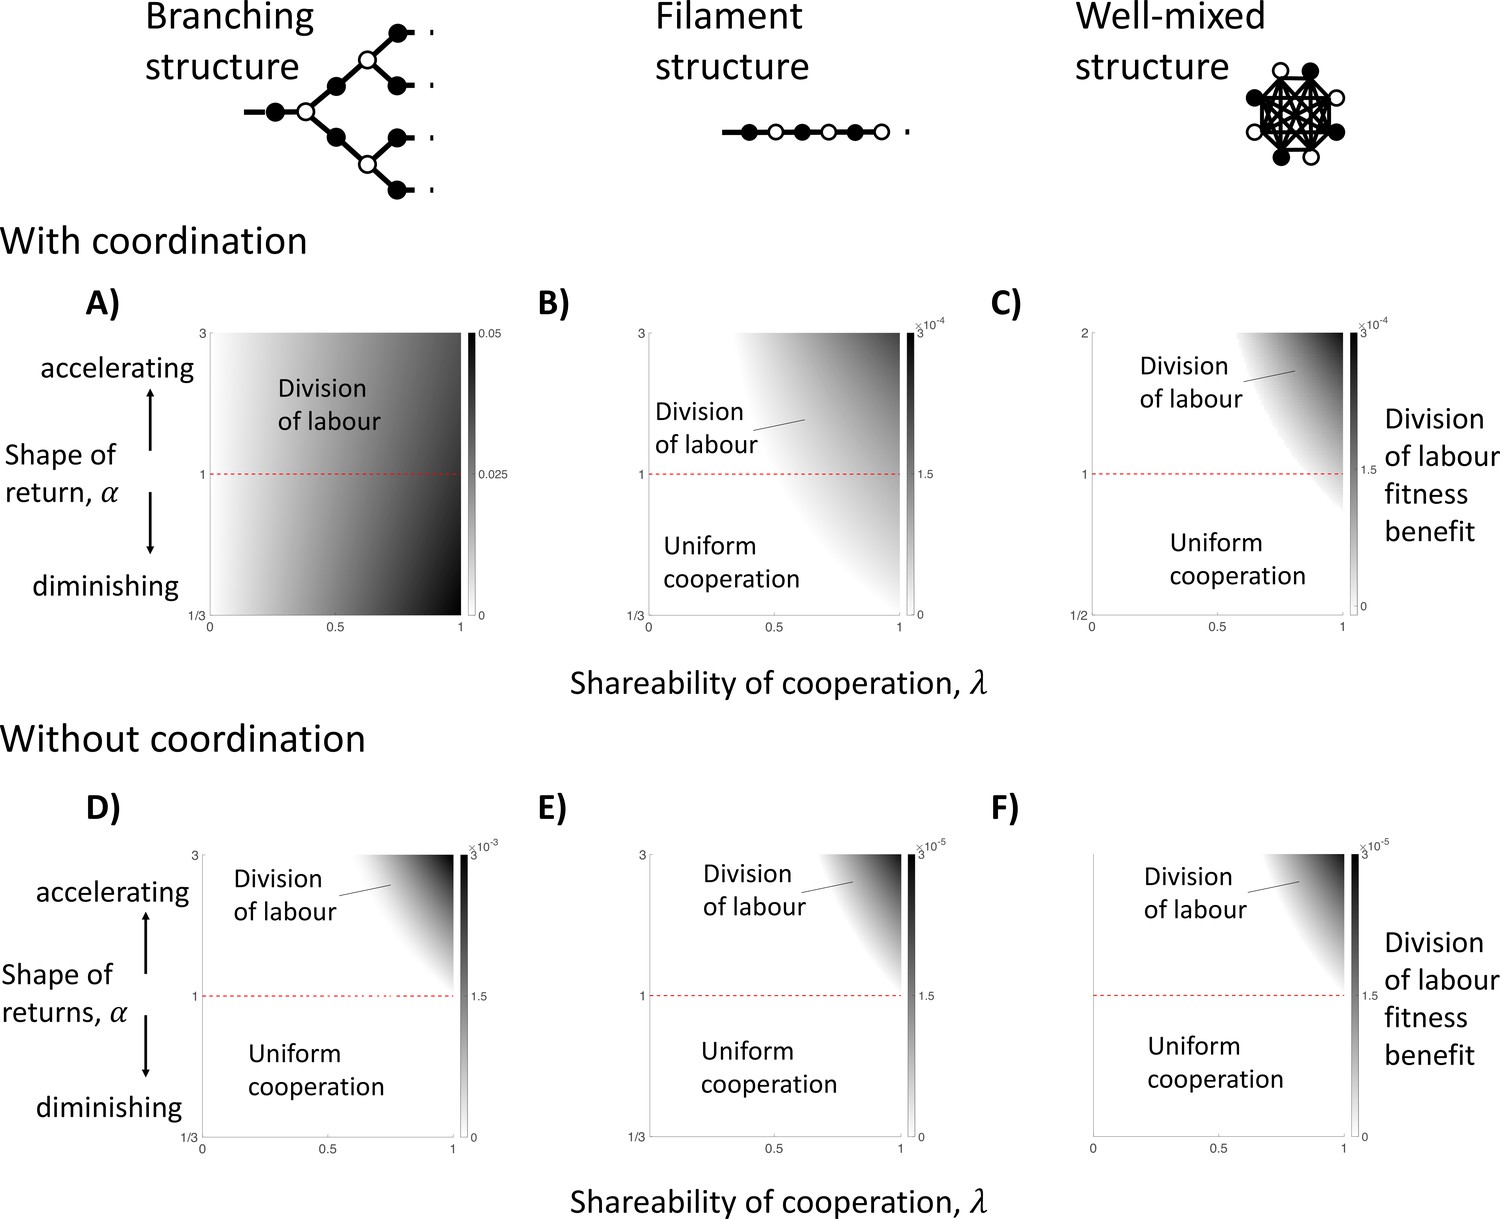
The impact of topological constraints on the division of labour.
We show here different scenarios in which division of labour can evolve (non-white shades) and the size of its fitness benefit if so (darker shades). We consider three specific spatial models, including: a branching structure (A and D); a filament structure (B and E); and a well-mixed group (C and F). We consider when cells know their location in the group when specialising (with coordination; A–C) and when they do not (without coordination; D–F), in which case cells specialise randomly. (A) In a branching group structure with coordination, division of labour with diminishing returns from specialisation () can be favoured by between-individual differences whenever the benefits of cooperation are shared (). (B) In a filament structure with coordination, division of labour with diminishing returns from specialisation () can be favoured by reciprocal specialisation when cells share a sufficient majority of the public good they produce with neighbours (e.g. when linear returns: ). (C) In a well-mixed group with coordination, division of labour with diminishing returns from specialisation () can be favoured by reciprocal specialisation if cells share an even larger proportion of the public good they produce with neighbours (e.g. when linear returns: ). (D–F) When cells specialise randomly (no coordination) across all three spatial models, then division of labour can only evolve if there is an accelerating return from specialisation (). Throughout, we have assumed a linear return from fecundity specialisation, , and allow for a non-linear return from investment in cooperation, , where controls the shape of the return.
Figure 5
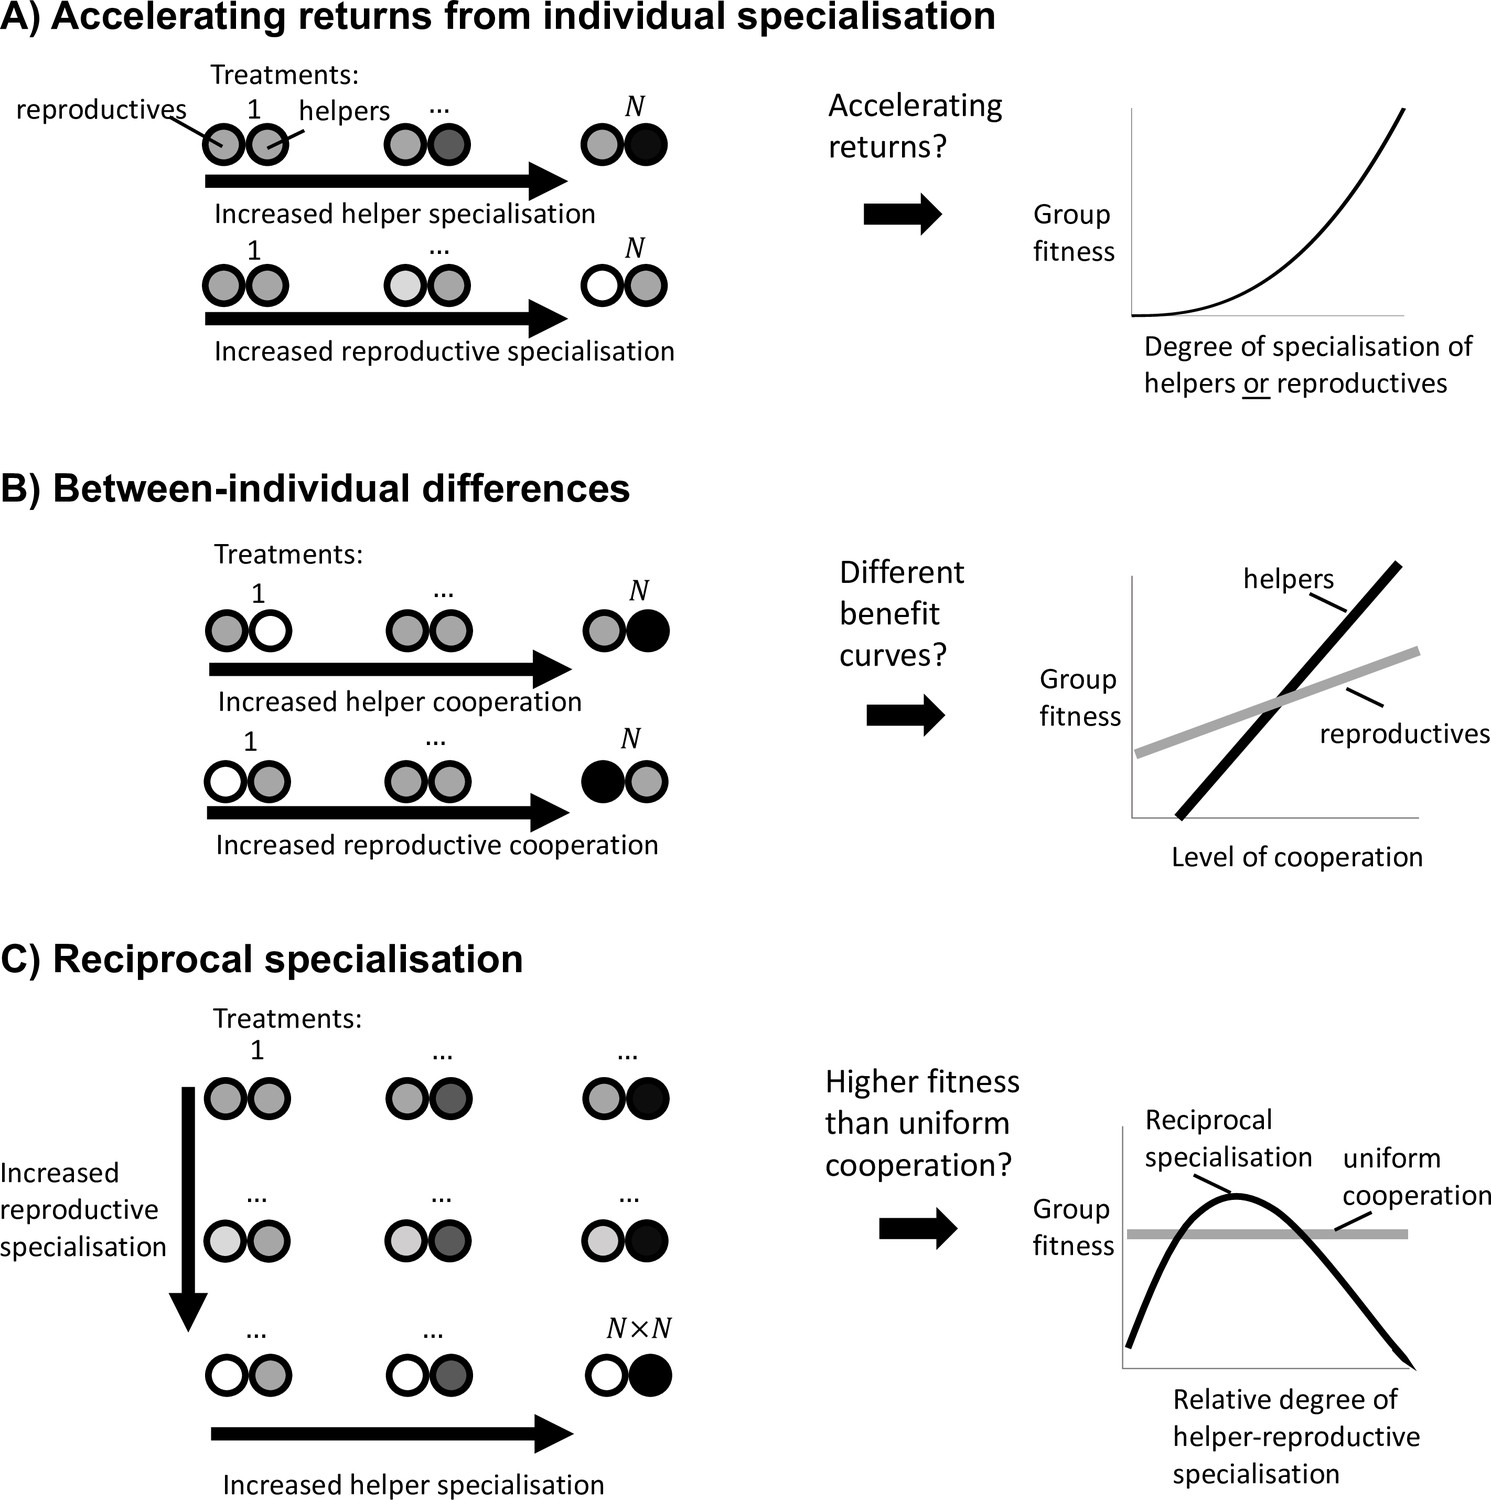
Experimental guidelines to distinguish the causes of division of labour.
(A) To test whether division of labour is favoured by an accelerating return from individual specialisation, we must separately determine whether an increase in helper cooperation or a decrease in reproductive cooperation leads to an accelerating increase in group fitness. (B) To test whether division of labour is favoured by between-individual differences, we must determine whether an increase in cooperation by helpers produces a different group fitness benefit than an increase in cooperation by reproductives. (C) To test whether division of labour is favoured by reciprocal specialisation, we must determine whether there exists at least one relative degree of helper-to-reproductive specialisation for which group fitness is greater than the fitness of uniform cooperation.
Appendix 1—figure 1
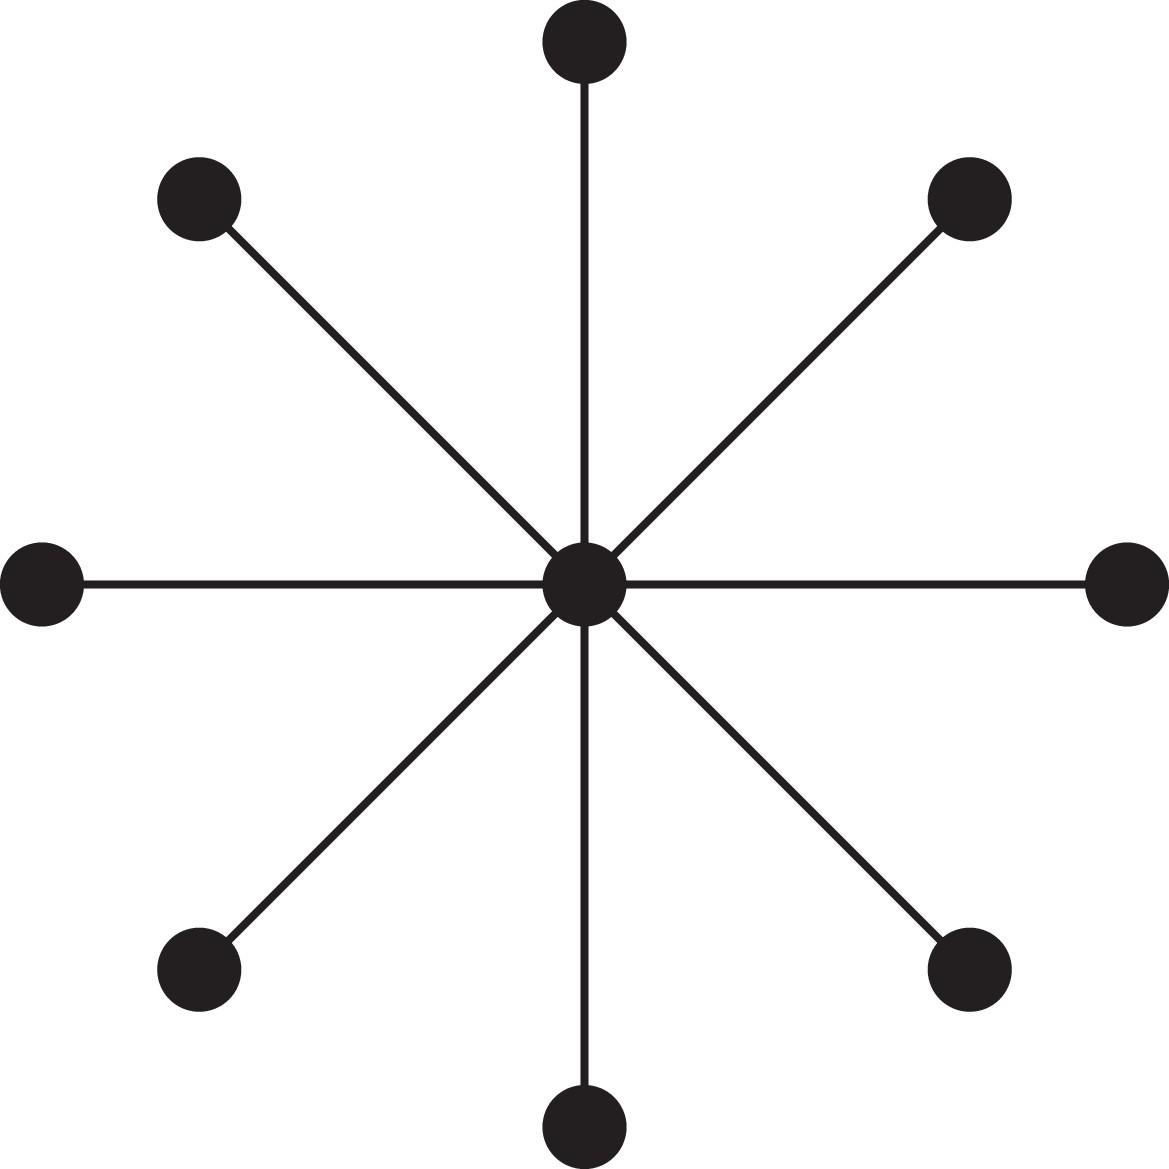
A star.
Appendix 1—figure 2
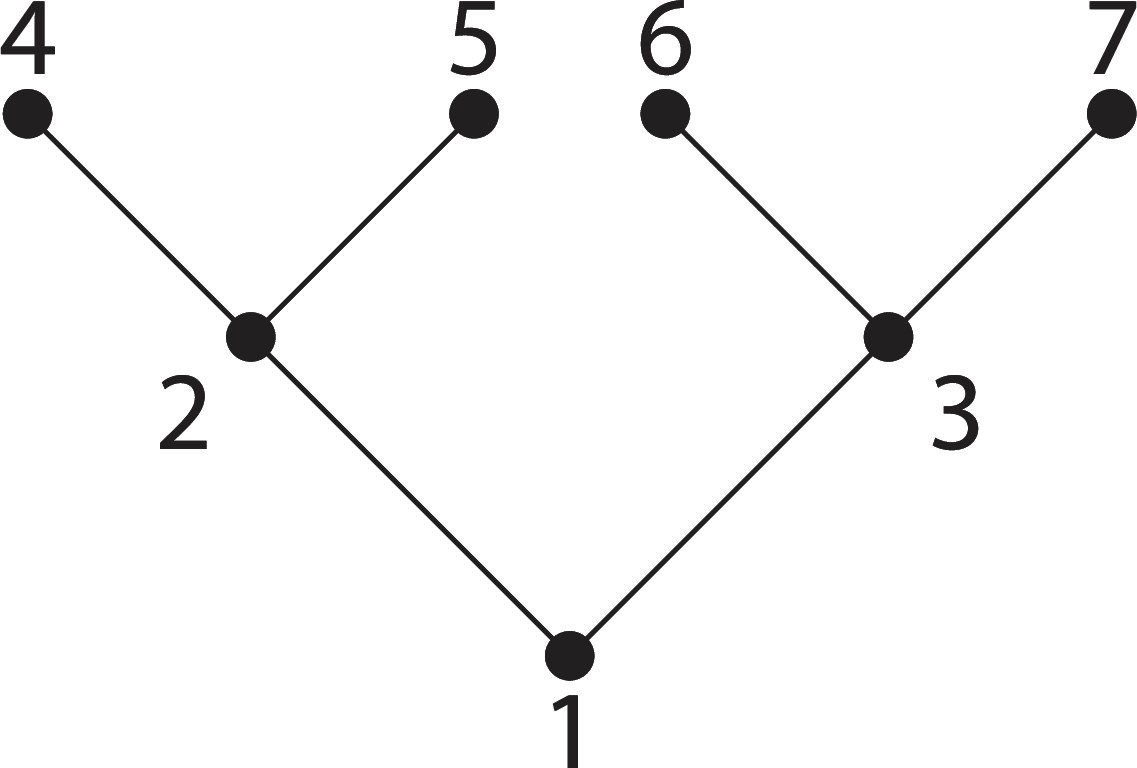
A tree.
Appendix 1—figure 3
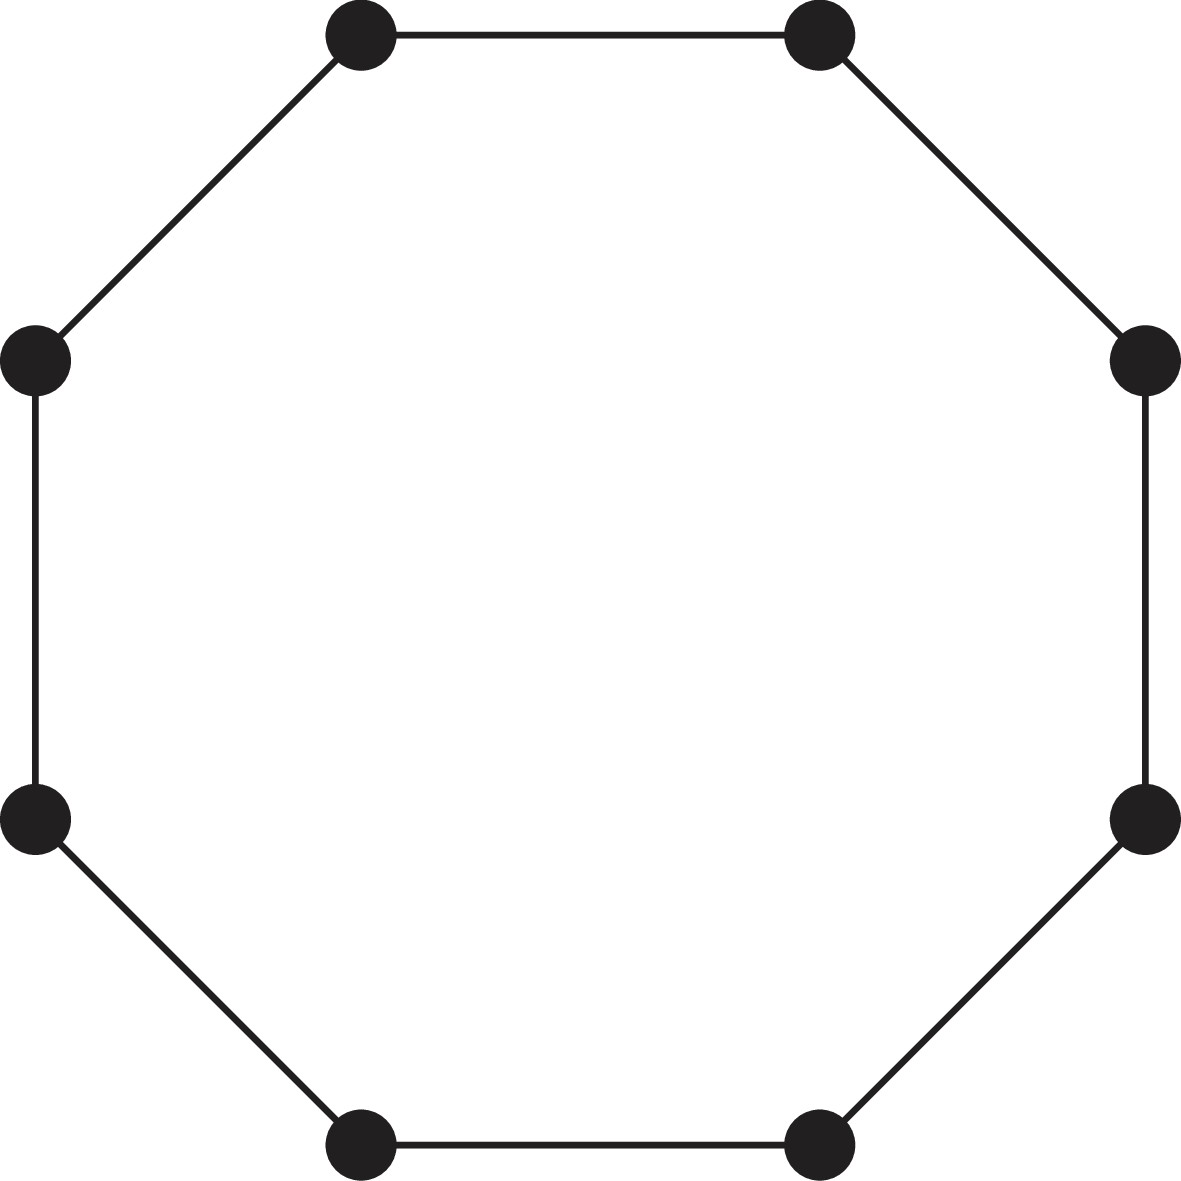
A ring of cells.
Appendix 1—figure 4
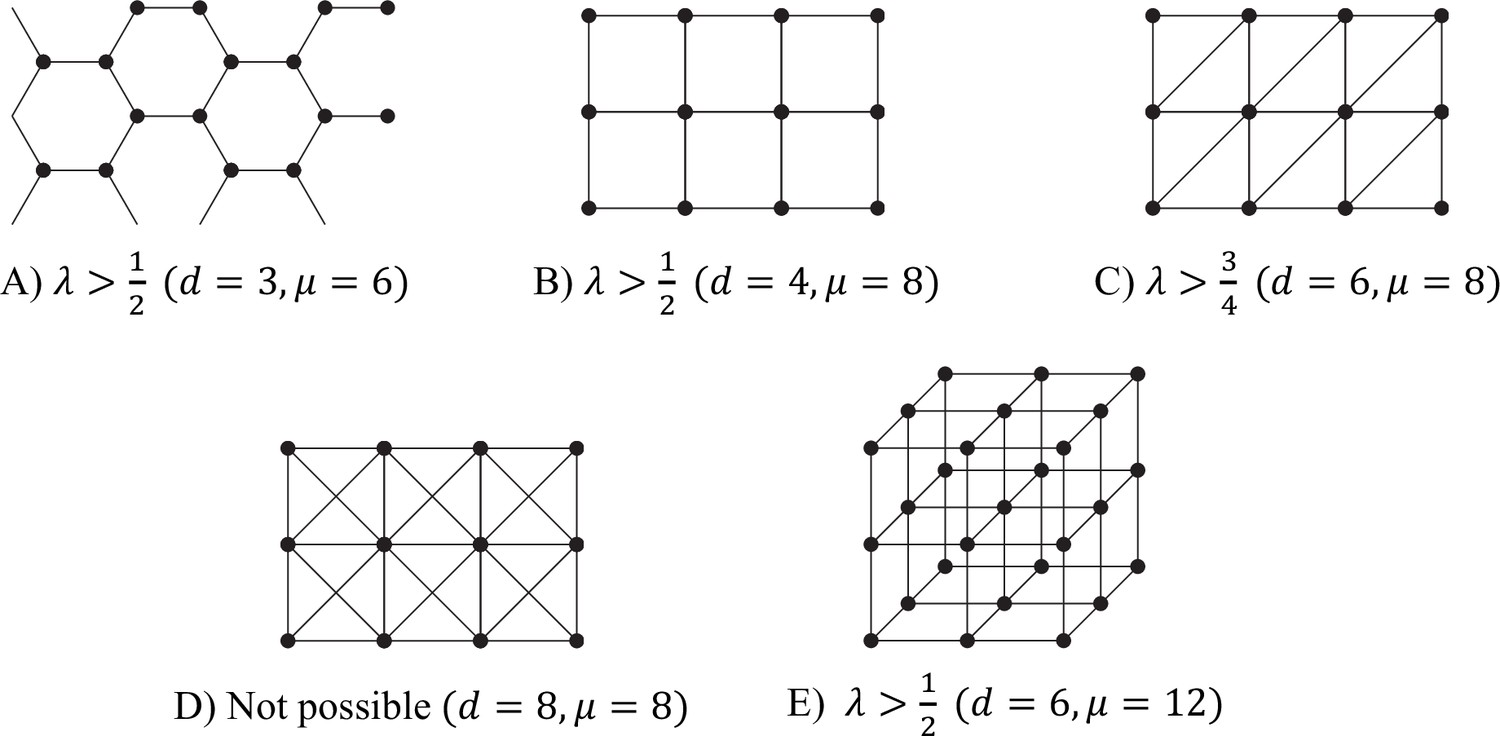
Some tessellation patterns, and the associated ranges of λ for which reciprocal specialisation is possible in each case.
Each figure should be regarded as showing just a few cells of the infinite tesselation.
Appendix 1—figure 5
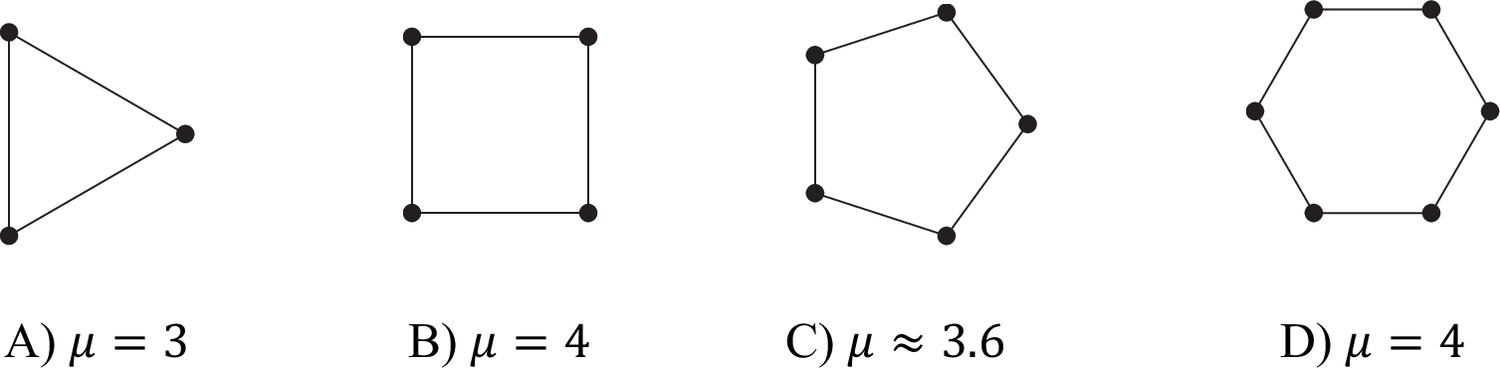
Values of μ for different filament (d = 2) graphs.
Appendix 1—figure 6
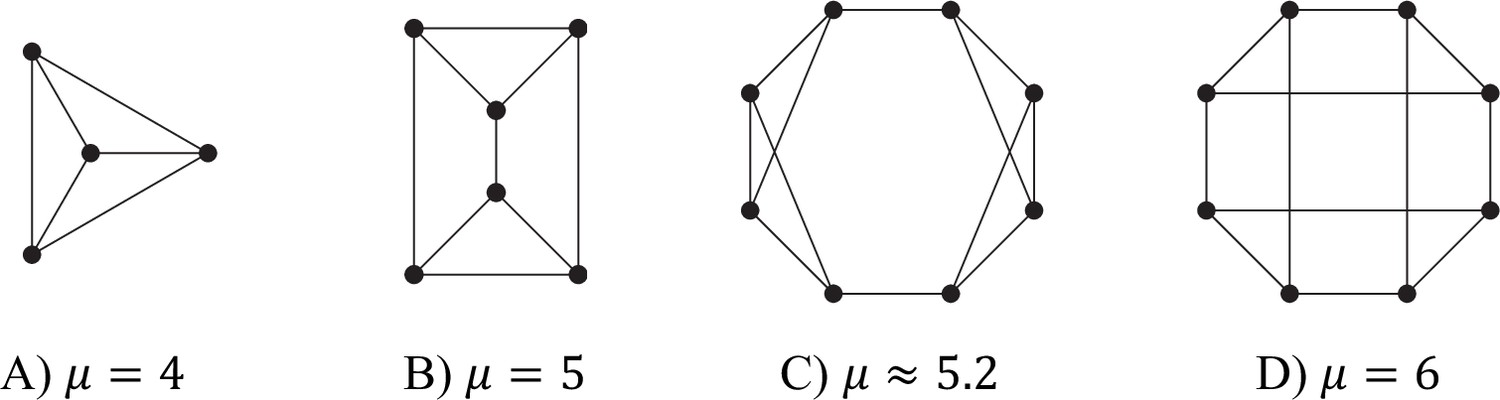
Values of μ for different trivalent (d = 3) graphs.
Appendix 1—figure 7
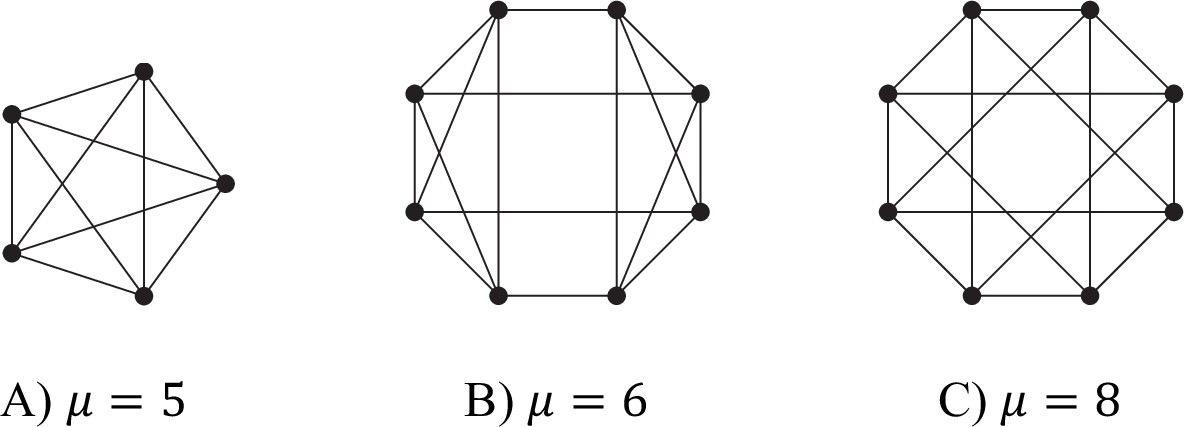
Values of μ for different d = 4 graphs.
Additional files
Download links
A two-part list of links to download the article, or parts of the article, in various formats.
Downloads (link to download the article as PDF)
Open citations (links to open the citations from this article in various online reference manager services)
Cite this article (links to download the citations from this article in formats compatible with various reference manager tools)
The evolution of division of labour in structured and unstructured groups
eLife 10:e71968.
https://doi.org/10.7554/eLife.71968


