Control of neurotransmitter release by two distinct membrane-binding faces of the Munc13-1 C1C2B region
- Charité – Universitätsmedizin Berlin, corporate member of Freie Universität Berlin and Humboldt-Universität zu Berlin, Institute of Neurophysiology, Germany
- NeuroCure Cluster of Excellence, Germany
- Department of Biophysics, University of Texas Southwestern Medical Center, United States
- Department of Biochemistry, University of Texas Southwestern Medical Center, United States
- Department of Pharmacology, University of Texas Southwestern Medical Center, United States
- Cecil H. and Ida Green Comprehensive Center for Molecular, Computational and Systems Biology, University of Texas Southwestern Medical Center, United States
- Center for Alzheimer’s and Neurodegenerative Diseases, University of Texas Southwestern Medical Center, United States
Figures
Figure 1 with 2 supplements
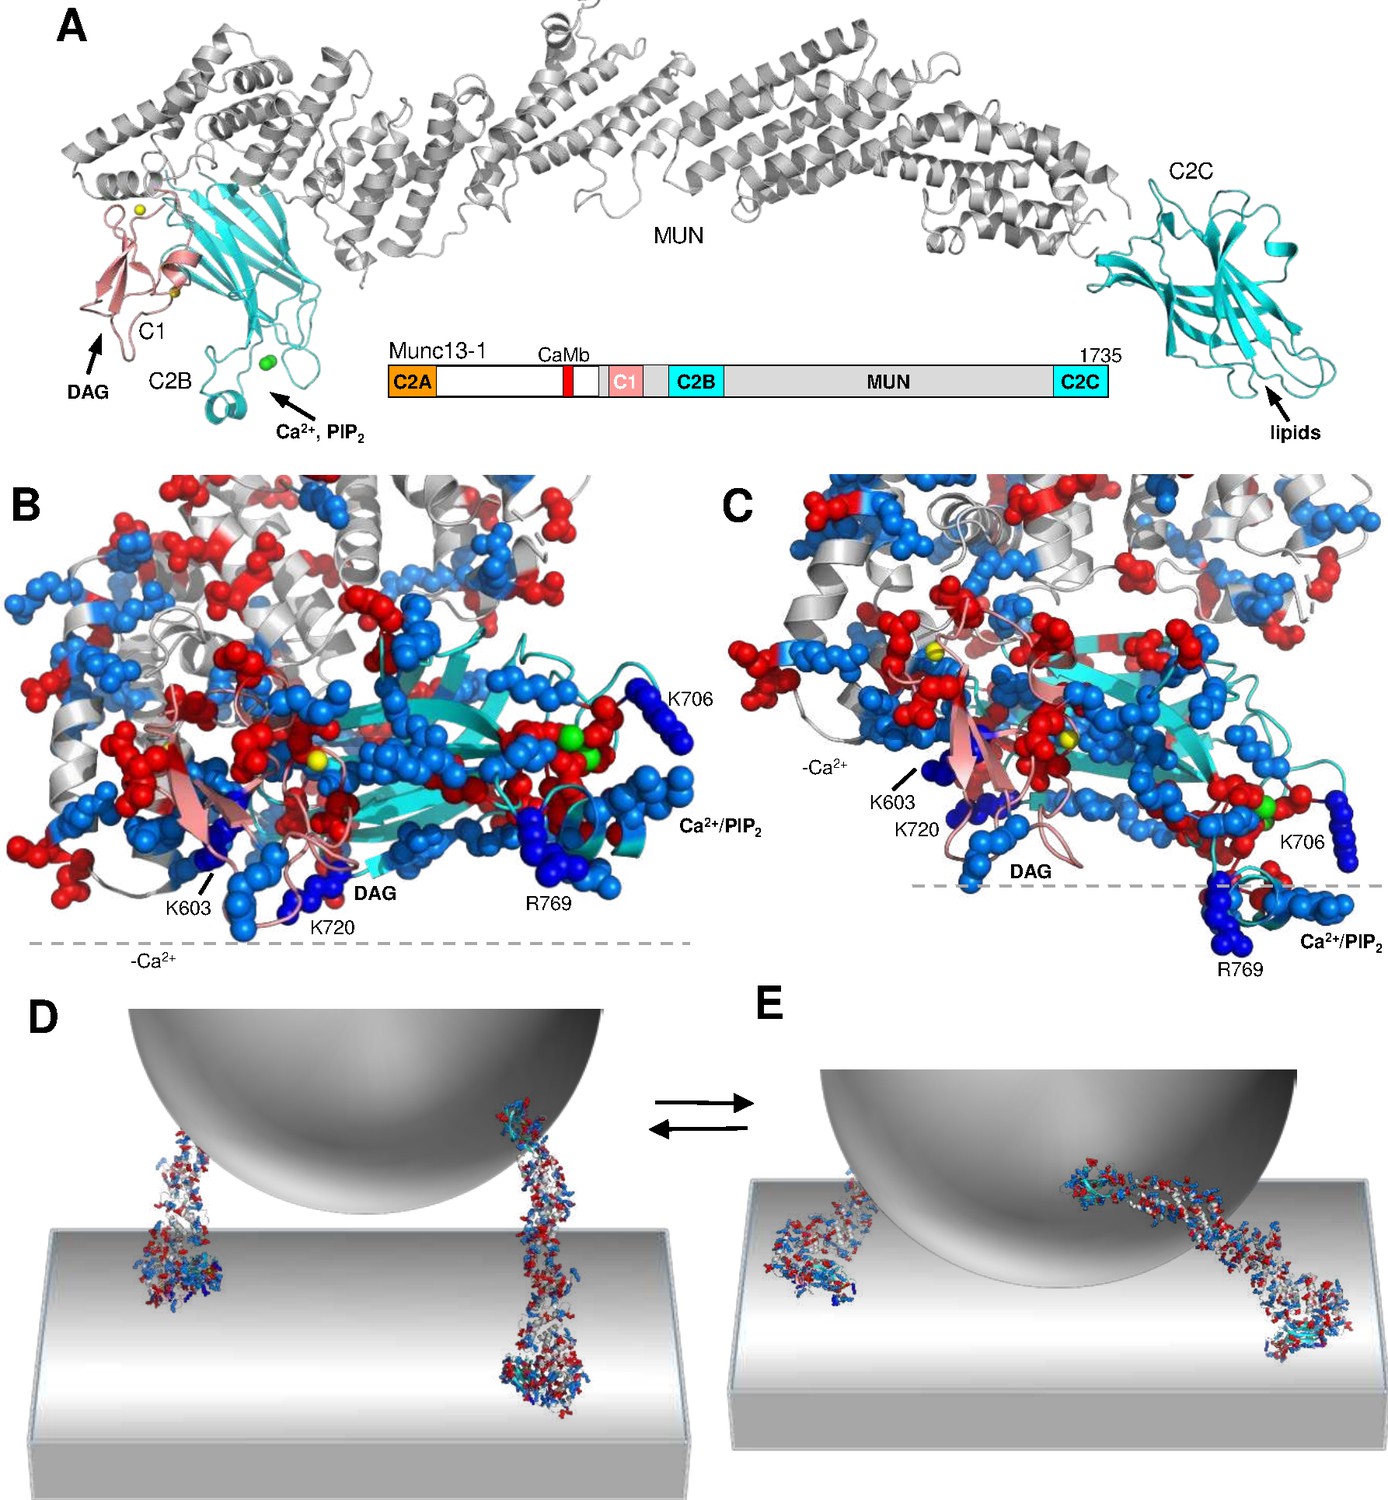
Model of Munc13-1 function with two different orientations bridging the membranes.
(A) Domain diagram of Munc13-1 (CaMb, calmodulin binding domain) and ribbon diagrams illustrating a model of the structure of the Munc13-1 C1C2BMUNC2C fragment. The ribbon diagram is based on the crystal structure of the Munc13-1 C1C2BMUN fragment (Xu et al., 2017) (PDB accession number 5UE8) but, because some residues in loops of the C1 and C2B domains of this structure are missing, these domains were replaced with the NMR structure of the C1 domain (Shen et al., 2005) (salmon, PDB accession number 1Y8F) and the crystal structure of the Ca2+-bound C2B domain (Shin et al., 2010) (cyan, PDB accession number 3KWU). The cyan ribbon diagram on the right is a model of the C2C domain built by homology with the RIM1α C2B domain (Guan et al., 2007) (PDB accession code 2Q3X). (B,C) Closeup views of the structure of the model of the Munc13-1 C1C2BMUN fragment shown in (A). The dashed lines indicate the positions of planes parallel to the plasma membrane in the orientations predicted when binding is mediated by the polybasic face (B) or the DAG/Ca2+/PIP2-binding face (C) of the C1-C2B region. The Zn2+ ions bound to the C1 domain and the Ca2+ ions bound to the C2B domain are shown as yellow or green spheres, respectively. Basic residues are shown as blue spheres and acidic residues as red spheres. The positions of the residues that were mutated in this study and the approximate locations of the DAG- and Ca2+/PIP2-binding sites are indicated. (D,E) Three-dimensional models that illustrate the notion that Munc13-1 C1C2BMUNC2C can bridge the synaptic vesicle and plasma membranes in two different orientations. The models include a vesicle (half sphere), the plasma membrane (flat surface) and ribbon diagrams representing the modelled structure of the C1C2BMUNC2C fragment shown in (A) in the approximately perpendicular (D) and slanted (E) orientations with respect to the plasma membrane yielded by the MD simulations performed in the absence and presence of Ca2+, respectively. The model postulates that perpendicular orientation allows partial but not full assembly of the SNARE complex, whereas the slanted orientation facilitates full assembly. The two states are proposed to exist in an equilibrium that is shifted to the right by Ca2+ and DAG.
Figure 1—figure supplement 1
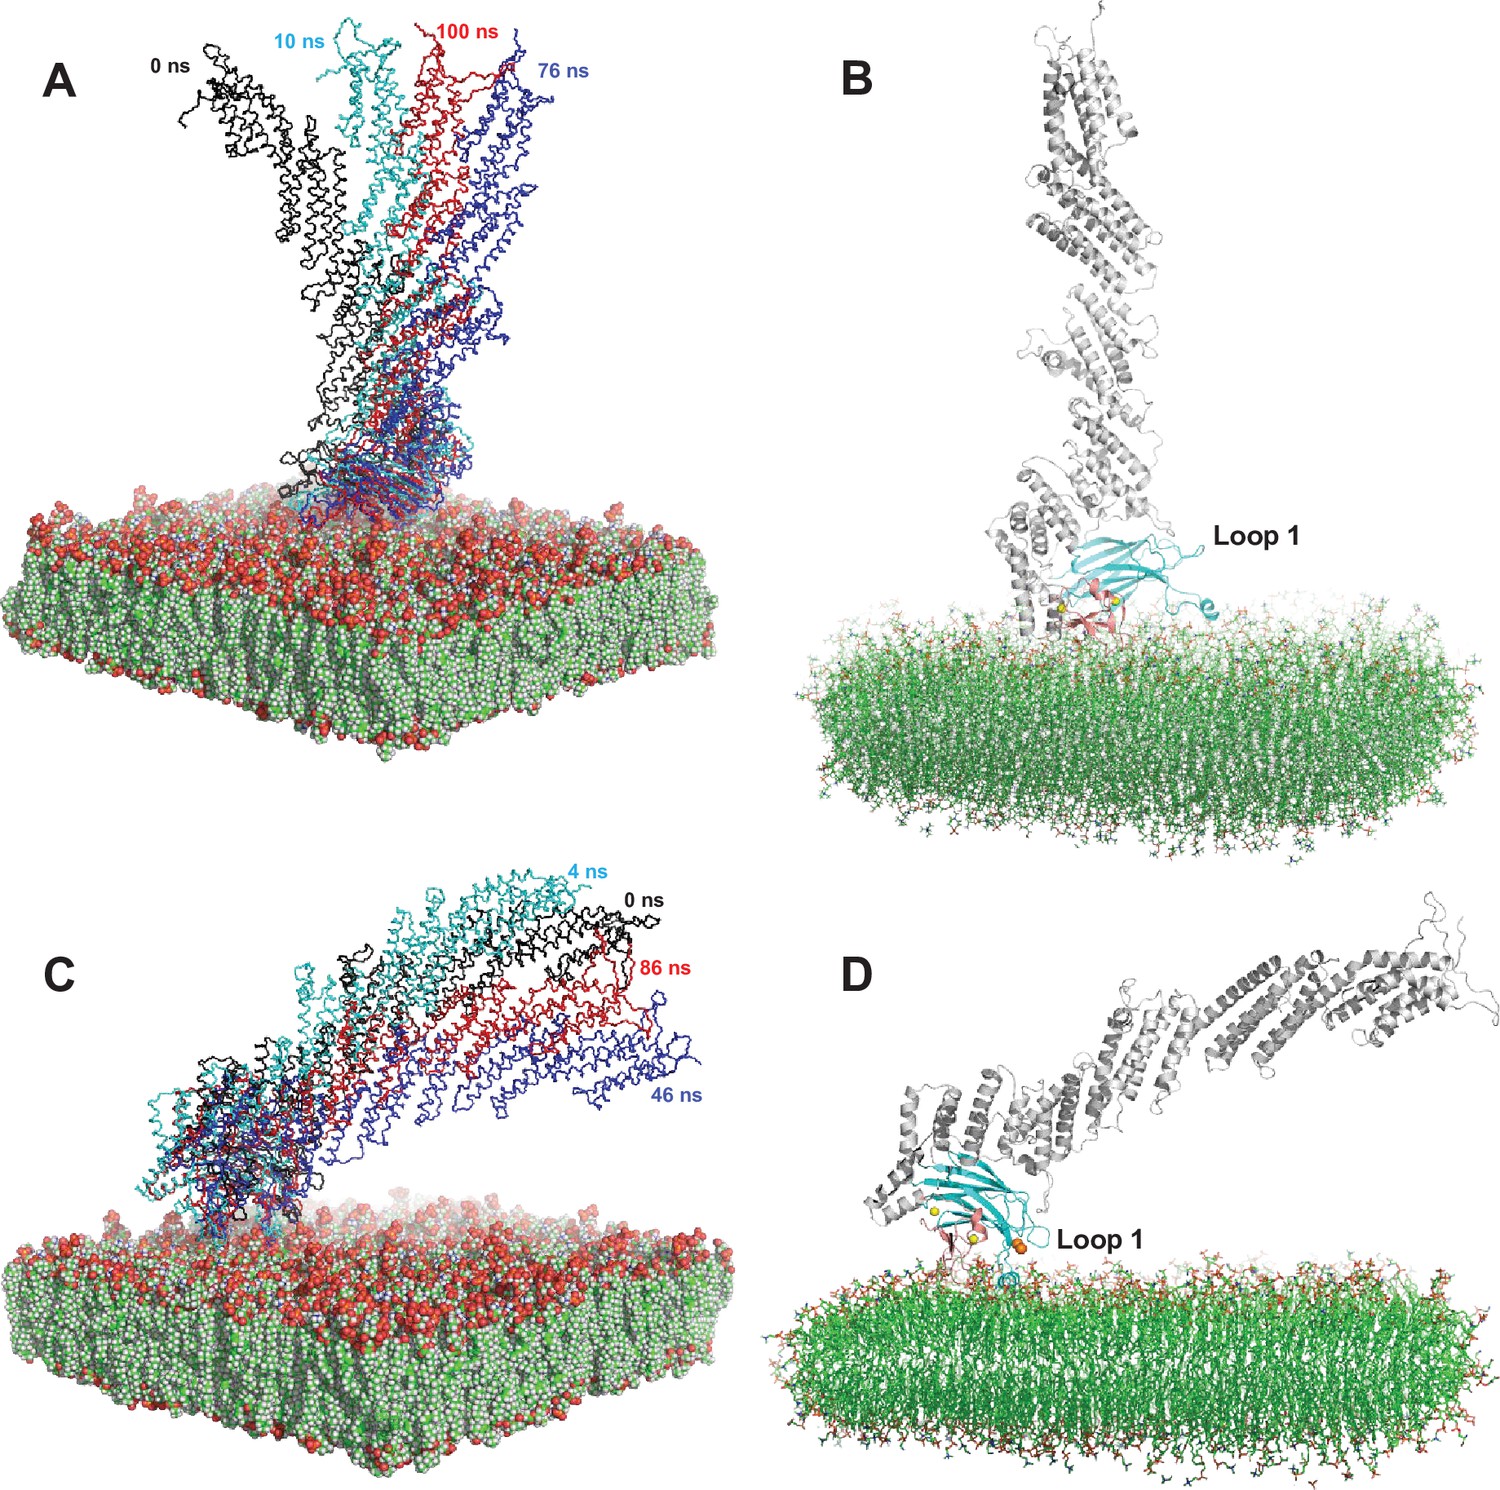
Representative conformations showing the orientations of the C1C2BMUNC2C fragment with respect to the flat bilayer visited during the MD simulations.
(A,C). The panels show the initial flat bilayer in space-filling models and cartoon representations of the backbone of the C1C2BMUN fragment in the initial (black) and final (red) orientation of the MD simulations performed in the absence (A) or presence (C) of Ca2+. (A) also shows cartoon representations of the backbone of the C1C2BMUN fragment in the two extremes of the range of orientations visited from 10 to 100 ns of the simulation. Note that the final orientation is approximately in the middle of this range. (C) also shows cartoon representations of the backbone of the C1C2BMUN in the two extremes of the range of orientations visited during the entire simulation, but we note that the orientation of C1C2BMUN was most of the time ranging between the initial orientation and the orientation observed at 46 ns. The final orientation is approximately in the middle of that range. (B,D) Final frames of the MD simulations performed in the absence (B) and presence (D) of Ca2+, which are representative of the average orientations observed during the respective simulations. The C1C2BMUN fragment is shown as a ribbon diagram with the C1 domain in salmon, the C2B domain in cyan and the rest of the molecule in gray. The flay bilayer is represented by stick models. Carbon atoms are in green, oxygen atoms in red, nitrogen atoms in blue and phosphorous atoms in orange.
Figure 1—figure supplement 2
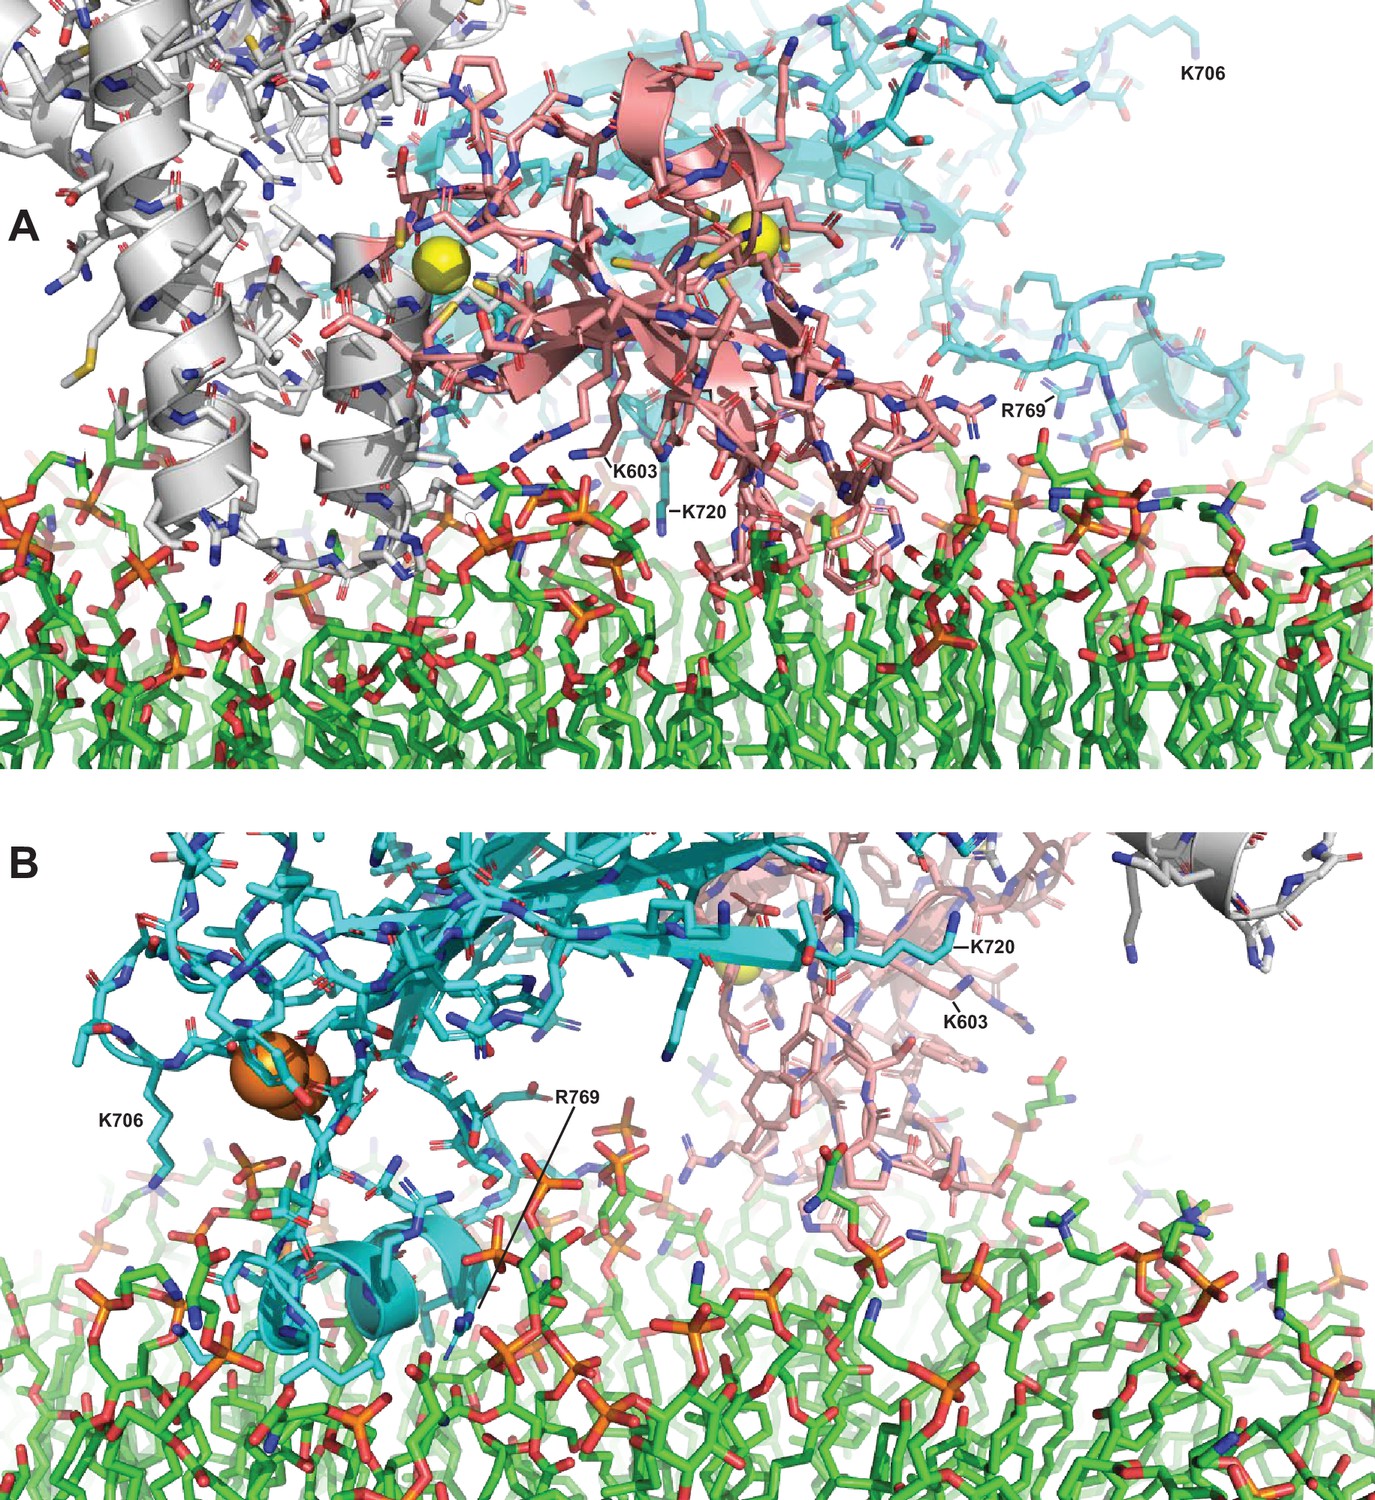
Closeup views of the membrane-binding modes of the C1C2BMUN fragment observed in the final frames of the MD simulations performed in the absence (A) or presence (B) of Ca2+.
The C1C2BMUN is shown with the backbone represented by a ribbon diagram (C1 domain in salmon, C2B domain in cyan and the rest of the backbone in gray) and the side chains represented by stick models. The bilayer is represented by stick models. Carbon atoms are in green, oxygen atoms in red, nitrogen atoms in blue and phosphorous atoms in orange. Zn2+ and Ca2+ ions are shown as yellow and orange spheres, respectively. The positions of the side chains that were mutated in this study are indicated.
Figure 2
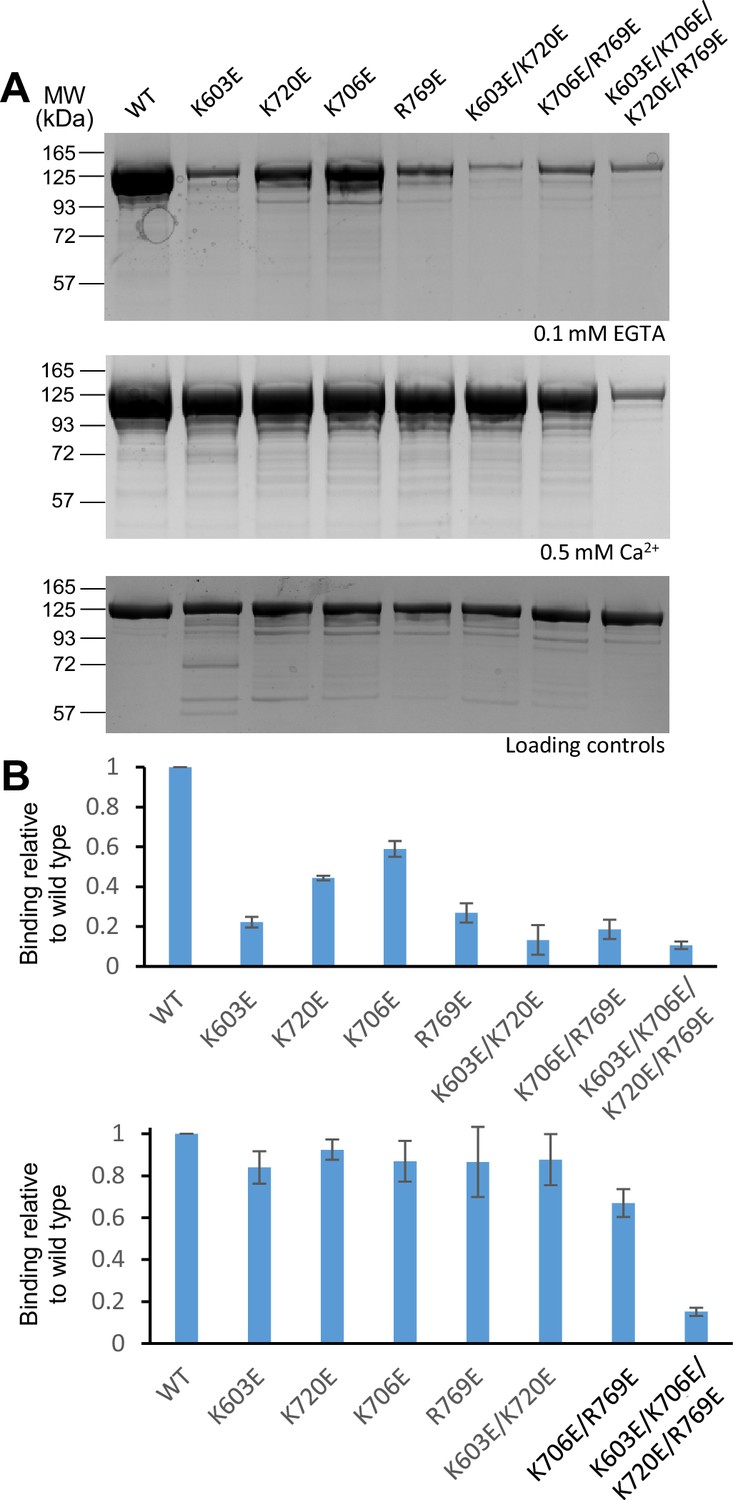
Mutations in basic residues of the C1-C2B region differentially impair the liposome affinity of the C1C2BMUNC2C fragment.
(A) Liposome co-sedimentation assays were performed with WT and mutant Munc13-1 C1C2BMUNC2C fragments and the pellets were analyzed by SDS-PAGE followed by coomassie blue staining. The top and middle images show experiments performed in the presence of 0.1 mM EGTA or 0.5 mM Ca2+, respectively. The bottom panel shows loading controls. The positions of molecular weight markers are indicated on the left. The total amount of C1C2BMUNC2C used for each sample of the co-sedimentation assays was 10 μg. Loading controls contained 2 μg of protein. (B) Quantification of the relative amount of liposome binding of the mutant C1C2BMUNC2C fragments with respect to WT C1C2BMUNC2C. The bands of WT and mutant C1C2BMUNC2C fragments in gels from three independent experiments performed in the presence of 0.1 mM EGTA or 0.5 mM Ca2+ were quantified with ImageJ and normalize to the average value obtained for WT C1C2BMUNC2C. Bars indicate average values and bars show standard deviations.
-
Figure 2—source data 1
Uncropped gel of Figure 2A and quantification of liposome binding (Figure 2B).
- https://cdn.elifesciences.org/articles/72030/elife-72030-fig2-data1-v2.xlsx
Figure 3 with 1 supplement
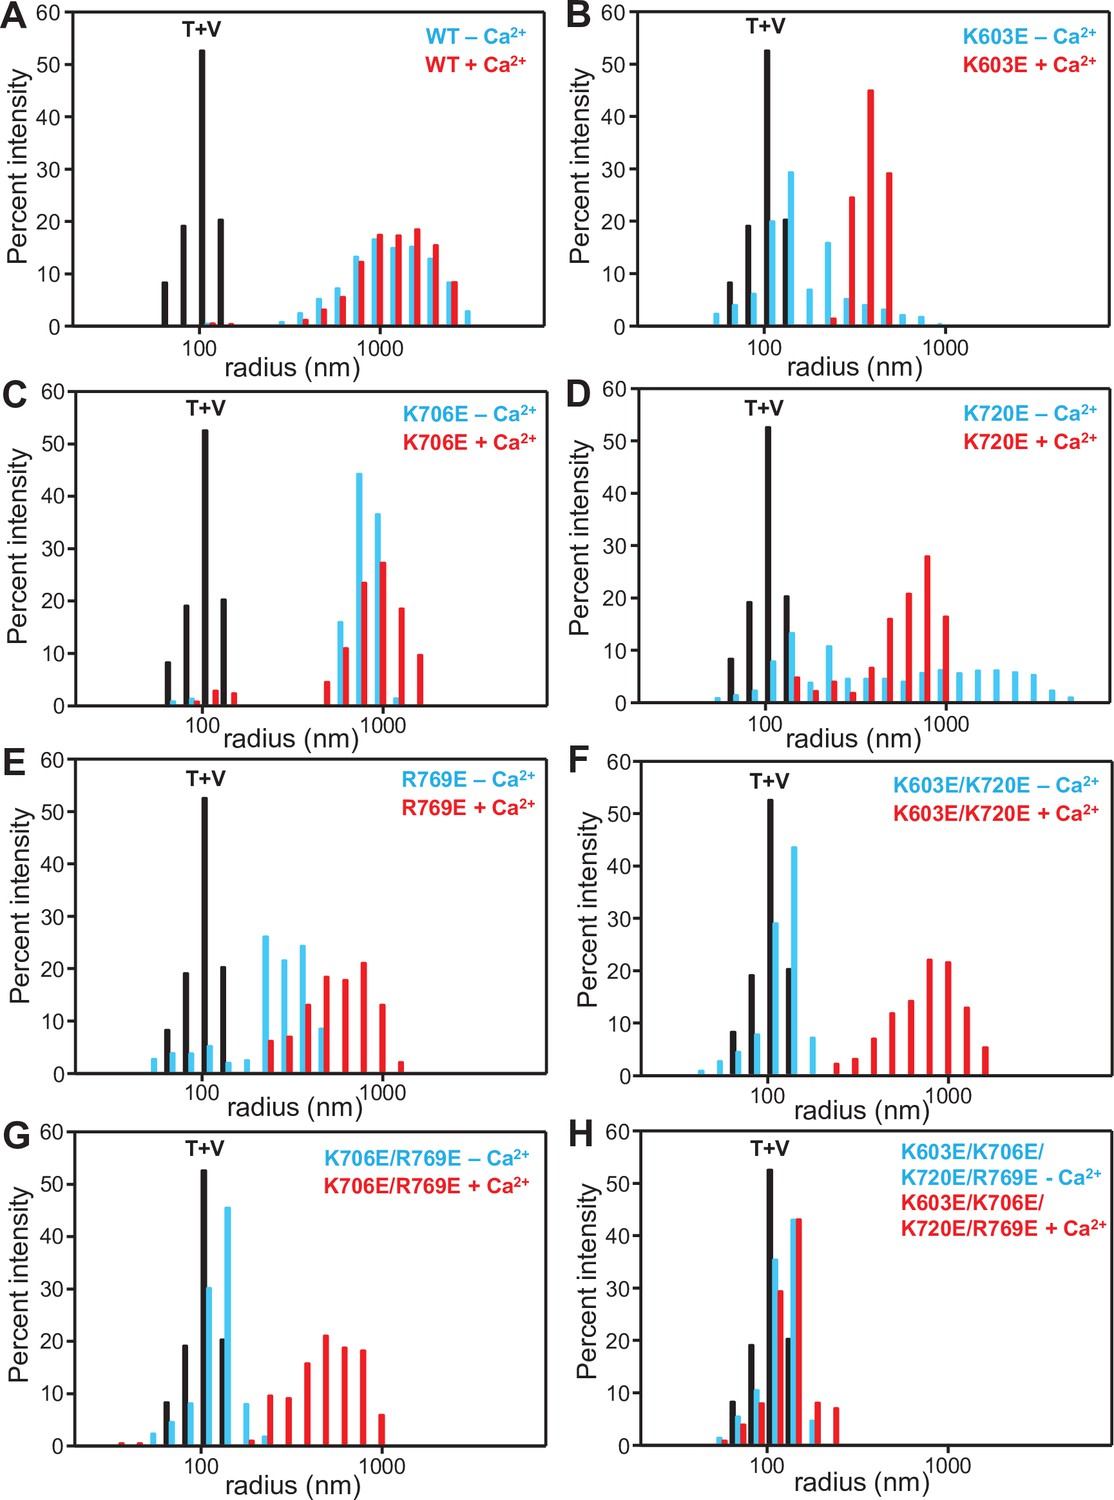
Mutations in basic residues of the C1-C2B region differentially impair the ability of the C1C2BMUNC2C fragment to cluster V- and T-liposomes.
The ability of WT and mutant Munc13-1 C1C2BMUNC2C fragments to cluster V- and T-liposomes was analyzed by DLS. The diagrams show the particle size distributions observed in mixtures of the V- and T-liposomes alone (T + V, black bars), after addition of the corresponding C1C2BMUNC2C fragment in the presence of 0.1 mM EGTA (blue bars), and after addition of 0.6 mM Ca2+ to the same sample (red bars).
-
Figure 3—source data 1
Percent intensities of radius bins.
- https://cdn.elifesciences.org/articles/72030/elife-72030-fig3-data1-v2.xlsx
Figure 3—figure supplement 1
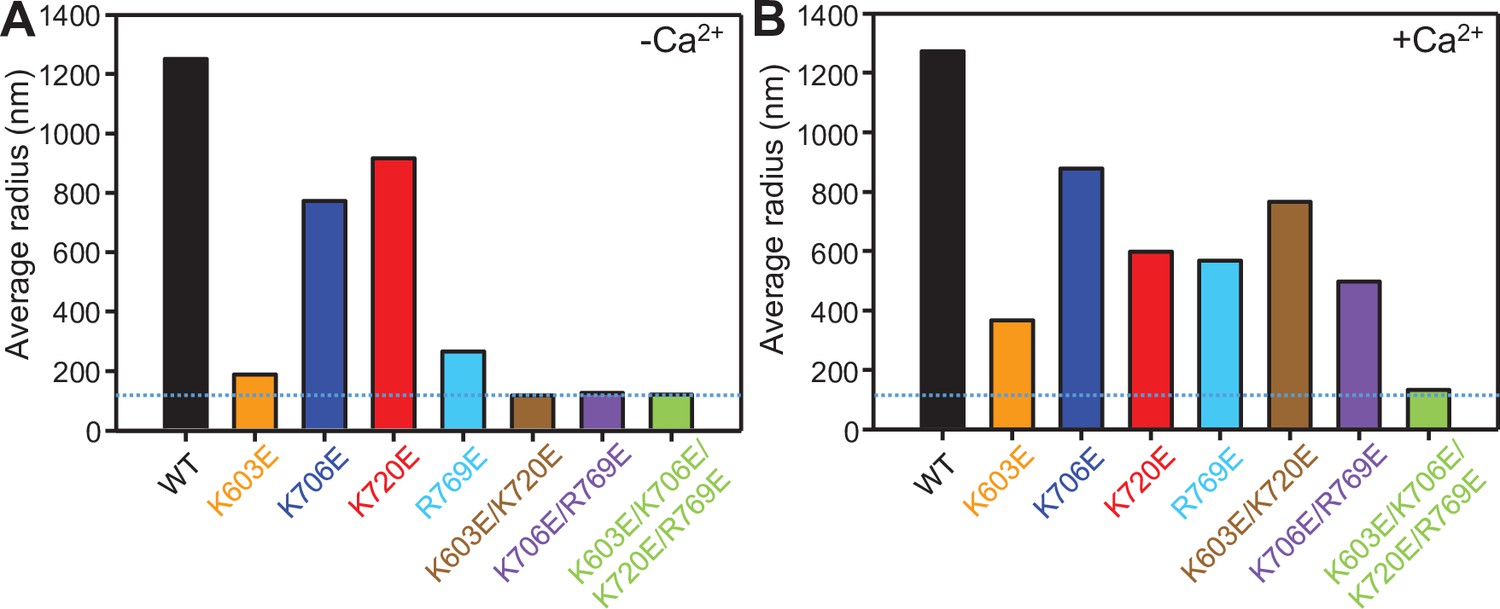
Semi-quantitative analysis of the liposome clustering assays.
(A,B) The particle size distributions observed in the liposome clustering assays after addition of the corresponding C1C2BMUNC2C fragment in the presence of 0.1 mM EGTA (A), and after addition of 0.6 mM Ca2+ to the same sample (B) (shown in Figure 2) were converted to average radii by calculating a populating weighted average, i.e. the sum of terms obtained by multiplying the radius of each bin by the corresponding population. Note that the equations used to derive the populations of each particle size bin break down for large radii. Therefore, these data need to be interpreted with caution, and the difference between the average radii calculated for the K720E C1C2BMUNC2C mutant in the absence and presence of Ca2+ cannot be considered meaningful.
Figure 4
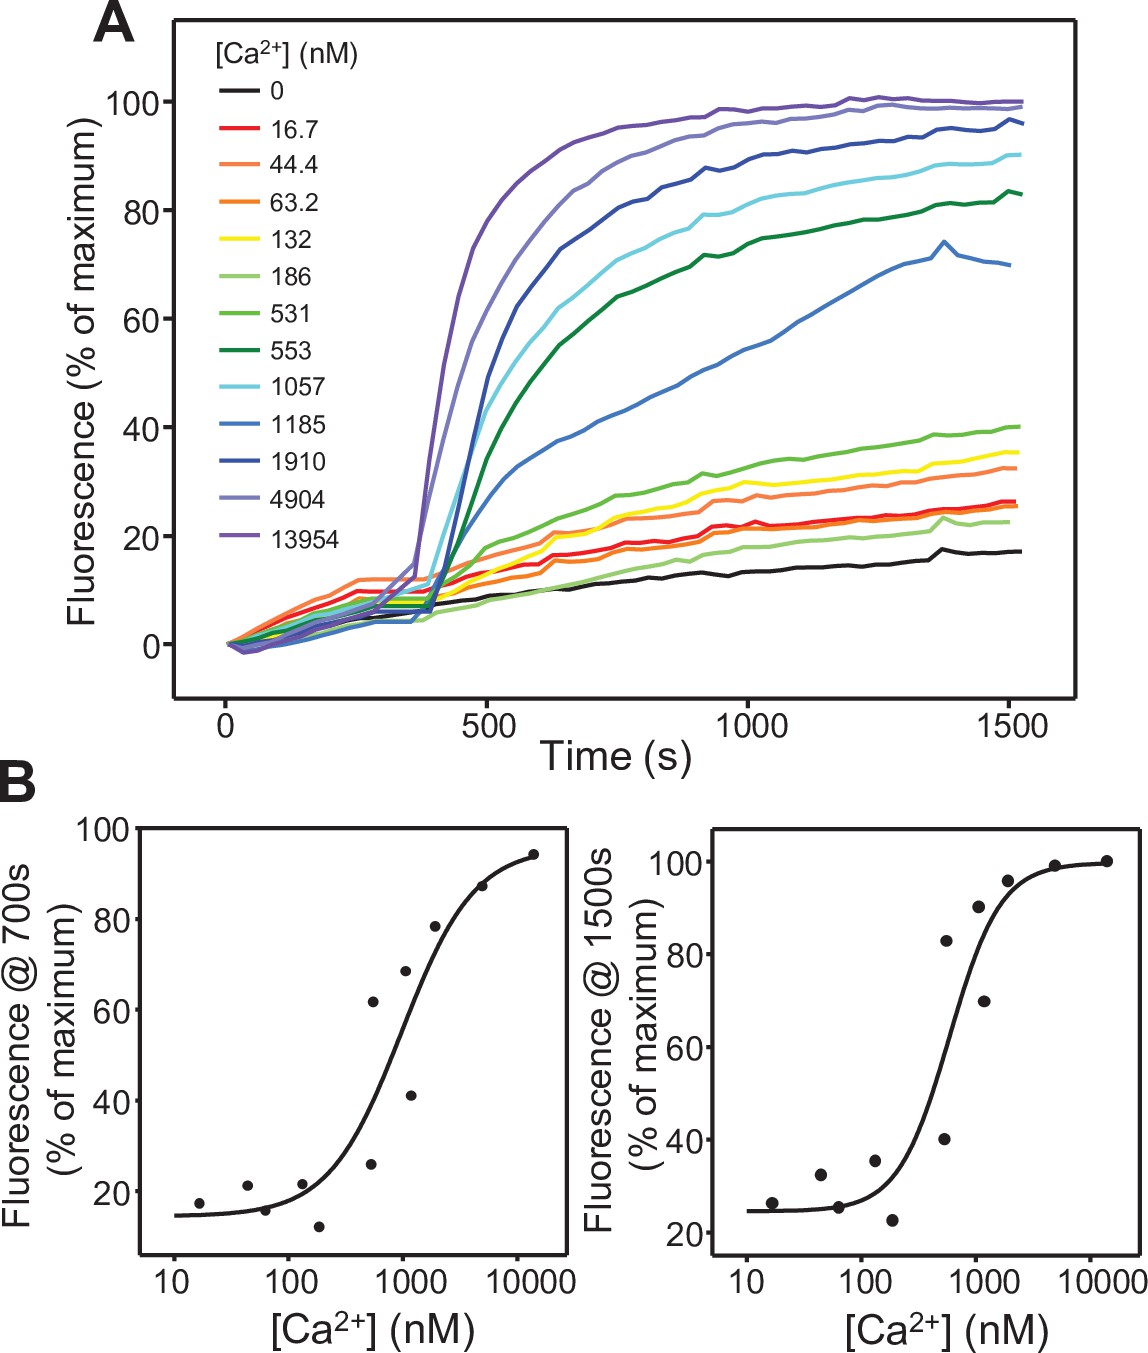
Ca2+-dependence of the stimulation of liposome fusion by the Munc13-1 C1C2BMUNC2C.
(A) Lipid mixing assays performed at different Ca2+ concentrations. Lipid mixing between V- and T-liposomes was measured from the fluorescence de-quenching of DiD lipids in the V-liposomes. The assays were performed in the presence of Munc18-1, NSF, αSNAP, WT Munc13-1 C1C2BMUNC2C fragment and Fluo-4. Experiments were started in the presence of 100 μM EGTA and Ca2+ was added at different concentrations after 300 s. The concentration of free Ca2+ in each experiment was assessed from the fluorescence of Fluo-4. (B) Ca2+ dependence of the relative fluorescence at 700 s and 1,500 s of the lipid mixing assays of panel (A). The data were fit to a Hill equation.
-
Figure 4—source data 1
Time dependence of lipid mixing and Ca2+-dependence of the relative fluorescence intensities at 700 s and 1,500 s.
- https://cdn.elifesciences.org/articles/72030/elife-72030-fig4-data1-v2.xlsx
Figure 5 with 1 supplement
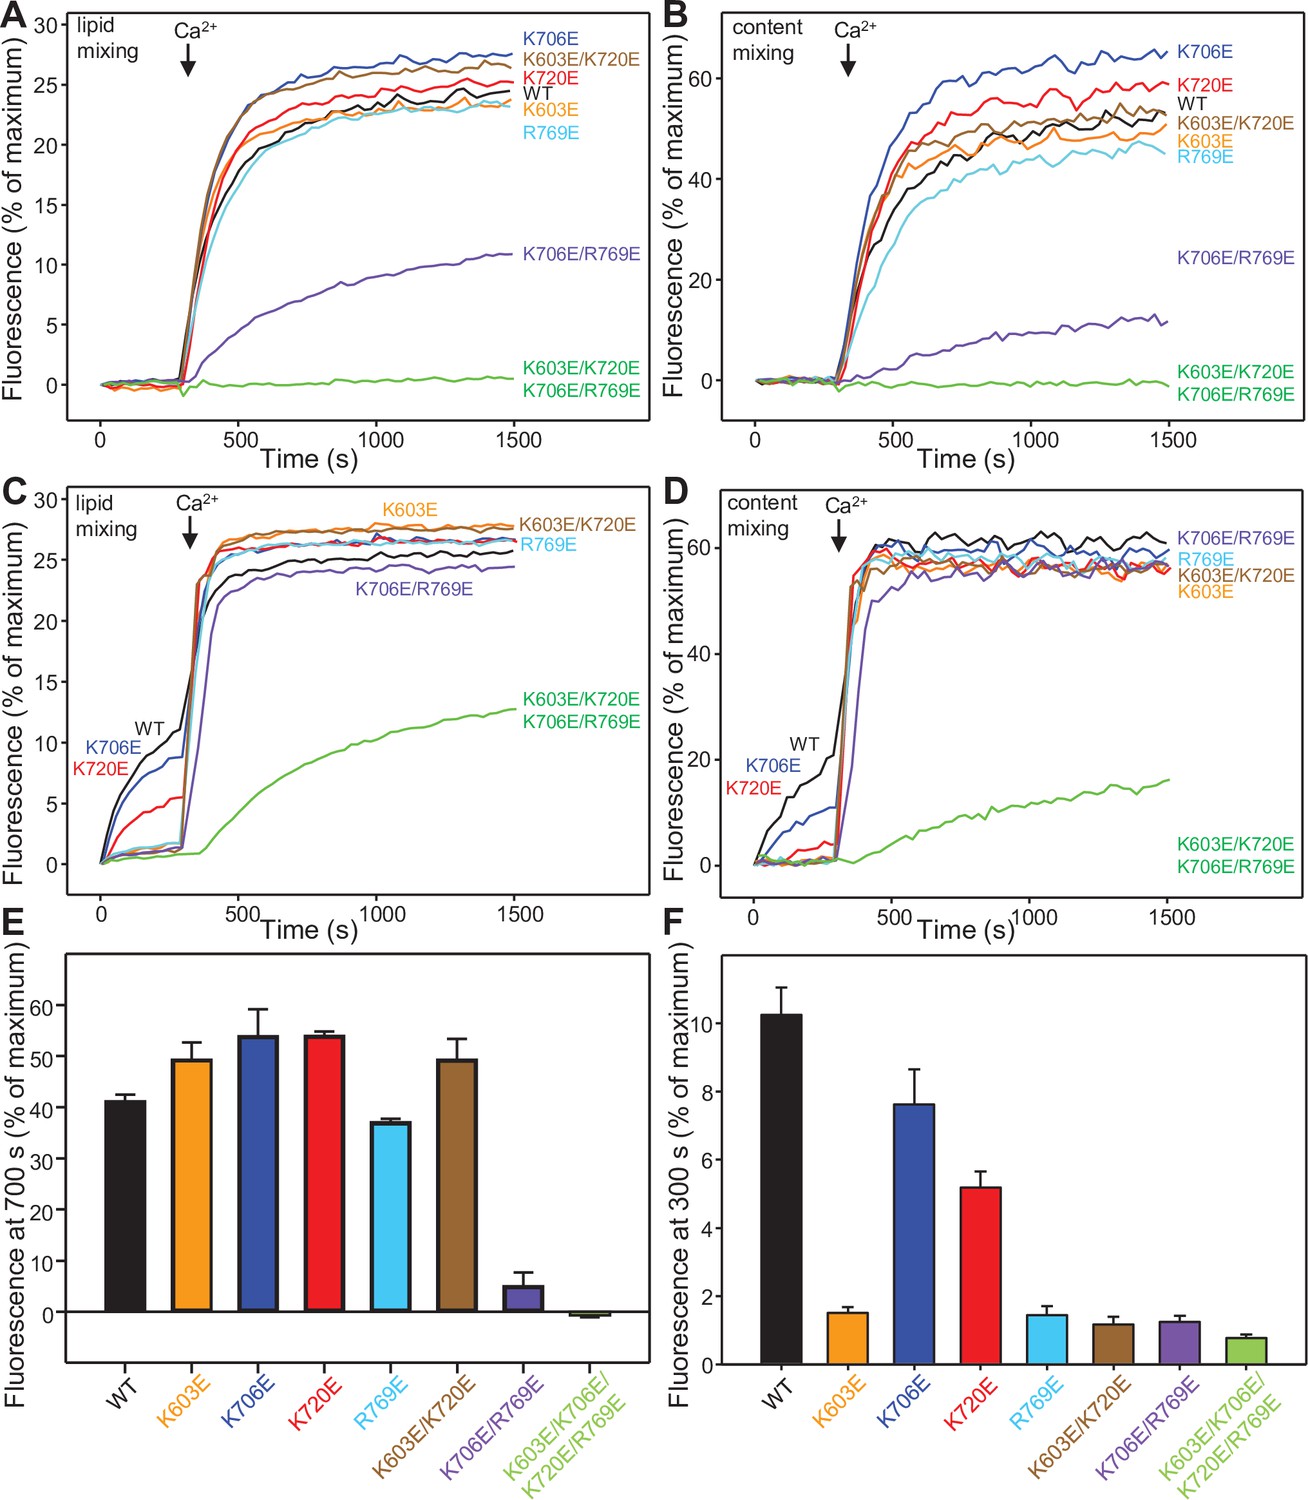
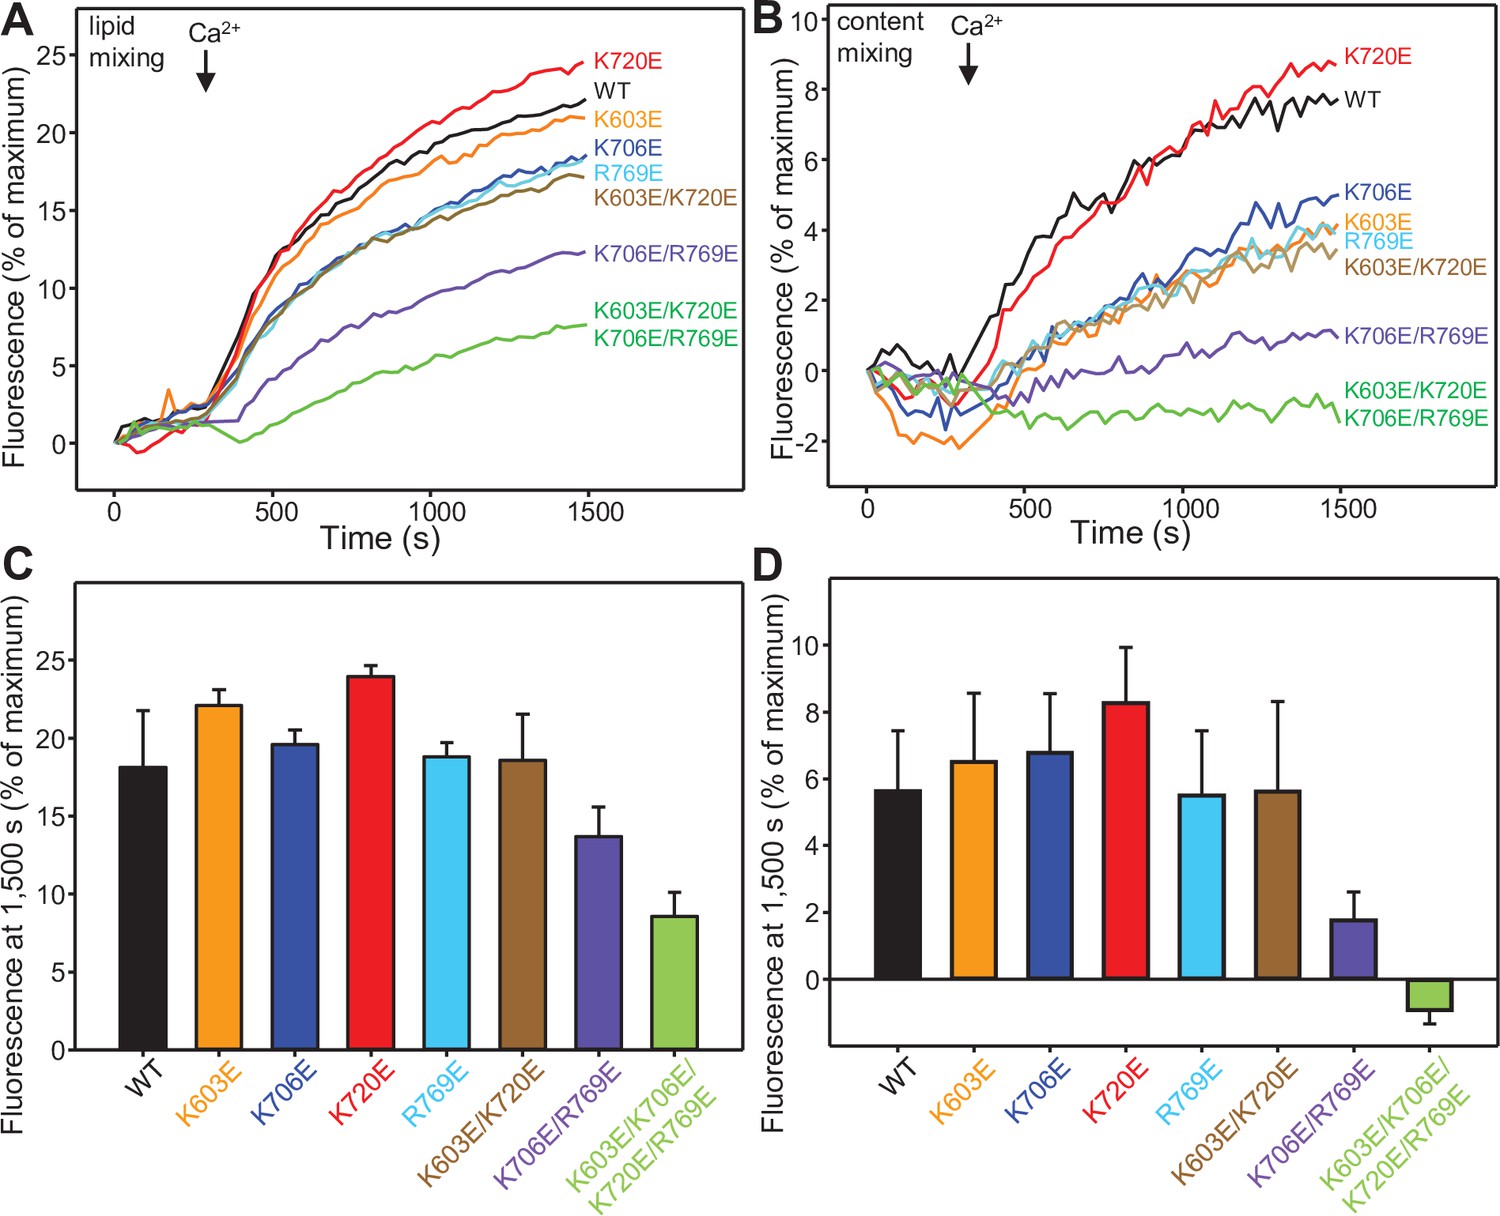
Mutations in basic residues of the C1-C2B region differentially impair the ability of the Munc13-1 C1C2BMUNC2C fragment to stimulate liposome fusion.
(A,B) Lipid mixing (left) between V- and T-liposomes was measured from the fluorescence de-quenching of Marina Blue-labeled lipids and content mixing (right) was monitored from the development of FRET between PhycoE-Biotin trapped in the T-liposomes and Cy5-Streptavidin trapped in the V-liposomes. The assays were performed in the presence of WT Munc18-1, NSF, αSNAP and the indicated Munc13-1 C1C2BMUNC2C fragments. Experiments were started in the presence of 100 μM EGTA and 5 mM streptavidin, and Ca2+ (600 μM) was added after 300 s. (C,D) Analogous lipid and content mixing assays performed under the same conditions but using D326K mutant Munc18-1. (E) Quantification of the content mixing observed after 700 s in reconstitution assays performed under the conditions of Panels (A,B. F). Quantification of the lipid mixing observed after 300 s in reconstitution assays performed under the conditions of Panels (C,D). In (E,F), bars represent averages of the normalized fluorescence observed in experiments performed at least in triplicate, and error bars represent standard deviations.
-
Figure 5—source data 1
Lipid and content mixing between V- and T-liposomes in Figure 5A–D and relative fluorescence intensities at 700 s in Figure 5E or at 300 s in Figure 5F.
- https://cdn.elifesciences.org/articles/72030/elife-72030-fig5-data1-v2.xlsx
Figure 5—figure supplement 1
Mutations in basic residues of the C1-C2B region differentially impair the ability of the Munc13-1 C1C2BMUNC2C fragment to stimulate liposome fusion.
(A,B) Lipid mixing (left) between VSyt1- and T-liposomes was measured from the fluorescence de-quenching of Marina Blue-labeled lipids and content mixing (right) was monitored from the development of FRET between PhycoE-Biotin trapped in the T-liposomes and Cy5-Streptavidin trapped in the VSyt1-liposomes. The assays were performed under analogous conditions as those used for Figure 4A and B, but the VSyt1 liposomes contained a synaptobrevin-to-lipid ratio of 1:10,000 and a synaptotagmin-1-to-lipid ratio of 1:1000, and the T-liposomes contained a syntaxin-1-to-lipid ratio of 1:5000 and a dodecylated SNAP-25-to-lipid ratio of 1:800. Experiments were started in the presence of 100 μM EGTA and 5 mM streptavidin, and Ca2+ (600 μM) was added after 300 s. (C,D) Quantification of the lipid mixing (C) and content mixing (D) observed after 1,500 s in reconstitution assays performed under the conditions of Panels (A,B). In (C,D), bars represent averages of the normalized fluorescence observed in experiments performed at least in triplicate, and error bars represent standard deviations.
-
Figure 5—figure supplement 1—source data 1
Lipid and content mixing between V- and T-liposomes in Figure 5—figure supplement 1A, B and relative fluorescence intensities at 1,500 s in Figure 5—figure supplement 1C,D.
- https://cdn.elifesciences.org/articles/72030/elife-72030-fig5-figsupp1-data1-v2.xlsx
Figure 6 with 2 supplements
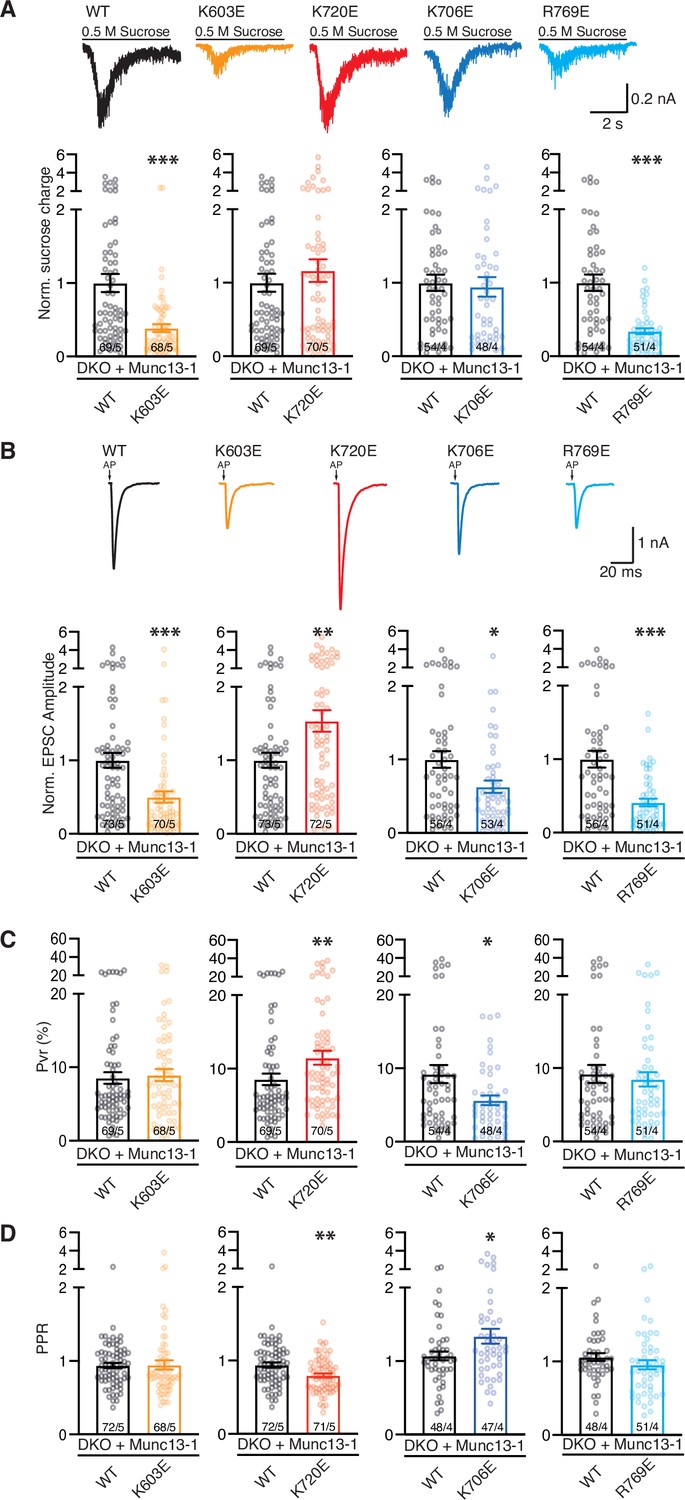
Evaluation of Munc13-1 functions using single point mutations within the C1-C2B region.
(A–D) Electrophysiological parameters of autaptic hippocampal glutamatergic Munc13-1/2 DKO neurons expressing Munc13-1 WT (black) or Munc13-1 polybasic mutants: K603E (orange), K720E (red), K706E (blue), and R769 (light blue). (A) Representative sucrose-induced current traces and bar plots depicting the mean charge of the current evoked by the application of 500 mM hypertonic sucrose solution for 5 s normalized to the corresponding Munc13-1 WT control. (B) Representative traces of AP-evoked EPSCs and bar plots showing the mean EPSC amplitudes normalized to the corresponding Munc13-1 WT. EPSC recordings were done at RT in 2 mM Ca2+/4 mM Mg2+. Action potentials in traces were blanked for better illustration and substituted by arrows. (C) Bar plots depicting the average vesicular release probability (Pvr) calculated for each neuron. (D) Bar plots depicting average pair-pulse ratio (PPR) with a 25 ms interpulse interval. Circles in bar plot represent values per neuron. Numbers in bars correspond to the cell number/culture number. Significance and p-values were determined by comparison with the corresponding Munc13-1 WT using the non-parametric Mann-Whitney U test. * p < 0.05; ** p < 0.01; *** p < 0.001.
-
Figure 6—source data 1
Normalized sucrose charges, normalized EPSC amplitudes, Pvrs and PPRs in Figure 6.
- https://cdn.elifesciences.org/articles/72030/elife-72030-fig6-data1-v2.xlsx
Figure 6—figure supplement 1
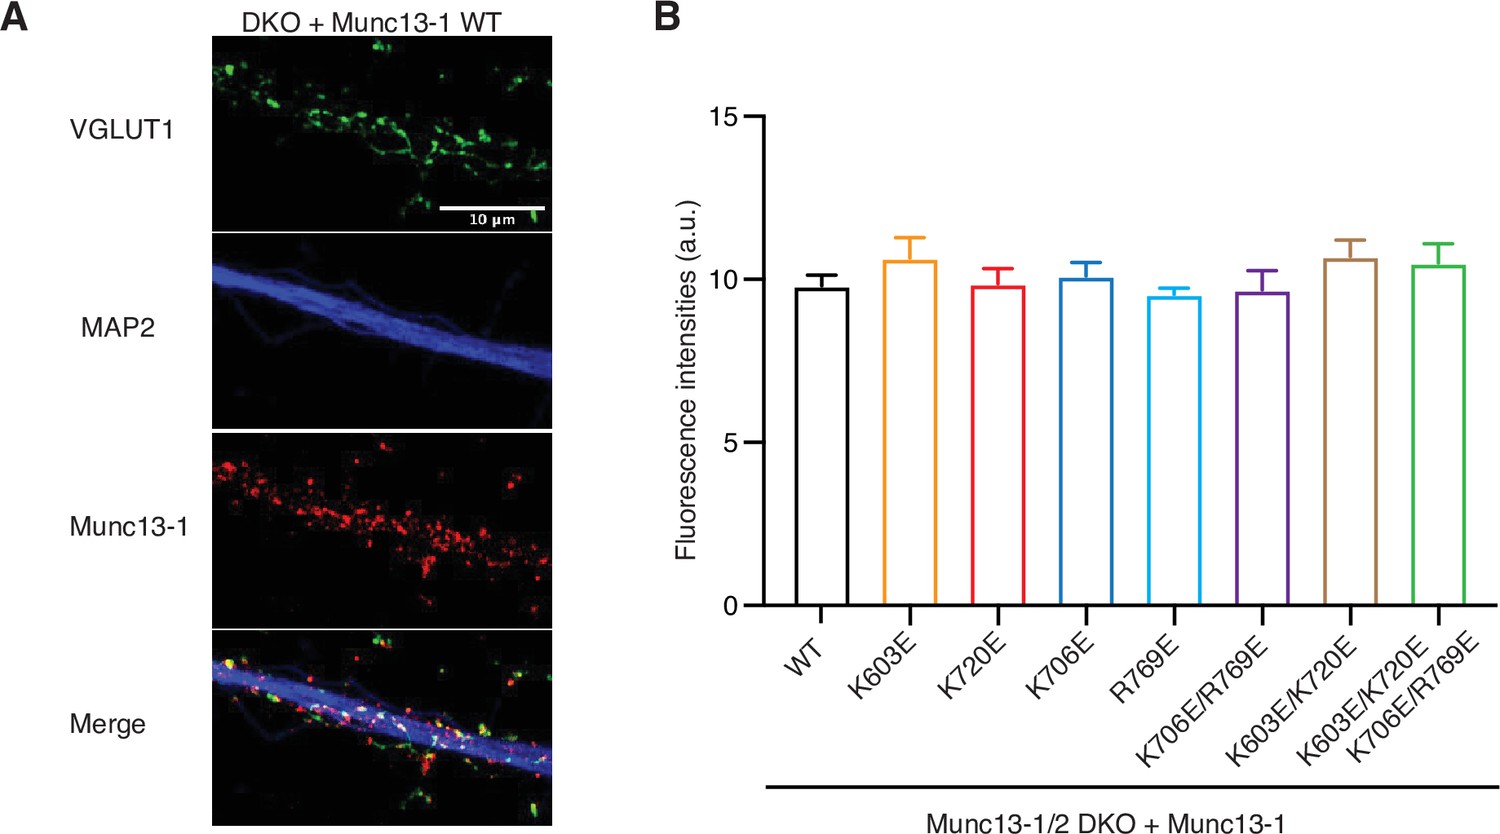
Presynaptic expression levels of Munc13-1 C1-C2B region mutants.
(A) Representative confocal images from Munc13-1/2 DKO rescued with Munc13-1 WT hippocampal neurons. Neurons were fixed and counterstained with VGLUT1, MAP2 and Munc13-1. Scale bar, 10 µm. (B) Plot of Munc13-1 fluorescence intensity levels of DKO neurons rescued with the different mutants indicated on the x-axis. Munc13-1 mean intensity values were analyzed in 50 positives VGLUT1 puncta per cell, in six different cells per group and in two independent cultures. Significances and p-values were determined using ruskal–Wallis one-way analysis of variance followed by a multiple comparison Dunn’s post hoc test.
-
Figure 6—figure supplement 1—source data 1
Fluorescence intensities in Figure 6—figure supplement 1B.
- https://cdn.elifesciences.org/articles/72030/elife-72030-fig6-figsupp1-data1-v2.xlsx
Figure 6—figure supplement 2
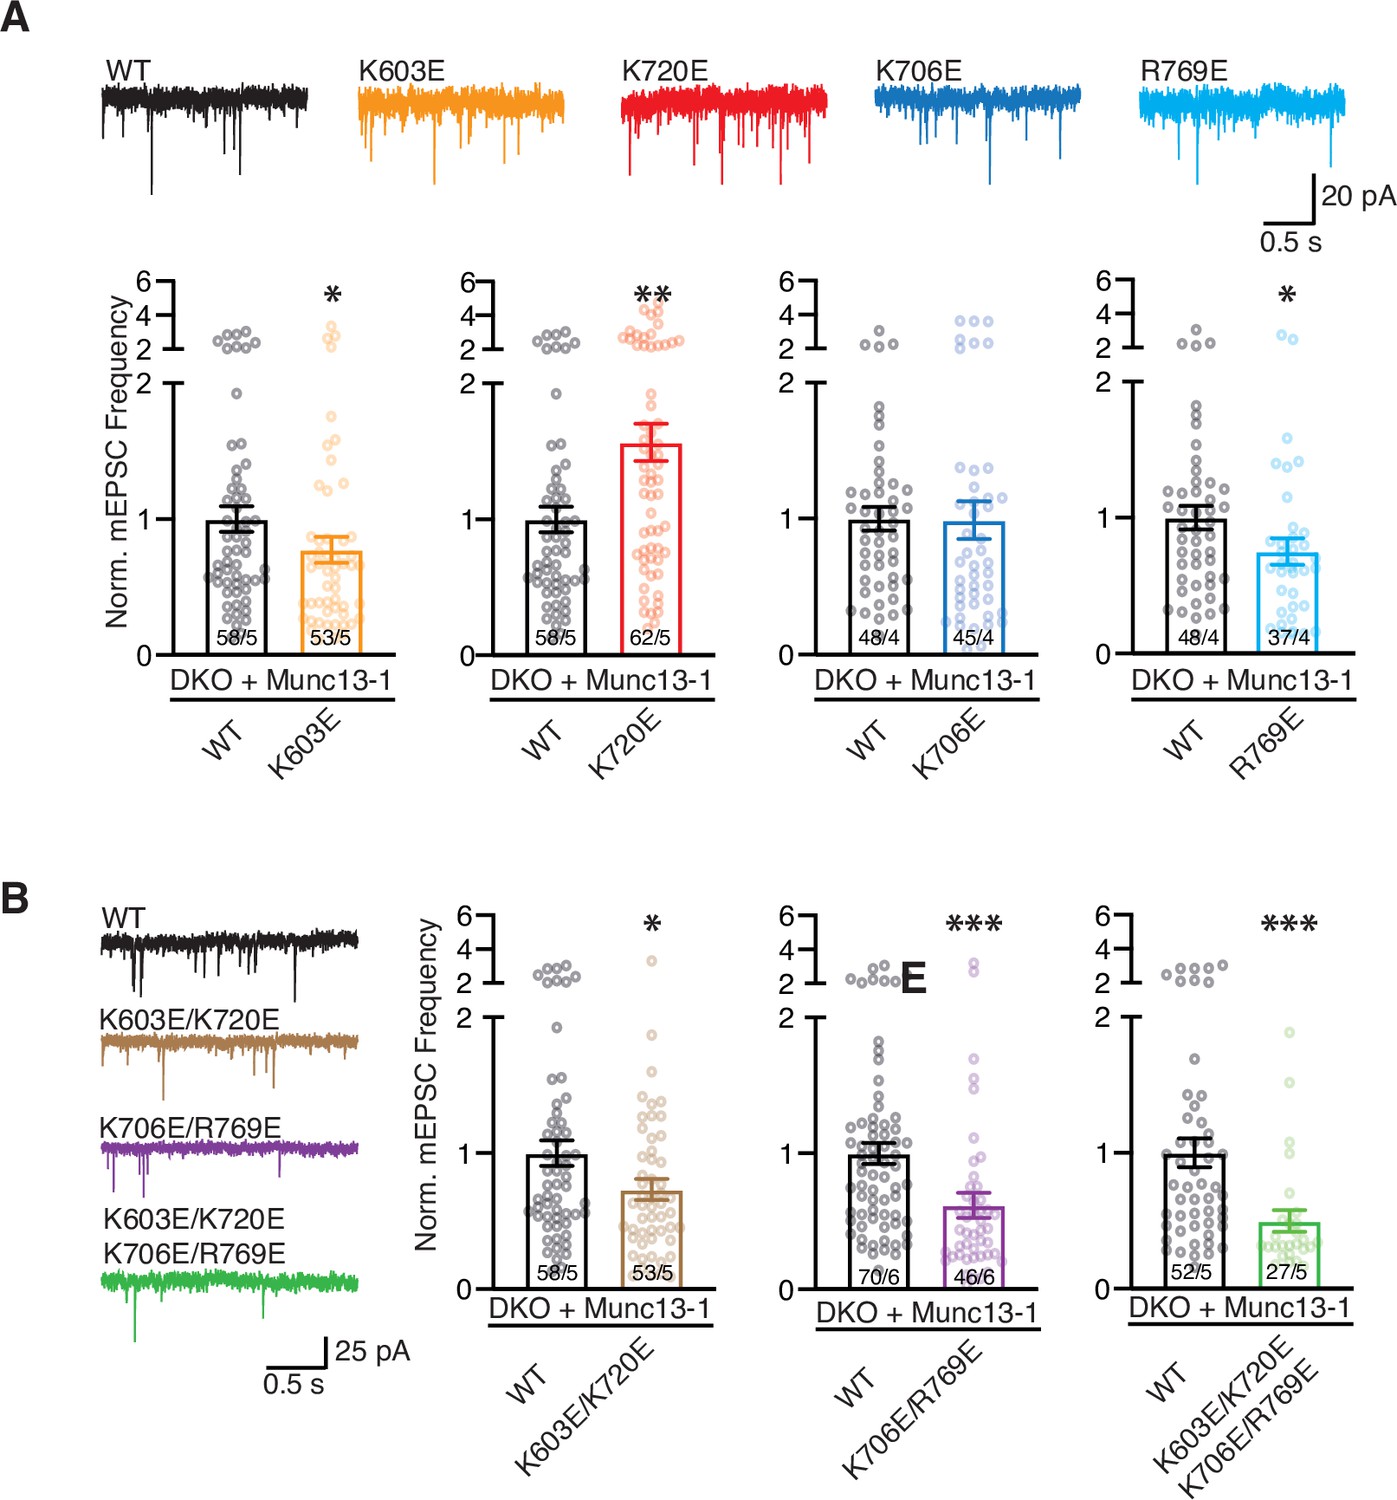
Quantification of spontaneous neurotransmitter release of point mutations within the Munc13-1 C1-C2B region.
(A) Example traces of mEPSCs and bar plot of mean frequencies normalized to the corresponding Munc13-1 WT (black) from Munc13-1 polybasic mutants: K603E (orange), K720E (red), K706E (blue), and R769 (light blue). (B) Example traces of mEPSCs and bar plot of normalized mean frequencies from the double and quadruple mutations introduced in the C1-C2B region. Circles in bar plot represented normalized values per neuron. Numbers in bars corresponded to the cell number/culture number. Significances and p-values were determined using the non-parametric Mann-Whitney U test. *p < 0.05; **p < 0.01, ***p < 0.001.
-
Figure 6—figure supplement 2—source data 1
Normalized mEPSC frequencies in Figure 6—figure supplement 2.
- https://cdn.elifesciences.org/articles/72030/elife-72030-fig6-figsupp2-data1-v2.xlsx
Figure 7

Phenotypic analyses of double and quadruple mutations within the Munc13-1 C1-C2B region.
(A) Representative sucrose-evoked synaptic current traces and bar plots of the charge currents normalized to the corresponding Munc13-1 WT control from autaptic hippocampal glutamatergic Munc13-1/2 DKO neurons rescued with Munc13-1 WT (black), Munc13-1 double point mutants, K603E/K720E (brown) or K706E/R769E (purple), or Munc13-1 quadruple point mutant K603E/K720E/K706E/R769E (green). (B) Representative AP-evoked EPSCs traces and bar plots of the normalized mean EPSC amplitudes from the groups above described. Action potentials in traces were blanked and substituted by arrows. (C) Bar plots showing the average vesicular release probability (Pvr) from the groups described in A and B. (D) Bar plots depicting average PPR at a frequency of 40 Hz. Circles in bar plot represent normalized values per neuron. Numbers in bars corresponded to the cell number/culture number. Significances and p-values were determined using the non-parametric Mann-Whitney U test. *p < 0.05; ***p < 0.001.
-
Figure 7—source data 1
Normalized sucrose charges, normalized EPSC amplitudes, Pvrs and PPRs in Figure 7.
- https://cdn.elifesciences.org/articles/72030/elife-72030-fig7-data1-v2.xlsx
Figure 8
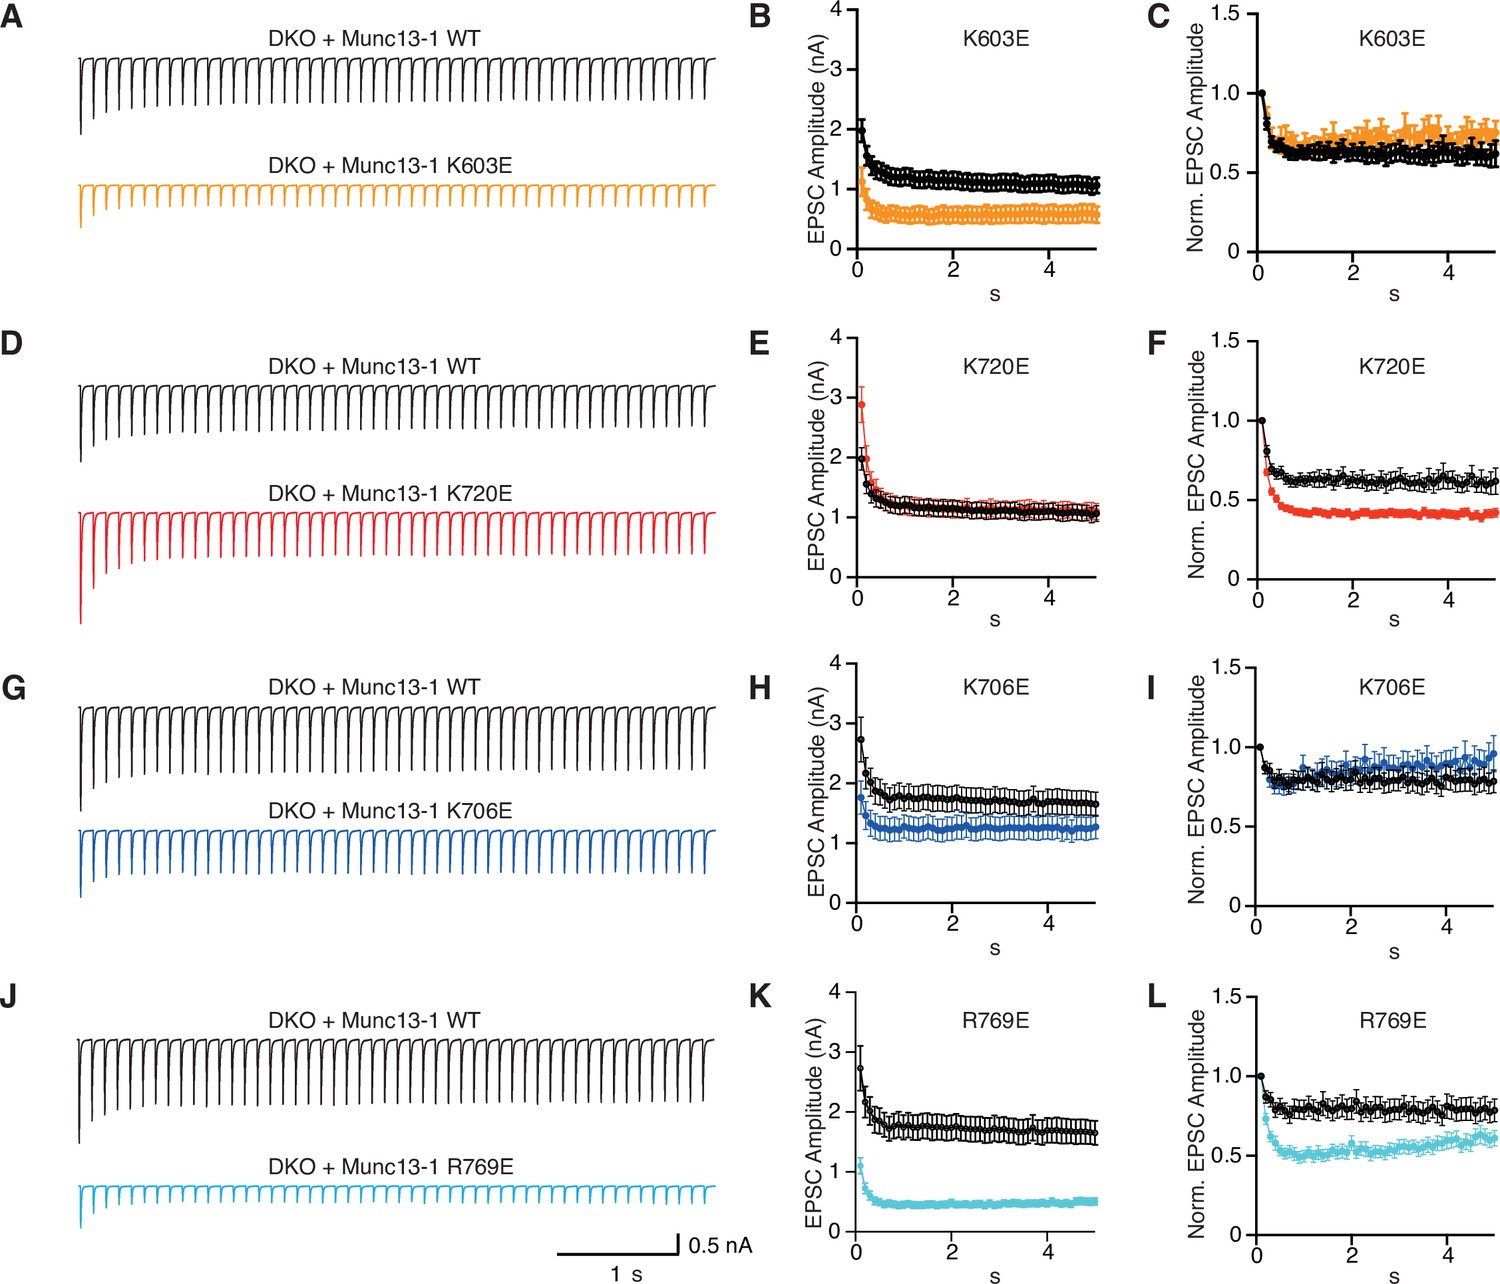
Short-term plasticity behavior of single point mutations within the Munc13-1 C1-C2B region.
(A) Average EPSC traces recorded during a 10 Hz train of 50 action potentials and summary graphs of absolute (B) and normalized (C) EPSC amplitudes of autaptic hippocampal Munc13-1/2 DKO neurons expressing Munc13-1 WT (black) n = 71/5 and Munc13-1 K603E (orange) n = 67/5. Average 10 Hz train (D) and summary graphs of absolute (E) and normalized (F) EPSC amplitudes of autaptic hippocampal Munc13-1/2 DKO neurons rescued with Munc13-1 WT (black) n = 71/5 and Munc13-1 K720E (red) n = 67/5. Average 10 Hz train (G) and summary graphs of absolute (H) and normalized (I) EPSC amplitudes of autaptic hippocampal Munc13-1/2 DKO neurons rescued with Munc13-1 WT (black) n = 54/4 and Munc13-1 K706E (blue) n = 47/4. Average 10 Hz train (J) and summary graphs of absolute (K) and normalized (L) EPSC amplitudes of autaptic hippocampal Munc13-1/2 DKO neurons rescued with Munc13-1 WT (black) n = 52/4 and Munc13-1 R769E (light blue) n = 46/4. Action potentials artifacts were blanked.
-
Figure 8—source data 1
Average EPSC amplitudes and normalized EPSC amplitudes in Figure 8.
- https://cdn.elifesciences.org/articles/72030/elife-72030-fig8-data1-v2.xlsx
Figure 9
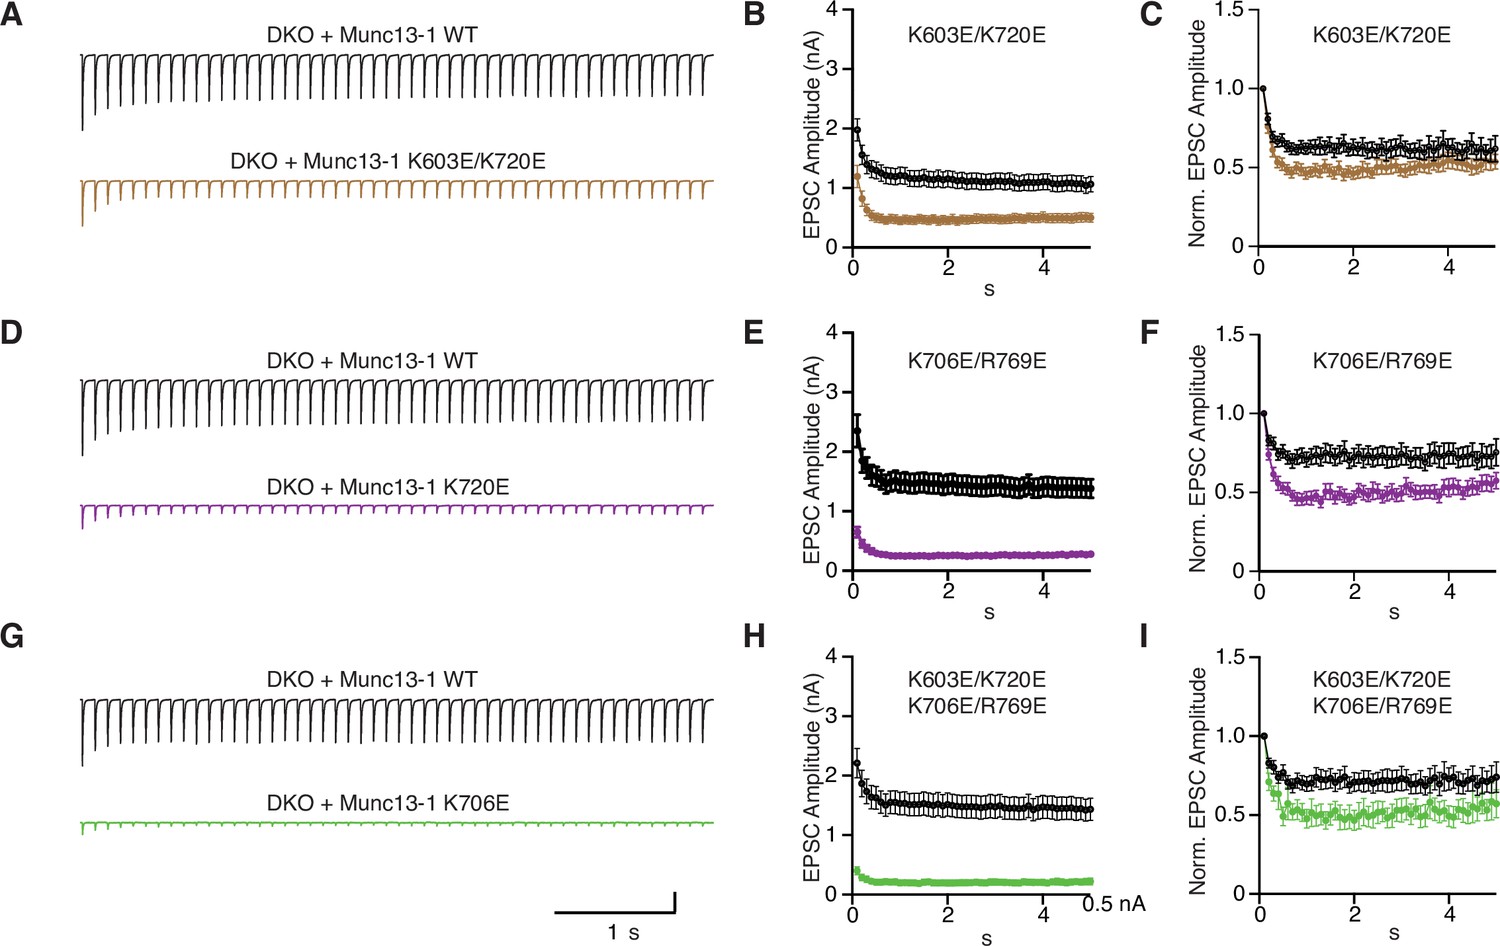
Short term plasticity behavior of combined point mutations within the Munc13-1 C1-C2B region.
(A) Average EPSC traces recorded during a 10 Hz train of 50 action potentials and summary graphs of absolute (B) and normalized (C) EPSC amplitudes from autaptic hippocampal glutamatergic Munc13-1/2 DKO neurons expressing Munc13-1 WT (black) n = 71/5 and Munc13-1 K603E/K720E (brown) n = 61/5. Average EPSC traces recorded during a 10 Hz train (D) and summary graphs of absolute (E) and normalized (F) EPSC amplitudes from autaptic hippocampal glutamatergic Munc13-1/2 DKO neurons expressing Munc13-1 WT (black) n = 77/6 and Munc13-1 K706E/R769E (purple) n = 48/6. Average 10 Hz train (G) and summary graphs of absolute (H) and normalized (I) EPSC amplitudes from autaptic hippocampal glutamatergic Munc13-1/2 DKO neurons expressing Munc13-1 WT (black) n = 65/5 and Munc13-1 K603E/K720E/K706E/R769E (green) n = 17/5. Action potential artifacts were blanked.
-
Figure 9—source data 1
Average EPSC amplitudes and normalized EPSC amplitudes in Figure 9.
- https://cdn.elifesciences.org/articles/72030/elife-72030-fig9-data1-v2.xlsx
Figure 10
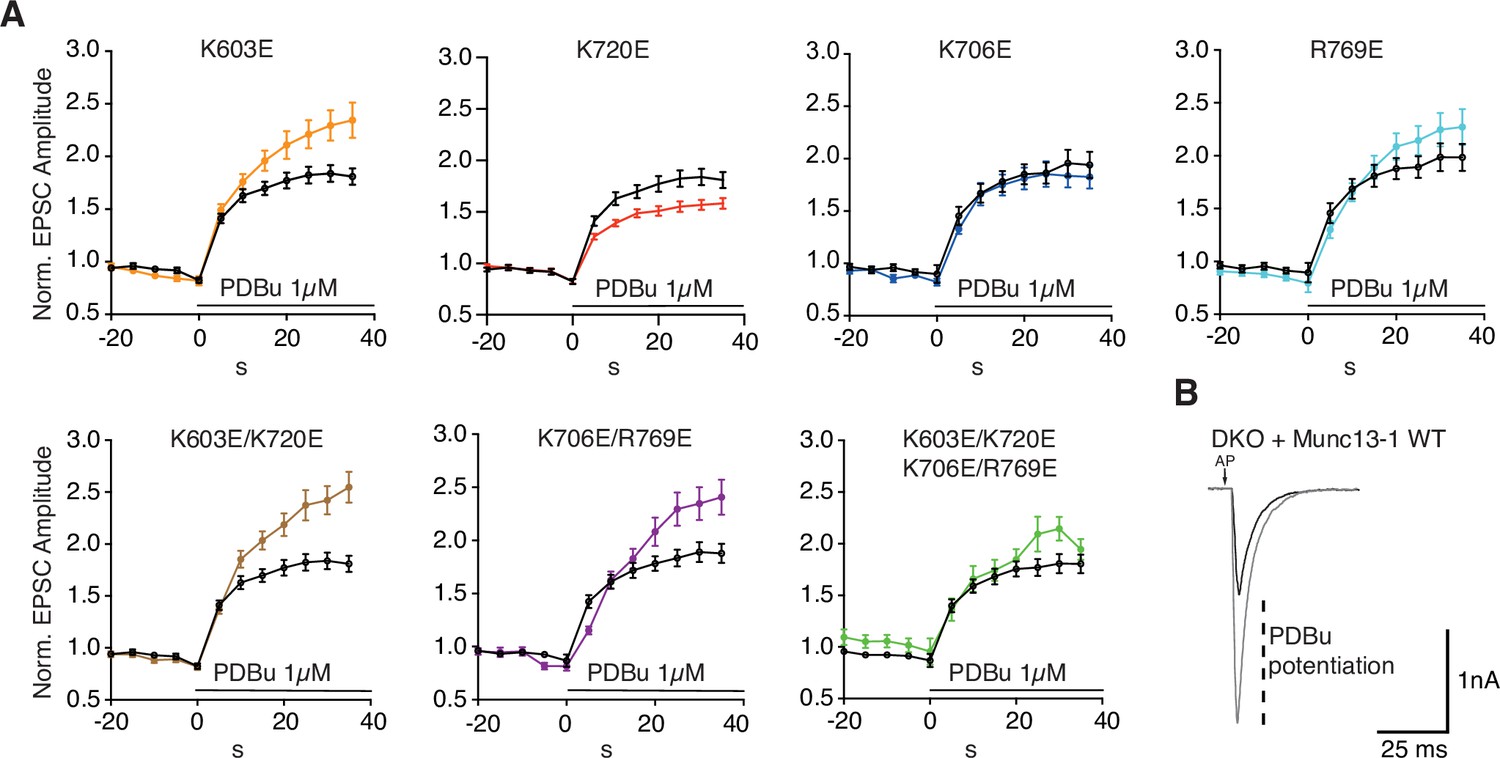
Analysis of neurotransmitter release potentiation induced by phorbol ester-activation of Munc13-1 C1 domain.
(A) Summary graphs of potentiation of EPSC amplitudes by 1 μM PDBu evoked at 0.2 Hz. EPSCs were normalized to the first EPSC amplitude recorded in extracellular solution from Munc13-1/2 DKO neurons expressing Munc13-1 WT (black) or Munc13-1 C1-C2B mutants (color code). Munc13-1 K603E (orange) n = 56/5 (WT n = 58/5), Munc13-1 K720E (red) n = 57/5 (WT n = 58/5), Munc13-1 K706E (blue) n = 40/4 (WT n = 38/4), Munc13-1 R769E (light blue) n = 38/4 (WT n = 36/4), Munc13-1 K603E/K720E (brown) n = 56/5 (WT n = 58/5) Munc13-1 K706E/R769E (purple) n = 42/6 (WT n = 57/6) and Munc13-1 K603E/K720E/K706E/R769E (green) n = 27/5 (WT n = 54/5). Solid symbols in the graph represent average normalized EPSC amplitudes ± SEM at each time point. (B) Exemplary EPSC traces from Munc13-1/2 DKO neurons expressing Munc13-1 WT before (black) and at 30 s of PDBu application (gray).
-
Figure 10—source data 1
Normalized EPSC amplitudes in Figure 10.
- https://cdn.elifesciences.org/articles/72030/elife-72030-fig10-data1-v2.xlsx
Tables
Appendix 1—key resources table
| Reagent type (species) or resource | Designation | Source or reference | Identifiers | Additional information |
|---|---|---|---|---|
| recombinant DNA reagent | Pet28a-His6-Syx1A | Ma et al., 2013 | Protein expression plasmid for E. coli (Rattus Norvegicus syntaxin-1A) | |
| recombinant DNA reagent | Pet28a-His6-SNAP-25A | Chen et al., 2006 | Protein expression plasmid for E. coli (Rattus Norvegicus SNAP-25A C84S, C85S, C90S, C92S) | |
| recombinant DNA reagent | pGEX-KT-GST-Syb | Chen et al., 2006 | Protein expression plasmid for E. coli (Rattus Norvegicus synaptobrevin 2) | |
| recombinant DNA reagent | pGEX-KG-GST-Munc18-1 | Dulubova et al., 1999 | Protein expression plasmid for E. coli (Rattus Norvegicus Munc18-1) | |
| recombinant DNA reagent | pGEX-KG-GST-NSF | Ma et al., 2013 | Protein expression plasmid for E. coli (Bos Taurus NSF V155M) | |
| recombinant DNA reagent | pGEX-KG-GST-αSNAP | Ma et al., 2013 | Protein expression plasmid for E. coli (Bos Taurus αSNAP) | |
| recombinant DNA reagent | Pet28a-His6-Munc13-1-C1C2BMUNC2C WT | Quade et al., 2019 | Protein expression plasmid for E. coli (Rattus Norvegicus Munc13-1 (529–1735, º1408–1452)) | |
| recombinant DNA reagent | Pet28a-His6-Munc13-1-C1C2BMUNC2C K603E | This paper | Protein expression plasmid for E. coli (Rattus Norvegicus Munc13-1 (529–1735, º1408–1452)) K603E | |
| recombinant DNA reagent | Pet28a-His6-Munc13-1-C1C2BMUNC2C K706E | This paper | Protein expression plasmid for E. coli (Rattus Norvegicus Munc13-1 (529–1735, º1408–1452)) K706E | |
| recombinant DNA reagent | Pet28a-His6-Munc13-1-C1C2BMUNC2C K720E | This paper | Protein expression plasmid for E. coli (Rattus Norvegicus Munc13-1 (529–1735, º1408–1452)) K720E | |
| recombinant DNA reagent | Pet28a-His6-Munc13-1-C1C2BMUNC2C R769E | This paper | Protein expression plasmid for E. coli (Rattus Norvegicus Munc13-1 (529–1735, º1408–1452)) R769E | |
| recombinant DNA reagent | Pet28a-His6-Munc13-1-C1C2BMUNC2C K603E, K720E | This paper | Protein expression plasmid for E. coli (Rattus Norvegicus Munc13-1 (529–1735, º1408–1452)) K603E, K720E | |
| recombinant DNA reagent | Pet28a-His6-Munc13-1-C1C2BMUNC2C K706E, R769E | This paper | Protein expression plasmid for E. coli (Rattus Norvegicus Munc13-1 (529–1735, º1408–1452)) K706E, R769E | |
| recombinant DNA reagent | Pet28a-His6-Munc13-1-C1C2BMUNC2C K603E, K706E, K720E, R769E | This paper | Protein expression plasmid for E. coli (Rattus Norvegicus Munc13-1 (529–1735, º1408–1452)) K603E, K706E, K720E, R769E | |
| recombinant DNA reagent | pLenti_f(syn)-NLS-GFP-P2A-Munc13-1-Flag | Liu et al., 2016 | Rescue construct protein expression plasmid for neurons (Rattus Norvegicus Munc13-1) | |
| recombinant DNA reagent | pLenti_f(syn)-NLS-GFP-P2A-Munc13-1 K603E-Flag | This paper | Rescue construct protein expression plasmid for neurons (Rattus Norvegicus Munc13-1 K603E) | |
| recombinant DNA reagent | pLenti_f(syn)-NLS-GFP-P2A-Munc13-1 K706E-Flag | This paper | Rescue construct protein expression plasmid for neurons (Rattus Norvegicus Munc13-1 K706E) | |
| recombinant DNA reagent | pLenti_f(syn)-NLS-GFP-P2A-Munc13-1 K720E-Flag | This paper | Rescue construct protein expression plasmid for neurons (Rattus Norvegicus Munc13-1 K720E) | |
| recombinant DNA reagent | pLenti_f(syn)-NLS-GFP-P2A-Munc13-1 R769E-Flag | This paper | Rescue construct protein expression plasmid for neurons (Rattus Norvegicus Munc13-1 R769E) | |
| recombinant DNA reagent | pLenti_f(syn)-NLS-GFP-P2A-Munc13-1 K603E/K706E-Flag | This paper | Rescue construct protein expression plasmid for neurons (Rattus Norvegicus Munc13-1 K603E/K706E) | |
| recombinant DNA reagent | pLenti_f(syn)-NLS-GFP-P2A-Munc13-1 K720E/R769E-Flag | This paper | Rescue construct protein expression plasmid for neurons (Rattus Norvegicus Munc13-1 K720E/R769E) | |
| recombinant DNA reagent | pLenti_f(syn)-NLS-GFP-P2A-Munc13-1 K603E/K706E/K720E/ R769E-Flag | This paper | Rescue construct protein expression plasmid for neurons (Rattus Norvegicus Munc13-1 K603E/K706E/K720E/ R769E) | |
| biological sample (Unc13-a/b DKO) | Primary neuronal cultures | Varoqueaux et al., 2002 | Freshly isolated from Unc13-a/b DKO mouse embryos | |
| antibody | anti-VGLUT1(Guinea pig polyclonal) | Synaptic System | 135,304 | 1:4,000 |
| antibody | anti-MAP2(Chicken polyclonal) | Merck Millipore | AB5543 | 1:2,000 |
| antibody | anti-Munc13-1(Rabbit polyclonal) | Synaptic System | 126,103 | 1:500 |
Additional files
Download links
A two-part list of links to download the article, or parts of the article, in various formats.
Downloads (link to download the article as PDF)
Open citations (links to open the citations from this article in various online reference manager services)
Cite this article (links to download the citations from this article in formats compatible with various reference manager tools)
Control of neurotransmitter release by two distinct membrane-binding faces of the Munc13-1 C1C2B region
eLife 10:e72030.
https://doi.org/10.7554/eLife.72030


