Unconventional conservation reveals structure-function relationships in the synaptonemal complex
- School of Biological Sciences and Center for Cell and Genome Sciences, University of Utah, United States
Figures
Figure 1 with 3 supplements
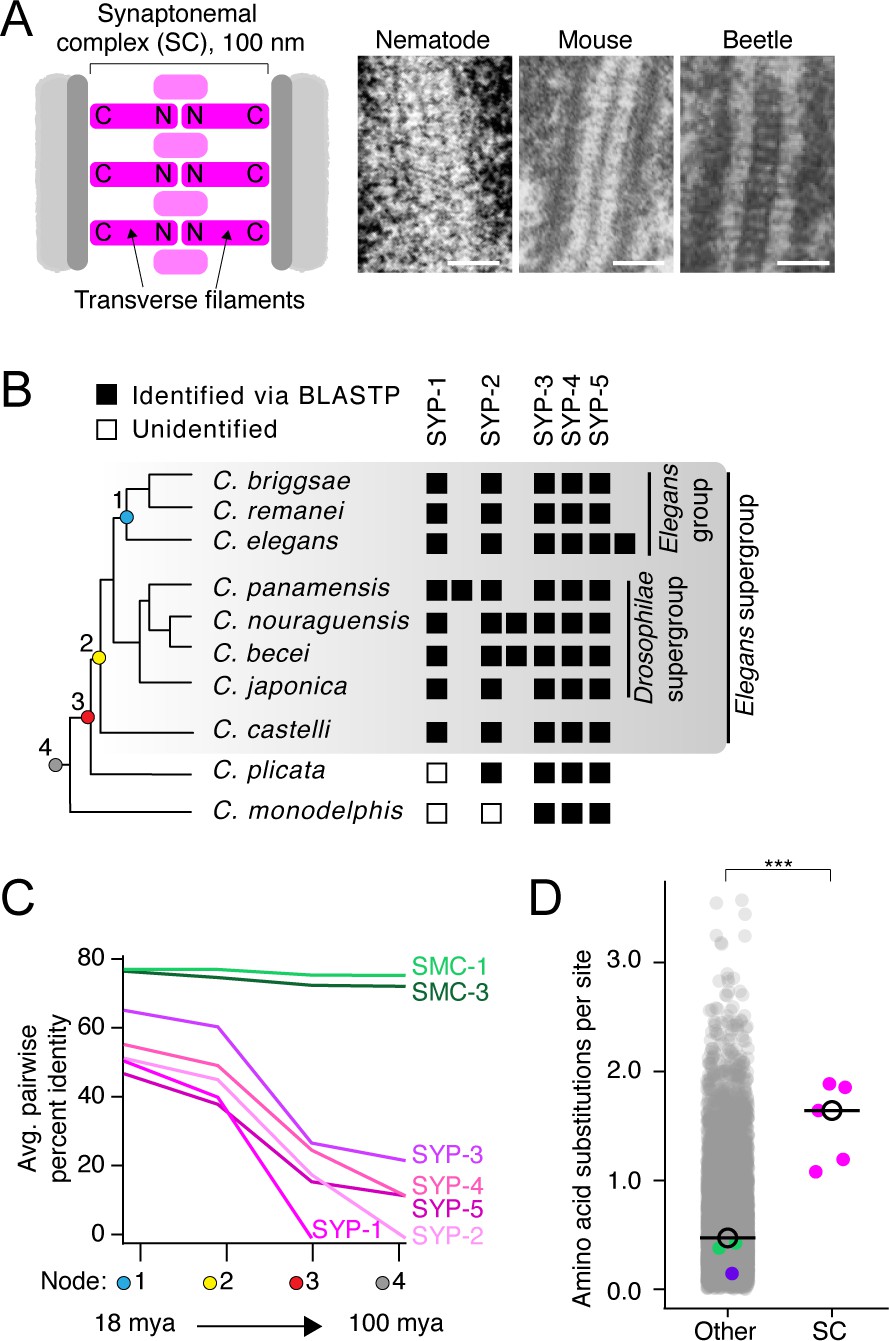
The divergence of synaptonemal complex (SC) proteins is driven by neutral evolution.
(A) Left: diagram of the SC. The N- and C-termini of transverse filaments are labeled. SC, pink;axis (scaffold for SC assembly), dark gray; chromosomes, light gray. Right: electron micrographs of the SC from nematode (C. elegans), mouse (M. musculus), and beetles (B. cribrosa), demonstrating the conserved organization and dimensions of the SC. Left image is reproduced from Figure 1 of Rog et al., 2017, center image is reproduced from Kouznetsova et al., 2011, and right image is reproduced from Figure 1 of Schmekel et al., 1993. Scale bars = 100 nm. (B) Abridged Caenorhabditis species tree. Presence of SC proteins is to the right of each species. Filled box, present; unfilled box, no ortholog identified. For full tree, see Figure 1—figure supplement 1. (C) Graph of average pairwise percent identity for SC proteins and SMC-1/3 (two chromatin-associated coiled-coil proteins) as controls. Colored nodes on the x-axis correspond to the species tree in (B). Evolutionary time increases from left to right with time estimates according to Cutter, 2008 listed below select nodes. (D) Dot plot comparing amino acid substitutions per site of SC proteins to all other Caenorhabditis proteins. Black circle, median value. The median SC amino acid substitutions per site = 1.64, other = 0.43, Wilcoxon rank sum test p-value=0.0005. SMC-1/3 (green) and LEV-11 (purple) are highlighted as controls. The high divergence of SC proteins cannot be explained by positive selection (Table 1).
© 1993, Springer-Verlag. Panel A (right image) is reproduced from Schmekel et al., 1993. It is not covered by the CC-BY 4.0 licence and further reproduction of this panel would need permission from the copyright holder.
-
Figure 1—source data 1
Syntenic location of Caenorhabditis synaptonemal complex genes.
- https://cdn.elifesciences.org/articles/72061/elife-72061-fig1-data1-v1.xlsx
-
Figure 1—source data 2
Multiple sequence alignments used in phylogenetic analysis.
- https://cdn.elifesciences.org/articles/72061/elife-72061-fig1-data2-v1.txt
-
Figure 1—source data 3
Sequences of manually curated genes.
- https://cdn.elifesciences.org/articles/72061/elife-72061-fig1-data3-v1.txt
-
Figure 1—source data 4
Multiple sequence alignments used in evolutionary analyses.
- https://cdn.elifesciences.org/articles/72061/elife-72061-fig1-data4-v1.txt
-
Figure 1—source data 5
Sequences of Caenorhabditis synaptonemal complex proteins.
- https://cdn.elifesciences.org/articles/72061/elife-72061-fig1-data5-v1.txt
Figure 1—figure supplement 1
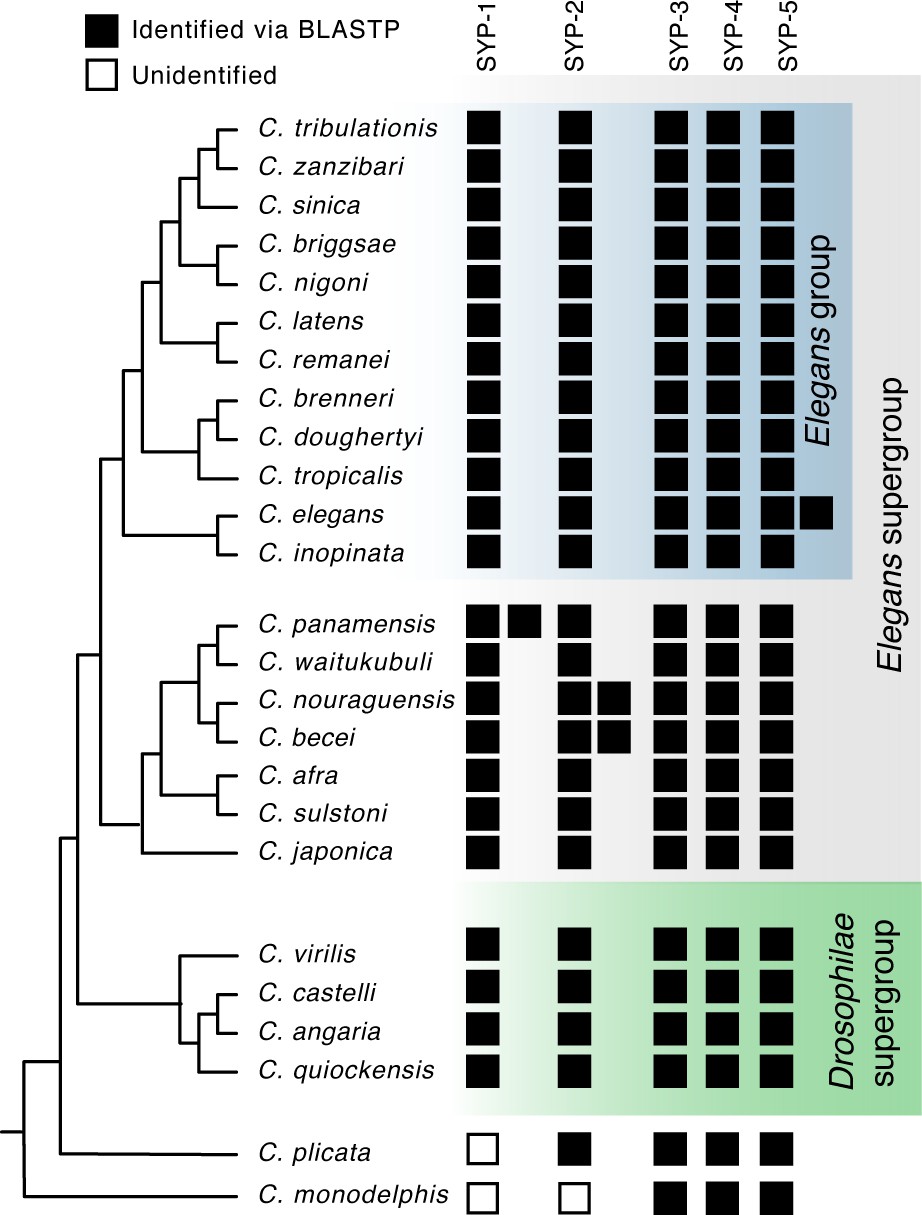
Identification of Caenorhabditis synaptonemal complex proteins.
Caenorhabditis species tree including all species investigated in this study. Presence of SC proteins is listed to the right of each species. Filled box, present; unfilled box, no ortholog could be identified. Related to Figure 1B.
Figure 1—figure supplement 2
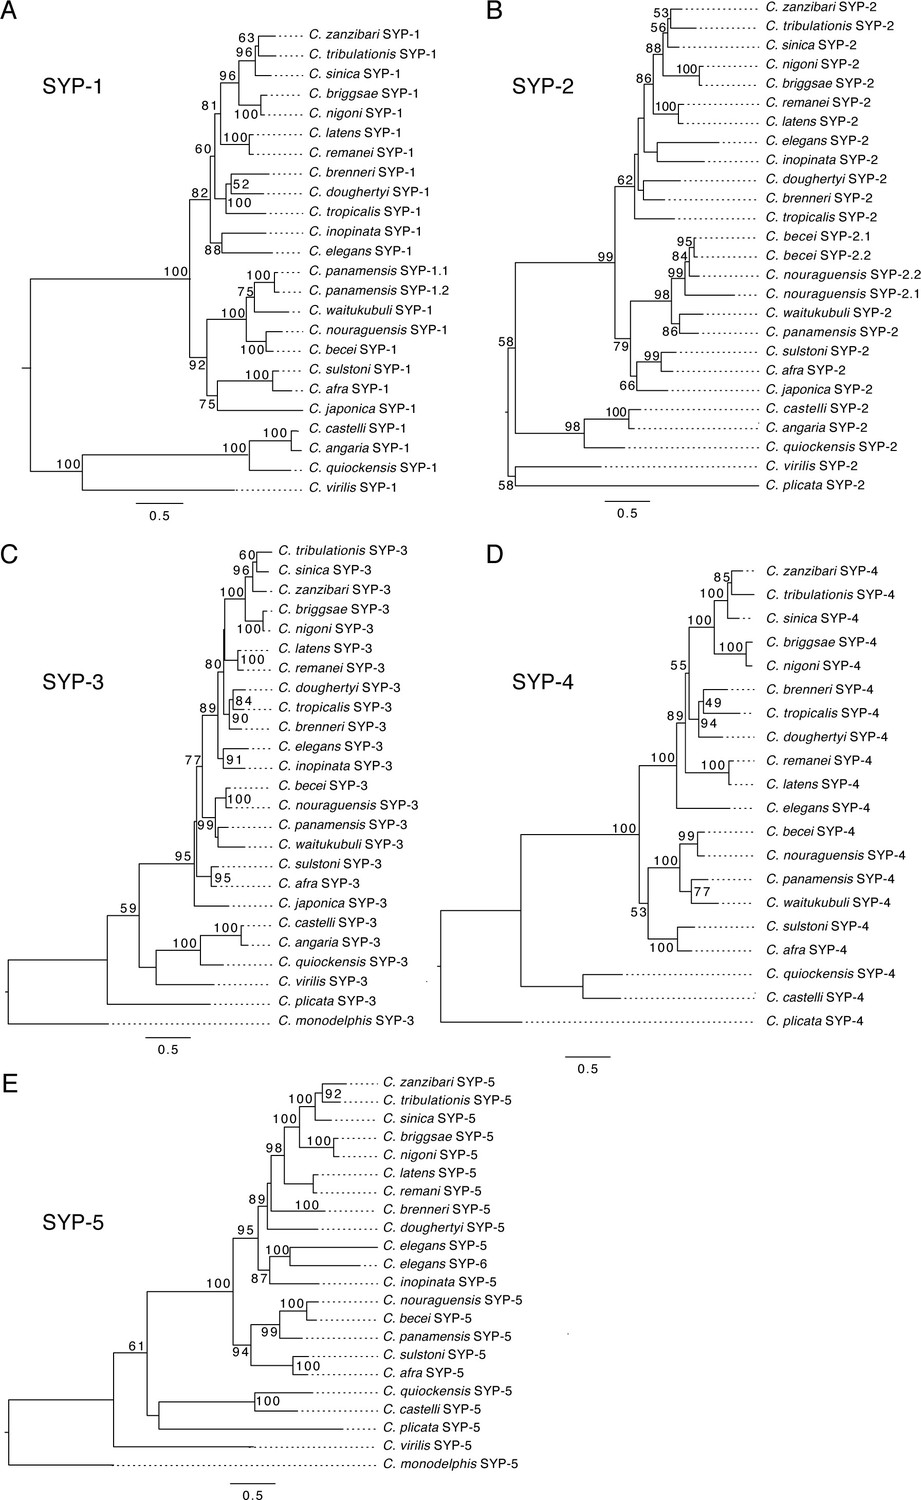
Maximum likelihood phylogenies of Caenorhabditis synaptonemal complex proteins.
Maximum likelihood phylogenies of SYP-1 (A), SYP-2 (B), SYP-3 (C), SYP-4 (D), and SYP-5 (E). Each phylogeny is rooted on the common ancestor of Caenorhabditis. Bootstrap values above 50 are displayed at each node. Scale bar represents amino acid substitutions per site.
Figure 1—figure supplement 3
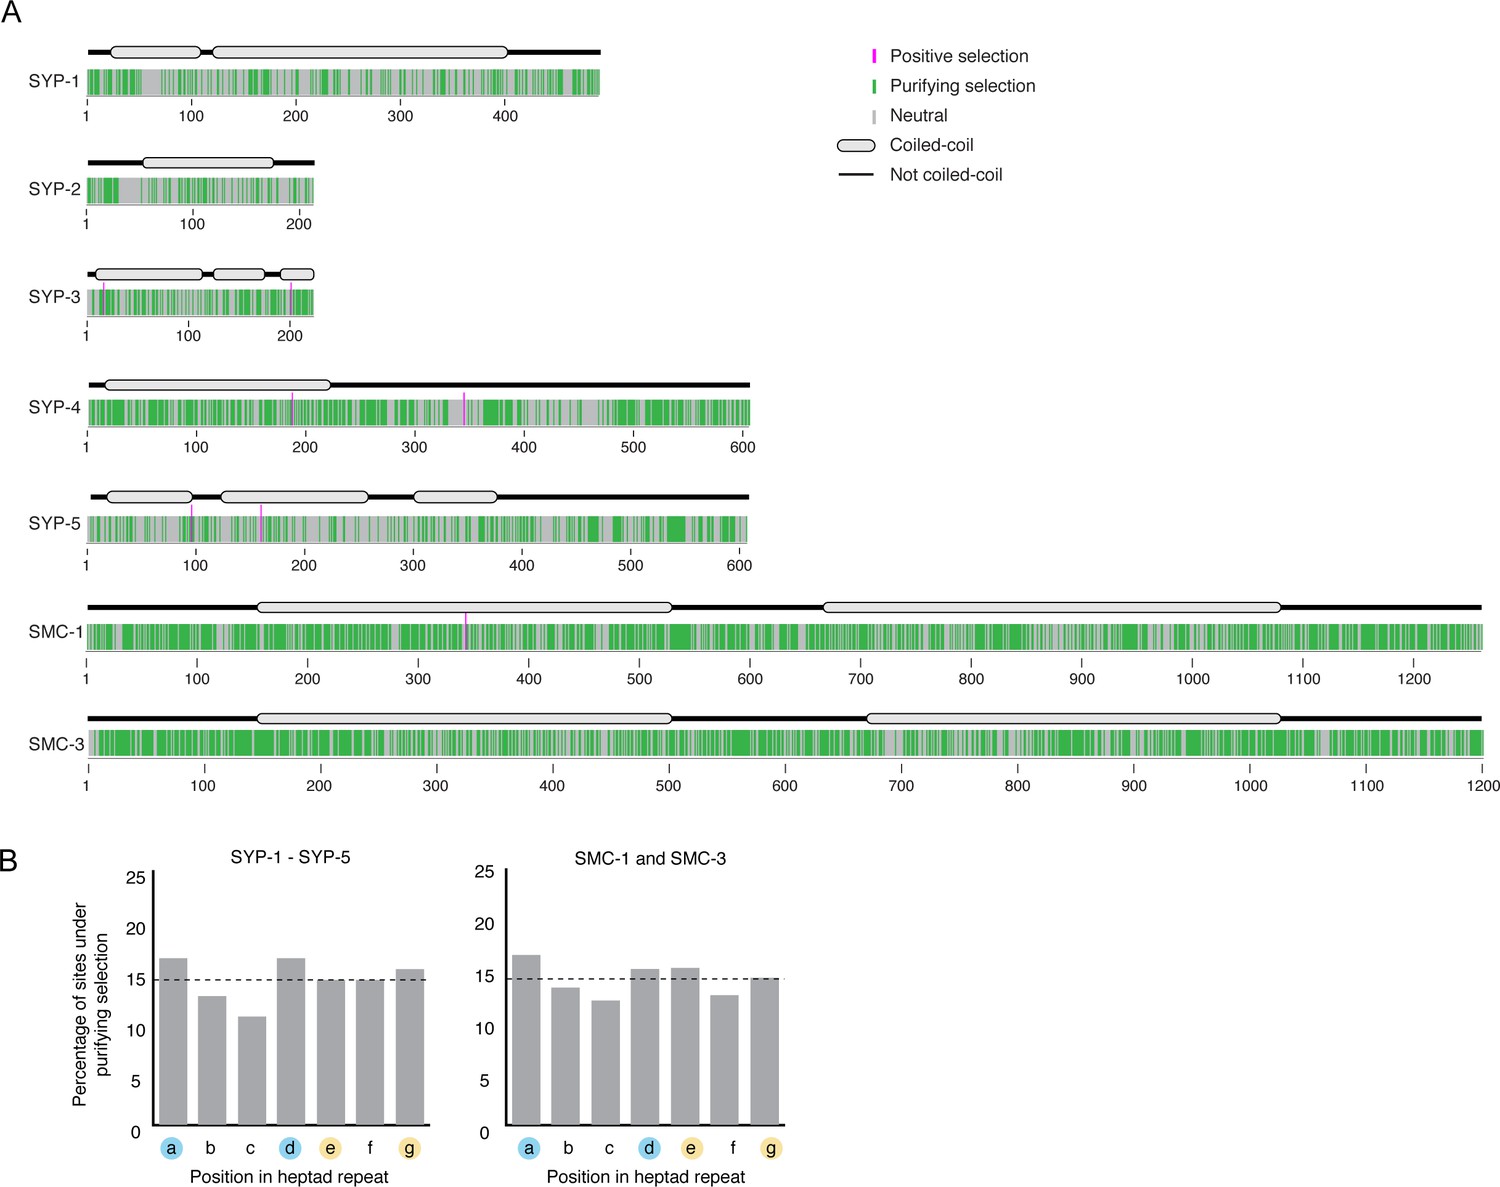
Map of sites of under purifying, neutral, or positive selection.
(A) Map of sites under positive (pink), purifying (green), or neutral selection (gray) identified using Fixed Effects Likelihood model from HyPhy for SYP-1–SYP-5 and SMC-1/3. Gene models showing conserved coiled-coils (gray ovals) are shown above. (B) Graph of percentage of sites within coiled-coil domains evolving under purifying selection. Consistent with the requirements for coiled-coils – hydrophobic amino acids in positions 1 and 4 (designated a and d, blue circles) and charged or polar amino acids in positions 5 and 7 (designated e and g, yellow circles) – we found an enrichment of sites under purifying selection in the first, fourth, and seventh (a, d, and g) positions of SYP-1–SYP-5, and in the first, fourth, and fifth (a, d, and e) positions of SMC-1/3. However, these differences were not statistically significant (SYP-1–SYP-5 p-value=0.12, SMC-1/3 p-value=0.15). Horizontal dashed line indicates the expected percentage if sites under purifying selection were randomly distributed.
Figure 2 with 2 supplements
Protein length and coiled-coil domains are conserved features of synaptonemal complex proteins.
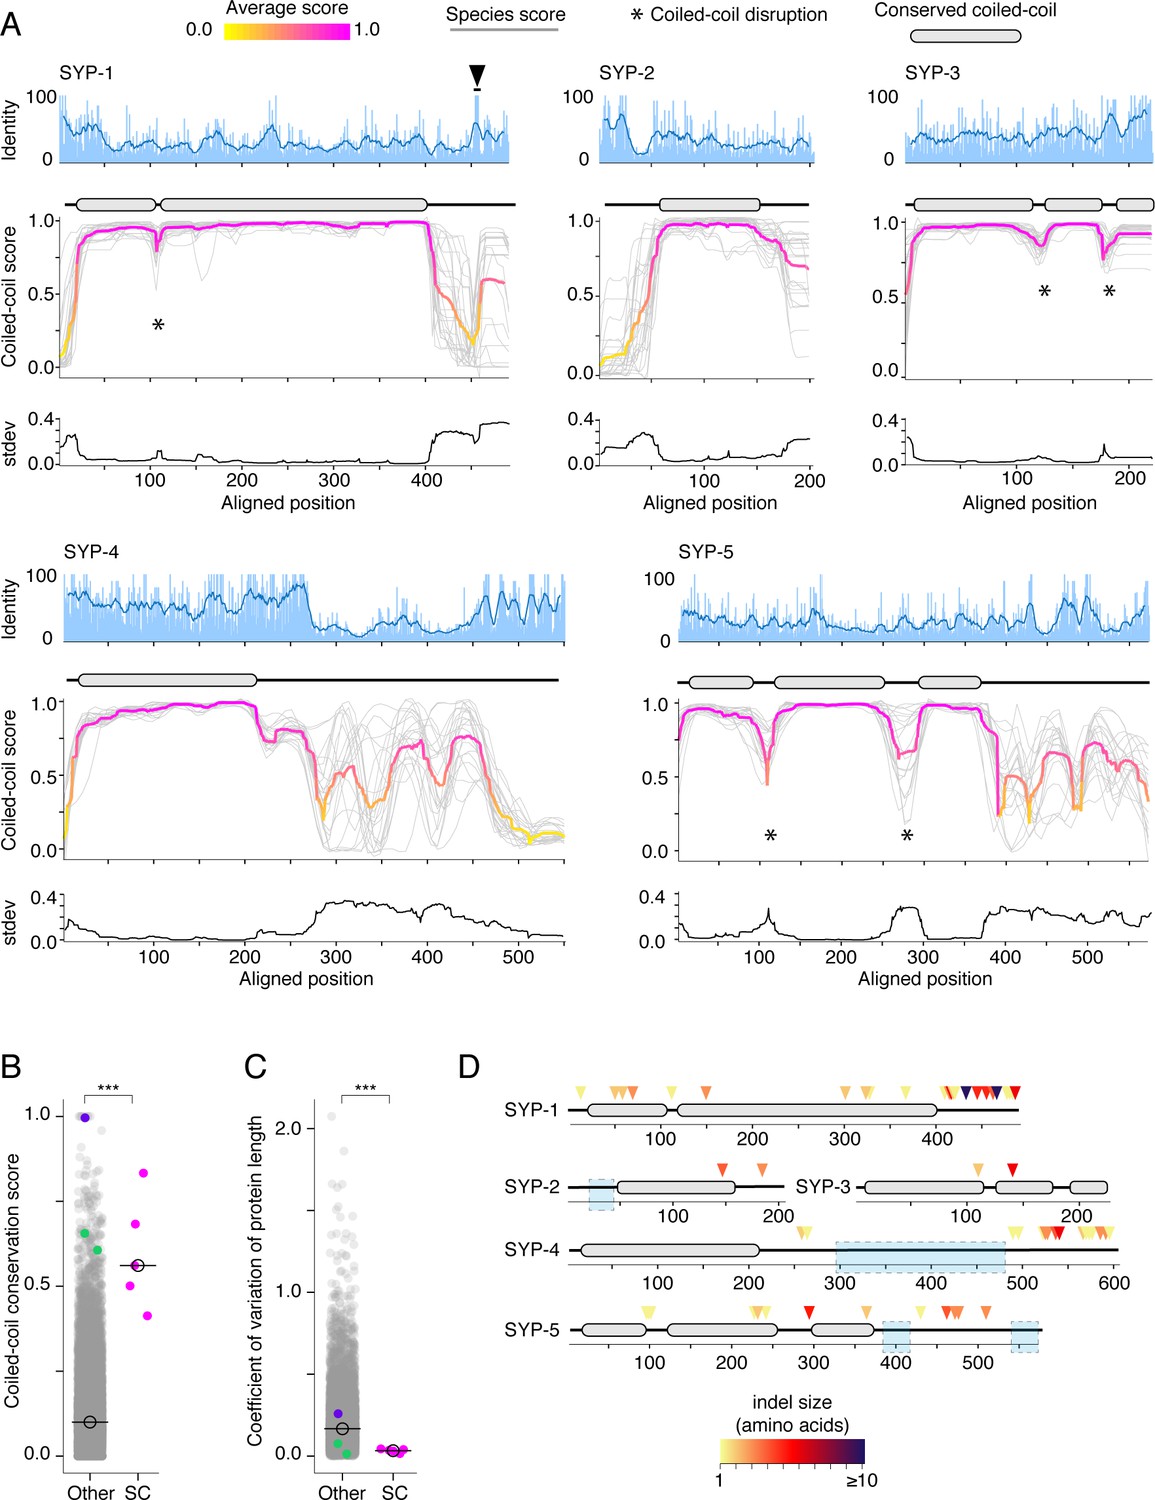
(A) Percent amino acid identity (top), coiled-coil score (middle), and standard deviation of coiled-coil score (bottom) at each aligned position for SYP-1–SYP-5. Sliding window average of percent identity is shown (blue line). Coiled-coil conservation plots display the coiled-coil score (1 – Paircoil2 score) at each aligned position for all SYP proteins from each species (gray lines). Magenta and yellow lines, average score at each position. Gene models depicting conserved coiled-coil domains (gray-filled ovals) are shown above each coiled-coil conservation plot. The black arrowhead indicates the conserved Polo-Box Domain in SYP-1 (Sato-Carlton et al., 2018). Note that coiled-coil conservation is generally not reflected in elevated (or diminished) amino acid identity with the exception of SYP-4. (B) Dot plot comparing the coiled-coil conservation score of SC proteins to all other proteins in Caenorhabditis. The coiled-coil conservation score is the average minimum value of the coiled-coil score (1 – Paircoil2 score) for each position. Median coiled-coil conservation score for SC proteins = 0.56, median for all other proteins = 0.12. Wilcoxon rank sum test p-value=0.00019. (C) Dot plot comparing coefficient of variation of protein length of SC proteins to all other proteins in Caenorhabditis. Median for SC proteins = 0.04, median for all other proteins = 0.16. Wilcoxon rank sum test p-value=0.0004. SMC-1/3 (green) and LEV-11 (purple) are shown as controls in (B) and (C). LEV-11 (tropomyosin) coiled-coil conservation score of 0.996 is consistent with the importance of coiled-coils for its function (Hitchcock-DeGregori, 2008). (D) Indels in Elegans supergroup SC proteins. Gene model of SYP-1–SYP-5 coiled-coil domains with indel positions marked with colored arrowheads, with darker reds indicating larger indels. Light blue boxes surround regions that were excluded from analysis due to alignment uncertainty.
-
Figure 2—source data 1
Multiple sequence alignments used in indel analysis.
- https://cdn.elifesciences.org/articles/72061/elife-72061-fig2-data1-v1.txt
-
Figure 2—source data 2
Phylogenetic trees used in indel analysis.
- https://cdn.elifesciences.org/articles/72061/elife-72061-fig2-data2-v1.txt
Figure 2—figure supplement 1
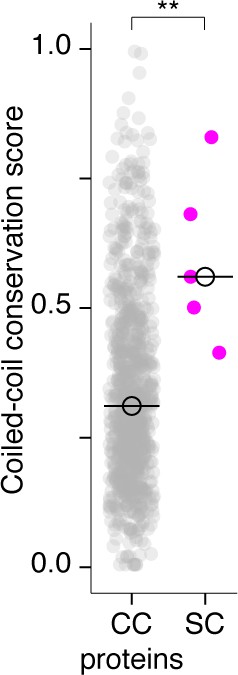
Synaptonemal complex proteins have a significantly higher coiled-coil conservation score than other coiled-coil proteins.
Dot plot comparing the coiled-coil conservation score of SC proteins to all other coiled-coil proteins in Caenorhabditis (CC proteins). See Materials and methods for criteria used for selection of coiled-coil proteins. Median coiled-coil conservation score for SC proteins = 0.56, median for CC proteins = 0.31. Wilcoxon rank sum test p-value=0.0052.
Figure 2—figure supplement 2
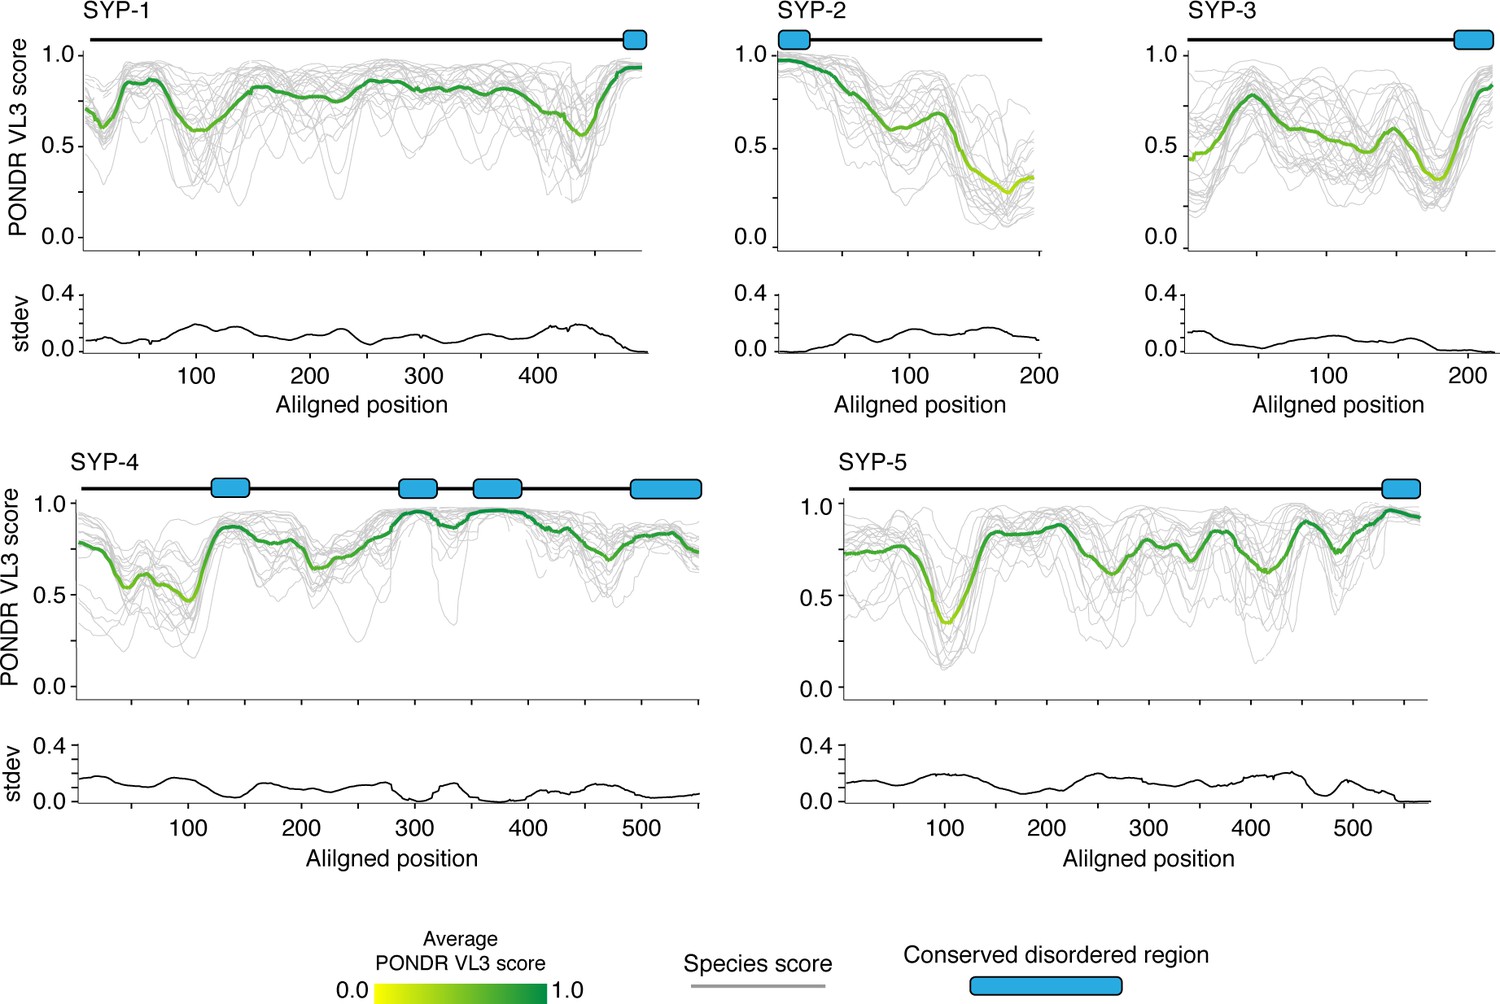
Synaptonemal complex proteins have limited regions of conserved disorder.
PONDR VL3 score (top) and standard deviation of VL3 score (bottom) at each aligned position for SYP-1–SYP-5. Green and yellow lines, average score at each position; gray lines, scores for each species. Gene models depicting conserved disordered domains (blue-filled ovals) are shown above each PONDR VL3 plot.
Figure 3 with 4 supplements

Synaptonemal complex proteins have an unconventional, but conserved, evolutionary signature.
3D scatter plot comparing amino acid substitutions per site, coefficient of variation of protein length, and coiled-coil conservation score of all proteins in 25 Caenorhabditis species (A), 30 Drosophila species (B), and 15 mammalian species (C). SC proteins, pink dots with vertical lines; other proteins, gray dots. Gene models of SC proteins depicting conserved coiled-coils derived from conservation plots (Figure 2, Figure 3—figure supplements 2 and 3) are shown below each scatter plot.
-
Figure 3—source data 1
Proteomes used to generate 3D scatter plots.
- https://cdn.elifesciences.org/articles/72061/elife-72061-fig3-data1-v1.xlsx
-
Figure 3—source data 2
Genomic sequence of L. africana SYCE3 from UCSC Genome Browser.
Note sequence ambiguities.
- https://cdn.elifesciences.org/articles/72061/elife-72061-fig3-data2-v1.xlsx
Figure 3—figure supplement 1
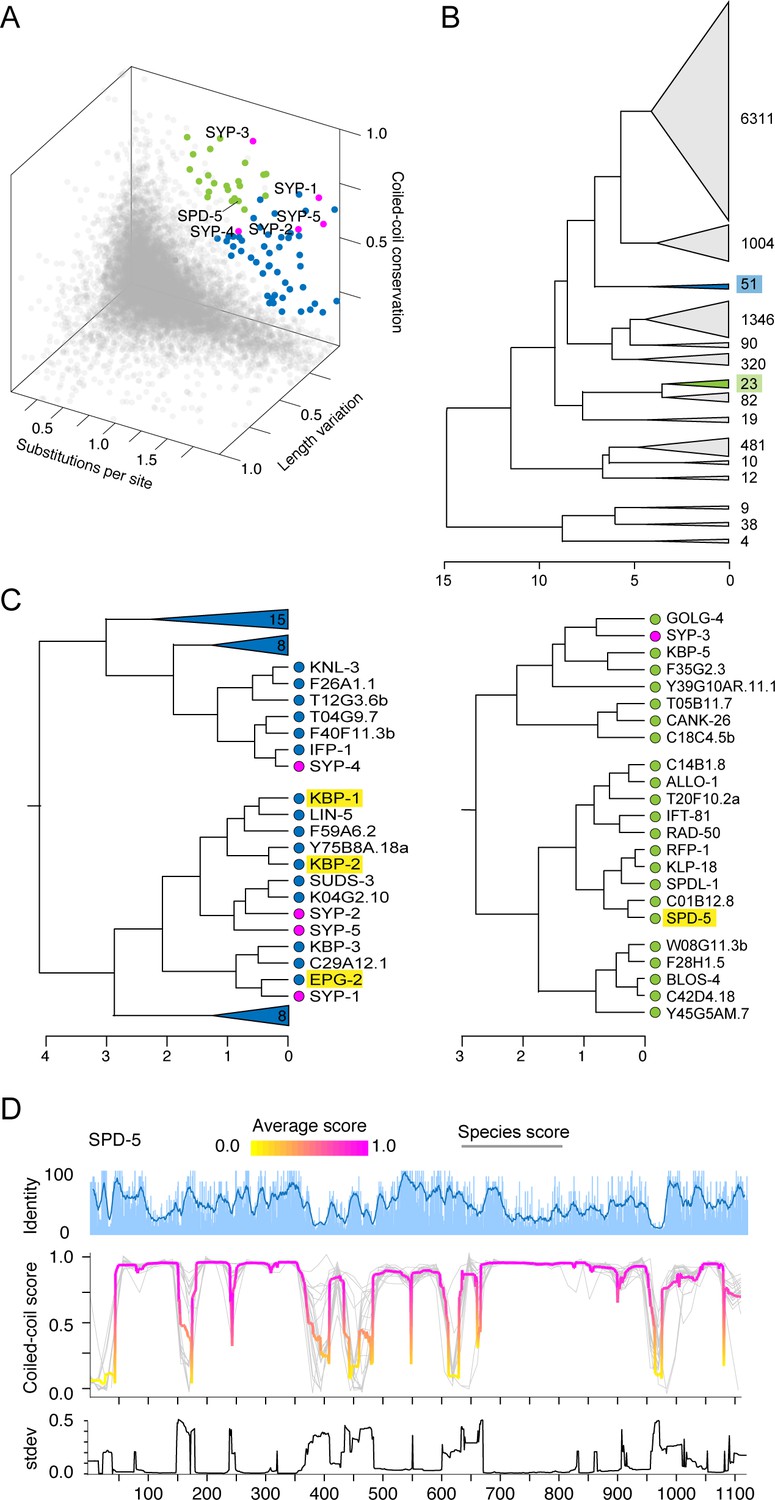
Synaptonemal complex proteins have an unconventional evolutionary signature.
(A) 3D scatter plot from Figure 3A reprinted with proteins that cluster with SC proteins based on hierarchical clustering highlighted in blue and green. (B) Hierarchical clustering of all Caenorhabditis proteins based on amino acid substitutions per site, coiled-coil conservation score, and coefficient of variation of protein length. SC proteins cluster outside of the main clusters of 6311 and 1004 proteins. Blue and green highlighted clusters contain SC proteins. (C) Partially expanded clusters containing SC proteins from (B), similarly colored in blue and green. Gene names are listed at the tip of each branch. Enrichment analysis of the clusters containing SC proteins identified enrichment of proteins involved in mitotic spindle organization (highlighted in yellow, p-value=0.0079), including SPD-5. (D) Sliding window percent identity and coiled-coil plot for SPD-5. Gray lines, individual species score; magenta and yellow lines, average score at each position. Note conservation of the coiled-coils and disruptions in them, despite overall low sequence identity.
Figure 3—figure supplement 2
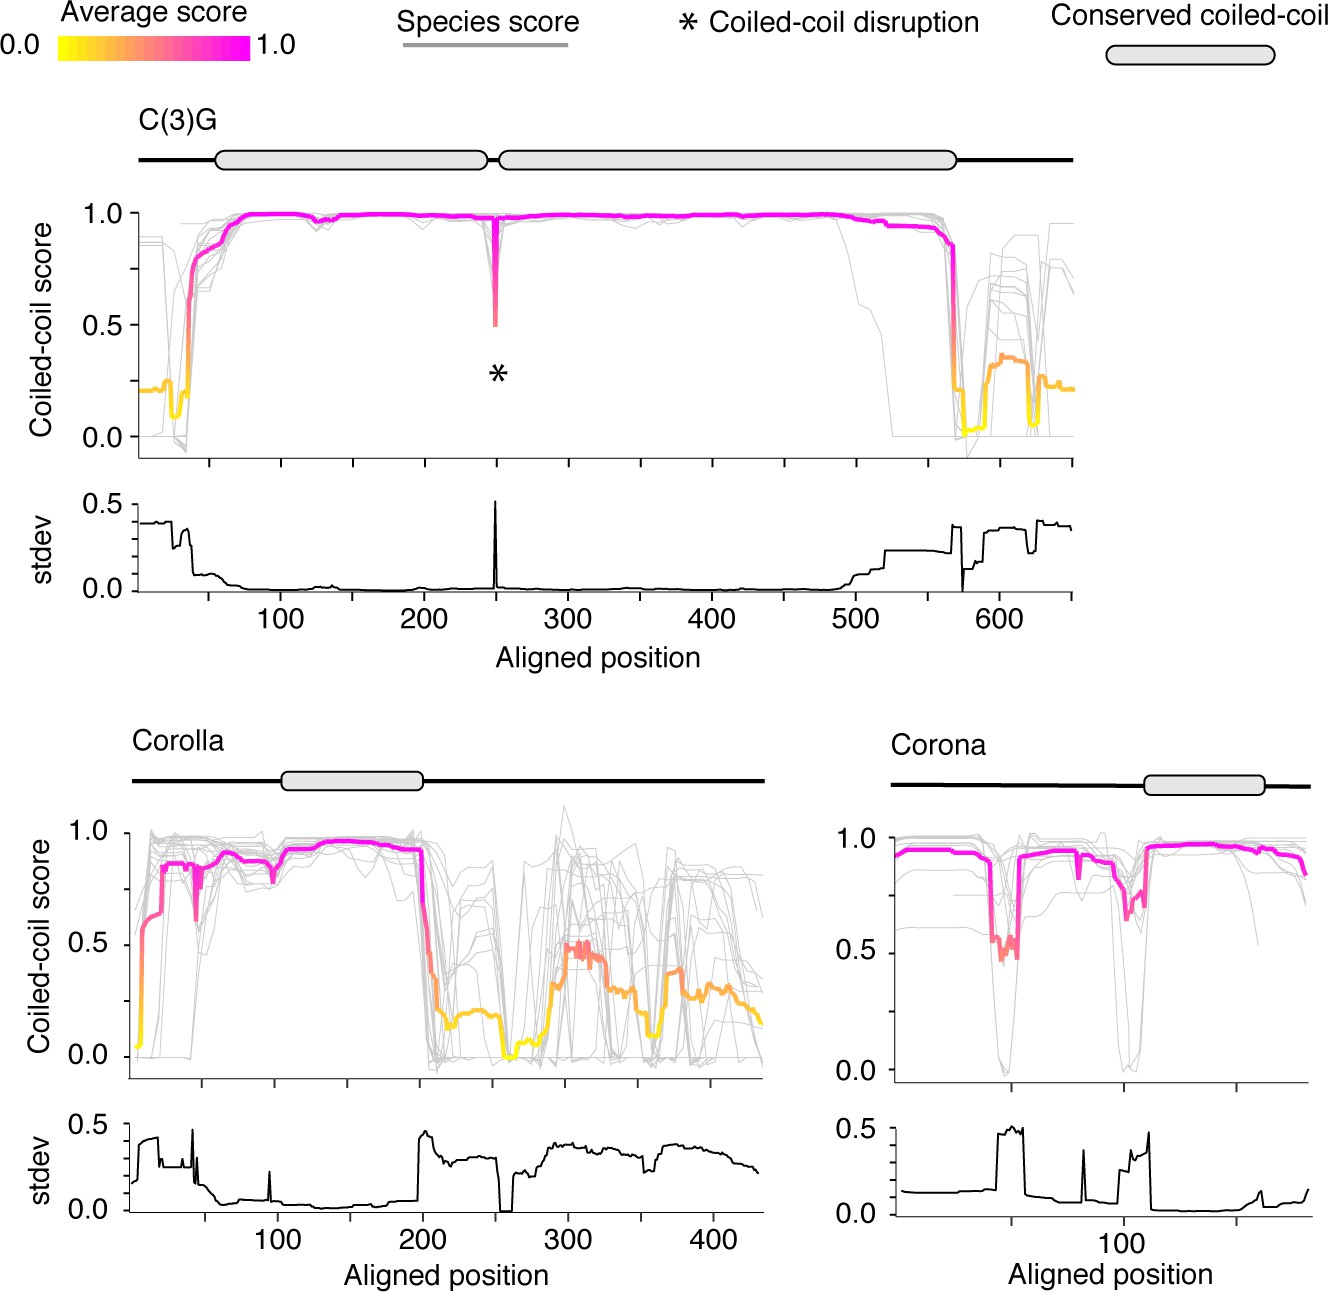
Coiled-coil plots for Drosophila synaptonemal complex proteins.
Coiled-coil plots for C(3)G, Corolla and Corona used to identify conserved coiled-coil domains (gray ovals) displayed in Figure 3. Gray lines, individual species score; magenta and yellow lines, average score at each position. Standard deviation of coiled-coil score is shown below each coiled-coil plot.
Figure 3—figure supplement 3
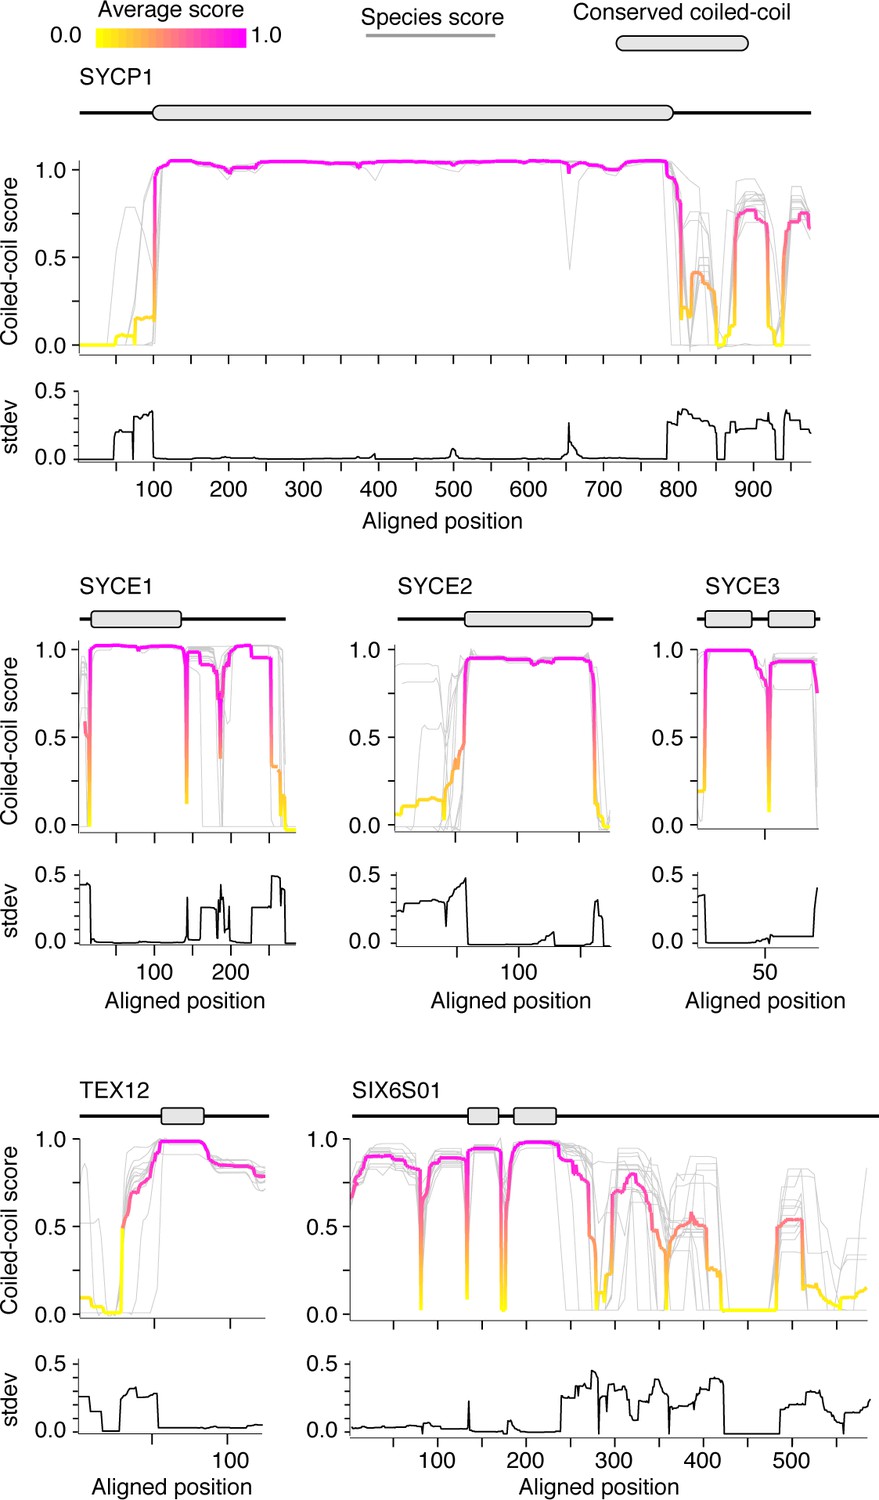
Coiled-coil plots for mammalian synaptonemal complex proteins.
Coiled-coil plots for SYCP1, SYCE1–3, TEX12, and SIX6S01 used to identify conserved coiled-coil domains (gray ovals) displayed in Figure 3C. Gray lines, individual species score; magenta and yellow lines, average score at each position. Standard deviation of coiled-coil score is shown below each coiled-coil plot.
Figure 3—figure supplement 4
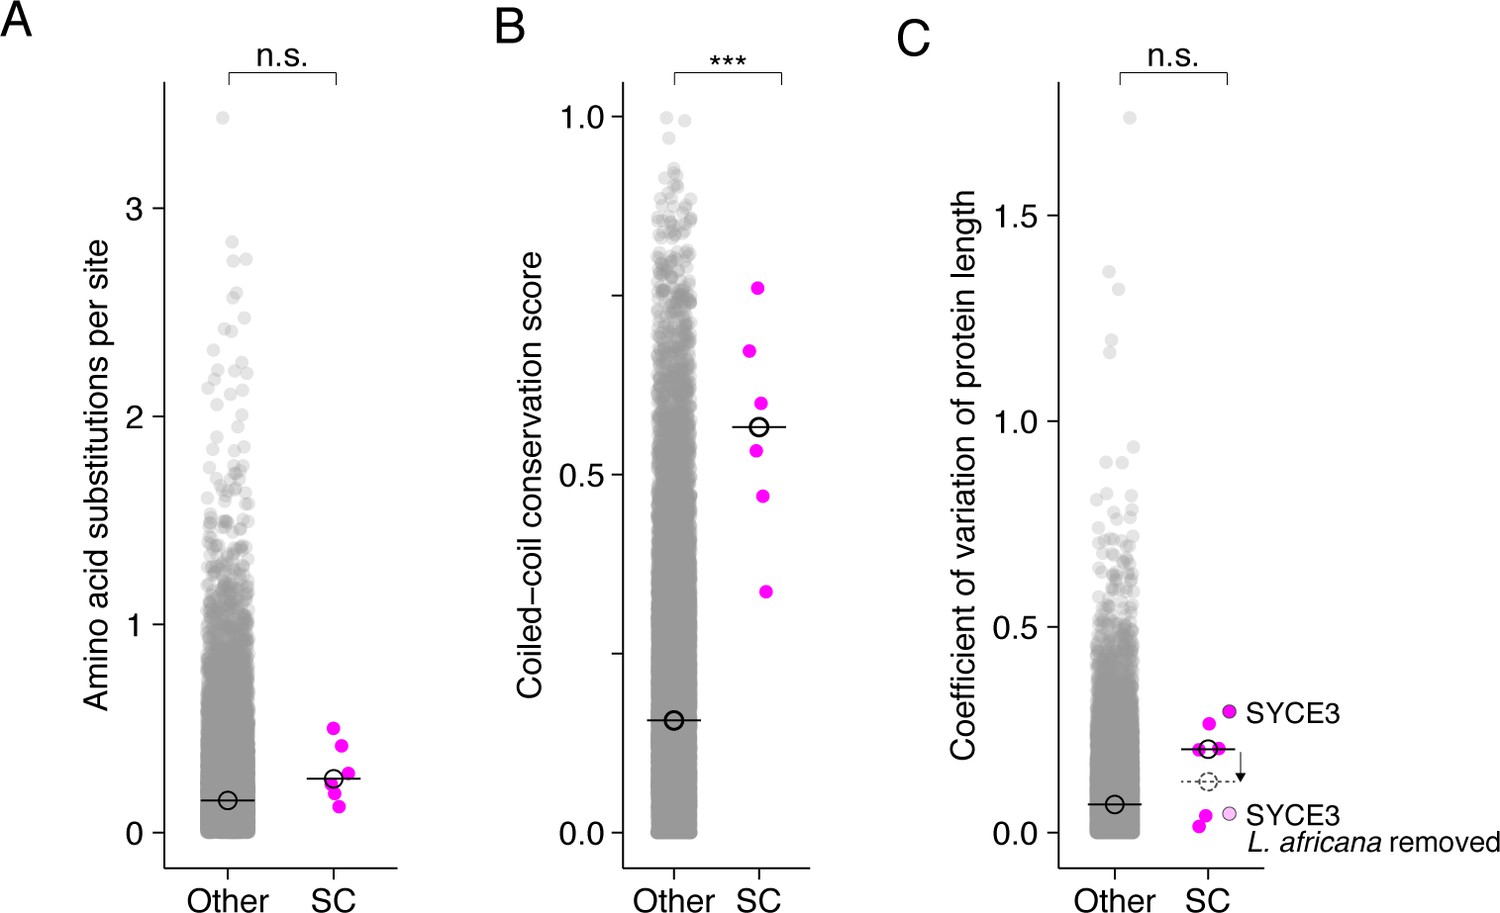
Mammalian synaptonemal complex proteins display a similar, albeit weaker, evolutionary signature.
Dot plot comparing amino acid substitutions per site (A), coiled-coil conservation score (B), and coefficient of variation of protein length (C) of mammalian SC proteins to all other mammalian proteins. Median values are shown on all plots with an open black circle with a line through it. Only the comparison of coiled-coil conservation scores (B) revealed a significant difference between SC proteins and other proteins. (Median coiled-coil conservation score for SC proteins = 0.57, other = 0.16. Wilcoxon rank sum test p-value=0.00011.) Comparisons in (A) and (C) were not significant (n.s.). In (C), we provide an example of how annotation errors could impact results; the SYCE3 orthogroup with and without (light pink) L. africana SYCE3, which contains predicted N- and C-terminal extensions. The dashed open circle indicates the median value when L. africana SYCE3 is excluded.
Figure 4 with 4 supplements
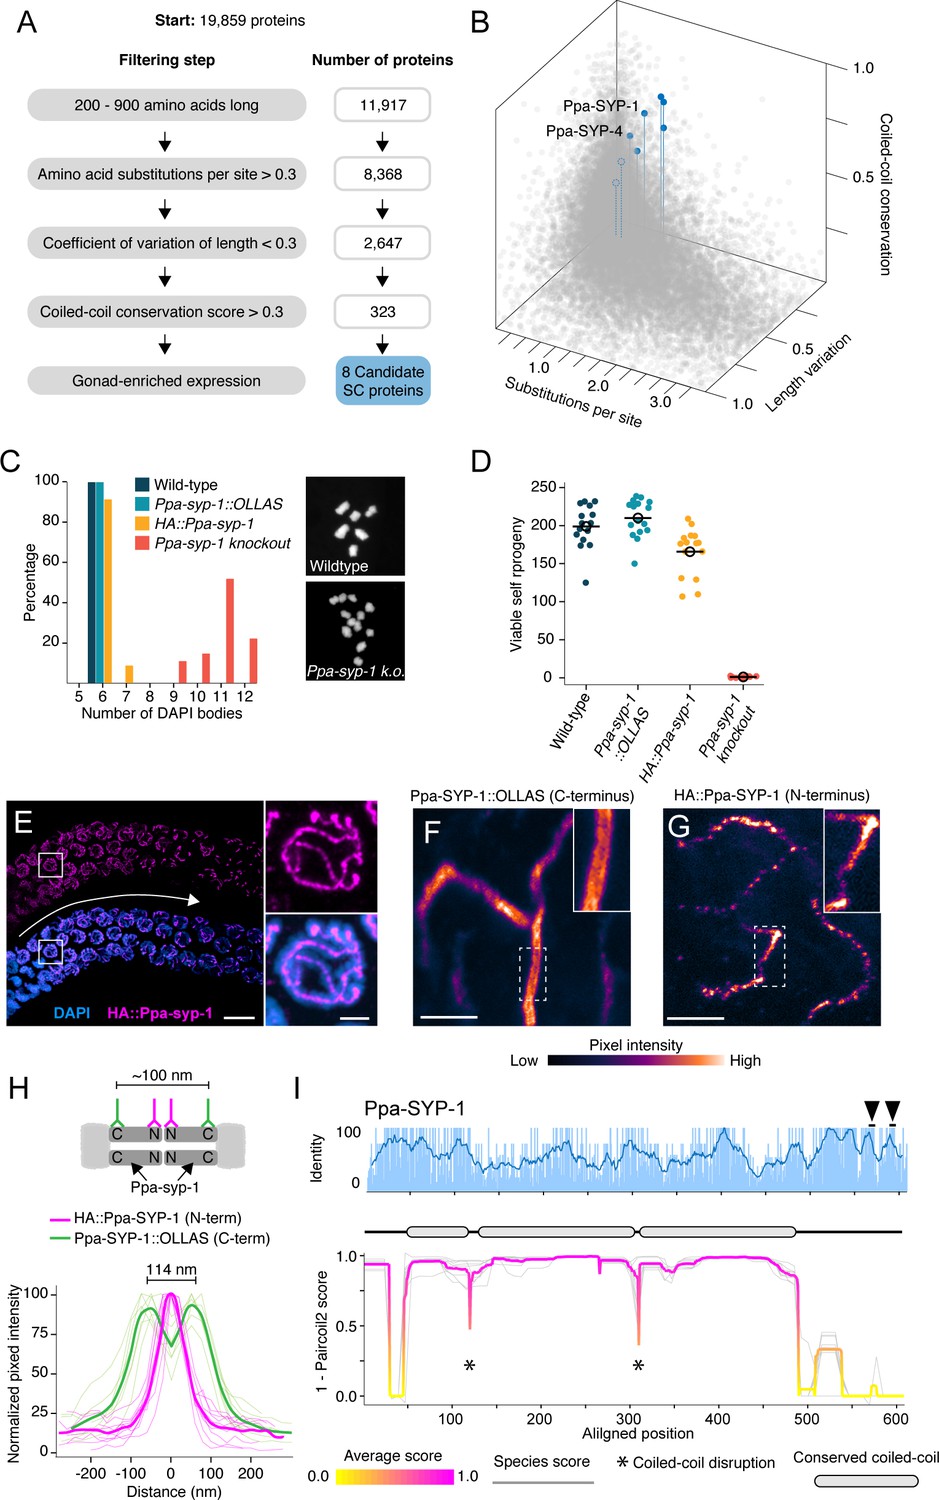
Identification of P. pacificus SYP-1.
(A) Flow chart of filtering steps to identify candidate synaptonemal complex proteins in Pristionchus, with the number of remaining proteins after each step shown to the right. See Materials and methods for details. (B) 3D scatter plot comparing amino acid substitutions per site, coefficient of variation of protein length, and coiled-coil conservation score of all Pristionchus proteins. Blue dots, candidate SC proteins; other, gray dots. (C, D) Number of DAPI bodies (C) and total viable self-progeny (D) from wild-type P. pacificus, Ppa-syp-1::OLLAS, HA::Ppa-syp-1, and Ppa-syp-1 knockout hermaphrodites. In (C), representative DAPI body images are shown for wild-type and Ppa-syp-1 knockout. (E) Left: image of a prophase region of a gonad from a HA::Ppa-syp-1 hermaphrodite where meiosis progresses from left to right (white arrow), stained with antibodies against HA (magenta). Scale bar = 5 μm, scale bar in inset = 2 μm. (F, G) STED images of a representative chromosome from Ppa-syp-1::OLLAS (F, C-terminus) and HA::Ppa-syp-1 (G, N-terminus) hermaphrodites stained with antibodies against OLLAS or HA tags, respectively (colored according to pixel intensity). Insets show higher magnification of sections in the dashed boxes. Note the ‘railroad tracks’ configuration in (F). Scale bars in (F, G) = 1 μm. (H) Top: model depicting Ppa-SYP-1 as a transverse filament protein, with antibodies targeting the C- and N-termini. Expected distance between C-terminal epitopes is ~100 nm. N-terminal epitopes are expected to be too close to be resolved. Bottom: line scans of normalized pixel intensity across the SC in Ppa-SYP-1::OLLAS (green) and HA::Ppa-SYP-1 (magenta). Bold green and magenta lines represent the average of multiple line scans. (I) Average pairwise percent amino acid identity (top) and coiled-coil score (bottom) for Ppa-SYP-1 from eight Pristionchus species. Sliding window average of percent identity is shown (blue line). Observable steps in the percent identity bar graphs are attributed to fewer species in the Pristionchus proteome dataset (8 Pristionchus species vs. 25 Caenorhabditis species in Figure 2). Magenta and yellow lines in coiled-coil plot, average score at each position; gray lines, individual species scores. Gene model depicting conserved coiled-coil domains (gray-filled ovals) is shown above the coiled-coil plot. Black arrowheads point to two Polo-Box Domains in Ppa-SYP-1, which are conserved in Pristionchus.
-
Figure 4—source data 1
Sequences of CRISPR reagents.
- https://cdn.elifesciences.org/articles/72061/elife-72061-fig4-data1-v1.xlsx
-
Figure 4—source data 2
Protein sequences of SYP-1 and SYP-2 candidates from C. plicata and C. monodelphis.
- https://cdn.elifesciences.org/articles/72061/elife-72061-fig4-data2-v1.txt
Figure 4—figure supplement 1
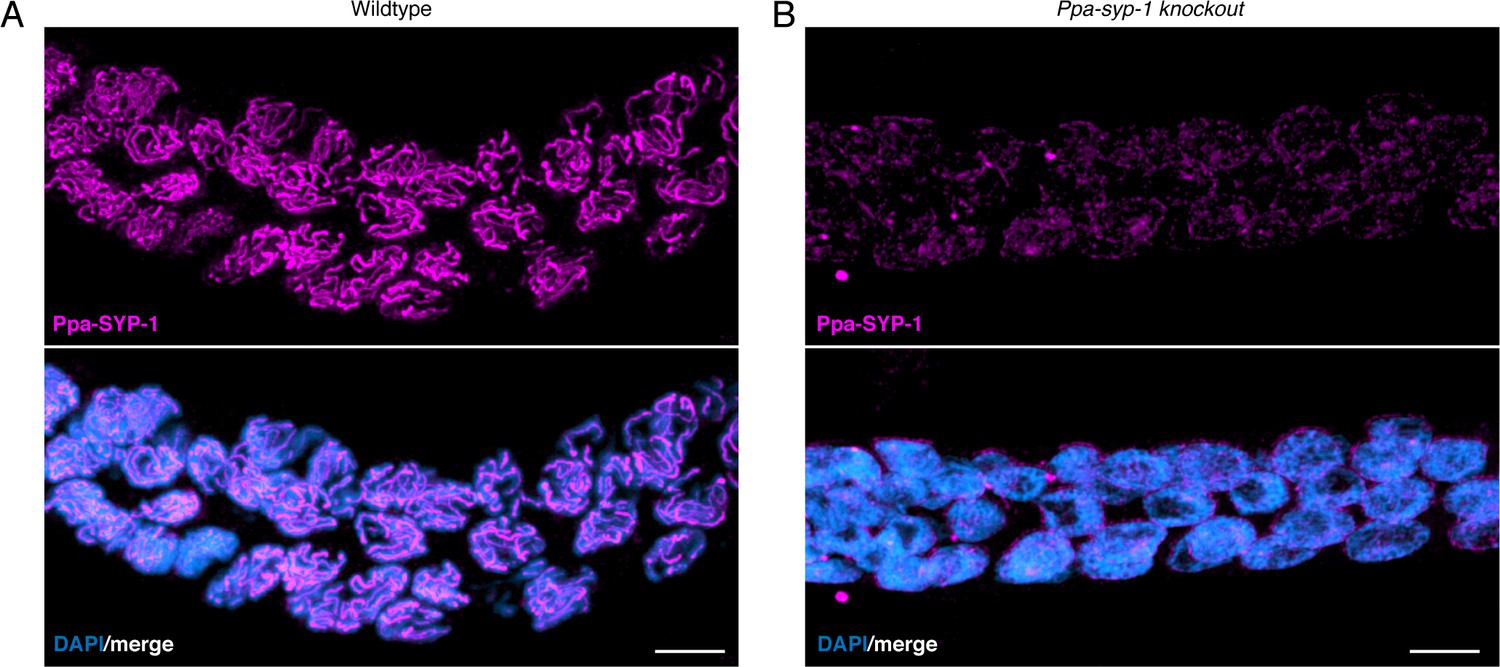
Ppa-SYP-1 antibody.
Image of the prophase region of the gonad stained with anti-Ppa-SYP-1 from (A) wild-type P. pacificus and (B) Ppa-syp-1 knockout hermaphrodites. Scale bar = 5 μm.
Figure 4—figure supplement 2
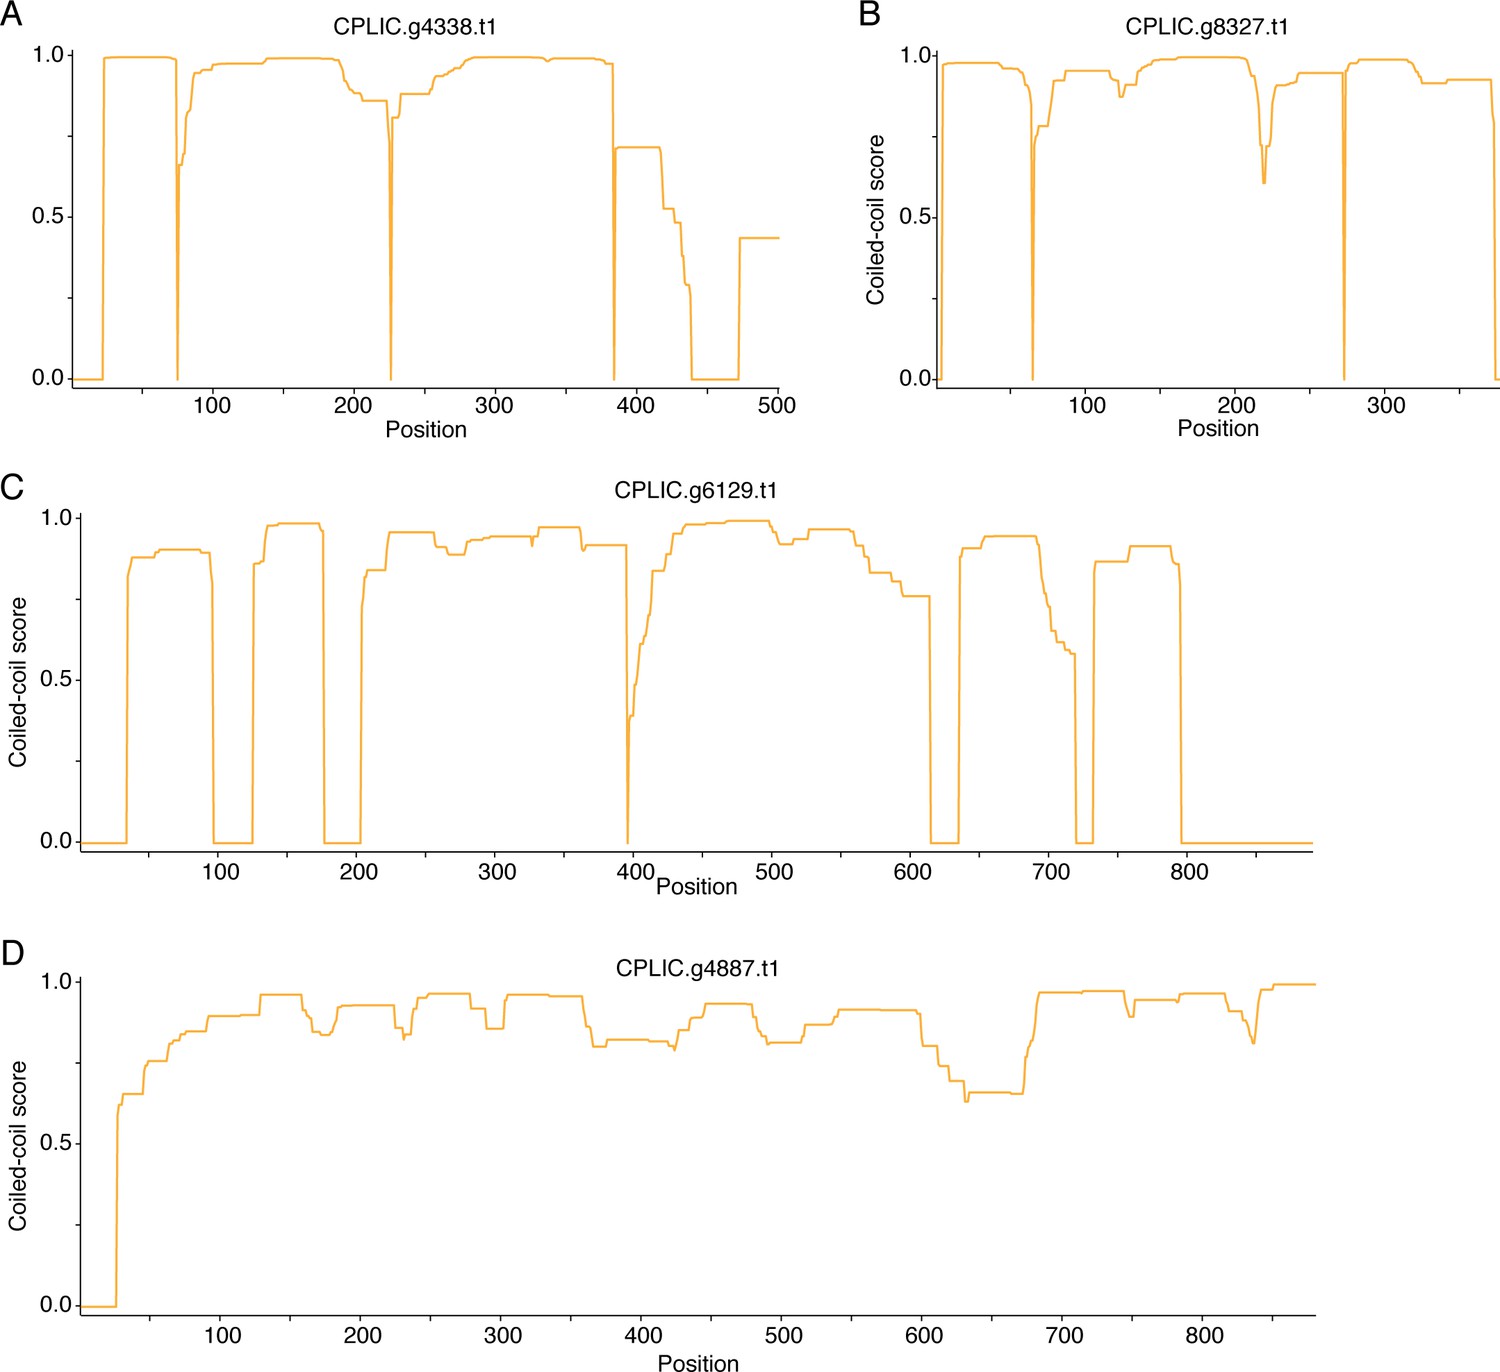
Candidate SYP-1 proteins in C. plicata.
Coiled-coil plots for four candidate SYP-1 proteins in C. plicata (A–D).
Figure 4—figure supplement 3
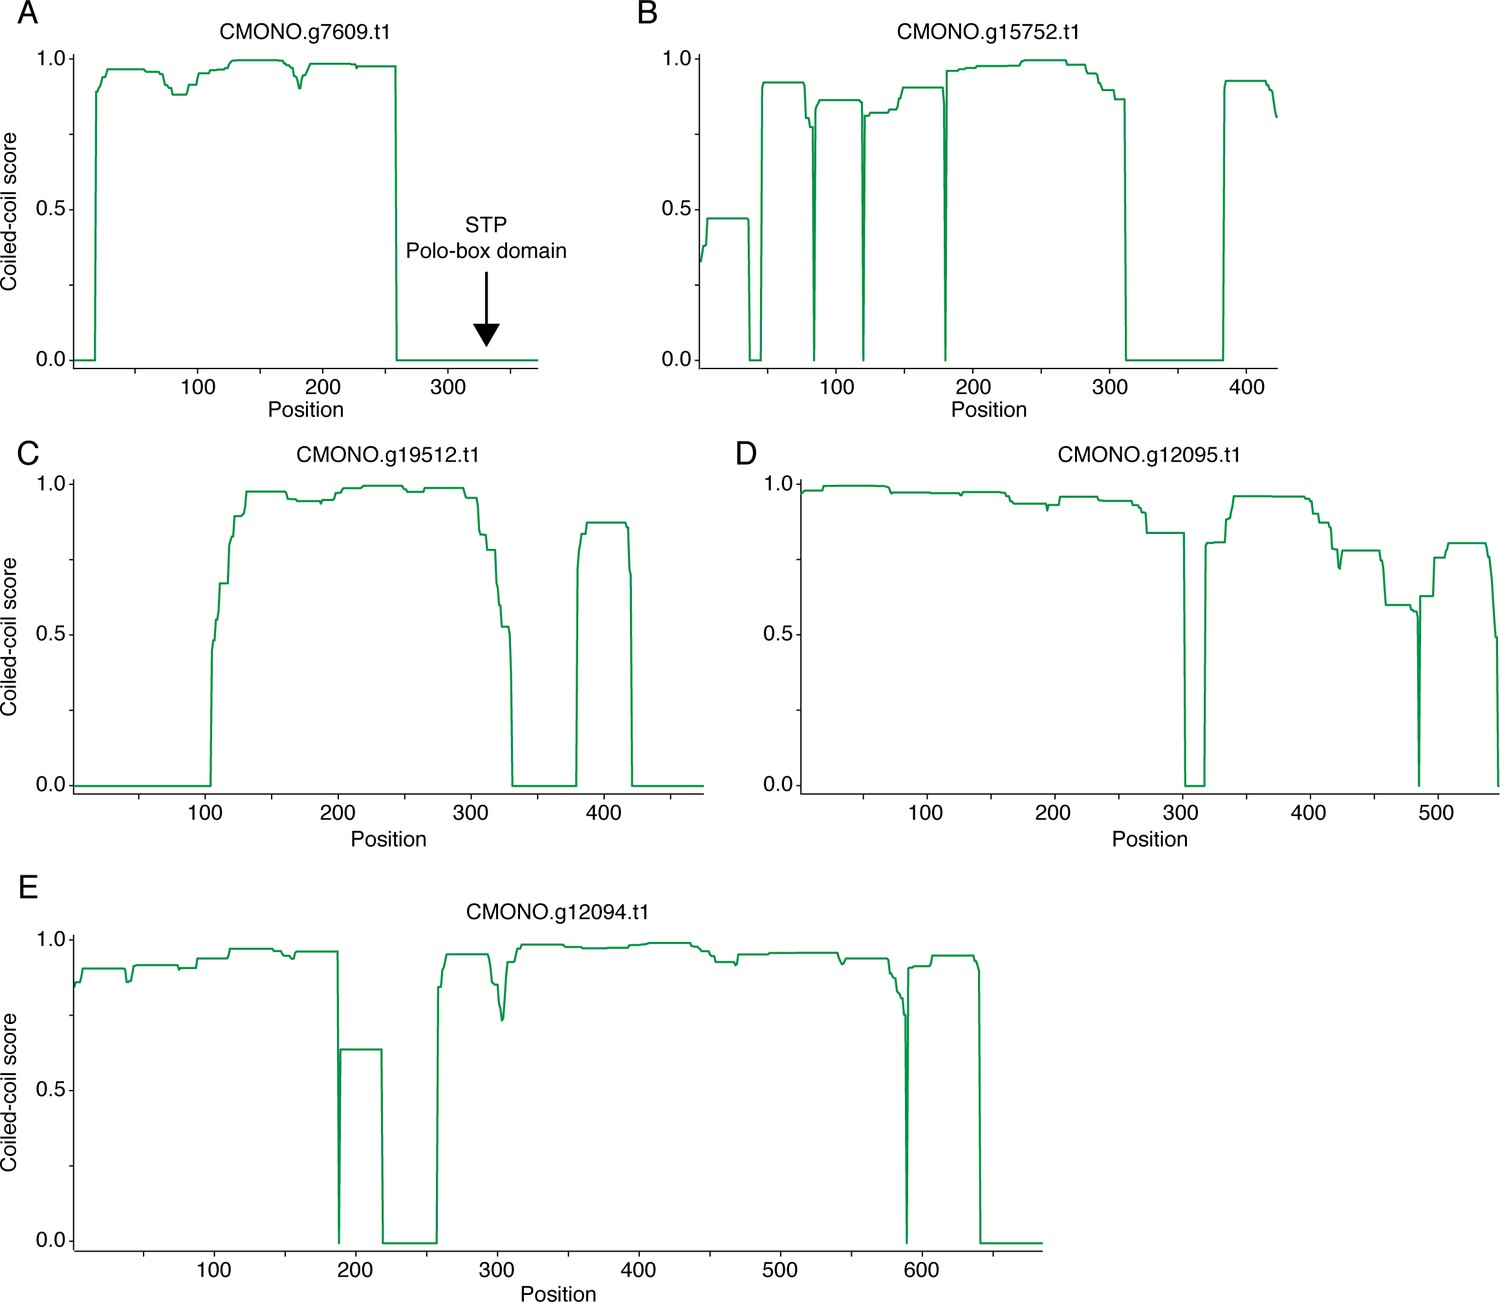
Candidate SYP-1 proteins in C. monodelphis.
Coiled-coil plots for five candidate SYP-1 proteins in C. monodelphis (A–E). In (A), the position of an ‘STP’ Polo-Box Domain binding motif is labeled. This motif is in a similar position to a Polo-Box Domain binding motif in the C-terminus of C. elegans SYP-1 and Ppa-SYP-1 (Figures 2A and 4I), making it a likely SYP-1 functional homolog in C. monodelphis.
Figure 4—figure supplement 4
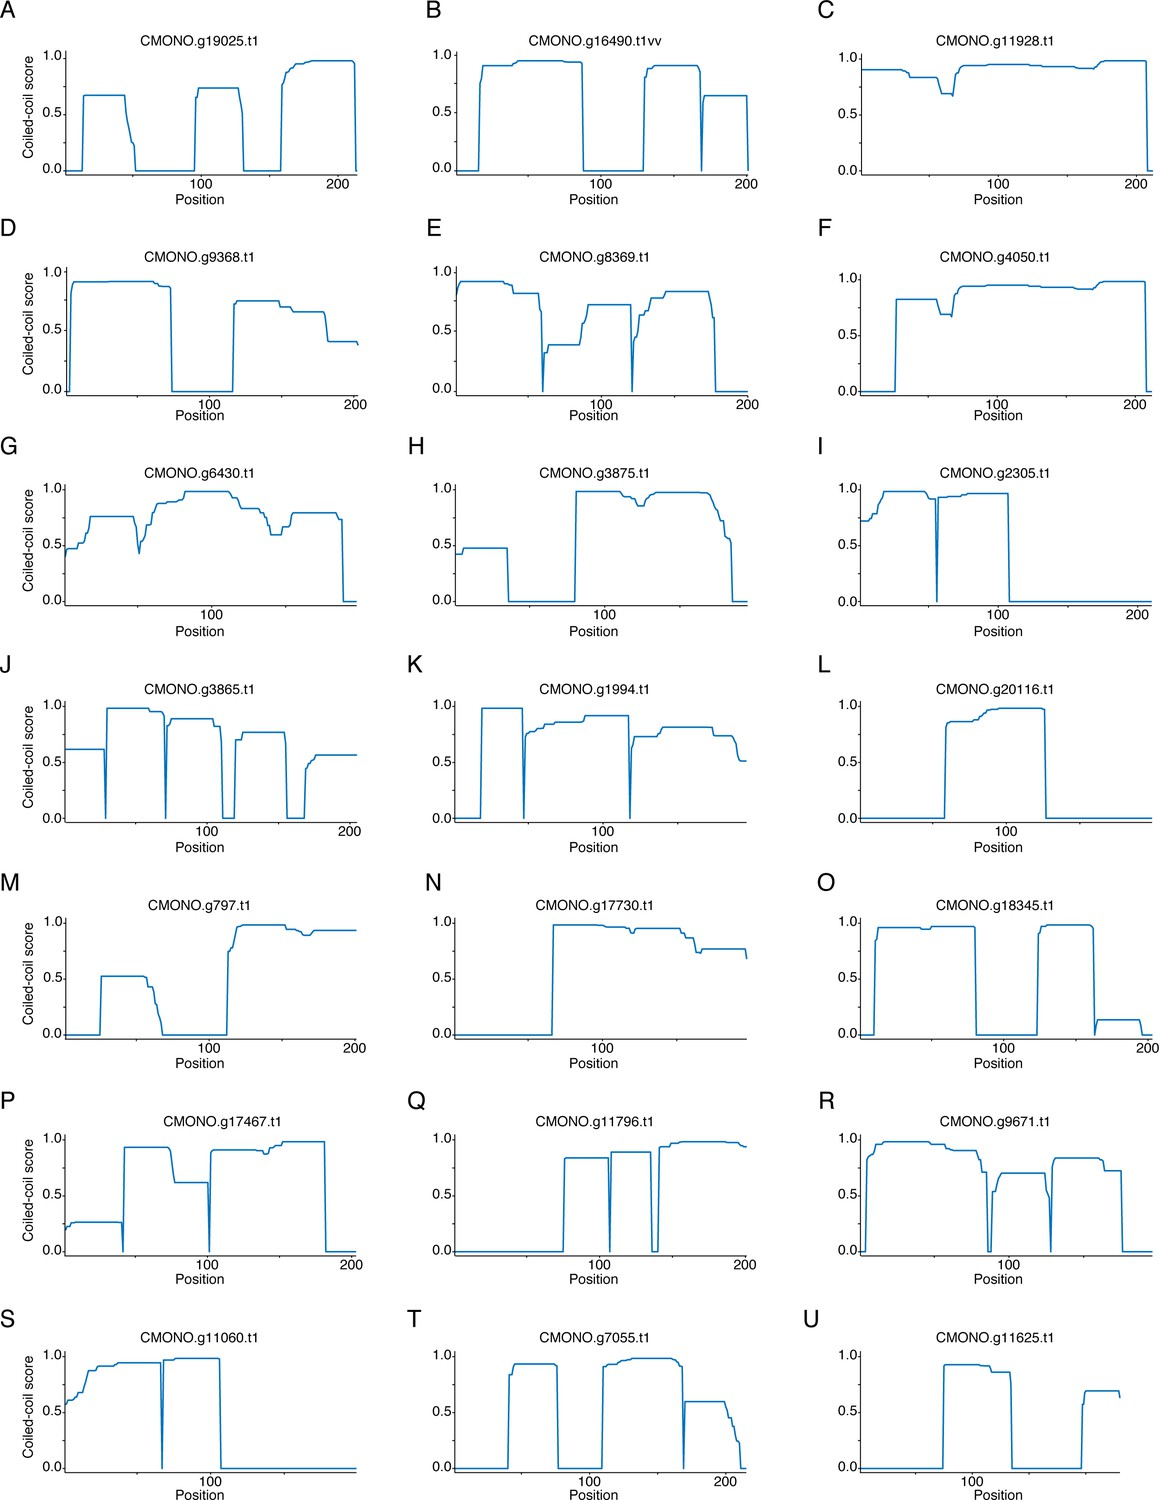
Candidate SYP-2 proteins in C. monodelphis.
Coiled-coil plots for 21 candidate SYP-2 proteins in C. monodelphis (A–U). The large number of candidates is likely due to the relatively short coiled-coil domain in SYP-2 that was used to identify them.
Tables
Table 1
Summary table of tests for positive selection on synaptonemal complex proteins and SMC-1 and SMC-3 (controls) in the Elegans group species of Caenorhabditis (Figure 1—figure supplement 1).
p-values from likelihood ratio tests comparing CodeML models M1 vs. M2, M7 vs. M8, and M8a vs. M8 are listed. Each comparison tests the fit of the data to a model that does not allow positive selection (M1, M7, and M8a) to a model that does allow positive selection (M2 and M8). The numbers of sites under positive or negative selection in each protein according to the Fixed Effects Likelihood analysis from HyPhy with p-value<0.05 are also displayed.
| PAML CodeML | HyPhy fixed effects likelihood | |||||
|---|---|---|---|---|---|---|
| Number of species | M1 vs. M2 p-value | M7 vs. M8 p-value | M8a vs. M8 p-value | Sites under positive selection | Sites under negative selection | |
| SYP-1 | 12 | 1.00 | 0.99 | 0.60 | 0/451 | 177/451 (39%) |
| SYP-2 | 12 | 1.00 | 0.90 | 0.56 | 0/203 | 75/202 (37%) |
| SYP-3 | 12 | 0.97 | 0.54 | 0.54 | 2/213 | 109/213 (51%) |
| SYP-4 | 11 | 1.00 | 0.26 | 0.48 | 2/550 | 277/550 (50%) |
| SYP-5 | 10 | 1.00 | 0.99 | 0.59 | 2/554 | 173/554 (31%) |
| SMC-1 | 11 | 1.00 | 0.85 | 0.54 | 1/1300 | 805/1300 (62%) |
| SMC-3 | 12 | 1.00 | 0.51 | 0.41 | 0/1243 | 760/1243 (61%) |
Table 2
Contingency table showing the number of alignment positions containing indels and lacking indels inside versus outside the coiled-coil domain of each synaptonemal complex protein.
Two tailed p-value from Fisher’s exact test is shown in the last column. Total number of insertions and deletions is depleted in the coiled-coil domains of SYP-1, SYP-4, and SYP-5.
| Inside coiled-coil | Outside coiled-coil | ||||
|---|---|---|---|---|---|
| Protein | Alignment positions with indels | Total alignment positions | Alignment positions with indels | Total alignment positions | p-value |
| SYP-1 | 30 | 407 | 54 | 157 | <0.0001 |
| SYP-2 | 4 | 104 | 3 | 92 | N.A. |
| SYP-3 | 8 | 251 | 0 | 33 | N.A. |
| SYP-4 | 3 | 237 | 31 | 161 | <0.0001 |
| SYP-5 | 14 | 372 | 14 | 131 | 0.0063 |
| Total | 59 | 1371 | 102 | 574 | <0.0001 |
Key resources table
| Reagent type (species) or resource | Designation | Source or reference | Identifiers | Additional information |
|---|---|---|---|---|
| Gene (Pristionchus pacificus) | PPA16075; Ppa-syp-1 | El Paco genome reference, V2 | ||
| Gene (P. pacificus) | PPA10754 | El Paco genome reference, V2 | ||
| Gene (P. pacificus) | PPA35551 | El Paco genome reference, V2 | ||
| Gene (Caenorhabditis elegans) | syp-1 | https://wormbase.org/#012-34-5, WS279 | F26D2.2 | See Figure 1—source data 5 |
| Gene (C. elegans) | syp-2 | https://wormbase.org/#012-34-5, WS279 | C24G6.1 | See Figure 1—source data 5 |
| Gene (C. elegans) | syp-3 | https://wormbase.org/#012-34-5, WS279 | F39H2.4 | See Figure 1—source data 5 |
| Gene (C. elegans) | syp-4 | https://wormbase.org/#012-34-5, WS279 | H27M09.3 | See Figure 1—source data 5 |
| Gene (C. elegans) | syp-5 | https://wormbase.org/#012-34-5, WS279 | Y54E10A.12 | See Figure 1—source data 5 |
| Gene (C. elegans) | spd-5 | https://wormbase.org/#012-34-5, WS279 | F56A3.4 | |
| Strain, strain background (P. pacificus) | PS312 | Caenorhabditis Genetics Center | PS312 | |
| Genetic reagent (P. pacificus) | Ppa-syp-1 | This paper | Null allele, available by request from the Rog lab | |
| Genetic reagent (P. pacificus) | HA::Ppa-syp-1 | This paper | In-frame insertion of HA tag, available by request from the Rog lab | |
| Genetic reagent (P. pacificus) | Ppa-syp-1::OLLAS | This paper | In-frame insertion of OLLAS tag, available by request from the Rog lab | |
| Antibody | Anti-Ppa-SYP-1 (rabbit polyclonal) | This paper, Pocono Rabbit Farm and Laboratory | Antibody targeting GSKSNKRQTRARGKKRTK in Ppa-SYP-1Available by request from the Rog lab(1:1000) | |
| Antibody | Anti-HA (mouse monoclonal) | Roche | 12CA5 | (1:500) |
| Antibody | Anti-OLLAS (rat monoclonal) | Invitrogen | MA5-16125 | (1:200) |
| Sequence-based reagent | Guide RNAs, DNA repair templates, and genotyping primers | This paper | See Figure 4—source data 1 | |
| Sequence-based reagent | Alt-R CRISPR-Cas9 tracrRNA | Integrated DNA Technologies | Cat # 1072532 | |
| Peptide, recombinant protein | Antigen for anti-Ppa-SYP-1 antibody | This paper | Peptide sequence: GSKSNKRQTRARGKK | |
| Peptide, recombinant protein | Alt-R S.p. Cas9 Nuclease V3 | Integrated DNA Technologies | Cat # 1081058 |
Additional files
Download links
A two-part list of links to download the article, or parts of the article, in various formats.
Downloads (link to download the article as PDF)
Open citations (links to open the citations from this article in various online reference manager services)
Cite this article (links to download the citations from this article in formats compatible with various reference manager tools)
Unconventional conservation reveals structure-function relationships in the synaptonemal complex
eLife 10:e72061.
https://doi.org/10.7554/eLife.72061


