Overriding impaired FPR chemotaxis signaling in diabetic neutrophil stimulates infection control in murine diabetic wound
- Department of Medicine, Rush University Medical Center, United States
- Division of Hematology/Oncology/Cell Therapy, Rush University Medical Center, United States
- Department of Microbial Pathogens and Immunity, Rush University Medical Center, United States
- Department of Surgery, Division of Surgical Oncology, University of Illinois at Chicago, United States
Figures
Figure 1 with 2 supplements
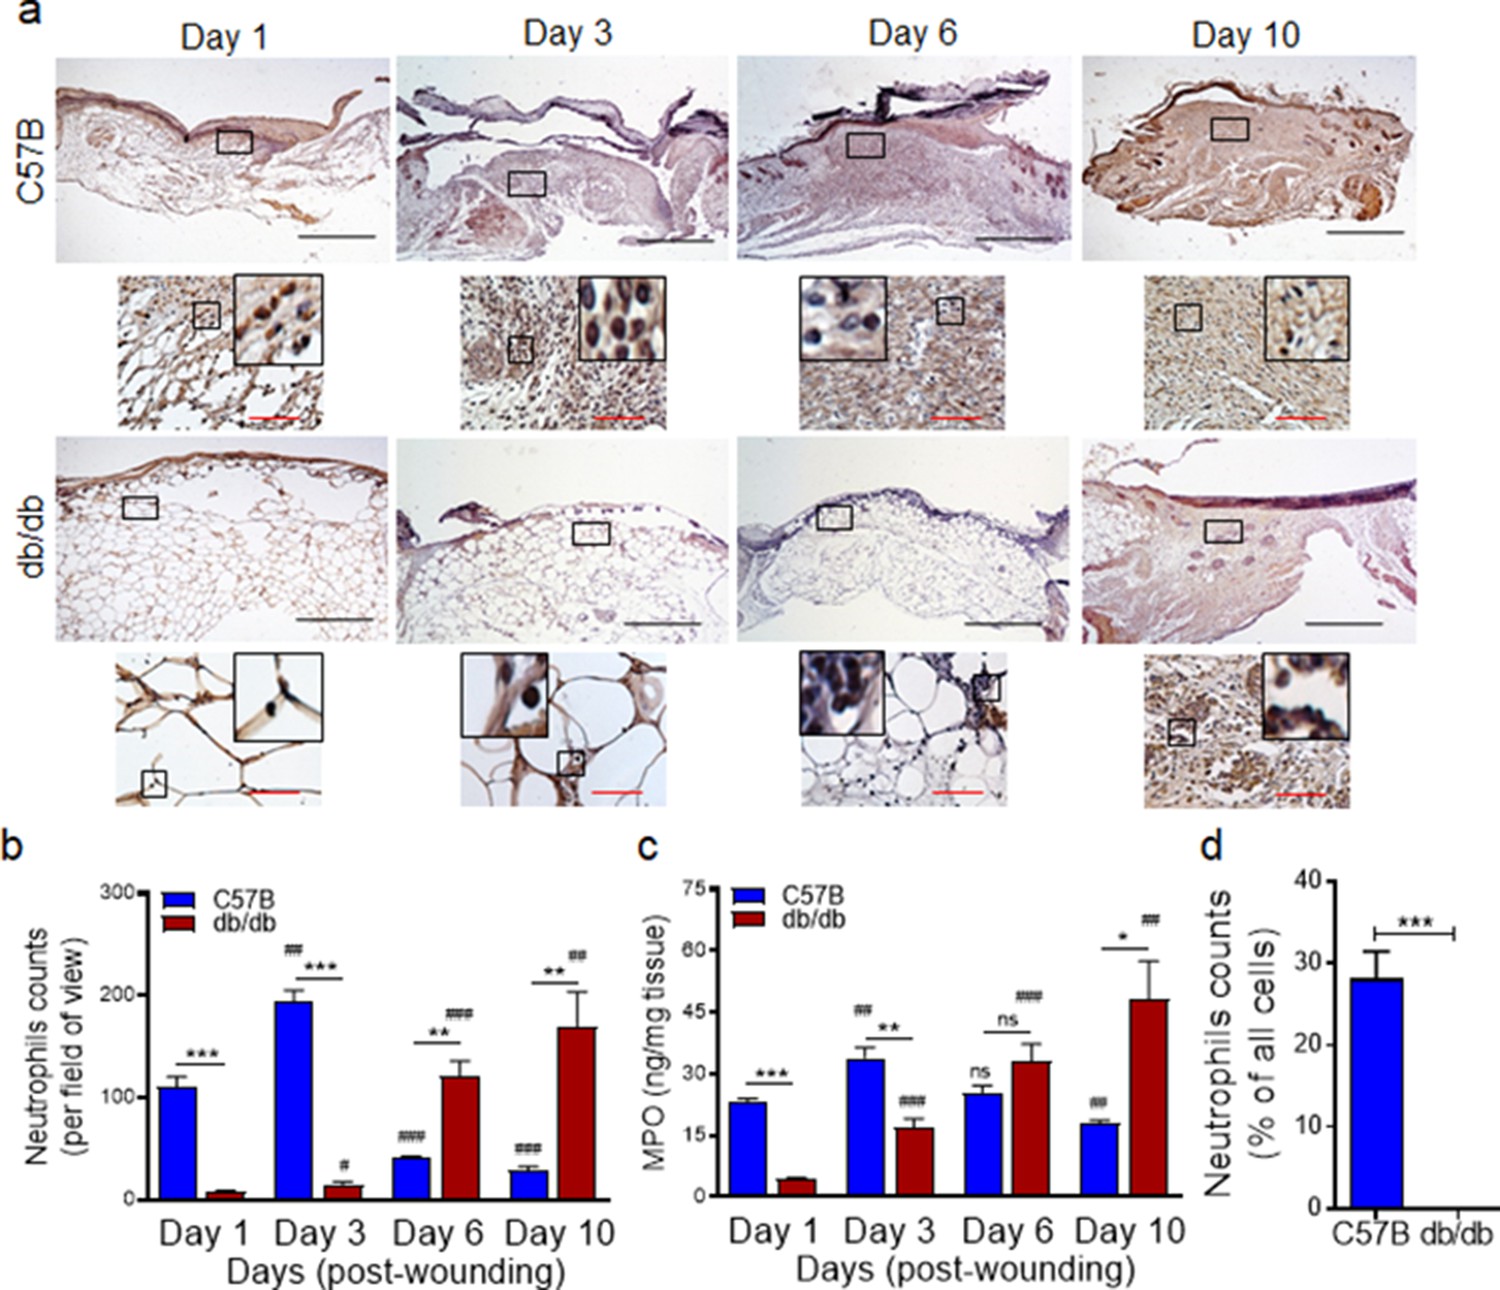
Neutrophil response is delayed in infected diabetic wound tissue.
Normal (C57BL/6) and diabetic (db/db) wounds were infected with PA103 (1000 CFU/wound). (a–b) Wound tissues were harvested at indicated timepoints post-infection and assessed for neutrophil contents by histological analysis using anti-Ly6G antibody. (a) Representative regions from underneath the wounds extending in the dermis are shown at ×40 and ×400 magnification (top and bottom, respectively). A representative magnified region is also inserted in the ×400 magnification images. Black scale bar = 500 µm for ×40 magnification and red scale bar = 50 µm for ×400 magnification. (b) The corresponding data were plotted as the Mean ± SEM. (c) Wounds at indicated timepoints were assessed for their MPO contents by ELISA and the tabulated data are shown as the Mean ± SEM. (d) Day 1 infected wound tissues of C57BL/6 and db/db were evaluated for their neutrophil contents by flow cytometry. Corresponding data were plotted as the Mean ± SEM. (N = 4; ns = not significant, *p < 0.05; **p < 0.01; ***p < 0.001 – are comparisons made between C57BL/6 and db/db at indicated timepoints; or #p < 0.05; ##p < 0.01; ###p < 0.001 are comparisons made within each group to day one values, respectively. Statistical analyses between groups were conducted by One-way ANOVA with additional post hoc testing, and pair-wise comparisons between groups were performed or by unpaired Student’s t-test).
-
Figure 1—source data 1
Related to Figure 1b.
- https://cdn.elifesciences.org/articles/72071/elife-72071-fig1-data1-v2.xlsx
-
Figure 1—source data 2
Related to Figure 1c.
- https://cdn.elifesciences.org/articles/72071/elife-72071-fig1-data2-v2.xlsx
-
Figure 1—source data 3
Related to Figure 1d.
- https://cdn.elifesciences.org/articles/72071/elife-72071-fig1-data3-v2.xlsx
Figure 1—figure supplement 1
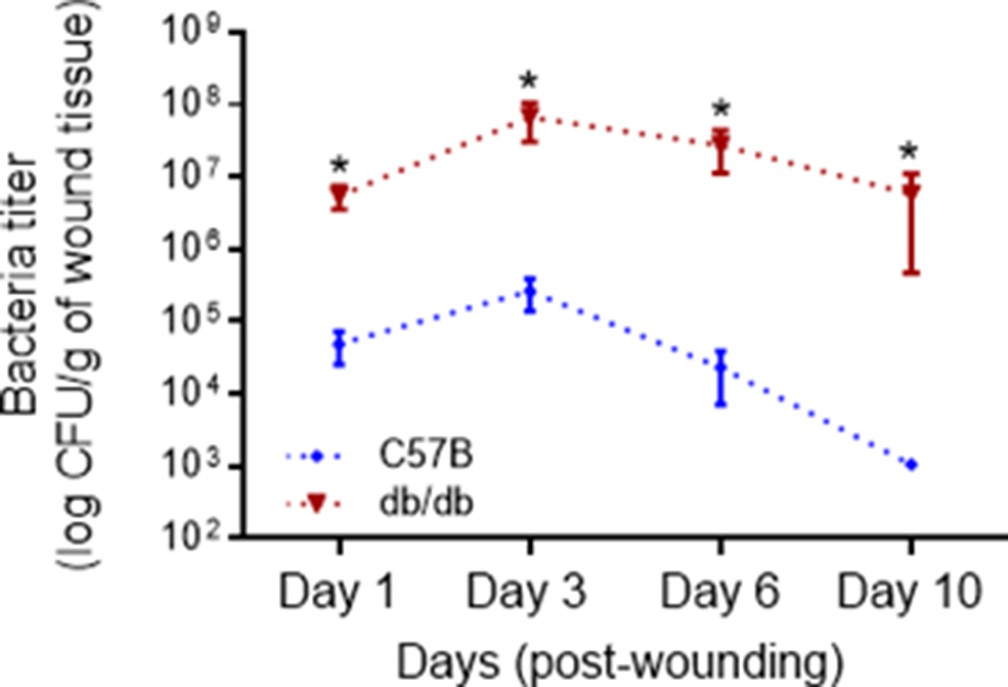
Diabetic wound is vulnerable to increased infection with Pseudomonas aeruginosa.
Normal and diabetic wounds were infected with 103 of P. aeruginosa (PA103). Bacterial burden in wounds was determined by serial dilution and plating at indicated times after infection and is shown as the Mean ± SEM. (N = 4 mice/group, 2 wounds/mouse. (*) Represents significance with p < 0.01. Statistical analyses between groups were conducted by One-way ANOVA with additional post hoc testing, and pair-wise comparisons between groups were performed or by unpaired Student’s t-test).
-
Figure 1—figure supplement 1—source data 1
Related to Figure 1—figure supplement 1.
- https://cdn.elifesciences.org/articles/72071/elife-72071-fig1-figsupp1-data1-v2.xlsx
Figure 1—figure supplement 2
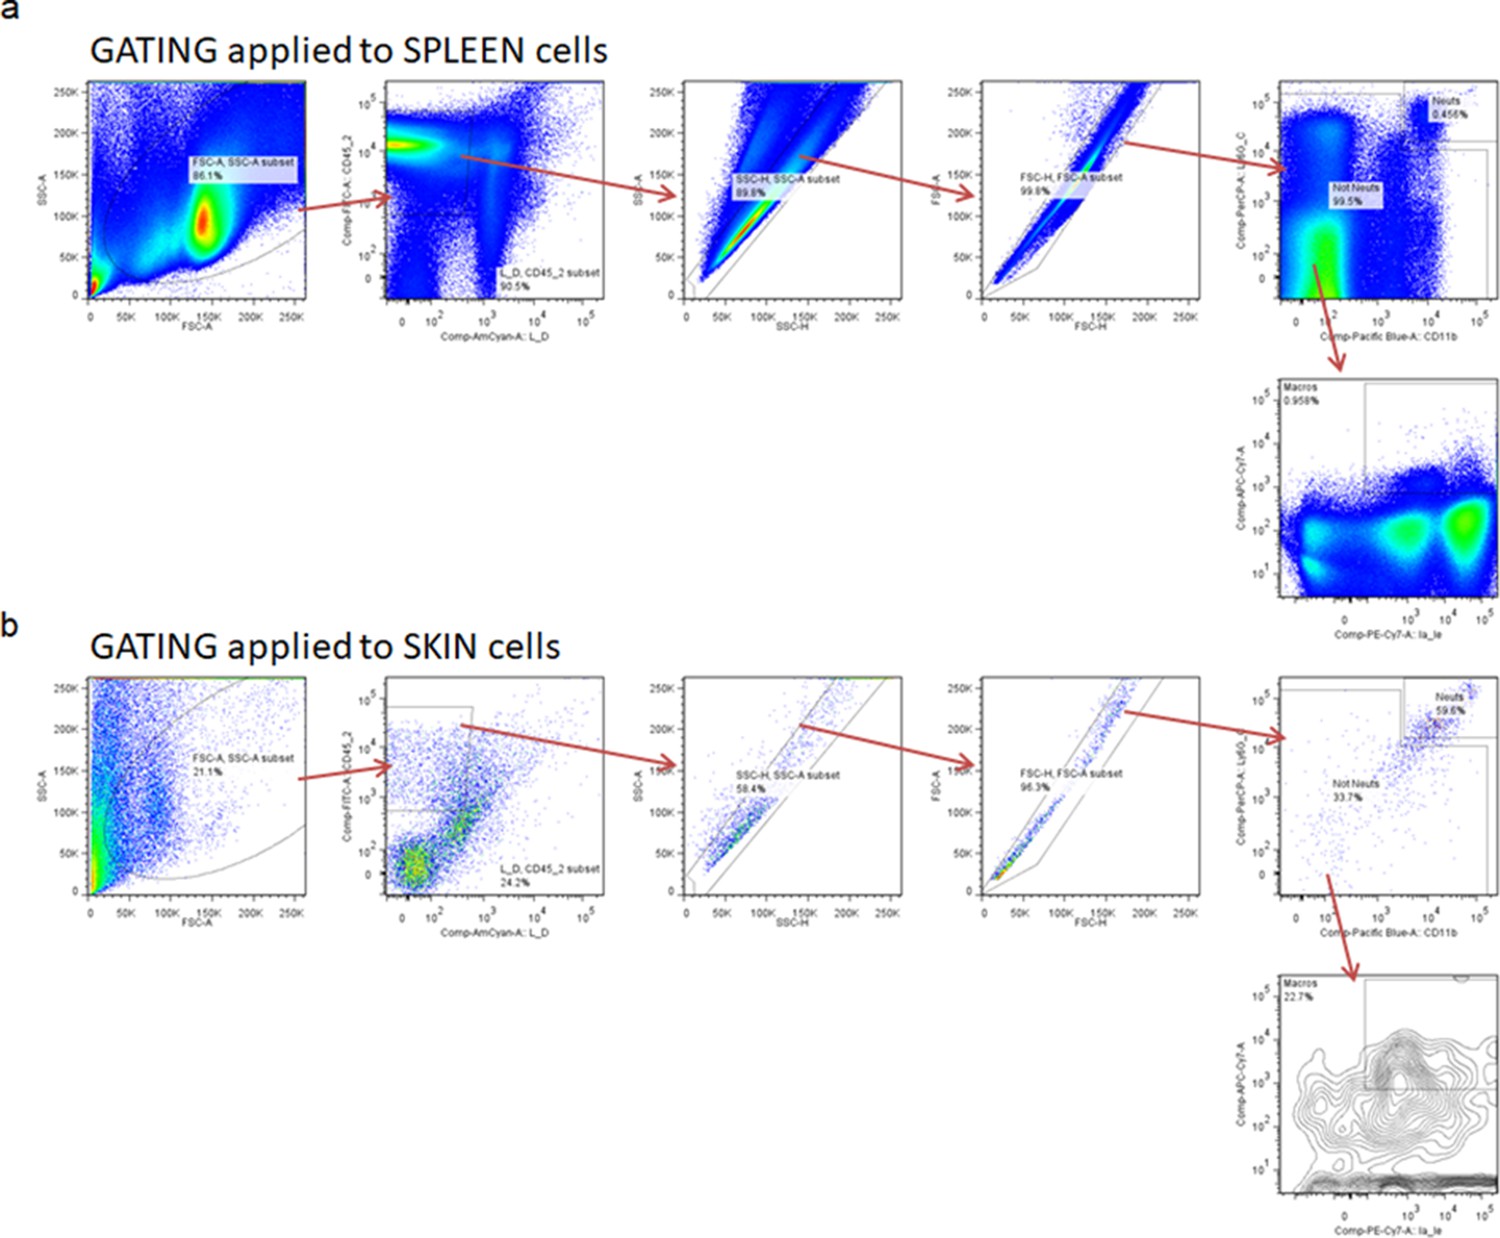
Gating strategy for flow cytometric analysis.
Spleen (a) and skin tissues (b) were harvested from C57BL/6 mice. For the gating strategy, Live singlet lymphocytes were identified by gating on forward scatter (FSC)-area (A) versus (vs) side scatter (SSC)-A, then LIVE/DEAD staining vs SSC-A, FSC-A vs FSC-height (H), SSC-A vs SSC-H, FSC-width (W) vs SSC-W, and CD45 vs SSC-A. T cells, B cells, and NK cells were excluded using antibodies against CD3, CD19, and NK1.1, respectively, all on one channel as a dump gate. Neutrophils were then identified using CD11b vs Ly6G staining, with neutrophils being CD11b high and Ly6G high. Macrophages were identified as CD11b positive and Ly6G low/negative, followed by F4/80-positive staining.
Figure 2 with 3 supplements
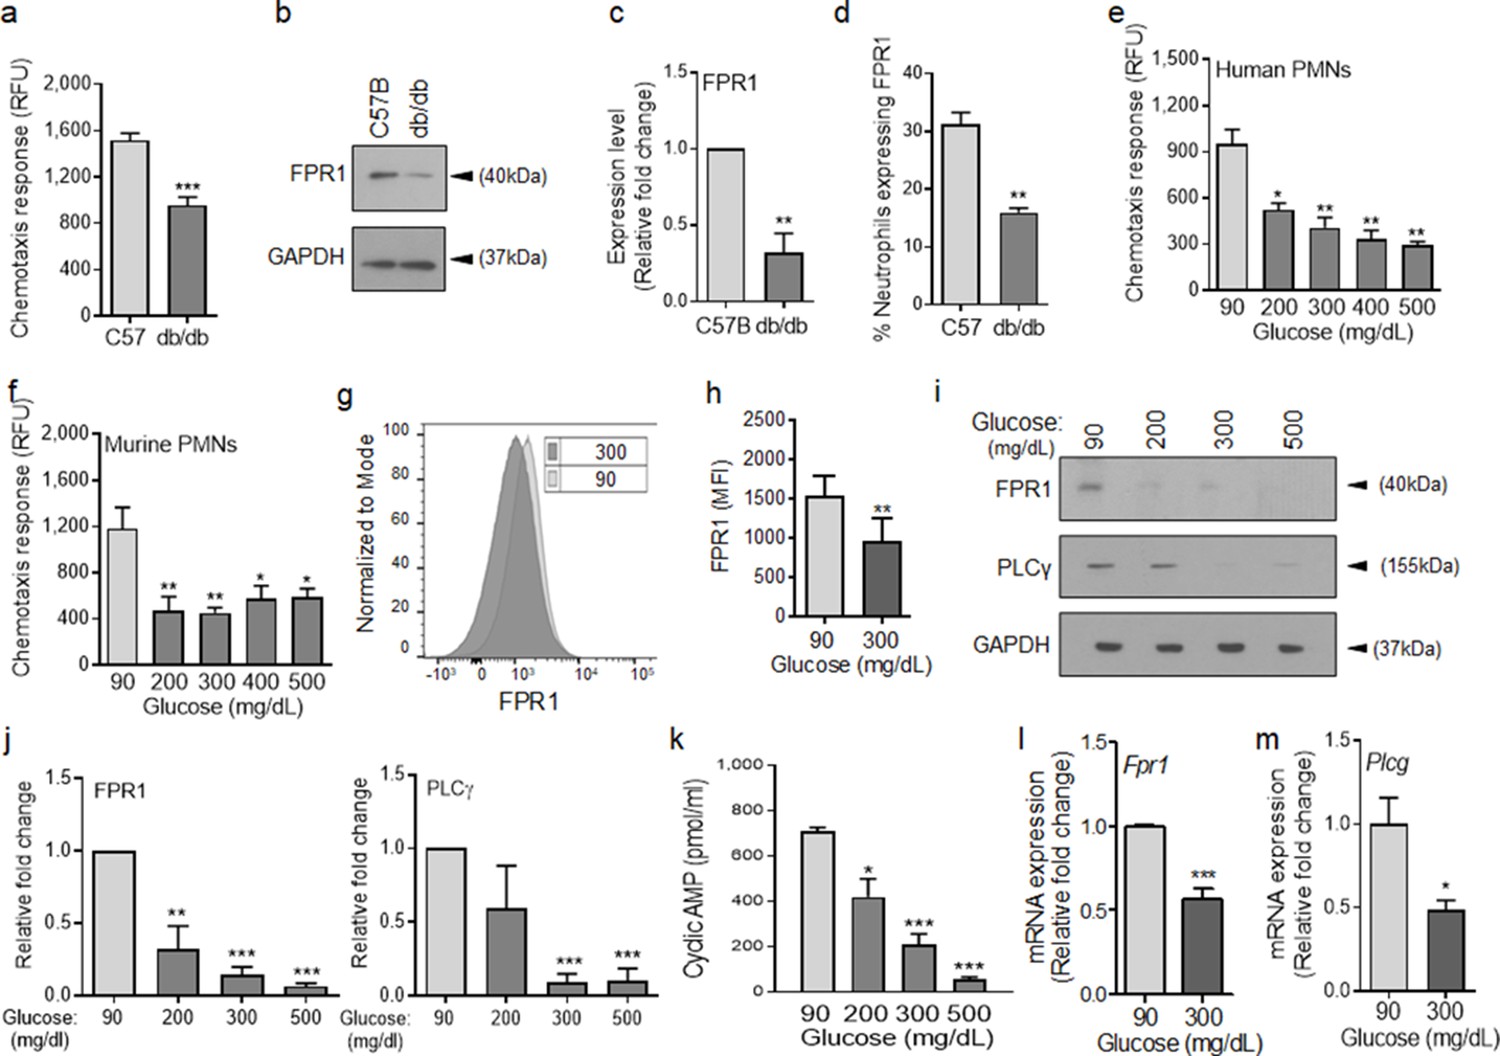
Chemotactic response is impaired in diabetic neutrophils through FPR.
(a–b) Neutrophils were isolated from the peripheral blood of C57BL/6 and db/db animals to assess: (a) their ability to chemotax toward 100 nM fMLP, or (b) for the expression of FPR1 by Western blotting. (c) Densitometry values associated with (b) are plotted as Mean ± SEM (N = 4 blood pools/group, each blood pool was from 4 mice). (d) Equal number of neutrophils (isolated from Day 1 C57B and db/db wounds) were assessed for the surface expression of FPR1 on neutrophils by flow cytometry (N = 3 mice/group). (e–f) Purified neutrophils from peripheral blood of non-diabetic individuals (e), or C57BL/6 bone marrow (f), were exposed to media containing glucose in normal range (90 mg/dl) or in diabetic range (200–500 mg/dl) for 1 hr to assess their ability to chemotax toward 100 nM fMLP. Data are plotted as Mean ± SEM. (N > 4). (g–h) Neutrophils from C57BL/6 bone marrow were exposed to glucose in normal range (90 mg/dl) or in diabetic range (300 mg/dl) for 1 hr and assessed for surface expression of FPR1 by flow cytometry. A representative histogram is shown in (g) and the corresponding tabulated data, plotted as Mean ± SEM is shown in (h) (N = 3). (i–j) Murine neutrophils (from C57B bone marrow) were exposed to glucose in normal or diabetic range (90 mg/dl or 300 mg/dl) for 1 hr and assessed for the expression of indicated proteins by Western blotting. Representative Western blots are shown in (i) and corresponding densitometry values, plotted as Mean ± SEM, are shown in (j). (N ≥ 3 independent experiments). (k–m) Murine neutrophils exposed to normal or diabetic glucose, as described for (g–h), were assessed for Cyclic AMP production by ELISA (k), and for mRNA of Fpr1 and Plcγ by RT-PCR (l-m). (N ≥ 3, ns = not significant, *p < 0.05, **p < 0.01, ***p < 0.001. Statistical analyses between groups were conducted by One-way ANOVA with additional post hoc testing, and pair-wise comparisons between groups were performed or by unpaired Student’s t-test).
-
Figure 2—source data 1
Related to Figure 2a.
- https://cdn.elifesciences.org/articles/72071/elife-72071-fig2-data1-v2.xlsx
-
Figure 2—source data 2
Related to Figure 2b.
- https://cdn.elifesciences.org/articles/72071/elife-72071-fig2-data2-v2.pptx
-
Figure 2—source data 3
Related to Figure 2c.
- https://cdn.elifesciences.org/articles/72071/elife-72071-fig2-data3-v2.xlsx
-
Figure 2—source data 4
Related to Figure 2d.
- https://cdn.elifesciences.org/articles/72071/elife-72071-fig2-data4-v2.xlsx
-
Figure 2—source data 5
Related to Figure 2e.
- https://cdn.elifesciences.org/articles/72071/elife-72071-fig2-data5-v2.xlsx
-
Figure 2—source data 6
Related to Figure 2f.
- https://cdn.elifesciences.org/articles/72071/elife-72071-fig2-data6-v2.xlsx
-
Figure 2—source data 7
Related to Figure 2h.
- https://cdn.elifesciences.org/articles/72071/elife-72071-fig2-data7-v2.xlsx
-
Figure 2—source data 8
Related to Figure 2i.
- https://cdn.elifesciences.org/articles/72071/elife-72071-fig2-data8-v2.pptx
-
Figure 2—source data 9
Related to Figure 2j.
- https://cdn.elifesciences.org/articles/72071/elife-72071-fig2-data9-v2.xlsx
-
Figure 2—source data 10
Related to Figure 2k.
- https://cdn.elifesciences.org/articles/72071/elife-72071-fig2-data10-v2.xlsx
-
Figure 2—source data 11
Related to Figure 2l.
- https://cdn.elifesciences.org/articles/72071/elife-72071-fig2-data11-v2.xlsx
-
Figure 2—source data 12
Related to Figure 2m.
mRNA data for Plcγ by RT-PCR.
- https://cdn.elifesciences.org/articles/72071/elife-72071-fig2-data12-v2.xlsx
Figure 2—figure supplement 1
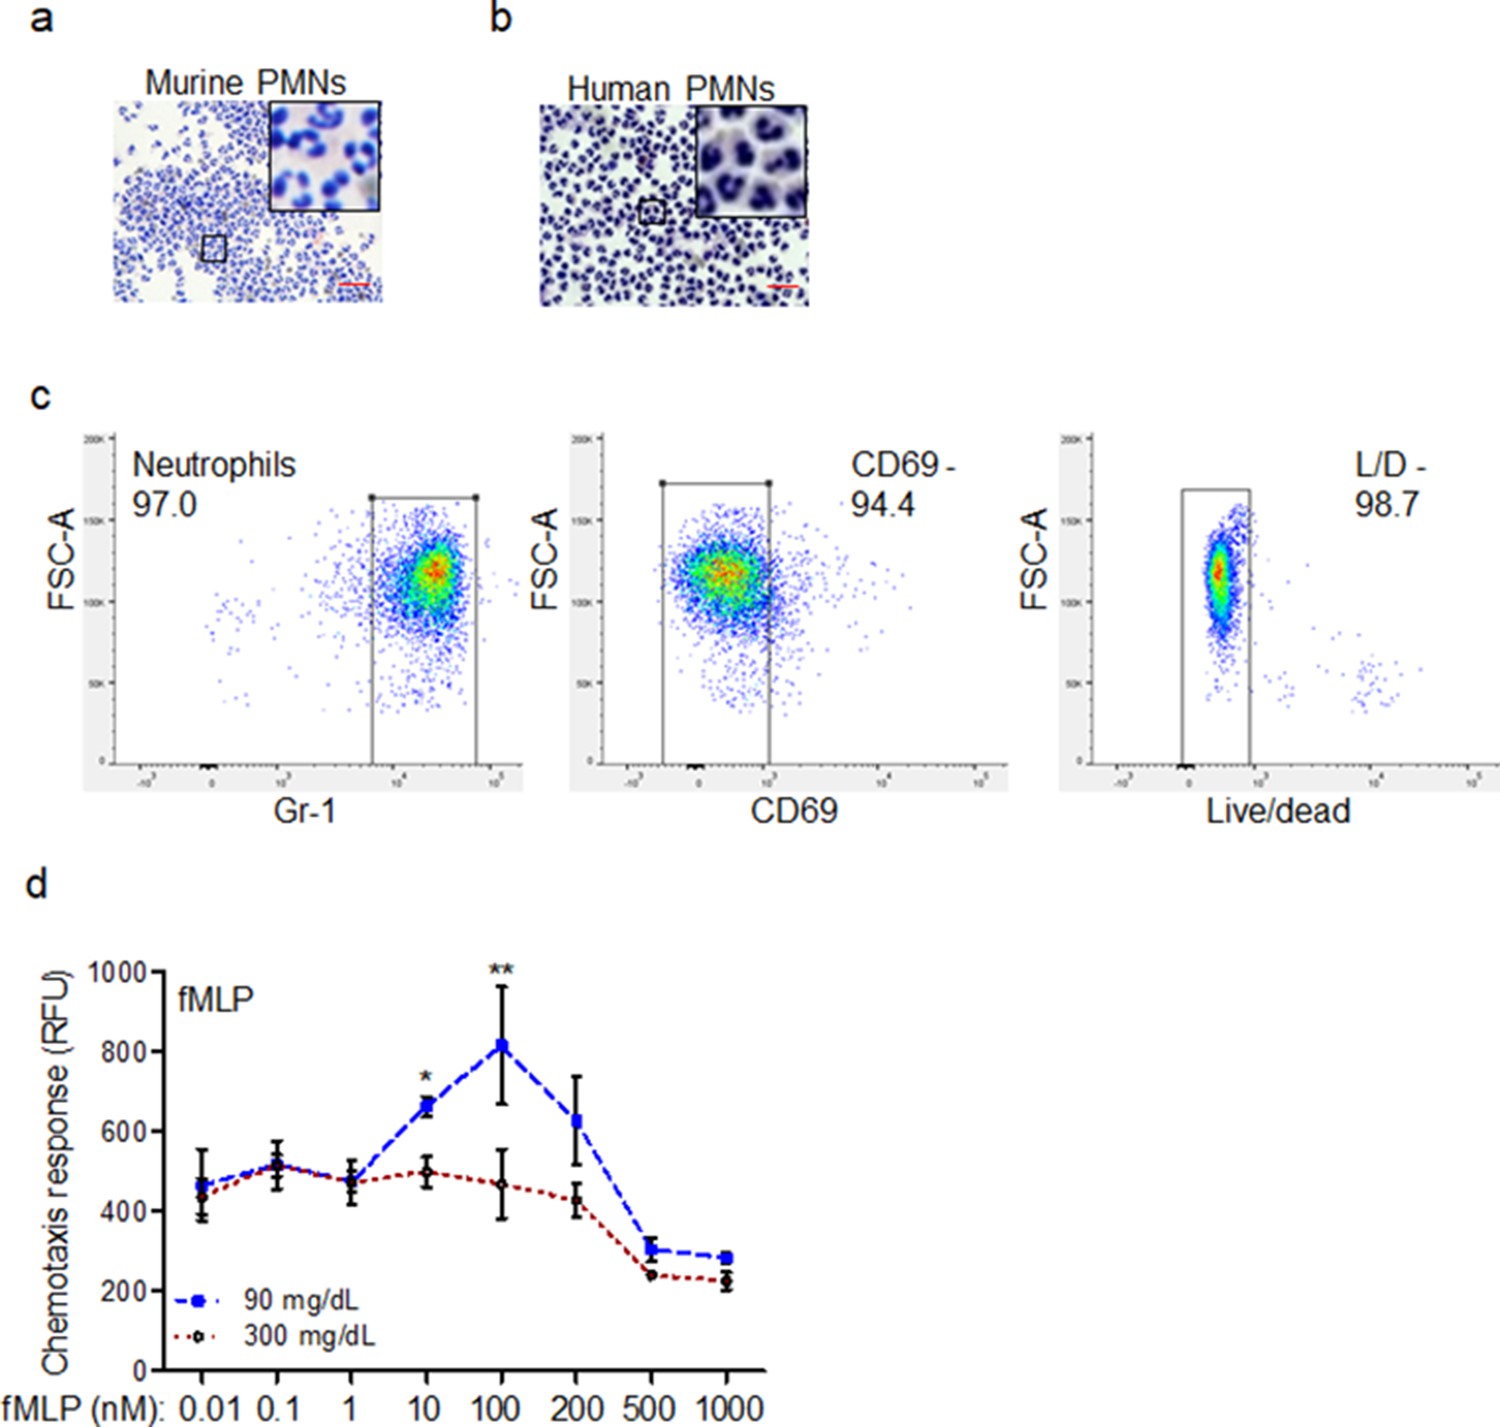
Chemotactic response is impaired in diabetic neutrophils through FPR.
(a–b) Neutrophils (PMNs) were purified from murine (C57BL/6 bone marrow) and human peripheral blood, as discussed in Materials and Methods. Representative images of mouse and human purified neutrophils are shown at indicated magnification. Magnified representative regions are shown inserts within each image. (Red scale bars are 50 μm). (c) Representative flow histograms of purified mouse neutrophils showing that these neutrophils are over 97% pure, live, and naive, as assessed by indicated markers. (d) Chemotaxis of purified mouse PMNs toward varying concentrations of fMLP after 1 hr exposure to normal glucose (90 mg/dl) or high glucose in diabetic range (300 mg/dl). Data are plotted as the Mean ± SEM. (N = 3; ns = not significant. *p < 0.05, **p < 0.01, ***p < 0.001. Statistical analyses between groups were conducted by Two-way ANOVA with additional post hoc testing, and pair-wise comparisons between groups were performed or by unpaired Student’s t-test).
-
Figure 2—figure supplement 1—source data 1
Related to Figure 2—figure supplement 1d.
- https://cdn.elifesciences.org/articles/72071/elife-72071-fig2-figsupp1-data1-v2.xlsx
Figure 2—figure supplement 2

Exposure to high glucose dampens the expression of FPR1 in neutrophils.
(a–c) Murine neutrophils were extracted from the bone marrow of C57BL/6 mice and exposed to normal glucose (90 mg/dl) or high glucose (300 mg/dl) and the expression of FPR1 was assessed by RT-PCR (a), or by western blotting (b–c) after 1, 2, or 3 hr exposure to glucose. Data are plotted as Mean ± SEM. (N ≥ 5 for RT-PCR and N = 4 for Western blotting. ns = not significant, *p < 0.05, **p < 0.01, ***p < 0.001. Statistical analyses between groups were conducted by One-way ANOVA with additional post hoc testing, and pair-wise comparisons between groups were performed or by unpaired Student’s t-test).
-
Figure 2—figure supplement 2—source data 1
Related to Figure 2—figure supplement 2a.
- https://cdn.elifesciences.org/articles/72071/elife-72071-fig2-figsupp2-data1-v2.xlsx
-
Figure 2—figure supplement 2—source data 2
Related to Figure 2—figure supplement 2b.
- https://cdn.elifesciences.org/articles/72071/elife-72071-fig2-figsupp2-data2-v2.pptx
-
Figure 2—figure supplement 2—source data 3
Related to Figure 2—figure supplement 2c.
- https://cdn.elifesciences.org/articles/72071/elife-72071-fig2-figsupp2-data3-v2.xlsx
Figure 2—figure supplement 3
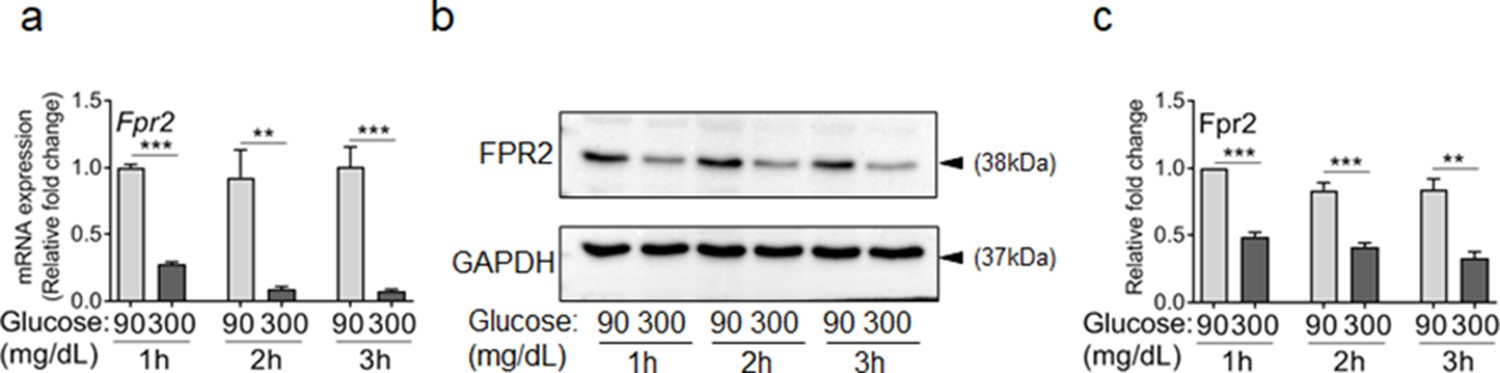
Exposure to high glucose dampens the expression of FPR2 in neutrophils.
(a–c) Murine neutrophils were extracted from the bone marrow of C57BL/6 mice and exposed to normal glucose (90 mg/dl) or high glucose (300 mg/dl) and the expression of FPR2 was assessed by RT-PCR (a), or by western blotting (b–c) after 1, 2, or 3 hr exposure to glucose. Data are plotted as Mean ± SEM. (N ≥ 3 for RT-PCR and N = 4 for Western blotting. ns = not significant, *p < 0.05, **p < 0.01, ***p < 0.001. Statistical analyses between groups were conducted by One-way ANOVA with additional post hoc testing, and pair-wise comparisons between groups were performed or by unpaired Student’s t-test).
-
Figure 2—figure supplement 3—source data 1
Related to Figure 2—figure supplement 3a.
- https://cdn.elifesciences.org/articles/72071/elife-72071-fig2-figsupp3-data1-v2.xlsx
-
Figure 2—figure supplement 3—source data 2
Related to Figure 2—figure supplement 3b.
- https://cdn.elifesciences.org/articles/72071/elife-72071-fig2-figsupp3-data2-v2.pptx
-
Figure 2—figure supplement 3—source data 3
Related to Figure 2—figure supplement 3c.
- https://cdn.elifesciences.org/articles/72071/elife-72071-fig2-figsupp3-data3-v2.xlsx
Figure 3 with 1 supplement
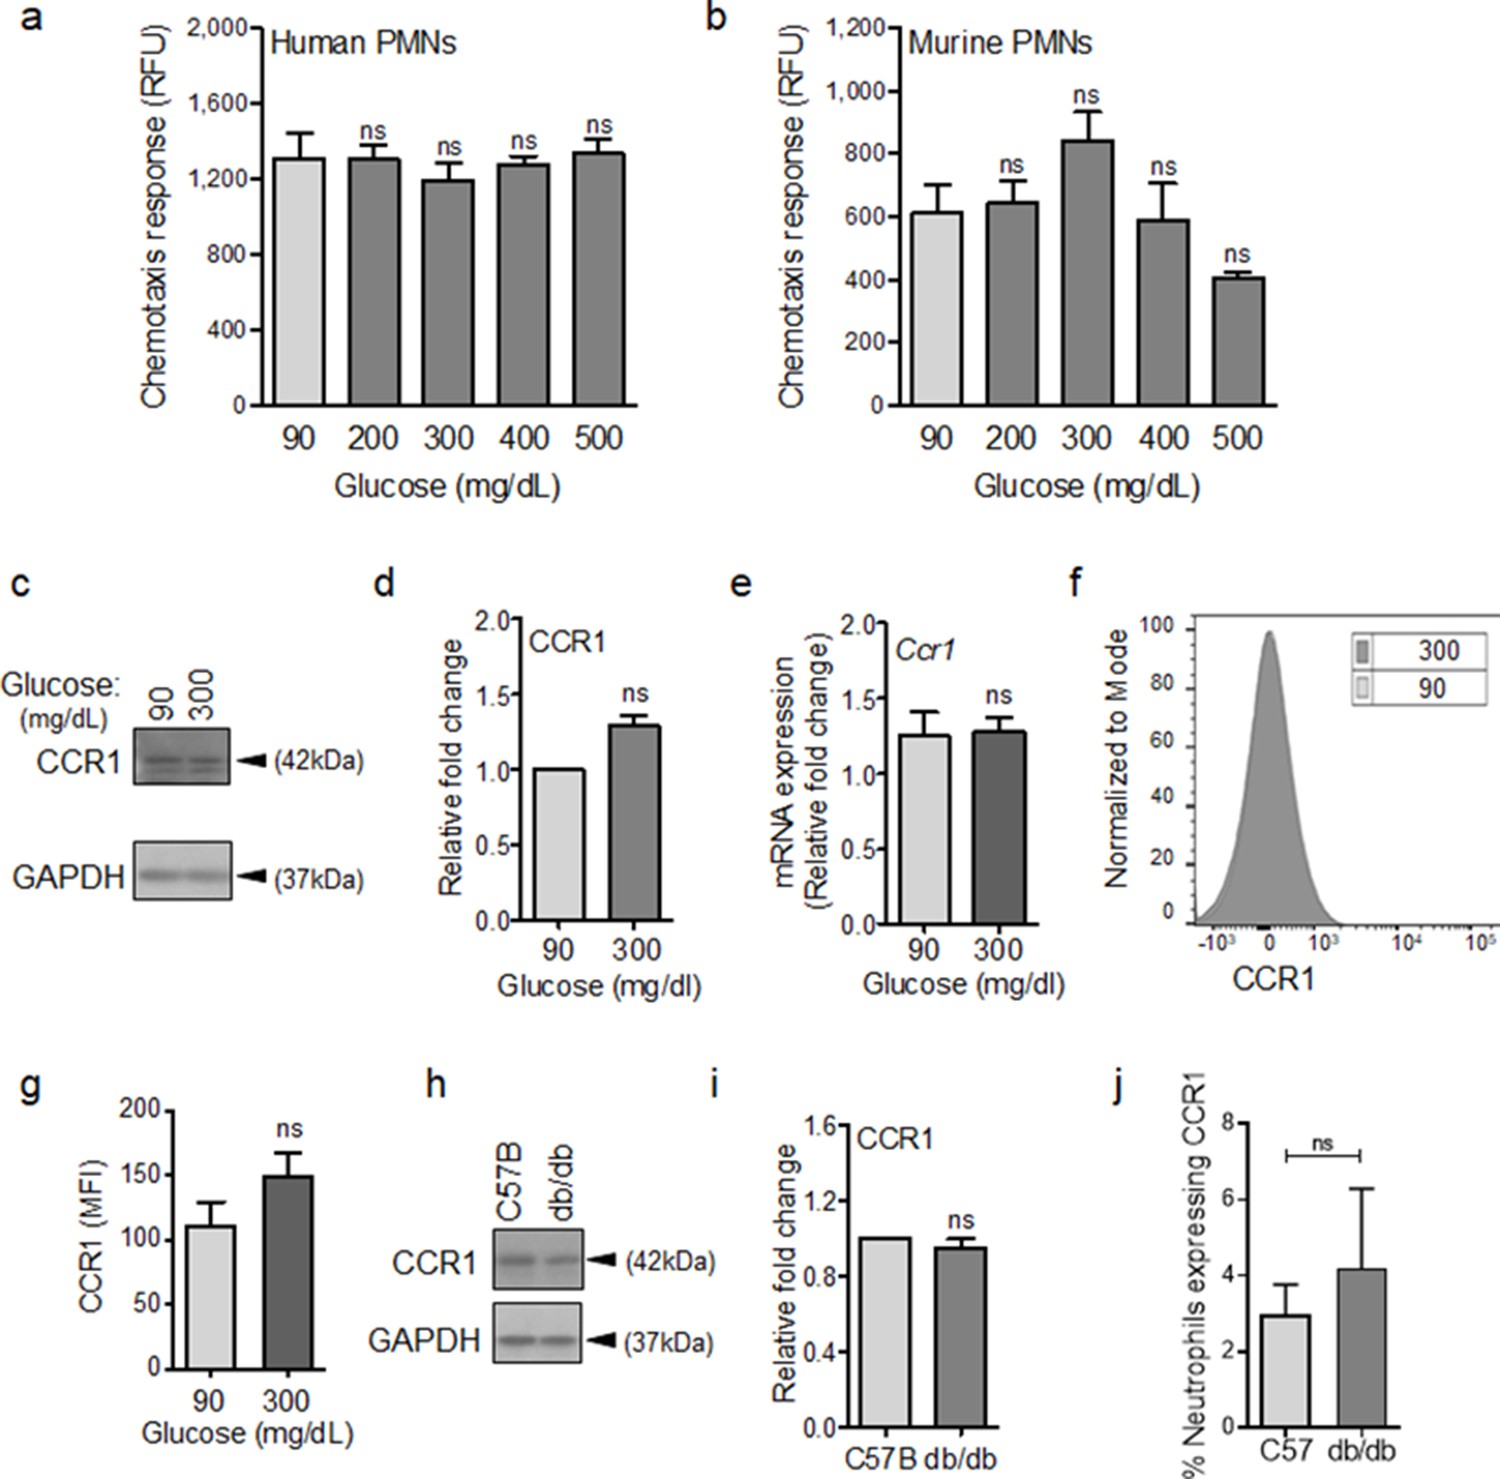
CCR1 receptor remains functional under diabetic conditions.
Human (a) or mouse (b) neutrophils were examined for their chemotactic responses toward CCL3 (5 ng/ml) after 1 hr exposure to glucose in normal (90 mg/dl) or diabetic range (200–500 mg/dl). (N > 3). (c–e) Neutrophils isolated from bone marrow of C57BL/6 were exposed to normal glucose (90 mg/dl) or high glucose (300 mg/dl) for 1 hr and assessed for CCR1 expression by western blotting (c–d) and for mRNA transcription analysis by RT-PCR. (N = 5 for western blots and N = 4 for RT-PCR). (f–g) Neutrophils isolated from bone marrow of C57BL/6 were exposed to normal glucose (90 mg/dl) or high glucose (300 mg/dl) for 1 hr and assessed for CCR1 surface expression by flow cytometry. A representative histogram is shown in (f) and the corresponding data, plotted as Mean ± SEM, is shown in (g) (N = 4). (h–i) Neutrophils isolated from peripheral blood of db/db and C57BL/6 mice were assessed for the expression of CCR1 by western blotting. A representative western blot is shown in (h) and the corresponding tabulated values are shown in (i). (N = 4 mice/group). (j) Equal numbers of neutrophils from day 1 C57BL/6 and db/db infected wounds were assessed for CCR1 surface expression by flow cytometry. (N = 3). (Statistical analyses between groups were conducted by One-way ANOVA with additional post hoc testing, and pair-wise comparisons between groups were performed or by unpaired Student’s t-test; ns = not significant, *p < 0.05, **p < 0.01, ***p < 0.001).
-
Figure 3—source data 1
Related to Figure 3a.
- https://cdn.elifesciences.org/articles/72071/elife-72071-fig3-data1-v2.xlsx
-
Figure 3—source data 2
Related to Figure 3b.
- https://cdn.elifesciences.org/articles/72071/elife-72071-fig3-data2-v2.xlsx
-
Figure 3—source data 3
Related to Figure 3c.
- https://cdn.elifesciences.org/articles/72071/elife-72071-fig3-data3-v2.pptx
-
Figure 3—source data 4
Related to Figure 3d.
- https://cdn.elifesciences.org/articles/72071/elife-72071-fig3-data4-v2.xlsx
-
Figure 3—source data 5
Related to Figure 3e.
- https://cdn.elifesciences.org/articles/72071/elife-72071-fig3-data5-v2.xlsx
-
Figure 3—source data 6
Related to Figure 3g.
- https://cdn.elifesciences.org/articles/72071/elife-72071-fig3-data6-v2.xlsx
-
Figure 3—source data 7
Related to Figure 3h.
- https://cdn.elifesciences.org/articles/72071/elife-72071-fig3-data7-v2.pptx
-
Figure 3—source data 8
Related to Figure 3i.
- https://cdn.elifesciences.org/articles/72071/elife-72071-fig3-data8-v2.xlsx
-
Figure 3—source data 9
Related to Figure 3j.
Flow cytometery data on CCR1 expression on Neutrophils.
- https://cdn.elifesciences.org/articles/72071/elife-72071-fig3-data9-v2.xlsx
Figure 3—figure supplement 1
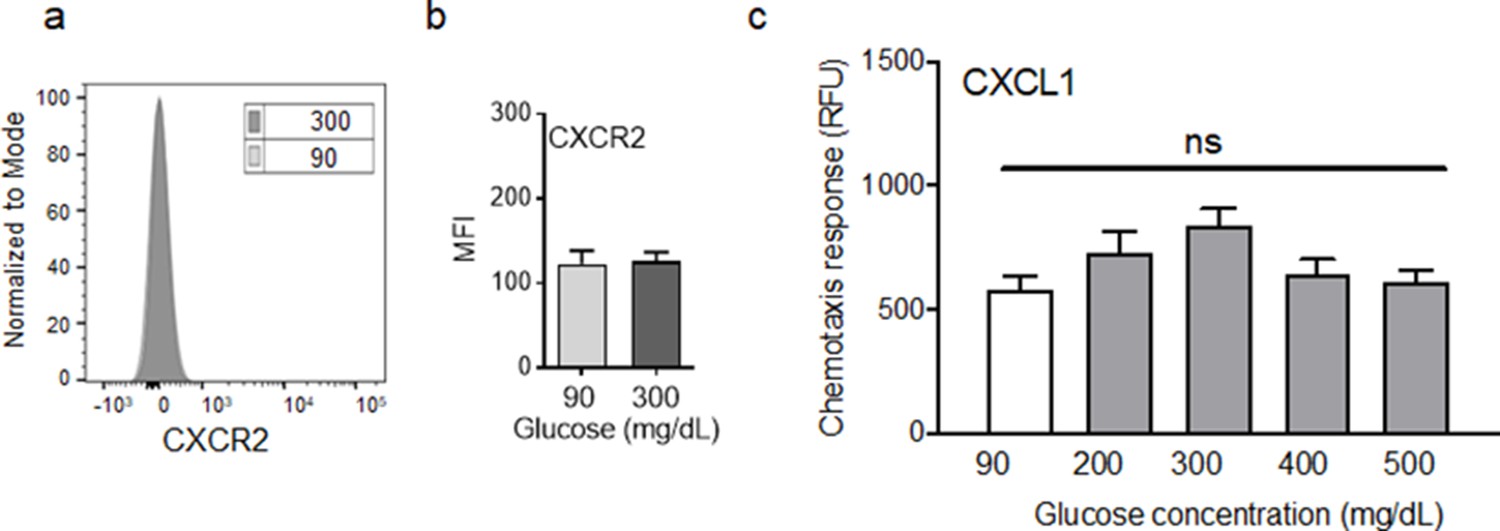
Exposure to high glucose does not affect CXCR2 auxiliary receptor.
(a–b) Mouse neutrophils were exposed to glucose at indicated concentrations for 1 hr and evaluated for their surface expression of CXCR2 by flow cytometry. A representative histogram is shown in (a) and the corresponding data are plotted as the Mean ± SEM is shown in (b). (c) Murine neutrophils were examined for their chemotactic response toward CXCL1 (5 ng/ml) and after 1 hr exposure to normal glucose (90 mg/dl) and high glucose in diabetic range (200–500 mg/dl). Data were plotted as Mean ± SEM. (N = 4 for (a–b) and N = 6 for (c). Statistical analyses between groups were conducted by One-way ANOVA with additional post hoc testing, and pair-wise comparisons between groups were performed or by unpaired Student’s t-test ns = not significant).
-
Figure 3—figure supplement 1—source data 1
Related to Figure 3—figure supplement 1b.
- https://cdn.elifesciences.org/articles/72071/elife-72071-fig3-figsupp1-data1-v2.xlsx
-
Figure 3—figure supplement 1—source data 2
Related to Figure 3—figure supplement 1c.
- https://cdn.elifesciences.org/articles/72071/elife-72071-fig3-figsupp1-data2-v2.xlsx
Figure 4 with 1 supplement
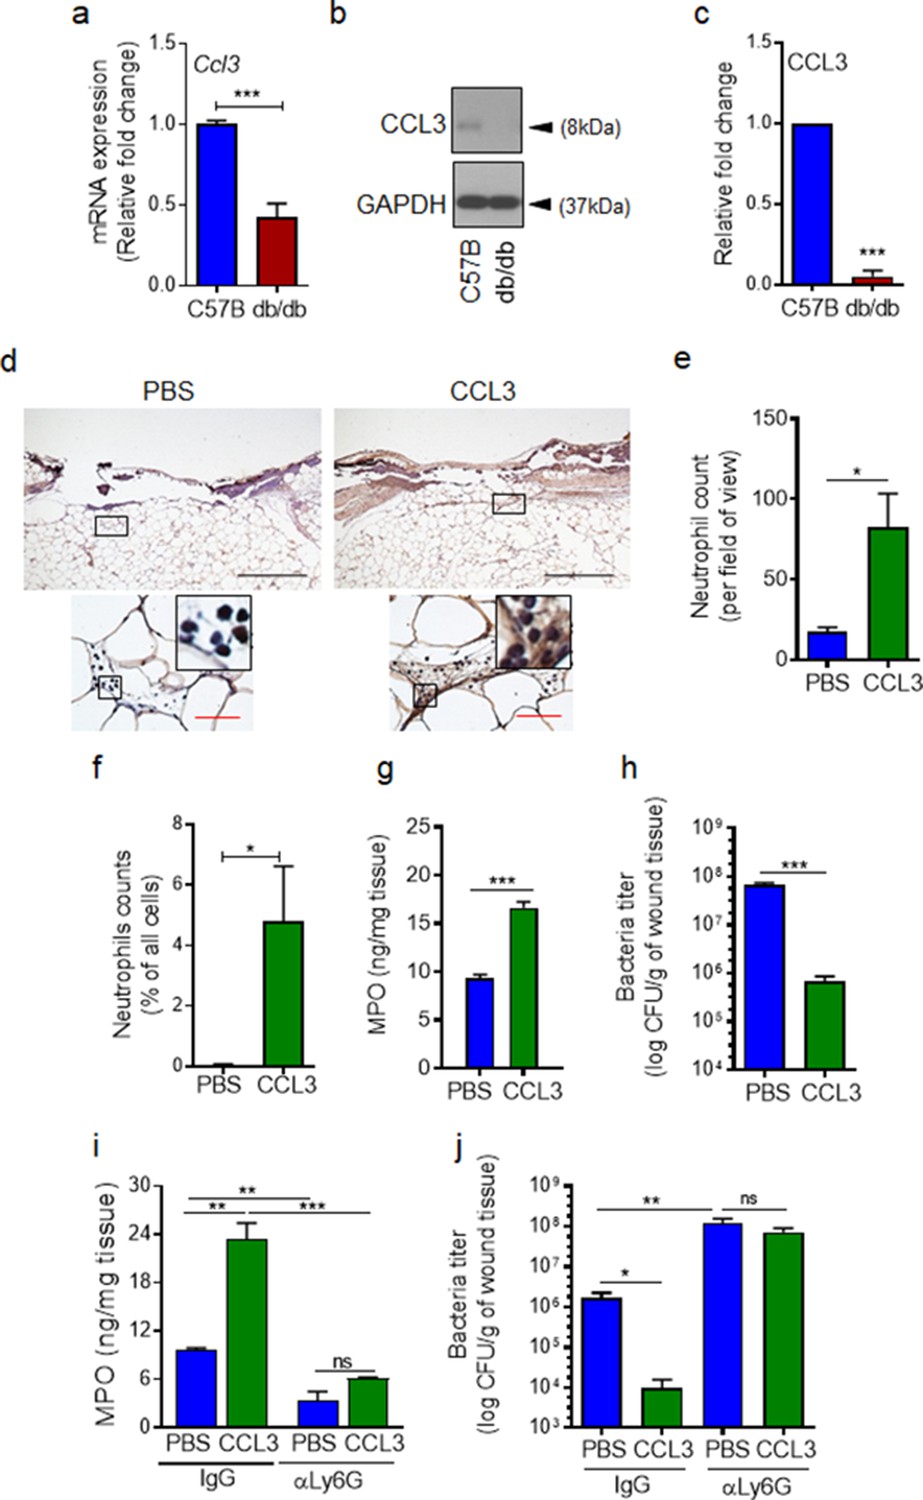
CCL3 topical treatment enhances neutrophil response and infection control in diabetic wound.
(a–c) Day 1 wound tissues of C57BL/6 and db/db infected wounds were harvested and assessed for the CCL3 mRNA levels by RT-PCR (a) and by western blotting (b–c), and the data were plotted as the Mean ± SEM, after normalization to 18 S and GAPDH, respectively (N = 6 mice/group for (a) and 4 mice/group for (b–c)). (d-e) db/db diabetic wounds were treated with either PBS or CCL3 (1 μg/wound) and infected with PA103 (1000 CFU/wound). Twenty-four h post-infection, wounds were collected and assessed for their neutrophil contents by histological analysis using anti-Ly6G antibody. (d) Representative wound images at ×40 and ×400 magnification (top and bottom, respectively) are shown. Inserts are representative magnified regions within the ×400 magnification images. (Black scale bar = 500 µm for ×40 magnification and red scale bar = 50 µm for ×400 magnification). (e) Corresponding data associated with (d) are plotted as Mean ± SEM. (N = 4 mice/group) (f) Neutrophil contents of PBS or CCL3-treated db/db infected wounds at day 1 were assessed by flow cytometry (f) or by MPO analysis (g) and the data were plotted as Mean ± SEM. (N > 3 mice/group for (f) and N = 4 mice/group for (g)). (h–i) db/db mice received either α-Ly6G (100 μg/mouse) to cause neutrophil depletion or α-IgG isoform as control, by intraperitoneal (i.p.) injection. Twenty-four hr after injection, α-IgG or α-Ly6G-treated animals were wounded and treated with either PBS or CCL3 and infected with PA103. The impact of neutrophil depletion on the ability of CCL3 treatment to boost infection control in diabetic wound was assessed by MPO analysis (i) and CFU count determination (h & j) in day 1 wounds. Data were plotted as Mean ± SEM. (N = 4 mice/group for (h); N = 3 mice/group for (i); and N > 4 mice/group for (j). ns = not significant, *p < 0.05; **p < 0.01, ***p < 0.001. Statistical analyses between groups were conducted by One-way ANOVA with additional post hoc testing, and pair-wise comparisons between groups were performed or by unpaired Student’s t-test.).
-
Figure 4—source data 1
Related to Figure 4a.
- https://cdn.elifesciences.org/articles/72071/elife-72071-fig4-data1-v2.xlsx
-
Figure 4—source data 2
Related to Figure 4b.
- https://cdn.elifesciences.org/articles/72071/elife-72071-fig4-data2-v2.pptx
-
Figure 4—source data 3
Related to Figure 4c.
- https://cdn.elifesciences.org/articles/72071/elife-72071-fig4-data3-v2.xlsx
-
Figure 4—source data 4
Related to Figure 4e.
- https://cdn.elifesciences.org/articles/72071/elife-72071-fig4-data4-v2.xlsx
-
Figure 4—source data 5
Related to Figure 4f.
- https://cdn.elifesciences.org/articles/72071/elife-72071-fig4-data5-v2.xlsx
-
Figure 4—source data 6
Related to Figure 4g.
- https://cdn.elifesciences.org/articles/72071/elife-72071-fig4-data6-v2.xlsx
-
Figure 4—source data 7
Related to Figure 4h.
- https://cdn.elifesciences.org/articles/72071/elife-72071-fig4-data7-v2.xlsx
-
Figure 4—source data 8
Related to Figure 4i.
- https://cdn.elifesciences.org/articles/72071/elife-72071-fig4-data8-v2.xlsx
-
Figure 4—source data 9
Related to Figure 4j.
- https://cdn.elifesciences.org/articles/72071/elife-72071-fig4-data9-v2.xlsx
Figure 4—figure supplement 1
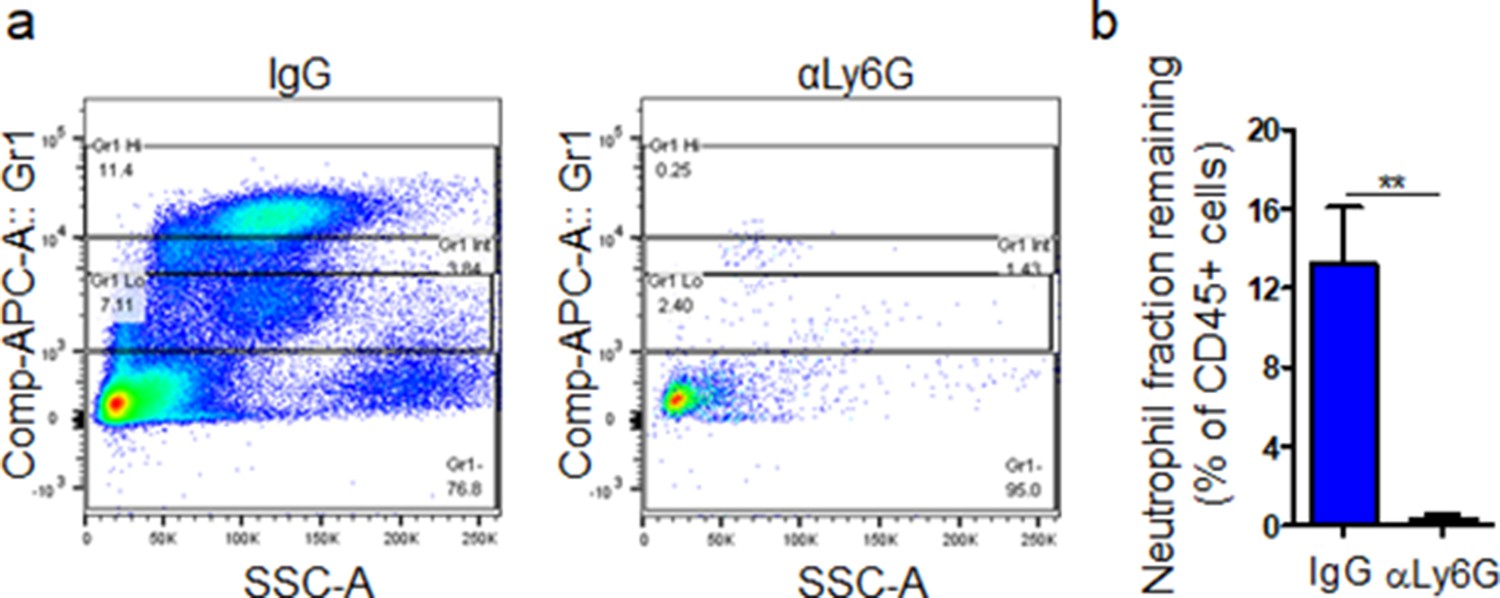
Supplementary data associated with Figure 4.
db/db mice were injected by i.p with anti-Ly6G or IgG isoform. Twenty-four hr after injection, their peripheral bloods were examined for their neutrophil contents by flowcytometry. Representative histograms of neutrophil depletion are shown in (a) and the corresponding data plotted as the Mean ± SEM is shown in (b). (N = 4 mice/group; **p < 0.01. Student’s t-test).
-
Figure 4—figure supplement 1—source data 1
Related to Figure 4—figure supplement 1b.
- https://cdn.elifesciences.org/articles/72071/elife-72071-fig4-figsupp1-data1-v2.xlsx
Figure 5 with 1 supplement
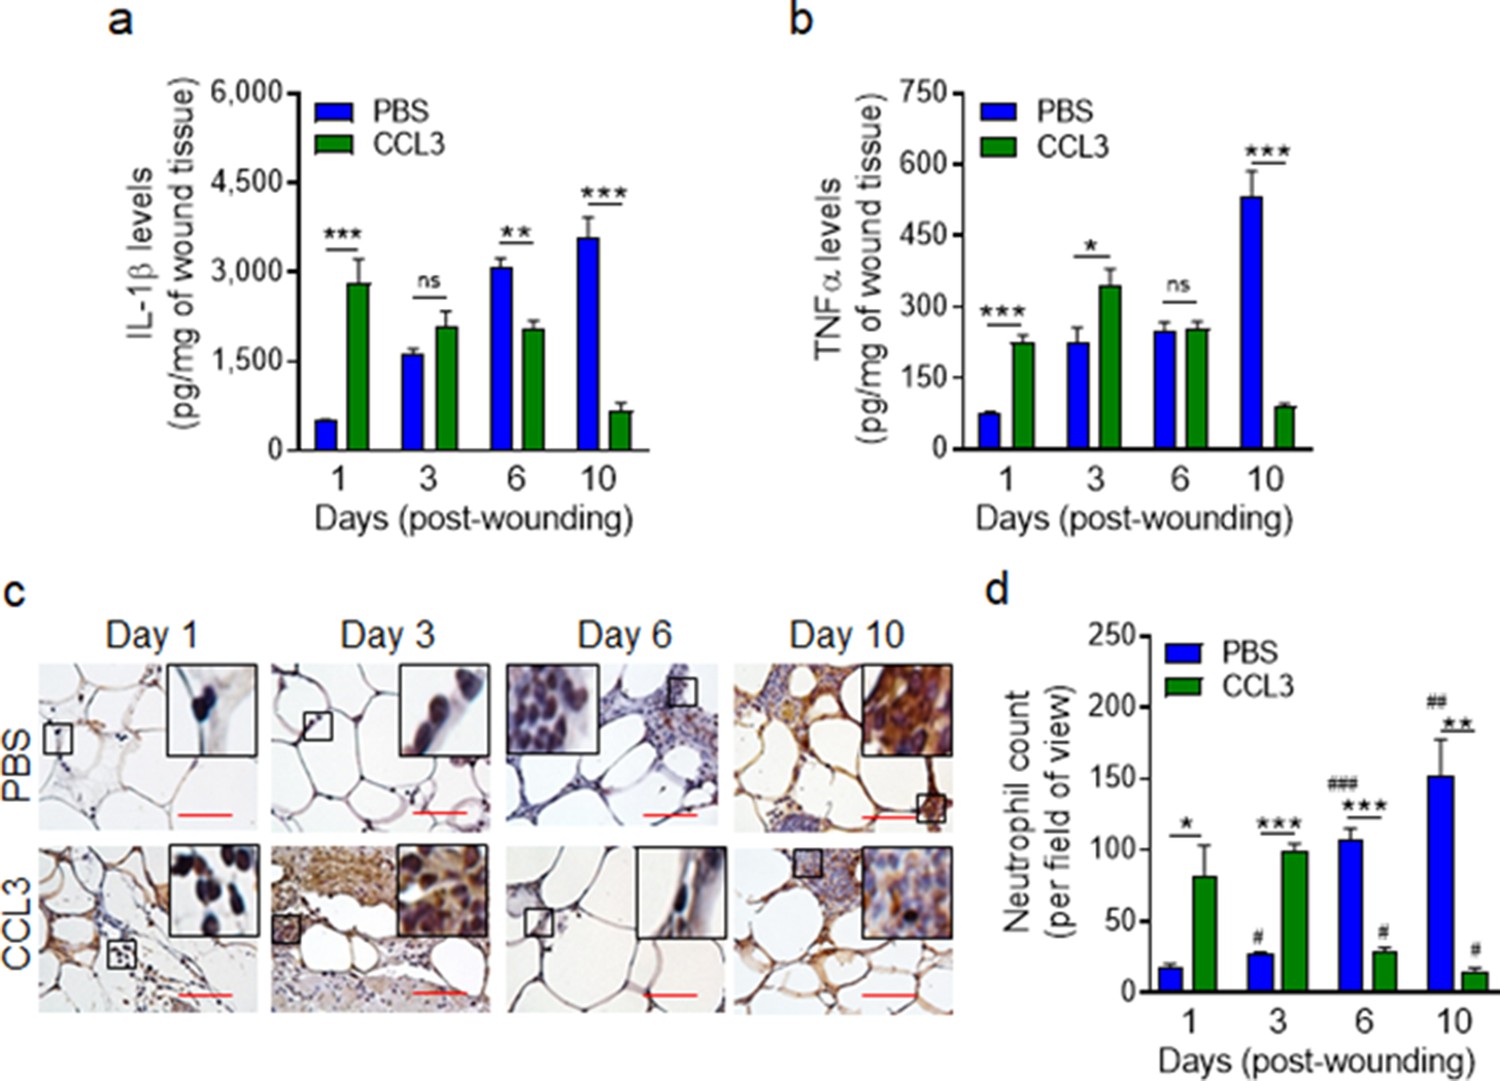
Treatment with CCL3 does not lead to persistent inflammation in infected diabetic wounds.
db/db wounds were treated with PBS or CCL3 (1 μg/wound) and infected with PA103 (1000 CFU/wound). (a–b) Wound tissues were collected at indicated timepoints and assessed for their Il-1β (a) and TNF-α (b) contents by ELISA. (N = 4 mice/group). (c–d) The aforementioned PBS and CCL3-treaded and infected diabetic wounds were assessed for their neutrophil contents by histological analysis using neutrophil marker Ly6G staining. (c) Representative images of regions from underneath the wounds extending in the dermis at ×400 magnification are shown. (Red scale bars = 50 μm). Representative full wound images of these staining can be found in Figure 5—figure supplement 1. (d) The corresponding data were plotted as the Mean ± SEM. (N = 4 mice/group, > 9 random fields/wound/mouse. (*) denotes significance between groups while (#) indicates significance within the same group in comparison to day 1 of respective wound groups. ns = not significant; *p < 0.05, **p < 0.01, ***p < 0.001, #p < 0.05, ##p < 0.01, ###p < 0.001. Statistical analyses between groups were conducted by One-way ANOVA with additional post hoc testing, and pair-wise comparisons between groups were performed or by unpaired Student’s t-test).
-
Figure 5—source data 1
Related to Figure 5a.
- https://cdn.elifesciences.org/articles/72071/elife-72071-fig5-data1-v2.xlsx
-
Figure 5—source data 2
Related to Figure 5b.
- https://cdn.elifesciences.org/articles/72071/elife-72071-fig5-data2-v2.xlsx
-
Figure 5—source data 3
Related to Figure 5d.
- https://cdn.elifesciences.org/articles/72071/elife-72071-fig5-data3-v2.xlsx
Figure 5—figure supplement 1
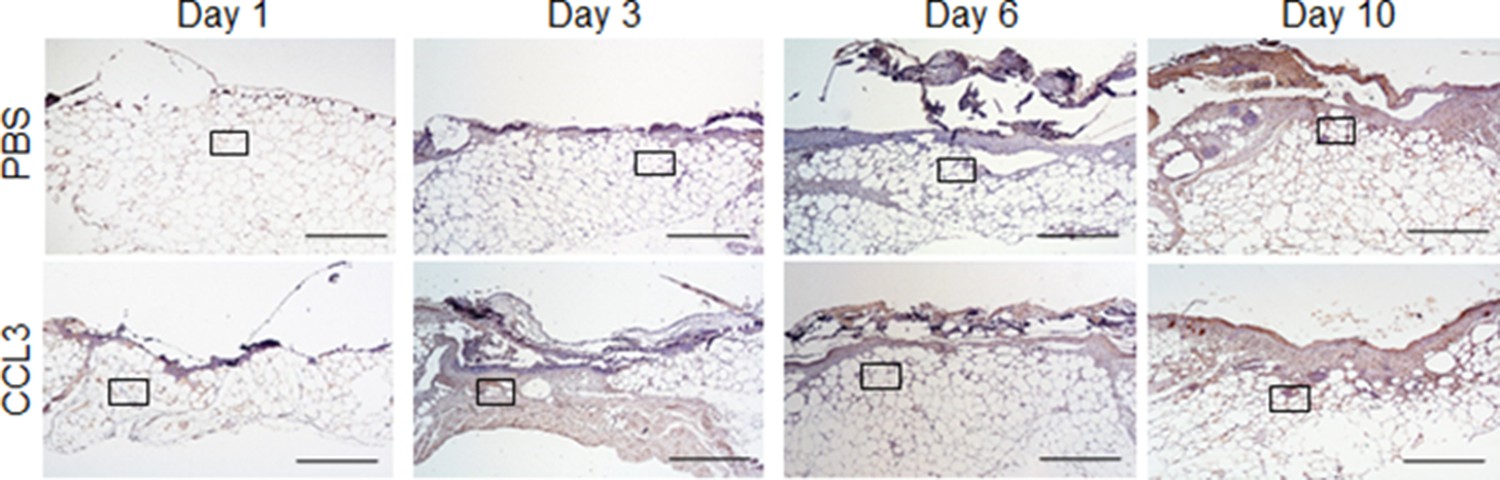
Full wound images associated with Figure 5c.
db/db animals were wounded and treated with either CCL3 or PBS prior to infection with PA103 (103 CFU). Twenty-four hr after treatment and infection, wound tissues were harvested and stained with neutrophil marker Ly6G. Representative low-magnification (×40) images of full wounds are shown. Inserted rectangles show the cropped regions represented in Figure 5c. (Black scale bar = 500 µm).
Figure 6 with 1 supplement

Treatment with CCL3 stimulates healing in infected diabetic wounds.
(a–d) db/db wounds were either treated with PBS or CCL3 and infected with PA103 (1000 CFU). Wound healing was assessed at indicated timepoints by digital photography (a–b) or by H&E histological analysis of re-epithelialization (c–d). Representative images are shown in (a & c). (Black scale bar = 1 mm, and the wound gap is shown by dotted line). The corresponding data for (a & c) are shown in (b & d) as the Mean ± SEM. (e–f) Day 10 db/db wounds (treated with either PBS or CCL3 and infected with PA103) were assessed for fibroblast, myofibroblast, elastin, and cartilage healing markers by vimentin, α-SMA, Masson’s Trichrome, and elastin staining, respectively. (e) Representative regions from underneath the wounds extending in the dermis are shown at ×400 magnification. (Red scale bar = 50 µm. For the corresponding full wound images at ×40 magnification, see Figure 6—figure supplement 1). (f) The corresponding data are plotted as the Mean ± SEM. (N = 4 mice/group for (a–b); and N = 4 mice/group for (c–f). *p < 0.05, **p < 0.01, ***p < 0.001. Statistical analyses between groups were conducted by One-way ANOVA with additional post hoc testing, and pair-wise comparisons between groups were performed or by unpaired Student’s t-test).
-
Figure 6—source data 1
Related to Figure 6b.
- https://cdn.elifesciences.org/articles/72071/elife-72071-fig6-data1-v2.xlsx
-
Figure 6—source data 2
Related to Figure 6d.
- https://cdn.elifesciences.org/articles/72071/elife-72071-fig6-data2-v2.xlsx
-
Figure 6—source data 3
Related to Figure 6f.
- https://cdn.elifesciences.org/articles/72071/elife-72071-fig6-data3-v2.xlsx
Figure 6—figure supplement 1
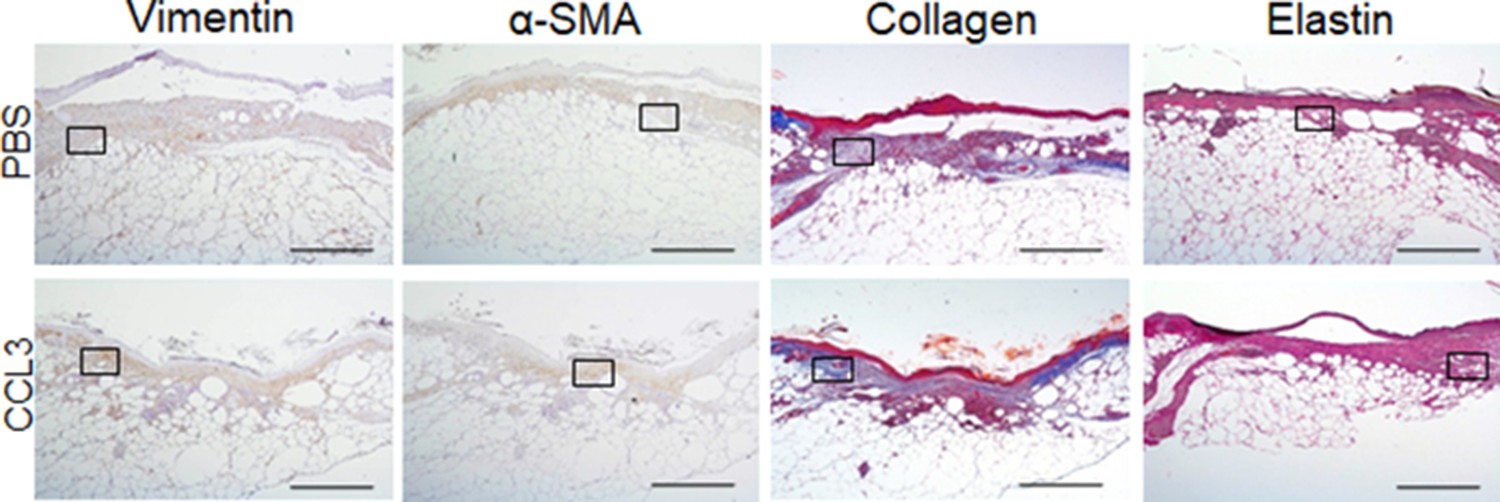
Full wound images associated with Figure 6e.
db/db animals were wounded and treated with either CCL3 or PBS prior to infection with PA103 (103 CFU). Ten days after treatment and infection (Day 10), wound tissues were harvested and assessed for fibroblast, myofibroblast, elastin, and cartilage healing markers by vimentin, α-SMA, Masson’s Trichrome, and elastin staining, respectively. Representative ×40 magnification images of the full wounds are shown, and the high-magnification images and the tabulated data are presented in Figure 6e–f. (Black scale bar = 500 µm. Inserted rectangles show the cropped regions represented in Figure 6e).
Tables
Appendix 1—key resources table
| Reagent type (species) or resource | Designation | Source or reference | Identifiers | Additional information |
|---|---|---|---|---|
| Strain, strain background (C57BL/6 J) | C57BL/6 J | Jackson laboratories | 000664 | |
| Strain, strain background (C57BLKS/J) | C57BLKS-m Leprdb/db | Jackson laboratories | 000662 | |
| Antibody | Anti-Ly-6G/Ly-6C Monoclonal Antibody (RB6-8C5)(Mouse monoclonal) | Thermo Fisher Scientific | Cat# MA1-10401, RRID:AB_11152791 | For neutrophil depletion (100 µg/mouse) |
| Antibody | Anti-Mouse (G3A1) mAb IgG1 Isotype Control antibody(Mouse monoclonal) | Cell Signaling Technologies | Cat#5415, RRID:AB_10829607 | For neutrophil depletion (100 µg/mouse) |
| Antibody | GAPDH antibody (Rabbit polyclonal) | Proteintech | Cat# 1094-I-AP, RRID:AB_2895245 | WB (1:10000) |
| Antibody | Anti-Ly6G antibody clone RB6-8C5 (Rat monoclonal) | Abcam | Cat# ab25377, RRID:AB_470492 | IHC (1:50) |
| Antibody | Anti-FPR1 antibody(Rabbit polyclonal) | NOVUS Biological | Cat# NB100-56473, RRID:AB_838228 | WB (1:1000) |
| Antibody | Anti-FPR2/ FPRL1 antibody(Rabbit polyclonal) | NOVUS Biologicals | Cat# NLS1878, RRID:AB_2294156 | WB (1:1000) |
| Antibody | Anti-PLC1 antibody(Rabbit polyclonal) | Cell Signaling Technology | Cat# cs2822, RRID:AB_2163702 | WB (1:1000) |
| Antibody | Anti-CCR1 antibody(Rabbit polyclonal) | Abnova | Cat# PAB0176, RRID:AB_1018941 | WB (1:500) |
| Antibody | Anti-α-SMA antibody(Rabbit polyclonal) | Abcam | Cat# ab5694, RRID:AB_2223021 | |
| Antibody | Anti-vimentin antibody(Rabbit monoclonal) | Abcam | Cat# ab92547, RRID:AB_10562134 | |
| Antibody | Mouse CCR1 Alexa Fluor 488-conjugated Antibody(Rat monoclonal) | NOVUS Biologicals | Cat# FAB5986G, RRID:AB_2895246 | Flow cytometery |
| Antibody | Alexa Fluor 700 anti-mouse NK-1.1 Antibody(Mouse monoclonal) | BioLegend | Cat# 108729, RRID:AB_2074426 | Flow cytometery |
| Antibody | Alexa Fluor 700 anti-mouse CD3ε Antibody(Syrian Hamster monoclonal) | BioLegend | Cat# 152315, RRID:AB_2632712 | Flow cytometery |
| Antibody | Alexa Fluor 700 anti-mouse CD19 Antibody(Rat monoclonal) | BioLegend | Cat# 115527, RRID:AB_493734 | Flow cytometery |
| Antibody | BV605 Hamster Anti-Mouse CD11c Clone HL3 (RUO)(Hamster monoclonal) | BD Biosciences | Cat# 563057, RRID:AB_2737978 | Flow cytometery |
| Antibody | F4/80 antibody, Cl:A3-1(Rat monoclonal) | Bio-Rad | Cat# MCA497PBT, RRID:AB_1102557 | Flow cytometery Flow cytometery |
| Antibody | BV650 Hamster Anti-Mouse CD11c Clone HL3(Hamster monoclonal) | BD Biosciences | Cat# 564079, RRID:AB_2725779 | Flow cytometery |
| Antibody | BV711 Rat Anti-Mouse CD45 Clone 30-F11(Rat monoclonal) | BD Biosciences | Cat# 563709, RRID:AB_2687455 | Flow cytometery |
| Antibody | NK1.1 Monoclonal Antibody (PK136), PE, eBioscience(Mouse monoclonal) | Thermo Fisher Scientific | Cat# 12-5941-82, RRID:AB_466050 | Flow cytometery |
| Antibody | CD19 Monoclonal Antibody (eBio1D3 (1D3)), PE, eBioscience(Rat monoclonal) | Thermo Fisher Scientific | Cat# 12-0193-82, RRID:AB_657659 | Flow cytometery |
| Antibody | CD3e Monoclonal Antibody (145–2 C11), PE, eBioscience(Hamster monoclonal) | Thermo Fisher Scientific | Cat# 12-0031-82, RRID:AB_465496 | Flow cytometery |
| Antibody | FPR1 Polyclonal Antibody(abbit polyclonal) | Thermo Fisher Scientific | Cat# PA1-41398, RRID:AB_2247097 | Flow cytometery |
| Antibody | Goat anti-Rabbit IgG (H + L) Highly Cross-Adsorbed Secondary Antibody, Alexa Fluor 594(Goat polyclonal) | Thermo Fisher Scientific | Cat# A-11037, RRID:AB_2534095 | Flow cytometery |
| Antibody | Ly6G Monoclonal Antibody (1A8-Ly6g), PE-Cyanine7, eBioscience(Rat monoclonal) | Thermo Fisher Scientific | Cat# 25-9668-82, RRID:AB_2811793 | Flow cytometery |
| Antibody | PerCP Cy5.5 CD45 antibody(Rat monoclonal) | BD Biosciences | Cat# 550994, RRID:AB_394003 | Flow cytometery |
| Antibody | APC Gr1, PE CD11b antibody(Rat monoclonal) | BD Biosciences | Cat# 553129, RRID:AB_398532 | Flow cytometery |
| Antibody | FITC CD69 antibody(Hamster monoclonal) | BD Biosciences | Cat# 557392, RRID:AB_396675 | Flow cytometery |
| Antibody | PECy7 F4/80 antibody(Rat monoclonal) | BioLegend | Cat# 123114, RRID:AB_893478 | Flow cytometery |
| Commercial assay or kit | LIVE/DEAD Fixable Aqua Dead Cell Stain Kit, for 405 nm excitation | ThermoFisher Scientific | Cat# L34966 | |
| Sequence-based reagent | FPR1_F | Integrated DNA Technologies | RT-PCR primers | GAGCCTAGCCAAGAAGGTAATC |
| Sequence-based reagent | FPR1_R | Integrated DNA Technologies | RT-PCR primers | TCCCTGGTCCAAGTCTACTATT |
| Sequence-based reagent | FPR2_F | Integrated DNA Technologies | RT-PCR primers | TTGTCTCAATCCGATGCTCTATG |
| Sequence-based reagent | FPR2_R | Integrated DNA Technologies | RT-PCR primers | TCAGGGCTCTCTCAAGACTATAA |
| Sequence-based reagent | Plcg1_F | Integrated DNA Technologies | RT-PCR primers | GGTGAGGCCAAATGTGAGATA |
| Sequence-based reagent | Plcg1_R | Integrated DNA Technologies | RT-PCR primers | GGGCAACCAAGAGGAATGA |
| Sequence-based reagent | Ccr1_F | Integrated DNA Technologies | RT-PCR primers | GCTATGCAGGGATCATCAGAAT |
| Sequence-based reagent | Ccr1_R | Integrated DNA Technologies | RT-PCR primers | GGTCCAGAGGAGGAAGAATAGA |
| Sequence-based reagent | Ccl3_F | Integrated DNA Technologies | RT-PCR primers | TCACTGACCTGGAACTGAATG |
| Sequence-based reagent | Ccl3_R | Integrated DNA Technologies | RT-PCR primers | CAGCTTATAGGAGATGGAGCTATG |
| Sequence-based reagent | GAPDH_F | Integrated DNA Technologies | RT-PCR primers | TTGGGTTGTACATCCAAGCA |
| Sequence-based reagent | GAPDH_R | Integrated DNA Technologies | RT-PCR primers | CAAGAAACAGGGGAGCTGAG |
| Sequence-based reagent | 18 S_F | Integrated DNA Technologies | RT-PCR primers | CACGGACAGGATTGACAGATT |
| Sequence-based reagent | 18 S_R | Integrated DNA Technologies | RT-PCR primers | GCCAGAGTCTCGTTCGTTATC |
| Commercial assay or kit | Myeloperoxidase (MPO) Mouse ELISA Kit | Thermo Fisher Scientific | Cat# EMMPO | |
| Commercial assay or kit | IL-1b ELISA kit | Thermo Fisher Scientific | Cat# 88-7013-88 | |
| Commercial assay or kit | TNF- a ELISA kit | Thermo Fisher Scientific | Cat# 88-7324-88 | |
| Commercial assay or kit | Cyclic AMP Competitive ELISA Kit | Cayman chemical | Cat# 581,001 | |
| Commercial assay or kit | EasySep Human Monocytes Enrichment Kit | STEMCELL Technologies | Cat# 19,359 | |
| Commercial assay or kit | EasySep Mouse monocytes Enrichment Kit | STEMCELL Technologies | Cat# 19,861 | |
| Commercial assay or kit | SuperScript III First-Strand Synthesis System | Thermo Fisher | Cat# 18080051 | |
| Peptide, recombinant protein | CCL3 (recombinant mouse CCL3/MIP-1α protein) | R & D Systems | Cat# 450-MA | |
| Peptide, recombinant protein | N-formyl-Met-Leu-Phe (fMLP) | Sigma | Cat# 59880-97-6 | |
| Peptide, recombinant protein | Recombinant Human CXCL1/GRO alpha Protein | R & D Systems | Cat# 275-GR | |
| Peptide, recombinant protein | Recombinant Mouse CXCL1/KC Protein | R & D Systems | Cat# 453-KC | |
| Software, algorithm | GraphPad | GraphPad | https://graphpad.com/scientific-software/prism/ | |
| Other | Hematoxylin | Thermo Fisher Scientific | Cat# 7,111 L | |
| Other | Eosin Y | Thermo Fisher Scientific | Cat# 7,211 L | |
| Other | Bluing Reagent | Thermo Fisher Scientific | Cat# 7,301 L | |
| Other | Masson’s Trichrome stain | Abcam | Cat# ab150686 | |
| Other | EasySep Buffer | STEMCELL Technologies | Cat. No. 20,144 | |
| Other | SYBR Green PCR Master Mix | Thermo Fisher | Cat. No. 4309155 | |
| Other | Collagenase D | Sigma | Cat# 9001-12-1 | |
| Other | Calcein AM | Thermo Fischer Scientific | Cat# C1430 |
Additional files
Download links
A two-part list of links to download the article, or parts of the article, in various formats.
Downloads (link to download the article as PDF)
Open citations (links to open the citations from this article in various online reference manager services)
Cite this article (links to download the citations from this article in formats compatible with various reference manager tools)
Overriding impaired FPR chemotaxis signaling in diabetic neutrophil stimulates infection control in murine diabetic wound
eLife 11:e72071.
https://doi.org/10.7554/eLife.72071


