Standardizing workflows in imaging transcriptomics with the abagen toolbox
- McConnell Brain Imaging Centre, Montreal Neurological Institute, McGill University, Canada
- School of Psychological Sciences & Monash Biomedical Imaging, Monash University, Australia
- School of Physics, University of Sydney, Australia
Figures
Figure 1
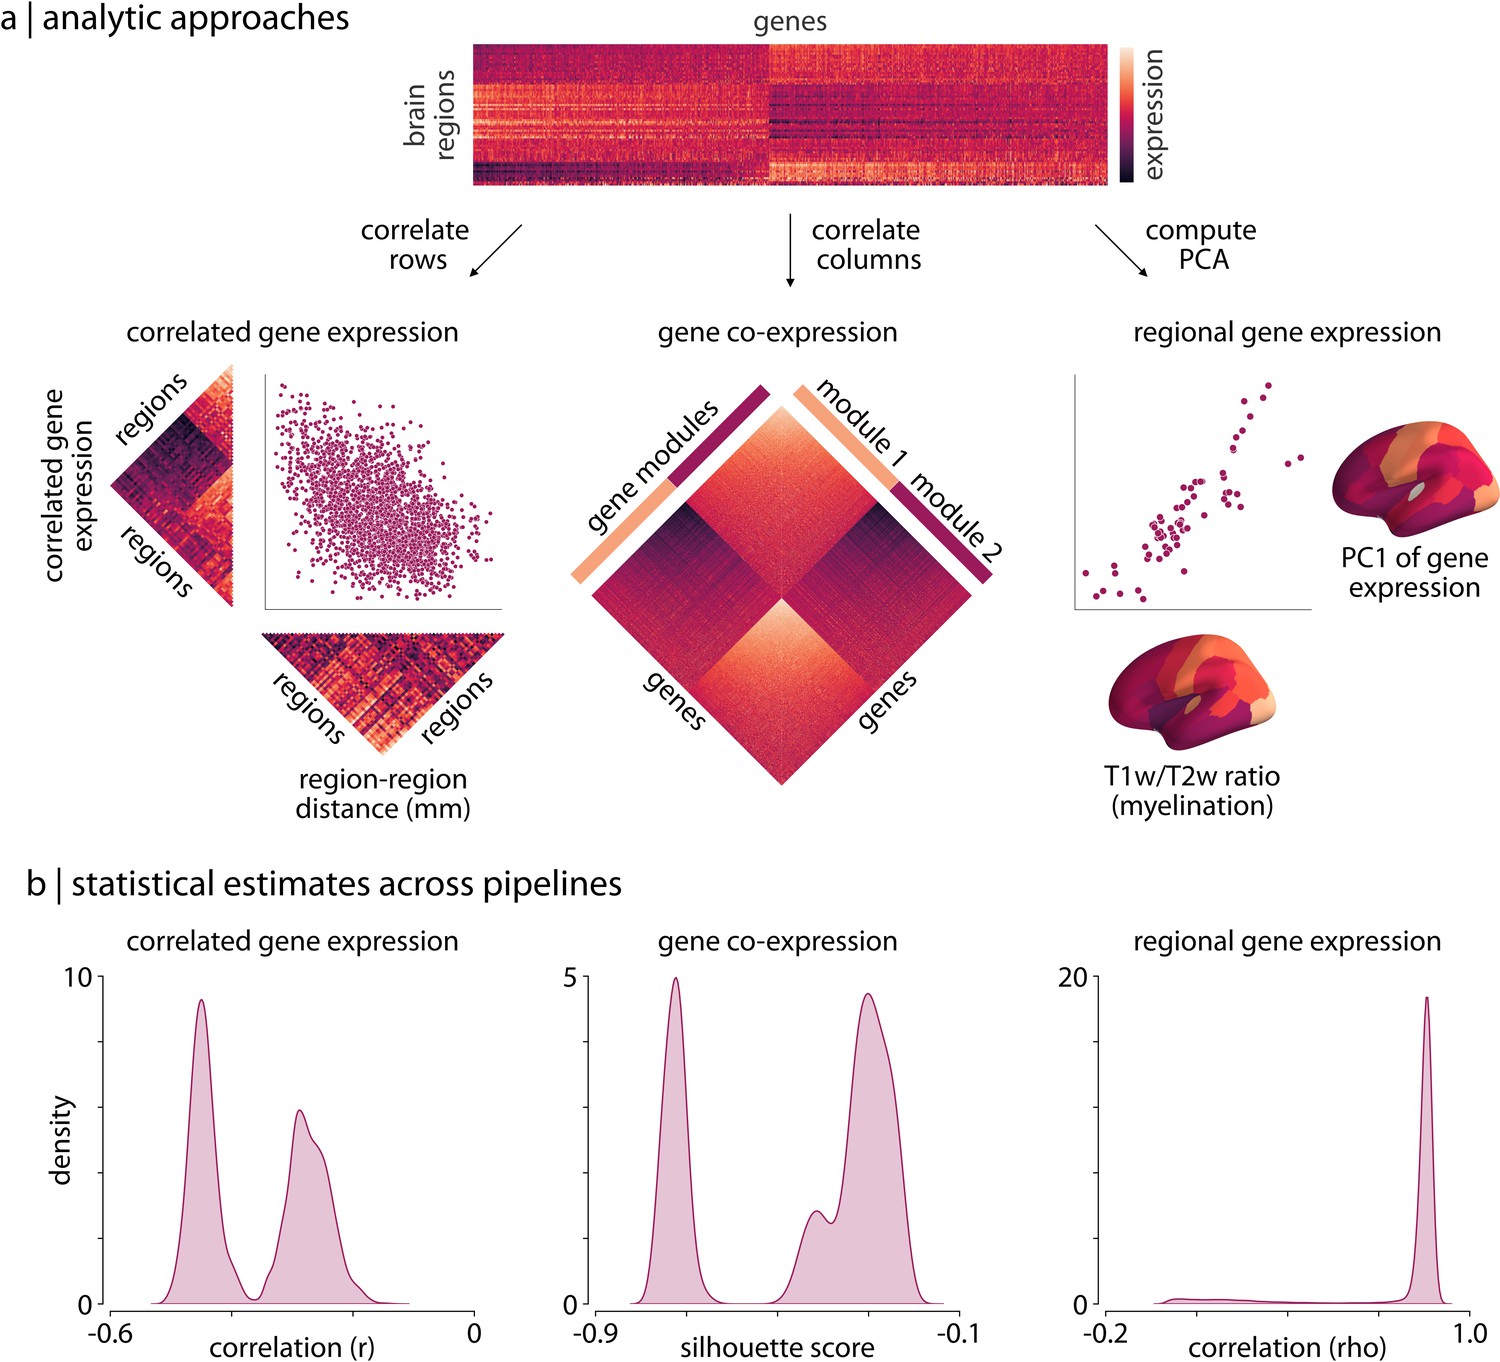
Processing choices influence transcriptomic analyses.
(a) Examples of the three analyses used to assess differences in gene expression matrices generated by transcriptomic pipelines. First row: a depiction of the region-by-gene expression matrix generated from one of the 746,496 tested processing pipelines. Second row, left: we compute the correlation between rows of each matrix to generate a symmetric region × region CGE matrix. We then compute the correlation between the upper triangle of this CGE matrix and the upper triangle of a regional distance matrix to examine the degree to which CGE decays with increasing distance between regions (Arnatkeviciute et al., 2019). Second row, middle: we compute the Euclidean distance between columns of each matrix to generate a gene × gene GCE matrix. We use previously defined functional gene communities (Oldham et al., 2008) to compute a silhouette score for this GCE matrix to investigate whether genes within a module have more similar patterns of spatial expression than genes between modules. Second row, right: the first principal component is extracted from the RGE matrix. We compute the correlation between this principal component and the whole-brain T1w/T2w ratio (Burt et al., 2018) to understand how closely these maps covary across the brain. (b) The full statistical distributions from each of the three analyses for all 746,496 pipelines. Left panel: Spearman correlation values, , from the CGE analyses. Middle panel: silhouette scores from the GCE analyses. Right panel: Spearman correlation coefficients, , from the RGE analyses. CGE: correlated gene expression; GCE: gene co-expression; RGE: regional gene expression.
Figure 2

Parameter choice differentially impacts statistical estimates.
(a) Rank of the relative importance for each parameter (-axis) across all three analyses (-axis). Warmer colors indicate parameters that have a greater influence on statistical estimates. (b) Statistical distributions from the three analyses, shown as kernel density plots, separated by choice of gene normalization method (the most impactful parameter as shown in panel a). (c) Density plots of the statistical estimates for all 746,496 pipelines shown along the first two principal components, derived from the 746,496 (pipeline) x 3 (statistical estimates) matrix, representing how different the statistical estimates from each of the three analyses are relative to other pipelines. Left panel: pipelines are colored based on choice of gene normalization method, where each color represents 1/3 of the pipelines. Here, the pipelines in which no normalization was applied (purple) are distinguished from those in which some form of normalization was applied (blue and brown). Right panel: pipelines are colored based on whether gene normalization was performed within (True, red) or across (False, purple) structural classes (i.e. cortex, subcortex/brainstem, cerebellum; see Materials and methods: Gene expression pipelines for more information).
Figure 3
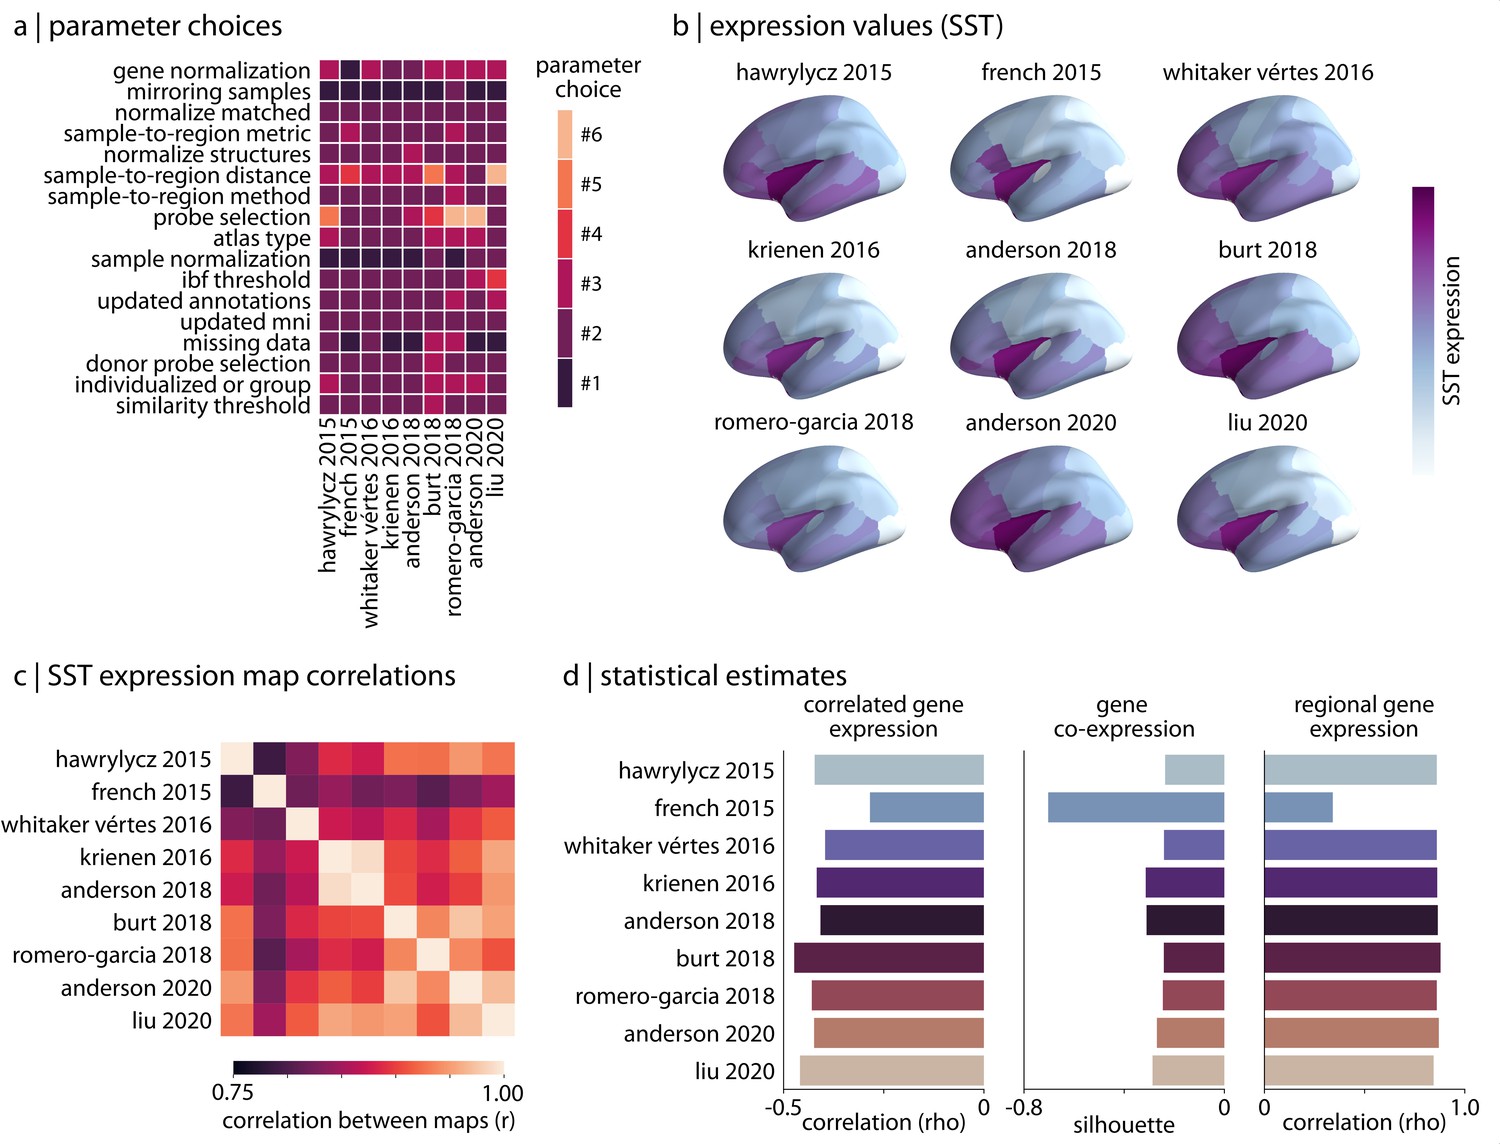
Reproducing published pipelines.
(a) Parameter choices used in the reproduction of published pipelines. Processing steps with categorical choices (e.g., gene normalization) were converted to numerical choices for display purposes only. These choices reflect the range of choices enumerated in Table 1. (b) Relative expression values of cortical somatostatin (SST) generated by each of the reproduced pipelines. Value ranges vary based on pipeline processing options. (c) The Pearson correlation between the cortical somatostatin (SST) maps generated by the nine pipelines shown in panel (b). (d) Statistical estimates from the three analyses described in Materials and methods: Analytic approaches applied to expression data from each of the published pipelines.
Figure 4
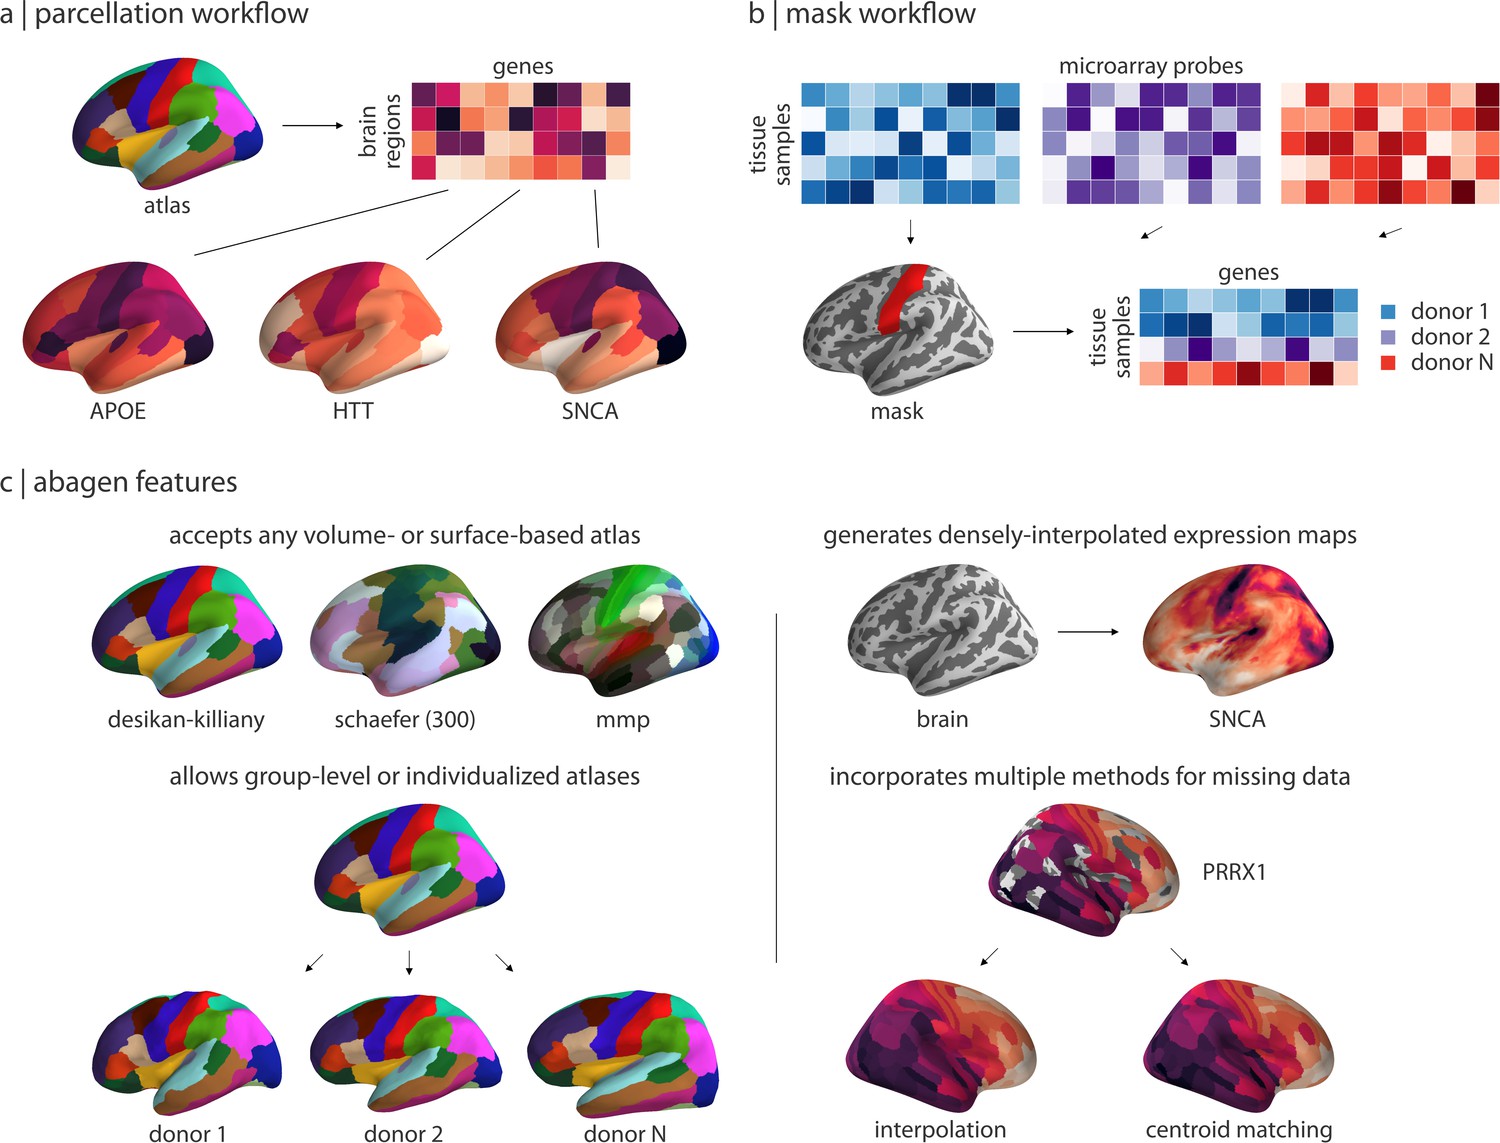
Workflows and features in the abagen toolbox.
(a) The primary workflow of abagen, used in the reported analyses, accepts a brain atlas and returns a parcellated brain-region-by-gene expression matrix. (b) An alternative abagen workflow accepts a regional mask and returns a processed tissue-sample-by-gene expression matrix, for all tissue samples from the six AHBA donors that fall within boundaries of the mask. (c) Examples of selected features from the abagen workflows and additional toolbox functionality. Top left: examples of some commonly-used atlases that can be employed with the parcellation workflow shown in panel (a). Bottom left: abagen can accept either standard atlases (i.e. in MNI space) or atlases defined in the space of the six individual donors from the AHBA. Top right: an additional workflow available in abagen can be used to generate densely-interpolated expression maps from AHBA data using a k-nearest neighbors interpolation algorithm. Bottom right: using high-resolution atlases in the parcellation workflow (panel a) may result in some parcels being assigned no expression data; abagen supports two methods for assigning values to such regions.
Figure 5
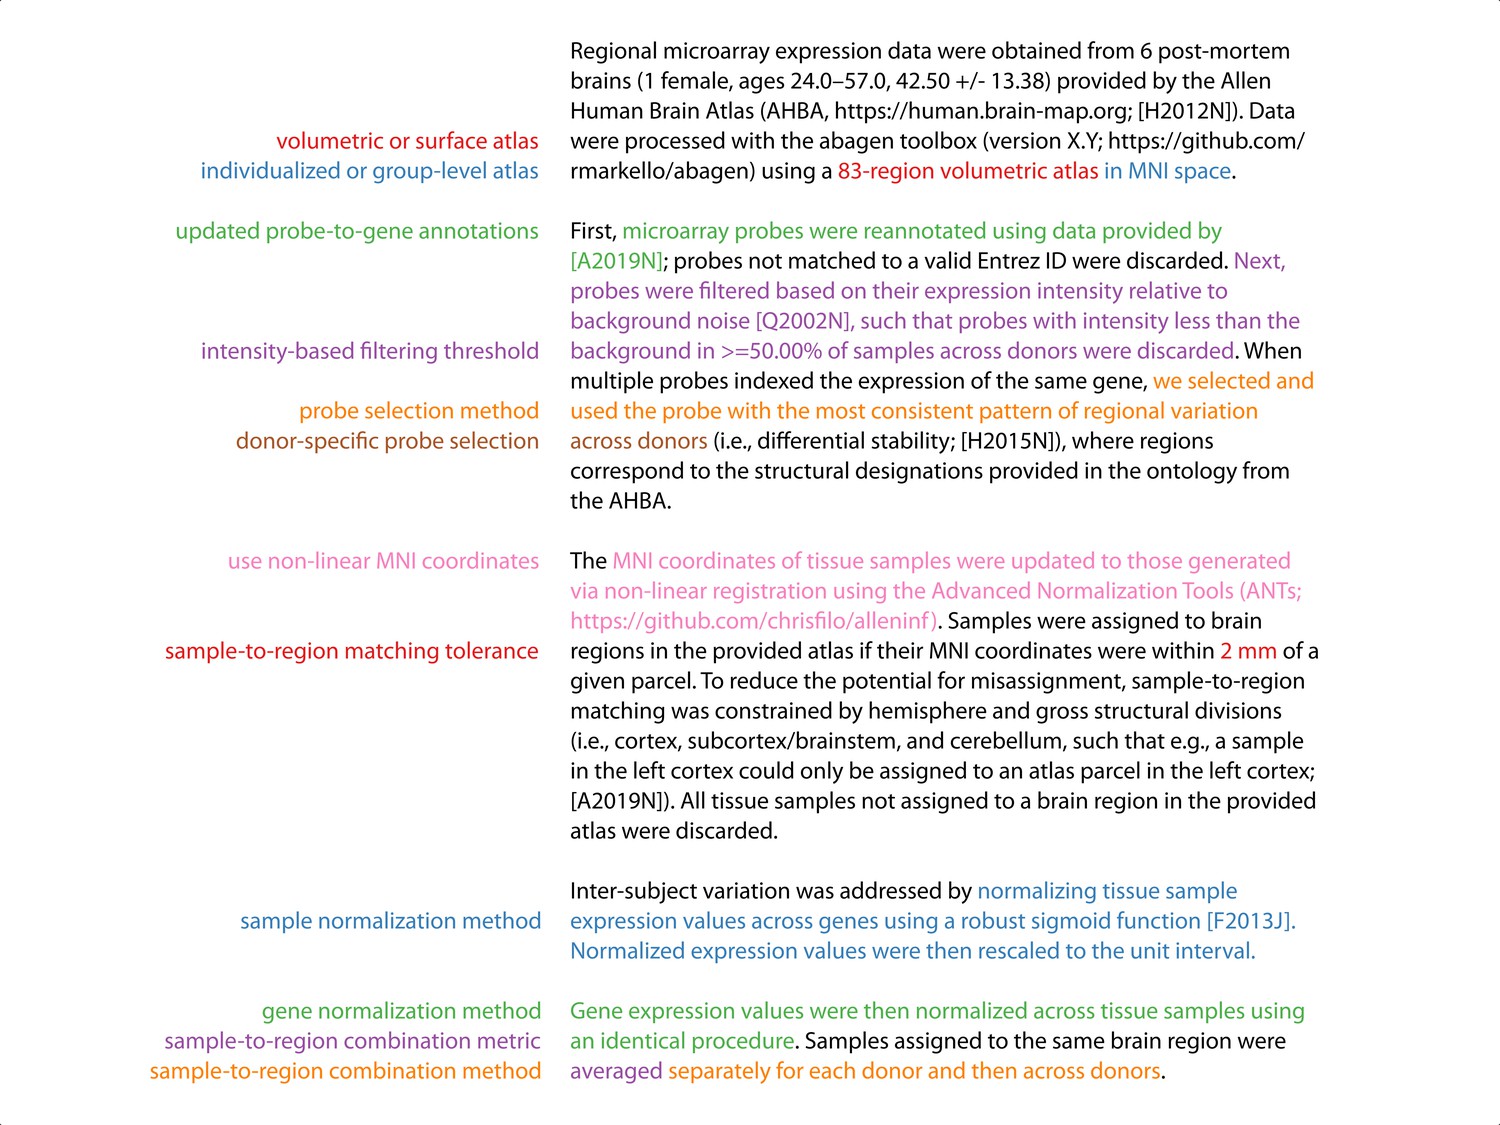
Annotated example abagen report.
Example of an automatically generated methods section report from the abagen toolbox. Processing steps are shown on the left and the relevant methods text—which is updated when these steps are modified—is shown in the same font color on the right. Reports also include a formatted reference section and relevant equations; these are not shown here for conciseness. Note that some processing steps (e.g. normalizing within structures, missing data handling) are omitted here because they are not run by default (see Supplementary file 1).
Tables
Table 1
Abagen pipeline options.
Overview of 17 options to be considered when processing the AHBA data. The Choices column indicates the number of parameters explored in the current report (numerator) and the total number of parameters possible for the given option (denominator). A denominator of indicates a hypothetically near-infinite parameter space. The Description column gives a brief overview of the processing choice; for more detail refer to the relevant section in Materials and methods: Gene expression pipelines.
| Option | Choices | Description |
|---|---|---|
| Volumetric or surface atlas | 2/2 | Whether to use a volumetric or surface representation of the atlas |
| Individualized or group atlas | 1/2 | Whether to use individualized donor-specific atlases or a group-level atlas |
| Use non-linear MNI coordinates | 2/2 | Whether to use updated MNI coordinates provided by alleninf package |
| Mirror samples across L/R hemisphere | 3/4 | Whether to mirror (i.e., duplicate) samples across hemisphere boundary |
| Update probe-to-gene annotations | 2/2 | Whether to update probe annotations |
| Intensity-based filtering threshold | 3/ | Threshold for intensity-based filtering of probes |
| Inter-areal similarity threshold | 1/ | Threshold for removing samples with low inter-areal correspondence |
| Probe selection method | 6/8 | Method by which to select which probe(s) should represent a given gene |
| Donor-specific probe selection | 3/3 | How specified probe selection should integrate data from different donors |
| Missing data method | 2/3 | How to handle when brain regions are not assigned expression data |
| Sample-to-region matching tolerance | 3/ | Distance tolerance for matching tissue samples to atlas brain regions |
| Sample normalization method | 3/10 | Method for normalizing tissue samples (across genes) |
| Gene normalization method | 3/10 | Method for normalizing genes (across tissue samples) |
| Normalize only matched samples | 2/2 | Whether to perform gene normalization for all versus matched samples |
| Normalizing discrete structures | 2/2 | Whether to perform gene normalization within structural classes |
| Sample-to-region combination method | 2/2 | Whether to aggregate tissue samples in regions within or across donors |
| Sample-to-region combination metric | 2/2 | Metric for aggregating tissue samples into atlas brain regions |
Additional files
-
Transparent reporting form
- https://cdn.elifesciences.org/articles/72129/elife-72129-transrepform1-v2.pdf
-
Supplementary file 1
Default abagen pipeline options.
The default settings for the 17 processing steps considered when processing the AHBA data with abagen. An entry of ‘—' indicates that this is a required, user-supplied parameter. A blank entry indicates that the processing step is not implemented by default. Refer to Table 1 and Methods: Gene expression pipelines for further details.
- https://cdn.elifesciences.org/articles/72129/elife-72129-supp1-v2.pdf
Download links
A two-part list of links to download the article, or parts of the article, in various formats.
Downloads (link to download the article as PDF)
Open citations (links to open the citations from this article in various online reference manager services)
Cite this article (links to download the citations from this article in formats compatible with various reference manager tools)
Standardizing workflows in imaging transcriptomics with the abagen toolbox
eLife 10:e72129.
https://doi.org/10.7554/eLife.72129


