Short-chain fatty acids activate acetyltransferase p300
- Wisconsin Institute for Discovery, United States
- Department of Biomolecular Chemistry, University of Wisconsin – Madison, United States
- Morgridge Institute for Research, United States
Figures
Figure 1 with 1 supplement
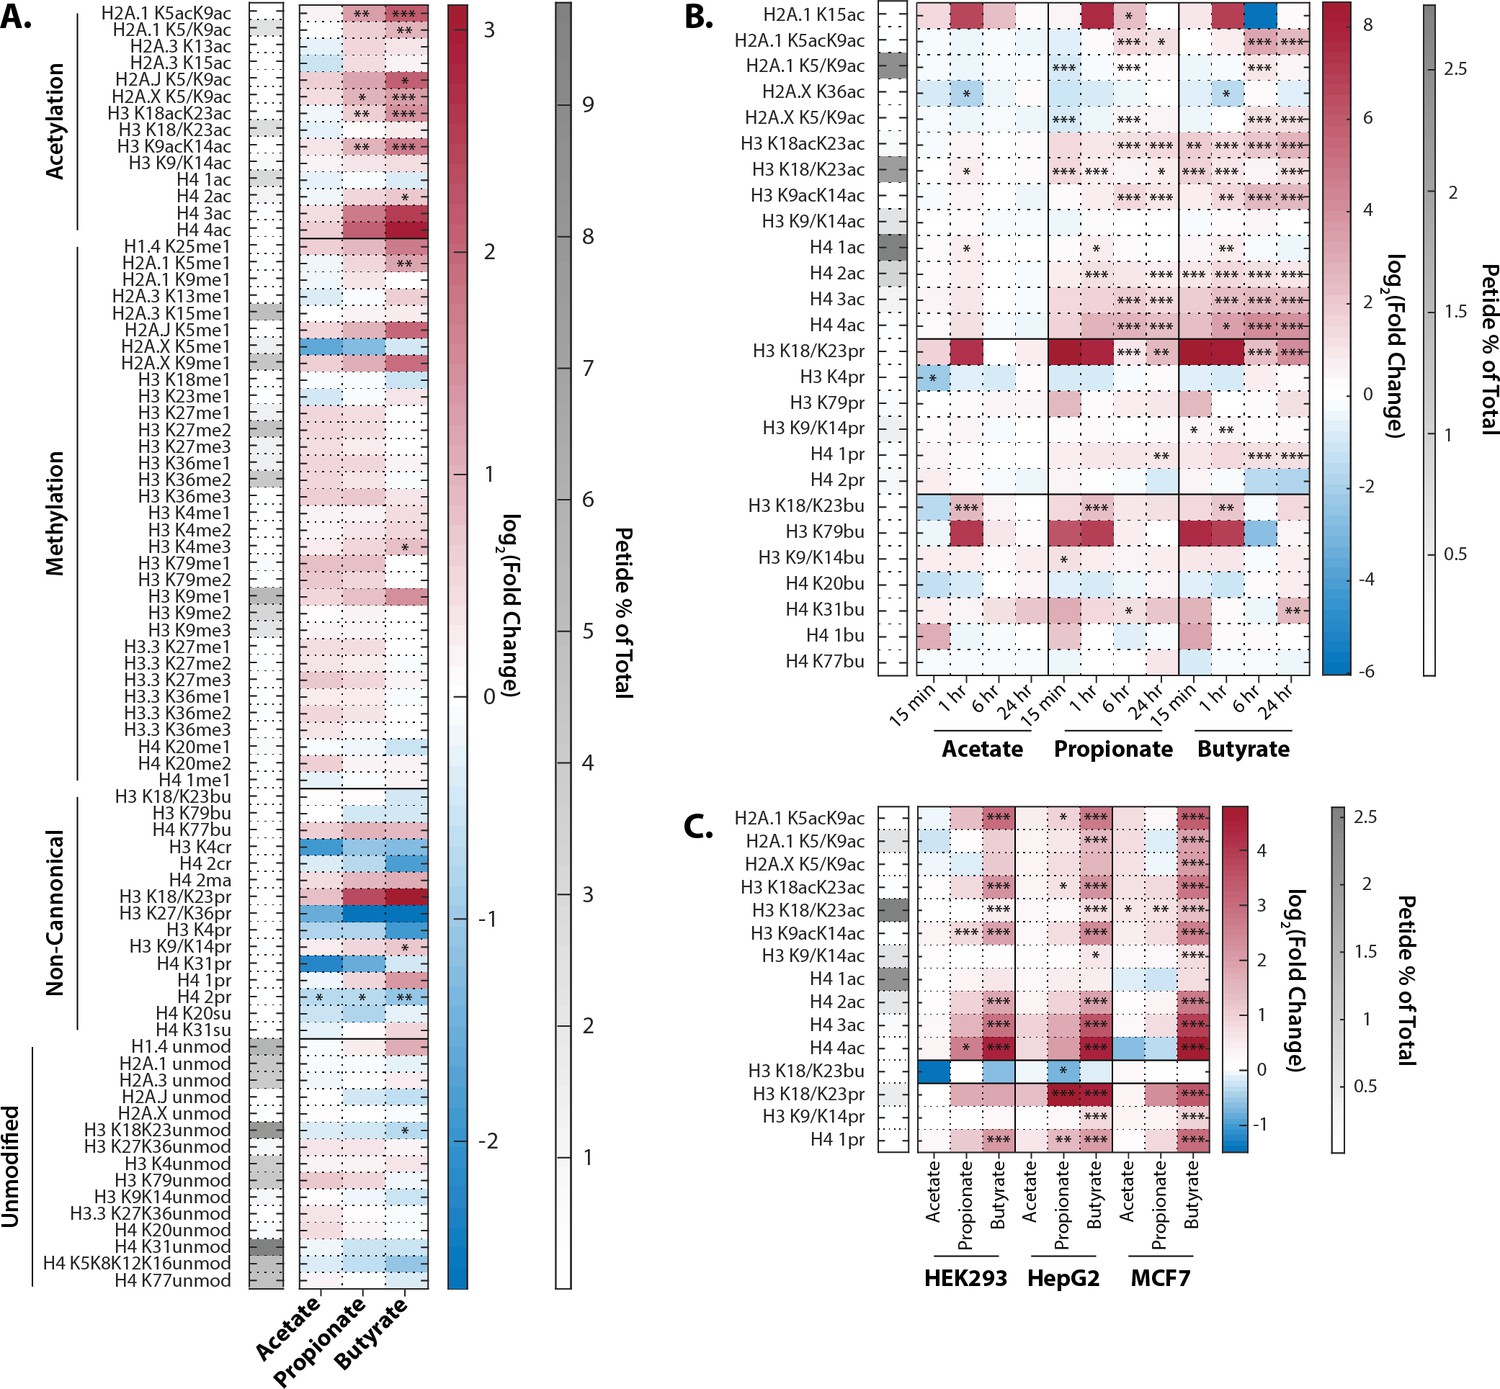
Extracellular propionate and butyrate induce histone hyperacetylation.
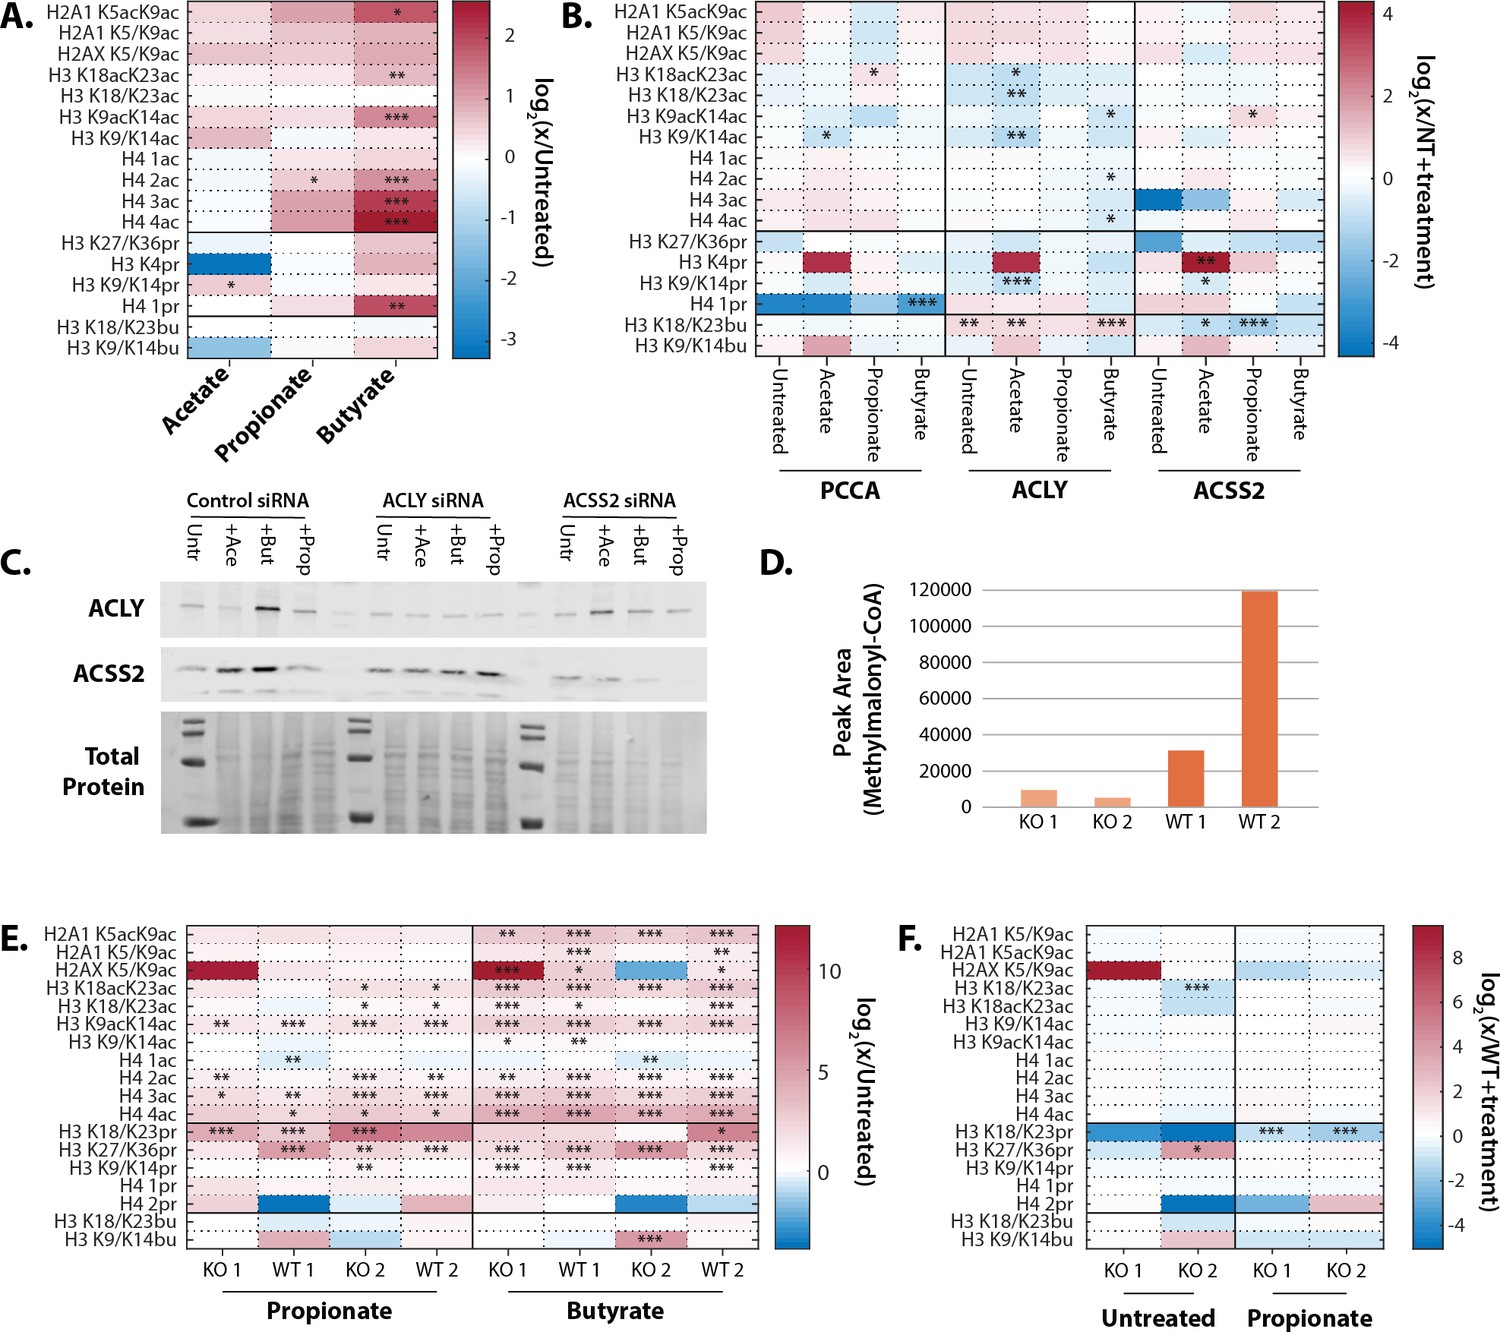
(A) Histone proteomics of HCT116 cells treated with 1 mM acetate, propionate, or butyrate for 1 hr. (B) Histone acylation over a time course of 1 mM acetate, propionate, or butyrate treatment. (C) SCFA treatment (1 mM, 1 hr). of HEK293, MCF7, and HepG2 cell lines. All values are log2(fold change) over untreated, time-matched controls. *=p≤0.05, **=p≤0.01, ***=p≤0.001. n=3 per condition.
Figure 1—figure supplement 1
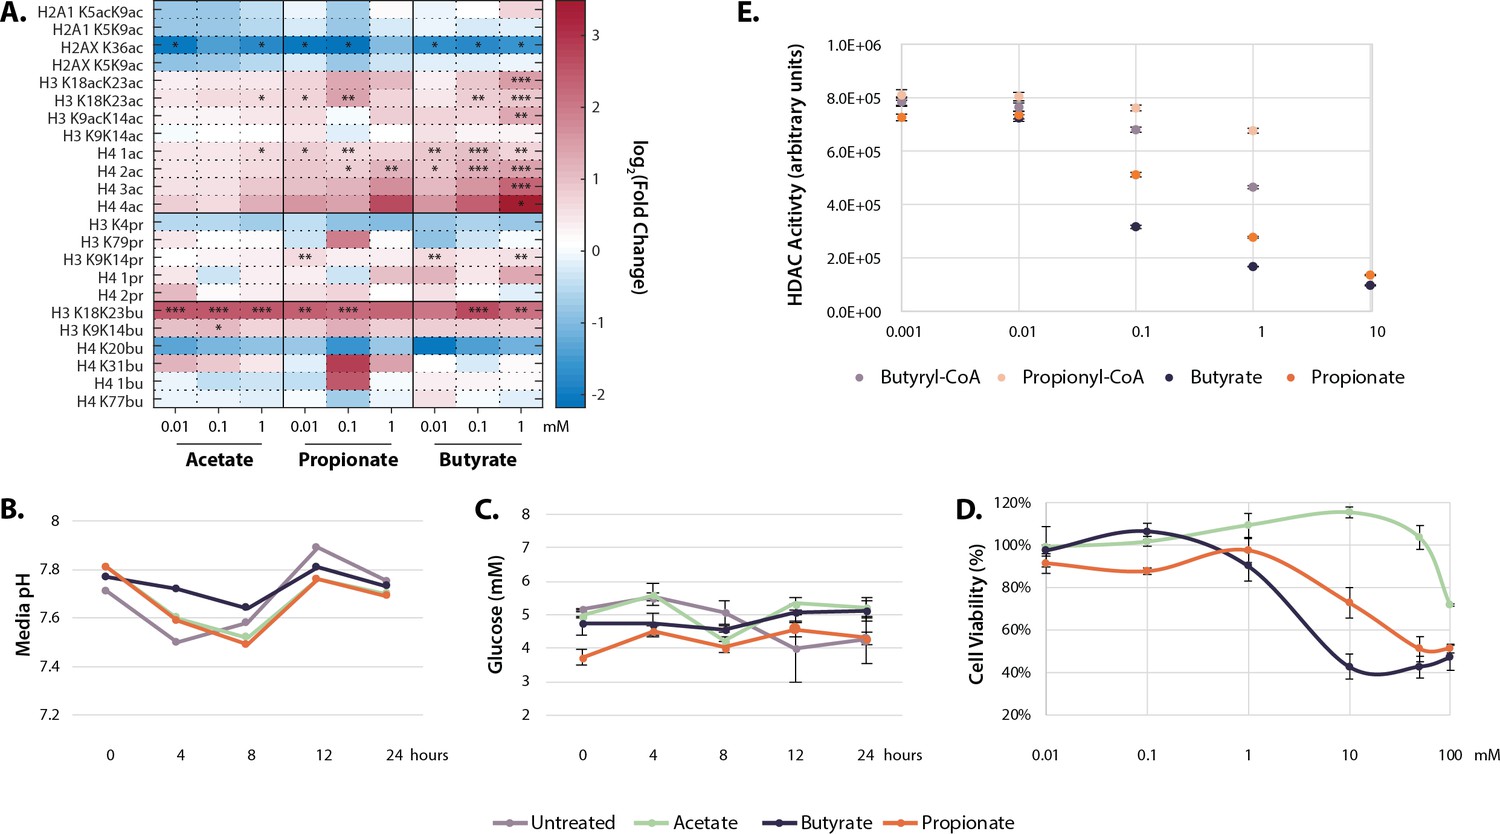
Physiological effects of SCFA treatment.
(A) Histone proteomics of HCT116 cells treated with 0.01, 0.1, or 1 mM acetate, propionate, or butyrate for 1 hr. Values are log2(fold change) over untreated control. *=p≤0.05, **=p≤0.01, ***=p≤0.001. (B) Media pH of HCT116 cells over 24 SCFA treatment. (C) Media glucose concentration over 24 hr SCFA treatment. (D) Cytotoxicity curves for acetate, propionate, and butyrate after 24 hr treatment. (E) Values used for HDAC inhibition calculations in Table 1. All experiments were repeated at least two times with an n=3 per condition, representative data is shown. Raw values for B-E can be found in Source data 1. HDAC, histone deacetylase; SCFA, short-chain fatty acid.
Figure 2 with 2 supplements
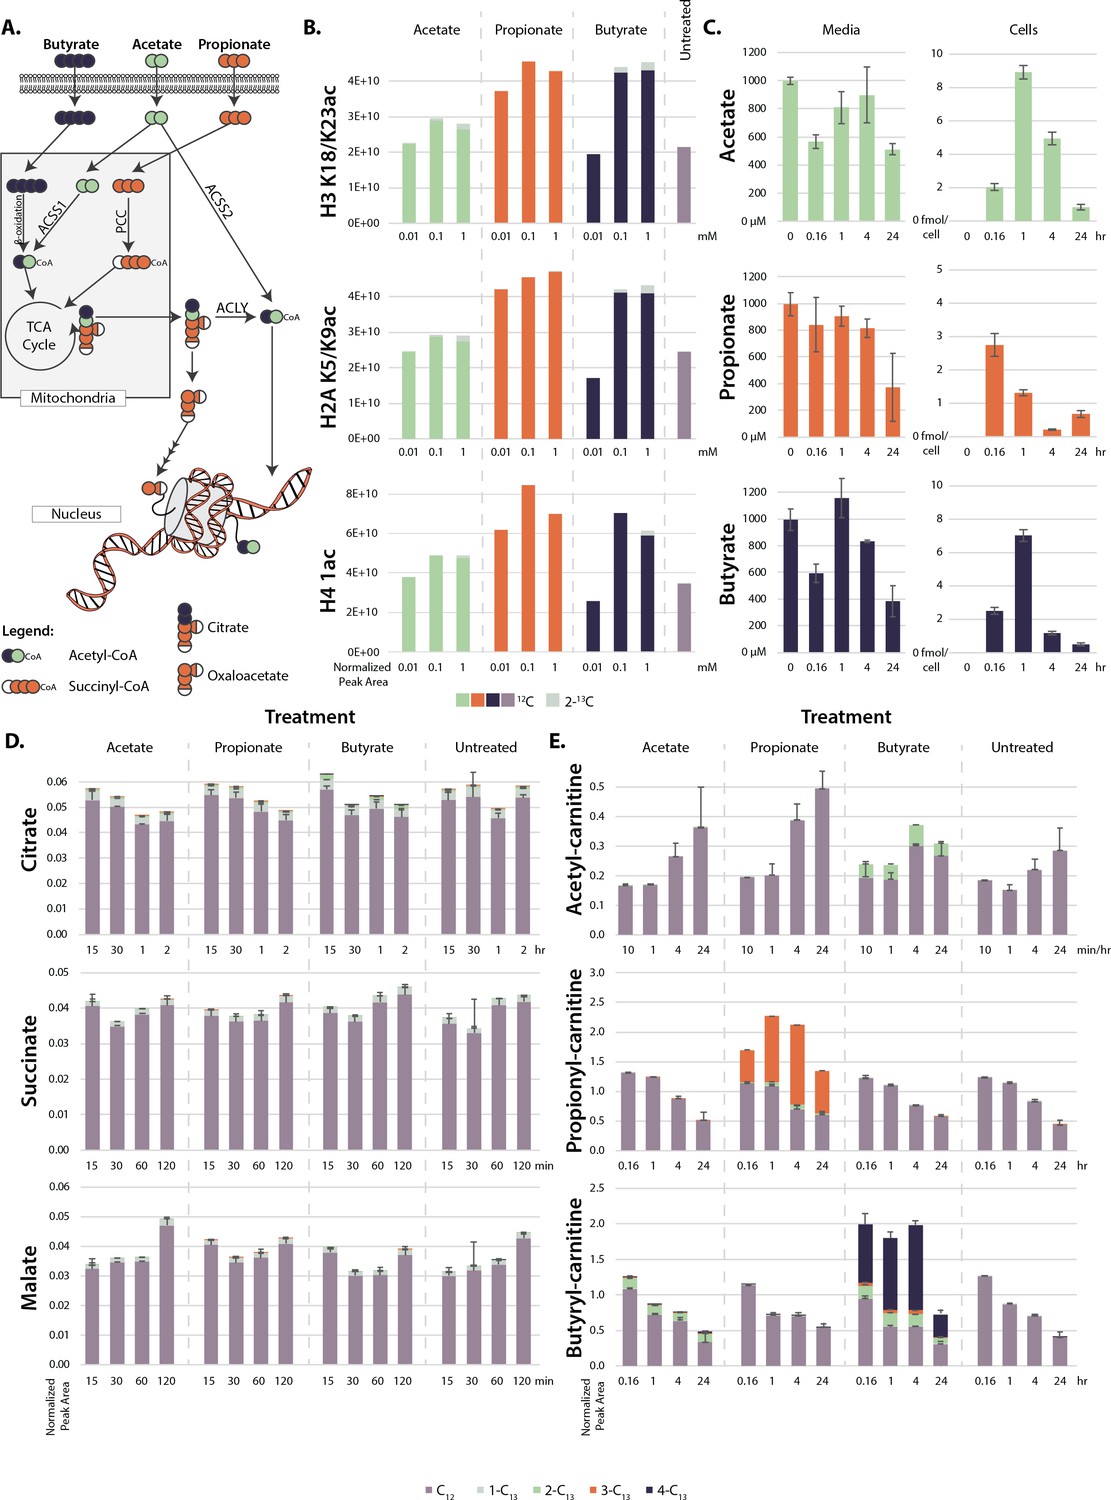
Metabolism of extracellular short-chain fatty acids (SCFAs).
(A) Overall scheme of SCFA metabolism. (B) Proportion of 13C on histones after 4 hr treatment with labeled SCFAs. (C) Concentration of SCFAs in media (µM) and in cells (femtomole/cell) over a 24 hr time course. (D, E) 13C labeling of TCA cycle metabolites (D) and acyl-carnitines (E) over a 24-hr time course. Values are average and standard deviation of normalized signal intensity of ≥3 biological replicates.
Figure 2—figure supplement 1
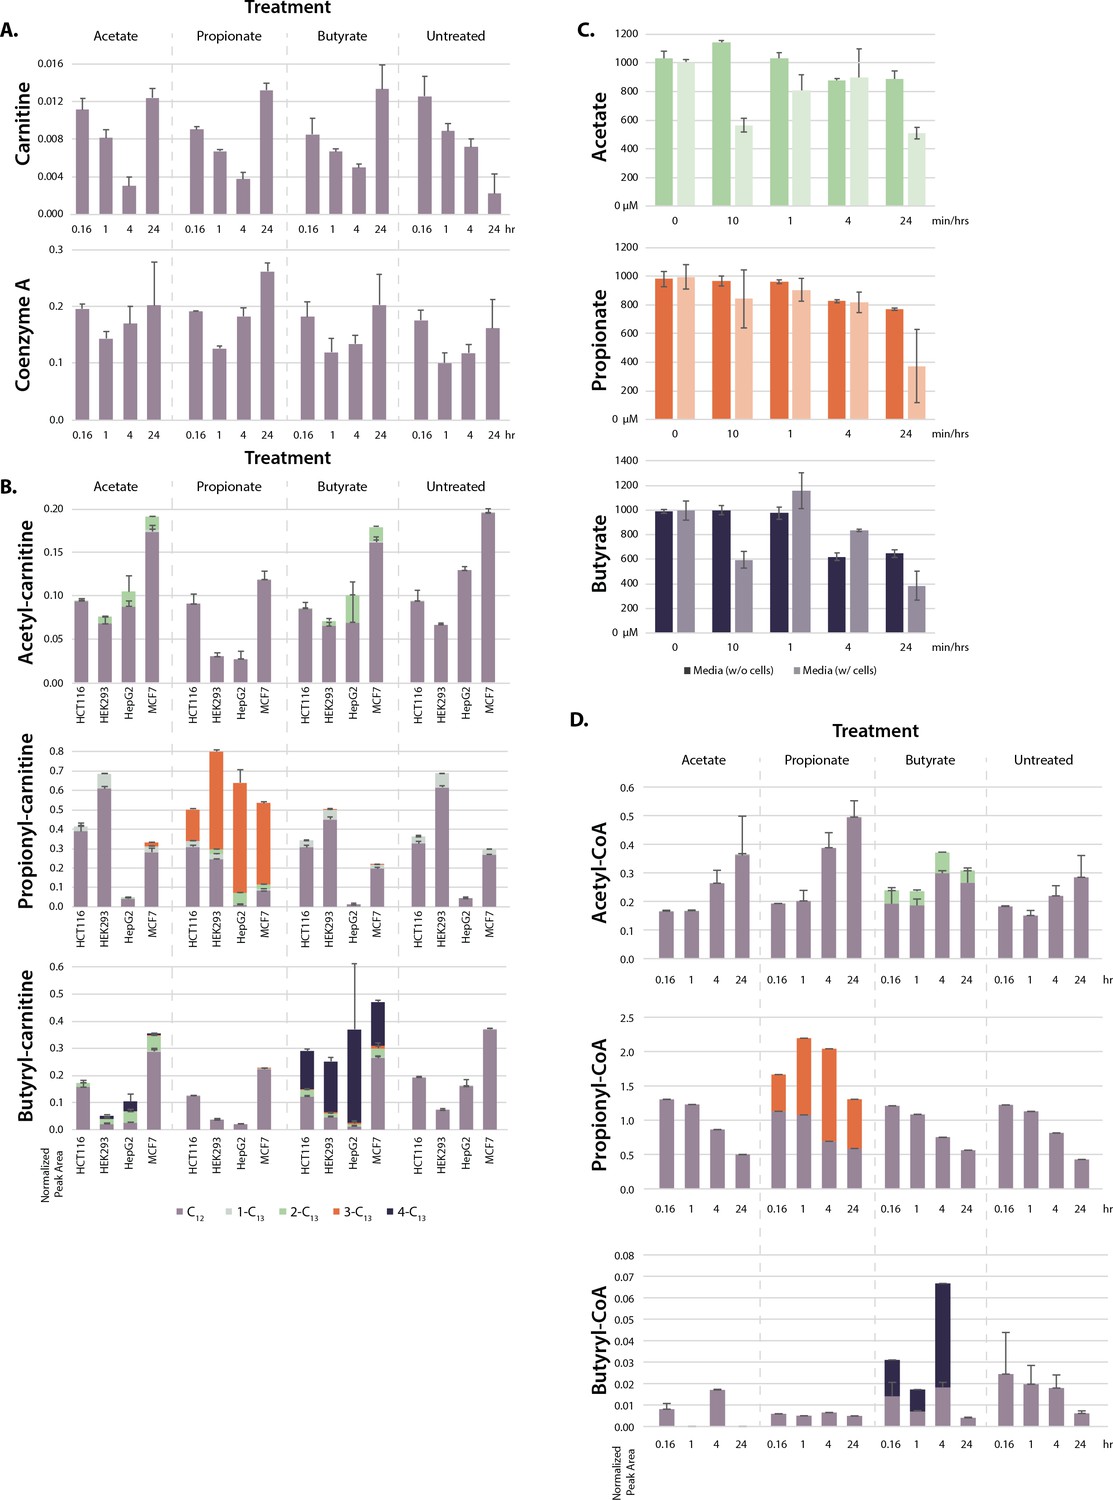
Further SCFA metabolism.
(A) Total carnitine and CoA levels in SCFA-treated cells over 24 hr time course. (B) Acyl-carnitine labeling in HCT116, HEK293, HepG2, and MCF7 cells after 1 hr treatment with 1 mM SCFA. Values are normalized signal intensity. (C) SCFA concentrations in media incubated in dishes with or without cells over a 24-hr time course. (D) Acetyl-CoA, propionyl-CoA, and butyryl-CoA labeling in HCT116 cells treated with 1 mM SCFA over a 24-hr time course. All values are average and standard deviation of ≥3 biological replicates. SCFA, short-chain fatty acid.
Figure 2—figure supplement 2
Metabolism of SCFAs to acetyl-CoA is not necessary to induce hyperacetylation.
(A) Propionate and butyrate increase acetylation in HCT116 cells treated with non-targeting (NT) siRNA and 1 mM SCFA. (B) ACLY, ACSS2, and PCC siRNAs compared to NT siRNA + same SCFA treatment. (C) Knockdown efficiency of ACLY and ACSS2 siRNAs in cells treated with SCFAs. Full blots can be found in Source data 2. (D) Methylmalonyl-CoA production in primary lymphoblasts from patients with propionic acidemia (KO 1/2) and family-matched controls (WT 1/2). Propionic acidemia is a rare genetic disease caused by mutations in PCC. Methylmalonyl-CoA is the product of PCC and was measured via HPLC. (E) Propionate and butyrate induce hyperacetylation in primary lymphoblasts from KO1/2 and WT1/2 cells. (F) Knockout of PCC does not affect histone hyperacetylation. Values are compared to WT cells + same SCFA treatment. For all samples, *=p≤0.05, **=p≤0.01, ***=p≤0.001. n=3 per condition. SCFA, short-chain fatty acid.
Figure 3 with 1 supplement
Acyl-CoAs activate p300.
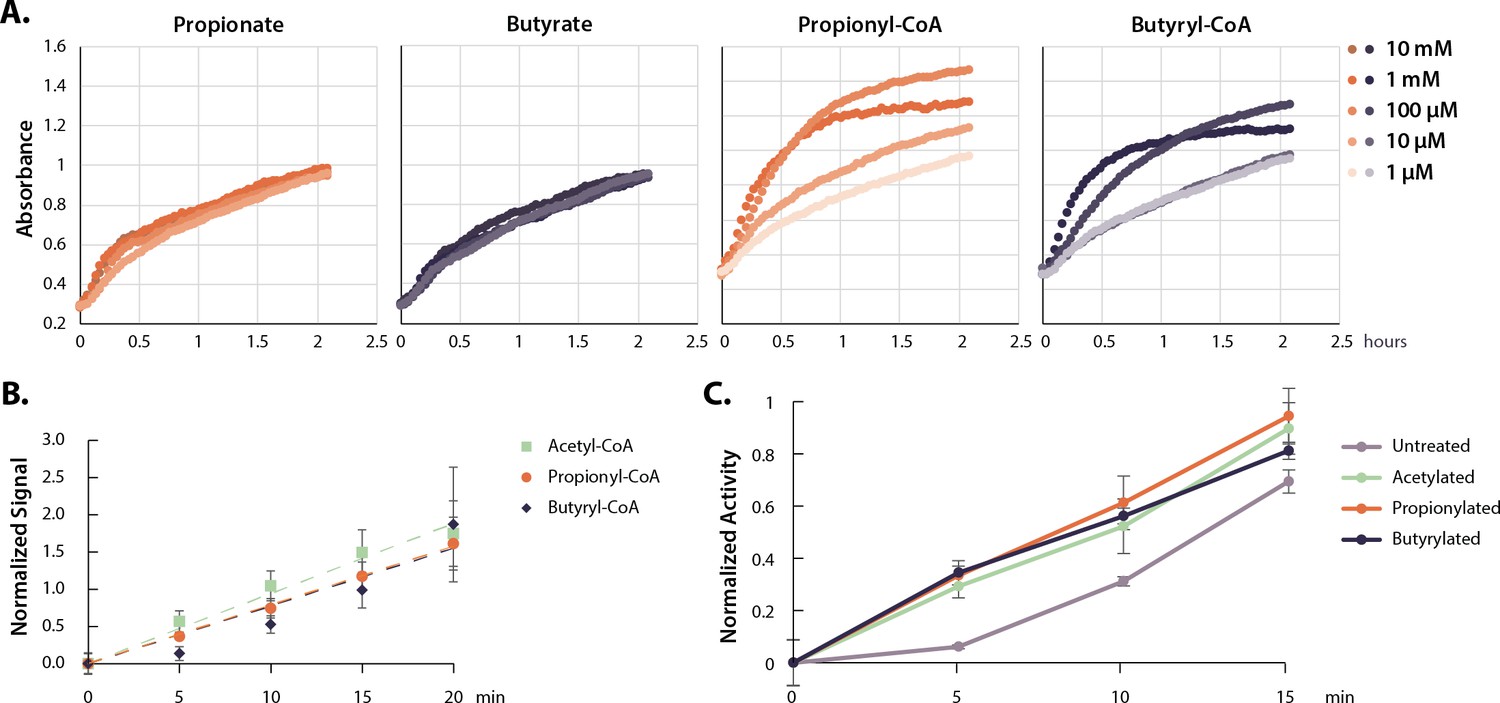
(A) HAT activity of nuclear extract treated with a dose curve of SCFAs and acyl-CoAs. (B) Rate of p300 auto-acylation with acetyl-CoA, propionyl-CoA, and butyryl-CoA. Values are average and standard deviation, n=4 per condition. (C) Rate of histone acetylation by acetylated, propionylated, or butyrylated p300 using radioactive acetyl-CoA. Values are average and standard deviation, n=3 per condition. Replicate results from this assay performed with different enzyme preparations on different days are shown in Figure 3—figure supplement 1. Quantification for all replicates including Western blots and radioactive assays available in Source data 1. HAT, histone acetyltransferase; SCFA, short-chain fatty acid.
Figure 3—figure supplement 1
Recombinant p300 is actively auto-acylated.
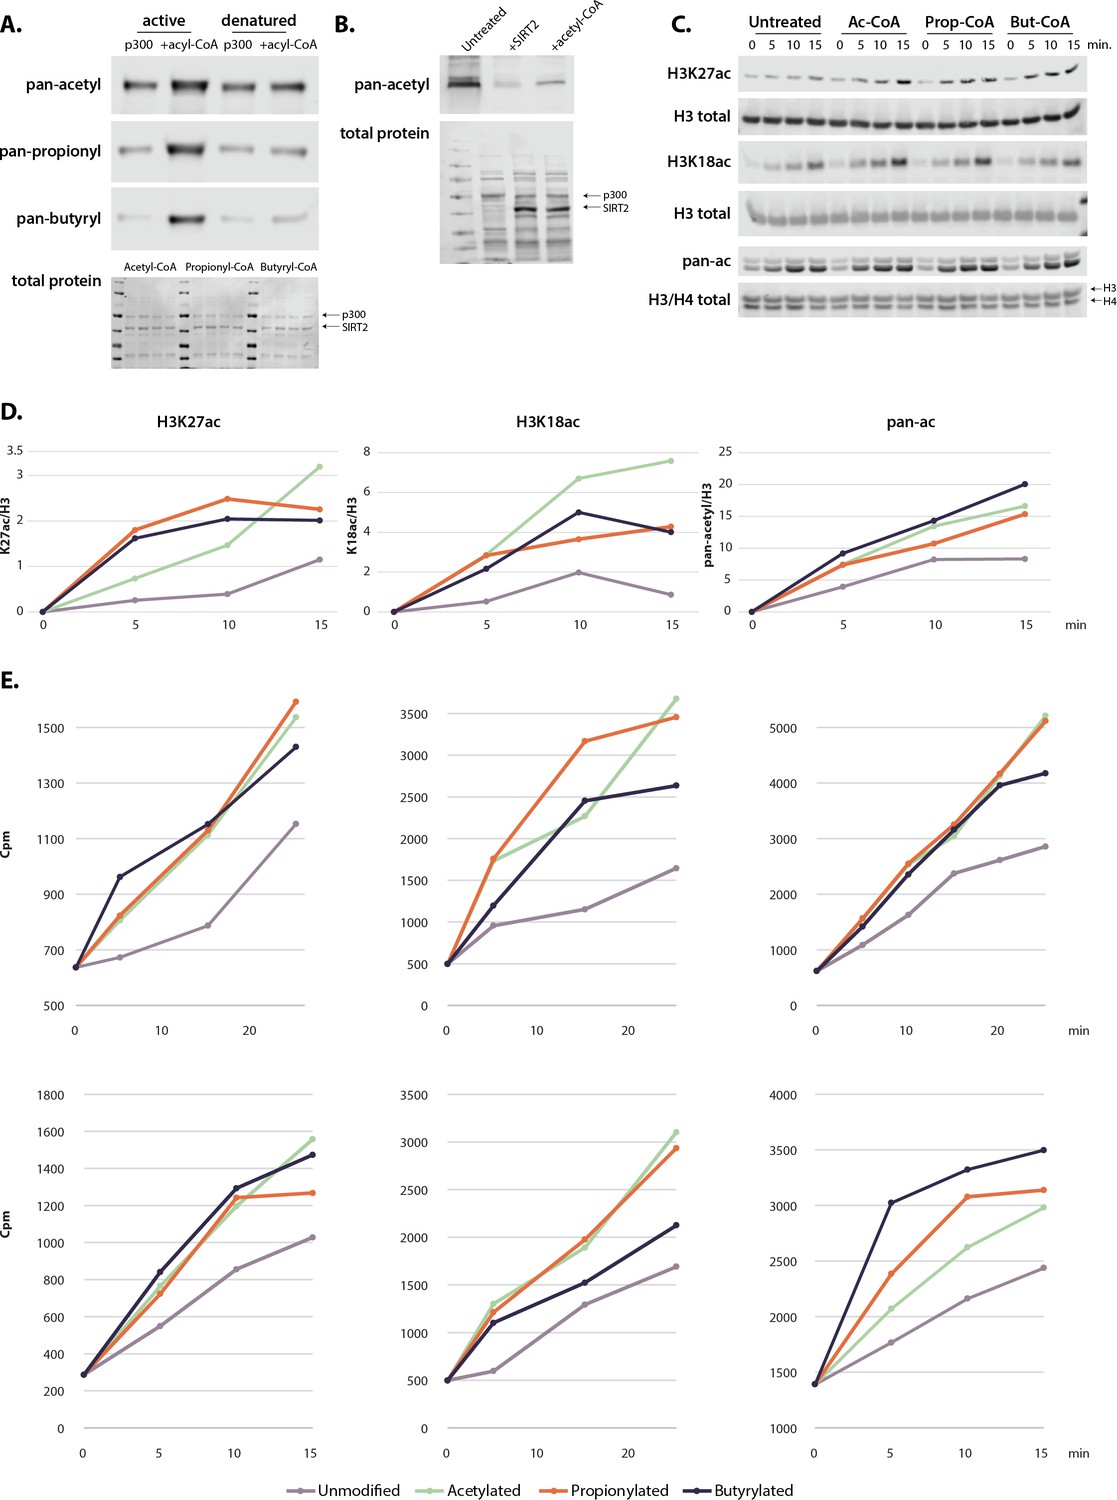
(A) Acylation of active or denatured p300. (B) SIRT2 treatment removes endogenous acetylation on recombinant p300 without inhibiting auto-acetylation after add-back of acetyl-CoA. (C) Rate of histone acetylation after incubation with untreated, acetylated, propionylated, or butyrylated p300 using Westerns blots and H3/H4 dimers. (D) Graphical representation of histone blots. All gels are representative of at least three independent experiments performed on separate days. (E) Radioactivity assays showing the rate of acetylation by acetylated, propionylated, or butyrylated p300. Each replicate was performed with a different acylated enzyme preparation on a different day. Values and image quantification for all replicates available in Source data 1, full blots can be found in Source data 2.
Figure 4 with 1 supplement
p300 inhibition, but not HDAC inhibition, reverses SCFA-induced hyperacetylation.
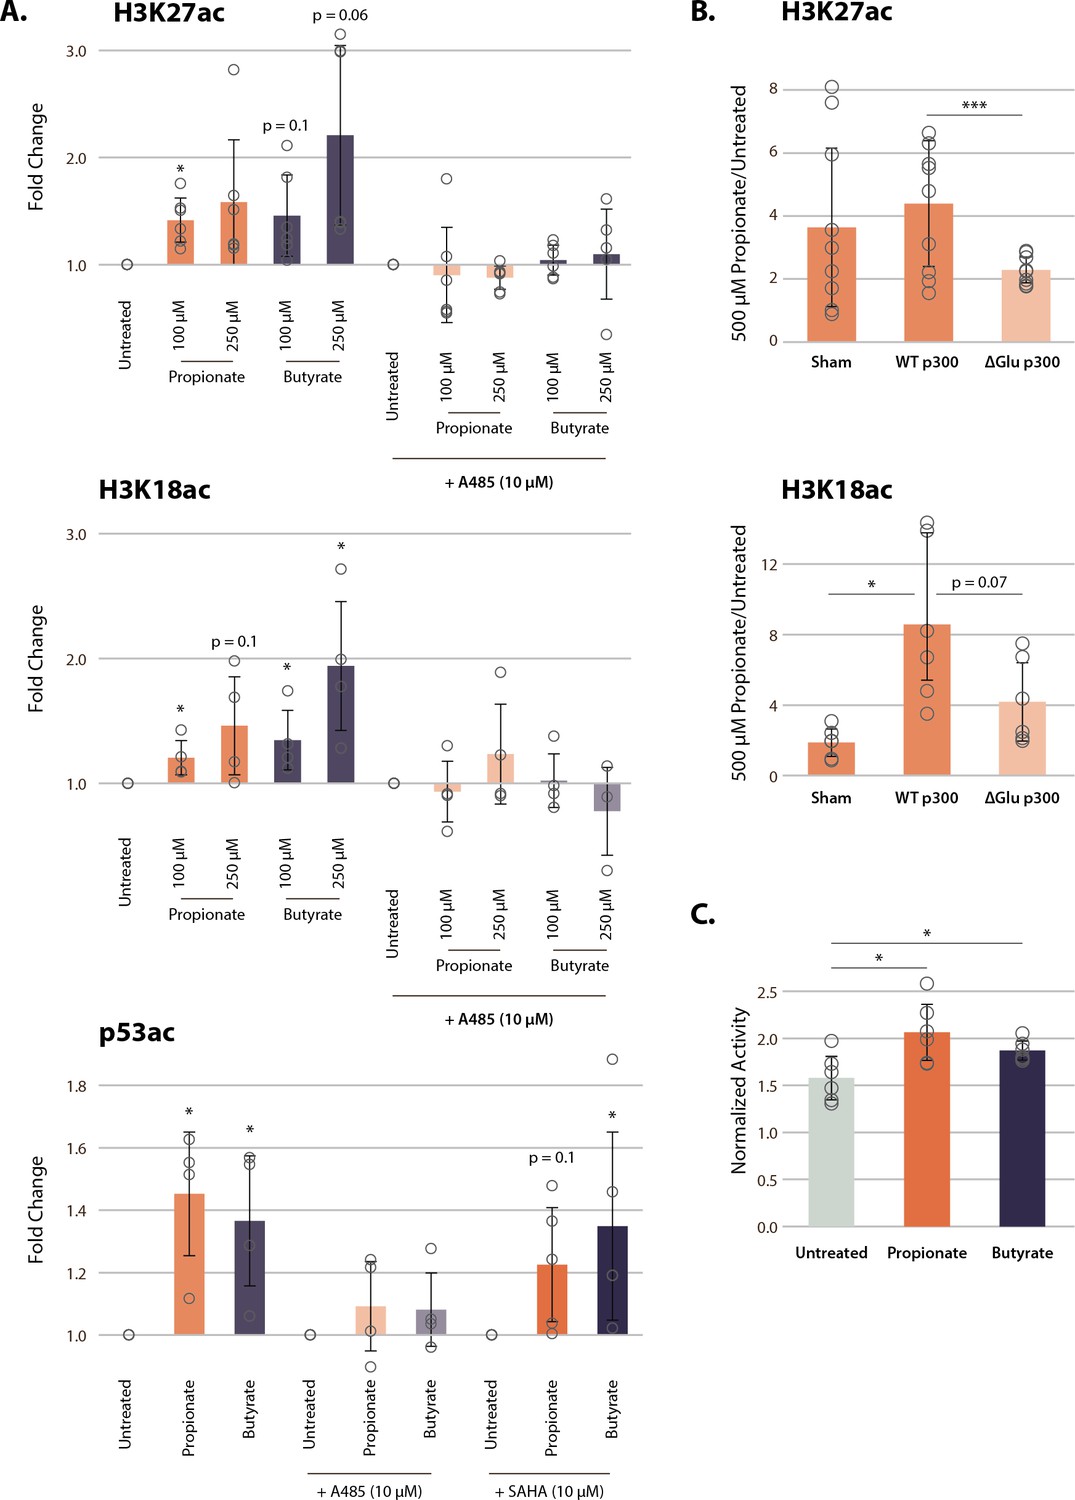
(A) Acetylation of H3K27ac, H3K18ac, and p53K382ac after treatment with A485, SAHA, and 100–250 µM of propionate/butyrate for 24 hr. Values are normalized to total H3 or total p53 before calculating fold changes to the appropriate untreated control. (B) Acetylation of H3K27ac and H3K18ac in cells transfected with sham, WT p300, or ΔGlu p300 plasmids. Values are fold change over untreated cells with the same transfection. (C) Activity of immunoprecipitated p300 after treatment with 500 µM of propionate or butyrate. Activity is measured with a radioactive assay and normalized to concentration of immunoprecipitated p300 in each sample. *=p≤0.05, **=p≤0.01, ***=p≤0.001. n≥3 per condition. HDAC, histone deacetylase; SCFA, short-chain fatty acid.
Figure 4—figure supplement 1
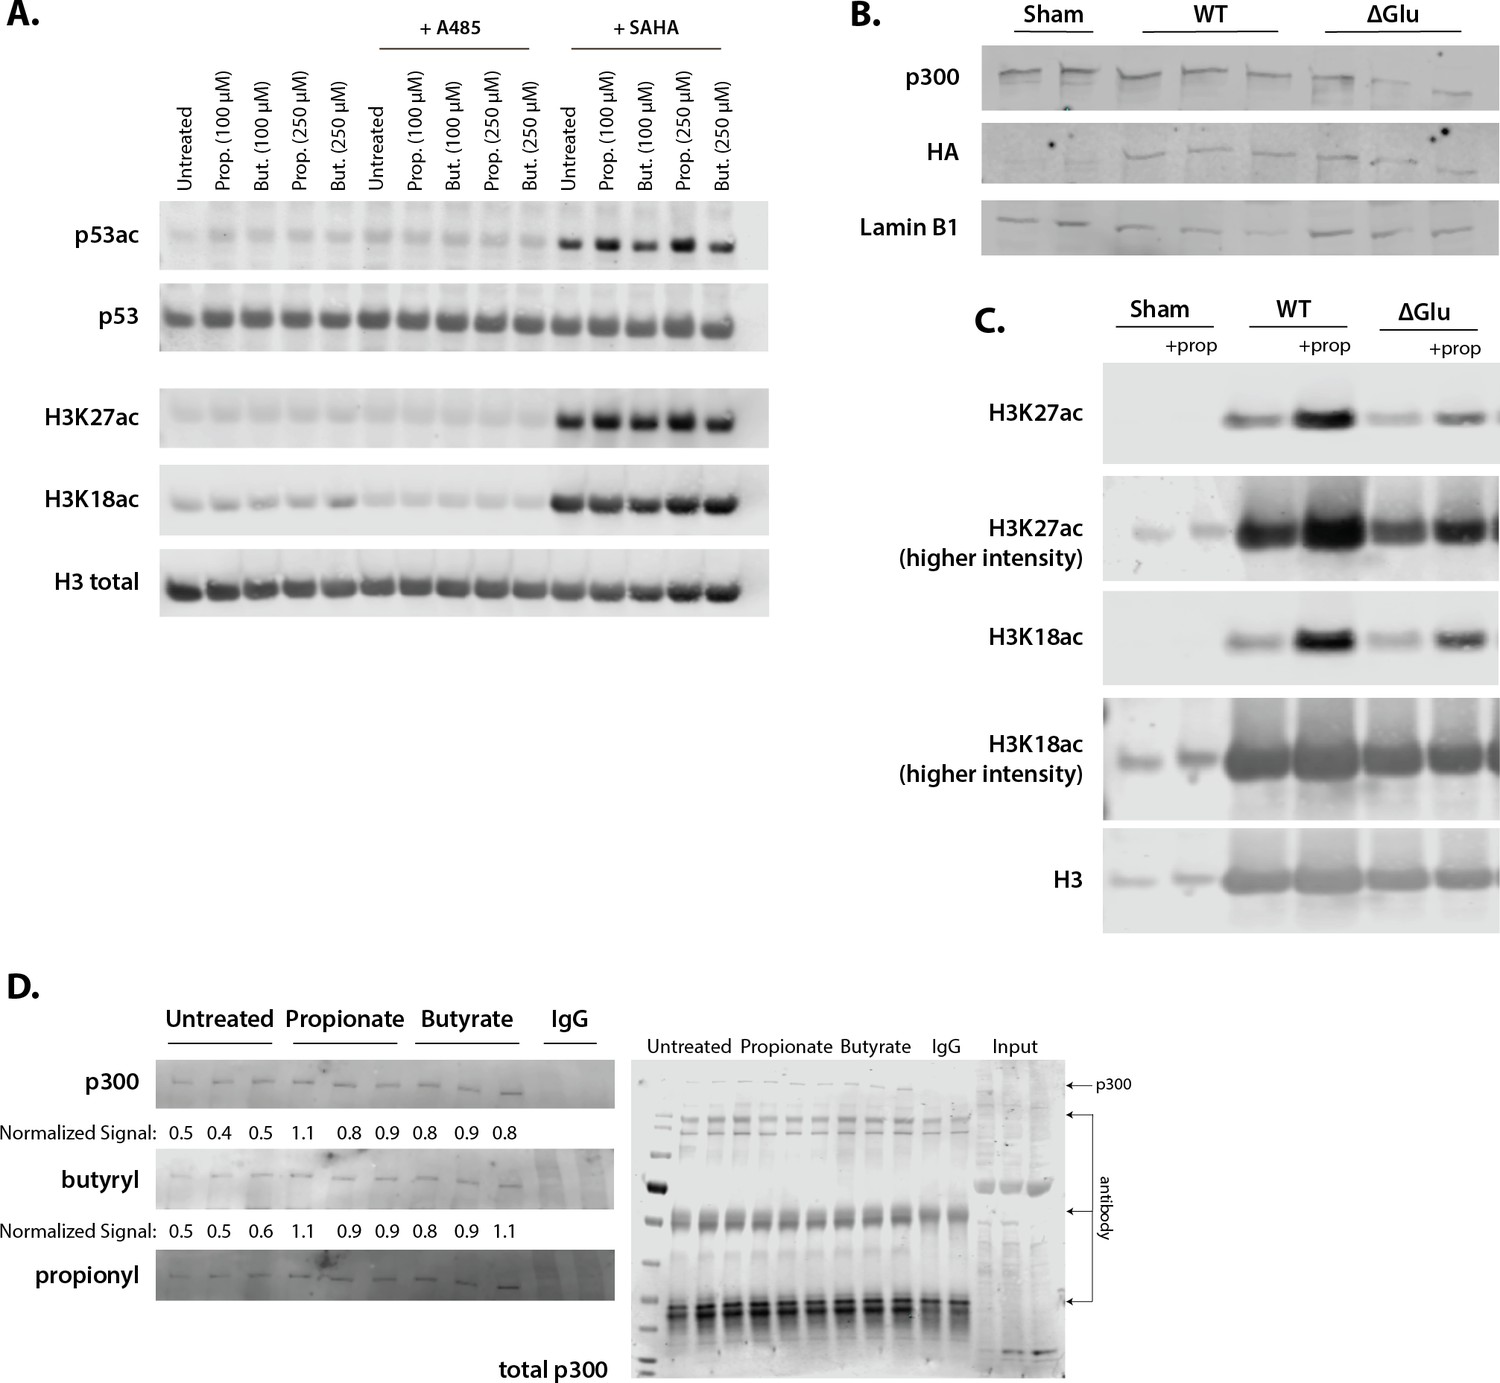
Representative Western blots corresponding to Figure 4.
(A) Acetylation of H3K27ac, H3K18ac, and p53K382ac after treatment with A485, SAHA, and 100–250 µM of propionate/butyrate for 24 hr. (B) Expression of HA-tagged plasmids and p300 levels in cells transfected with sham, WT p300, or ΔGlu p300. (C) Levels of H3K27ac, H3K18ac, and H3 in sham, WT p300, or ΔGlu p300-transfected cells. (D) Levels of p300, butyrylation, and propionylation in p300 immunoprecipitated from HCT116 cells treated with 500 µM propionate or butyrate for 1 hr. All experiments were performed at least two separate times with n=3 biological replicates. Values and image quantification for all replicates available in Source data 1, full blots can be found in Source data 2.
Tables
Table 1
IC50 of HDAC inhibition for SCFAs and acyl-CoAs.
IC50 values of HDAC inhibition for propionate, butyrate, propionyl-CoA, and butyryl-CoA. Values are calculated from dose curves using n=2 technical replicates, raw data can be found in Source data 1.
| Molecule | IC50 |
|---|---|
| Propionate | 223 ± 64 µM |
| Butyrate | 52 ± 11 µM |
| Propionyl-CoA | 18 ± 7 mM |
| Butyryl-CoA | 1.13 ± 0.01 mM |
Table 2
Sites of p300 acylation.
Sites of lysine acetylation, propionylation, and butyrylation on recombinant p300 treated with acyl-CoAs. AIL: autoinhibitory loop, A: acetylation, P: propionylation, B: butyrylation.
| Lysine site(AIL lysines in bold). | Acetylation | Propionylation | Butyrylation |
|---|---|---|---|
| K1542 | A | P | |
| K1546 | A | P | |
| K1549 | A | P | |
| K1550 | A | ||
| K1551 | A | P | |
| K1554 | A | P | B |
| K1555 | A | P | B |
| K1558 | A | P | B |
| K1560 | A | P | B |
| K1568 | A | P | |
| K1569 | A | P | |
| K1570 | A | P | |
| K1583 | A | ||
| K1590 | A | ||
| K1637 | A | P |
Key resources table
| Reagent type (species) or resource | Designation | Source or reference | Identifiers | Additional information |
| HCT116 cell line (Homo-sapiens) | Colorectal carcinoma | ATCC | CCL-247 | RRID:CVCL_0291 |
| HEK-293 cell line (Homo-sapiens) | Kidney epithelial | ATCC | CRL-1573 | RRID:CVCL_0045 |
| HepG2 cell line (Homo-sapiens) | Liver epithelial | ATCC | HB-8065 | RRID:CVCL_0027 |
| MCF7 cell line (Homo-sapiens) | Adenocarcinoma epithelial | ATCC | HTB-22 | RRID:CVCL_0031 |
| PCCA mutant cell lines (Homo-sapiens) | Propionic acidemia cell lines | NIGMS Human Genetic Cell Repository, Coriell Institute | GM00371 GM00405 GM22010 GM22011 GM22123 GM22126 | |
| Transfected construct (human) | siRNA to ACSS2 (SMARTpool) | Dharmacon | L-010396-00-0005 | |
| Transfected construct (human) | siRNA to ACLY (SMARTpool) | Dharmacon | L-004915-00-0005 | |
| Transfected construct (human) | siRNA to PCCA (SMARTpool) | Dharmacon | L-008965-00-0005 | |
| Transfected construct (human) | p300 mutant constructs | Ortega et. al. 2018 | WT p300, ΔGlu p300 | |
| antibody | ACLY, rabbit | CST | 4,332 S | RRID:AB_2223744, 1:1,000 dilution |
| antibody | ACSS2, mouse | Novus Biologicals | NBP2-01269 | 1:1,000 dilution |
| antibody | FFAR2/GPR43, mouse | Novus Biologicals | MAB10082-100 | 1:1,000 dilution |
| antibody | FFAR3/GPR41, rabbit | Novus Biologicals | NBP2-14014 | 1:1,000 dilution |
| antibody | H3, mouse | Abcam | ab24834 | RRID:AB_470335, 1:5,000 dilution |
| antibody | H3 K18ac, rabbit | Abcam | ab1191 | RRID:AB_298692, 1:1,000 dilution |
| antibody | H3 K27ac, mouse | Active Motif | 39,685 | RRID:AB_2793305, 1:1,000 dilution |
| antibody | HA-Tag, rabbit | CST | 3,724 | RRID:AB_1549585, 1:1,000 dilution |
| antibody | p300 (NM11), mouse | SCBT | sc-32244 | RRID:AB_628076, 1:1,000 dilution |
| antibody | p53, mouse | CST | 2,524 | RRID:AB_331743, 1:1,000 dilution |
| antibody | p53 K382ac, rabbit | CST | 2,525 | RRID:AB_330083, 1:1,000 dilution |
| antibody | Pan anti-acetyllysine, rabbit | CST | 9,814 | 1:1,000 dilution |
| antibody | Pan anti-butyryllysine, mouse | PTM Biolabs | PTM-329 | 1:500 dilution |
| antibody | Pan anti-propionyllysine, rabbit | PTM Biolabs | PTM-201 | 1:500 dilution |
Additional files
-
Transparent reporting form
- https://cdn.elifesciences.org/articles/72171/elife-72171-transrepform1-v2.pdf
-
Source data 1
Raw Data and Replicates for Enzyme Assays.
- https://cdn.elifesciences.org/articles/72171/elife-72171-supp1-v2.xlsx
-
Source data 2
Full Western Blots and Replicate Blots.
- https://cdn.elifesciences.org/articles/72171/elife-72171-supp2-v2.zip
Download links
A two-part list of links to download the article, or parts of the article, in various formats.
Downloads (link to download the article as PDF)
Open citations (links to open the citations from this article in various online reference manager services)
Cite this article (links to download the citations from this article in formats compatible with various reference manager tools)
Short-chain fatty acids activate acetyltransferase p300
eLife 10:e72171.
https://doi.org/10.7554/eLife.72171


