Large-scale orientational order in bacterial colonies during inward growth
- Department of Physics, Koç University, Turkey
- Bio-Medical Sciences and Engineering Program, Koç University, Turkey
- Computational Physics for Engineering Materials, ETH Zurich, Switzerland
- Koç University Surface Science and Technology Center, Koç University, Turkey
- Koç University Research Center for Translational Medicine, Koç University, Turkey
Figures
Figure 1 with 2 supplements

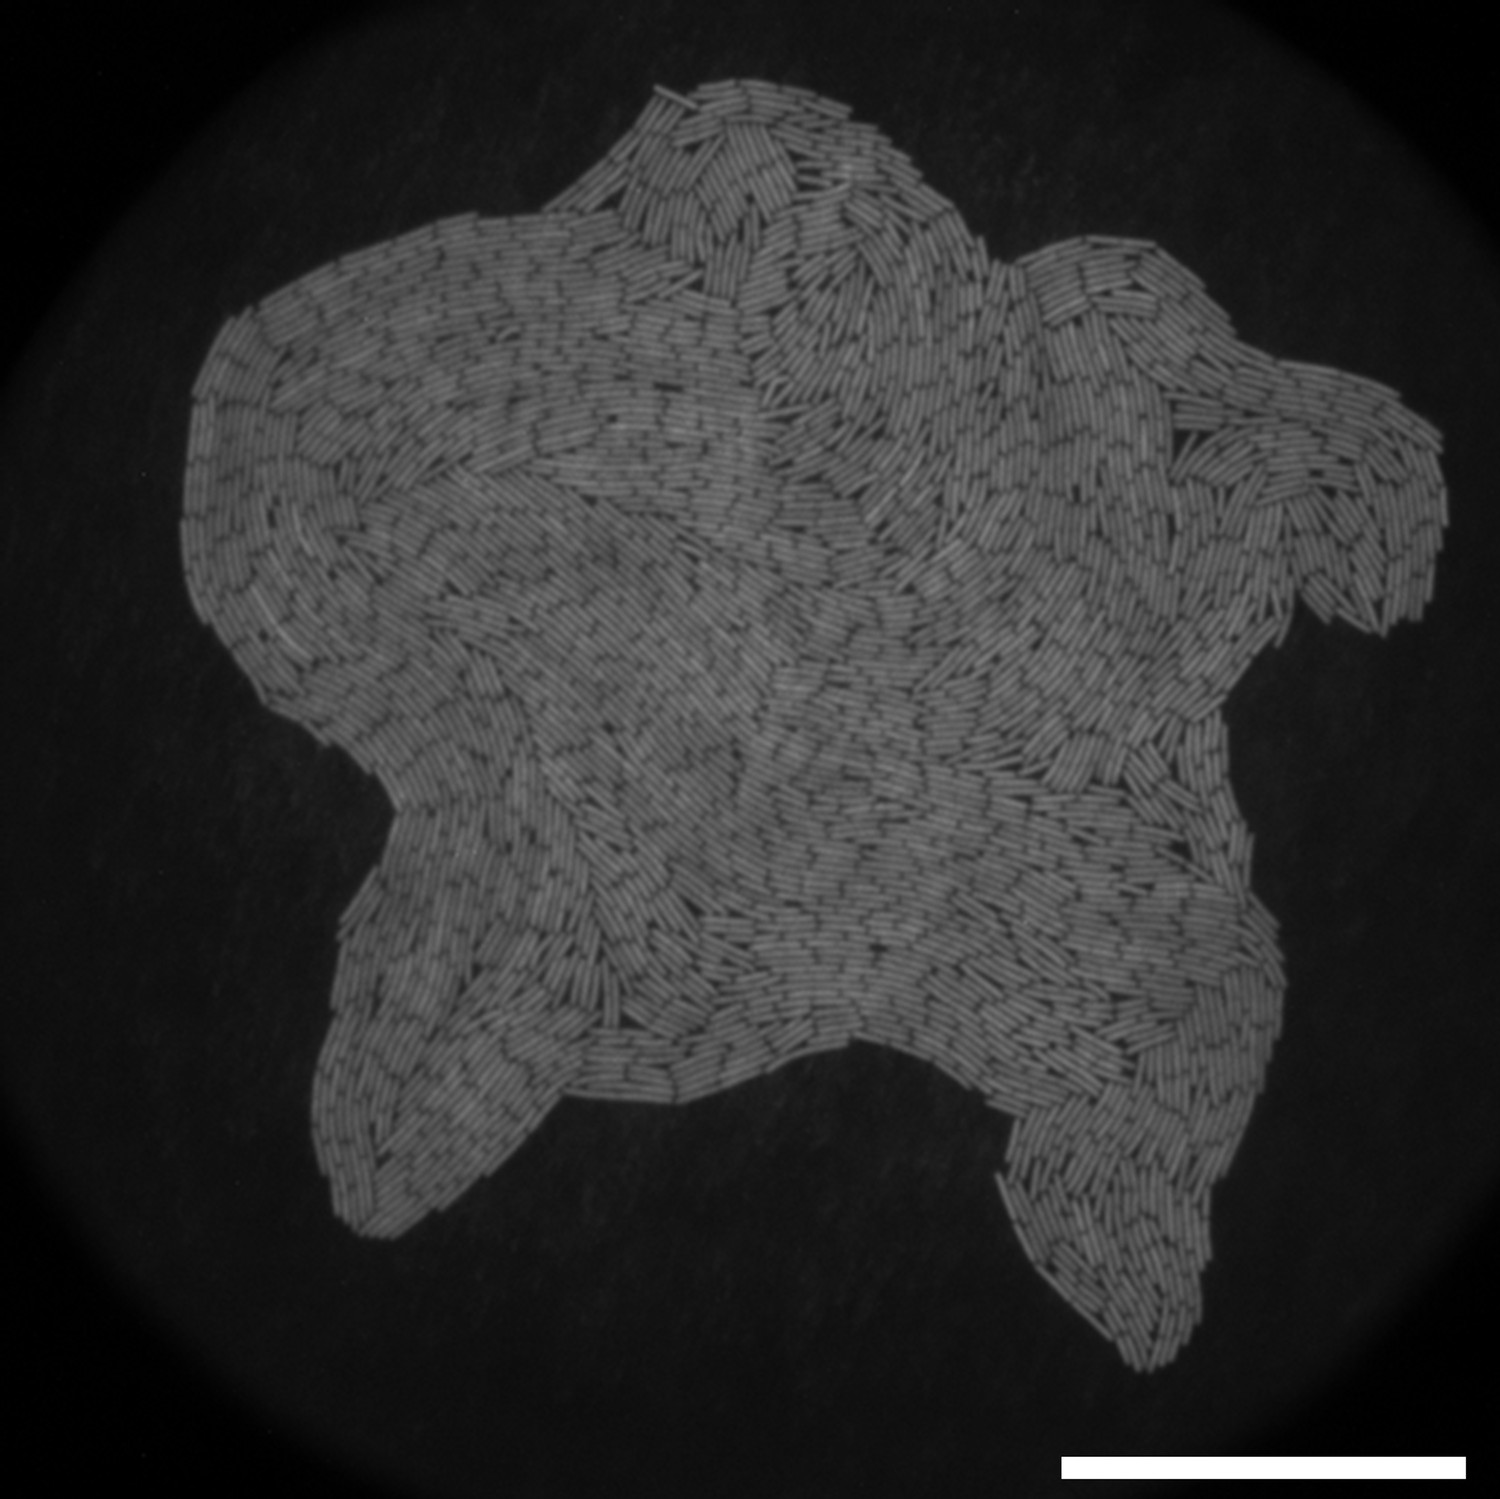
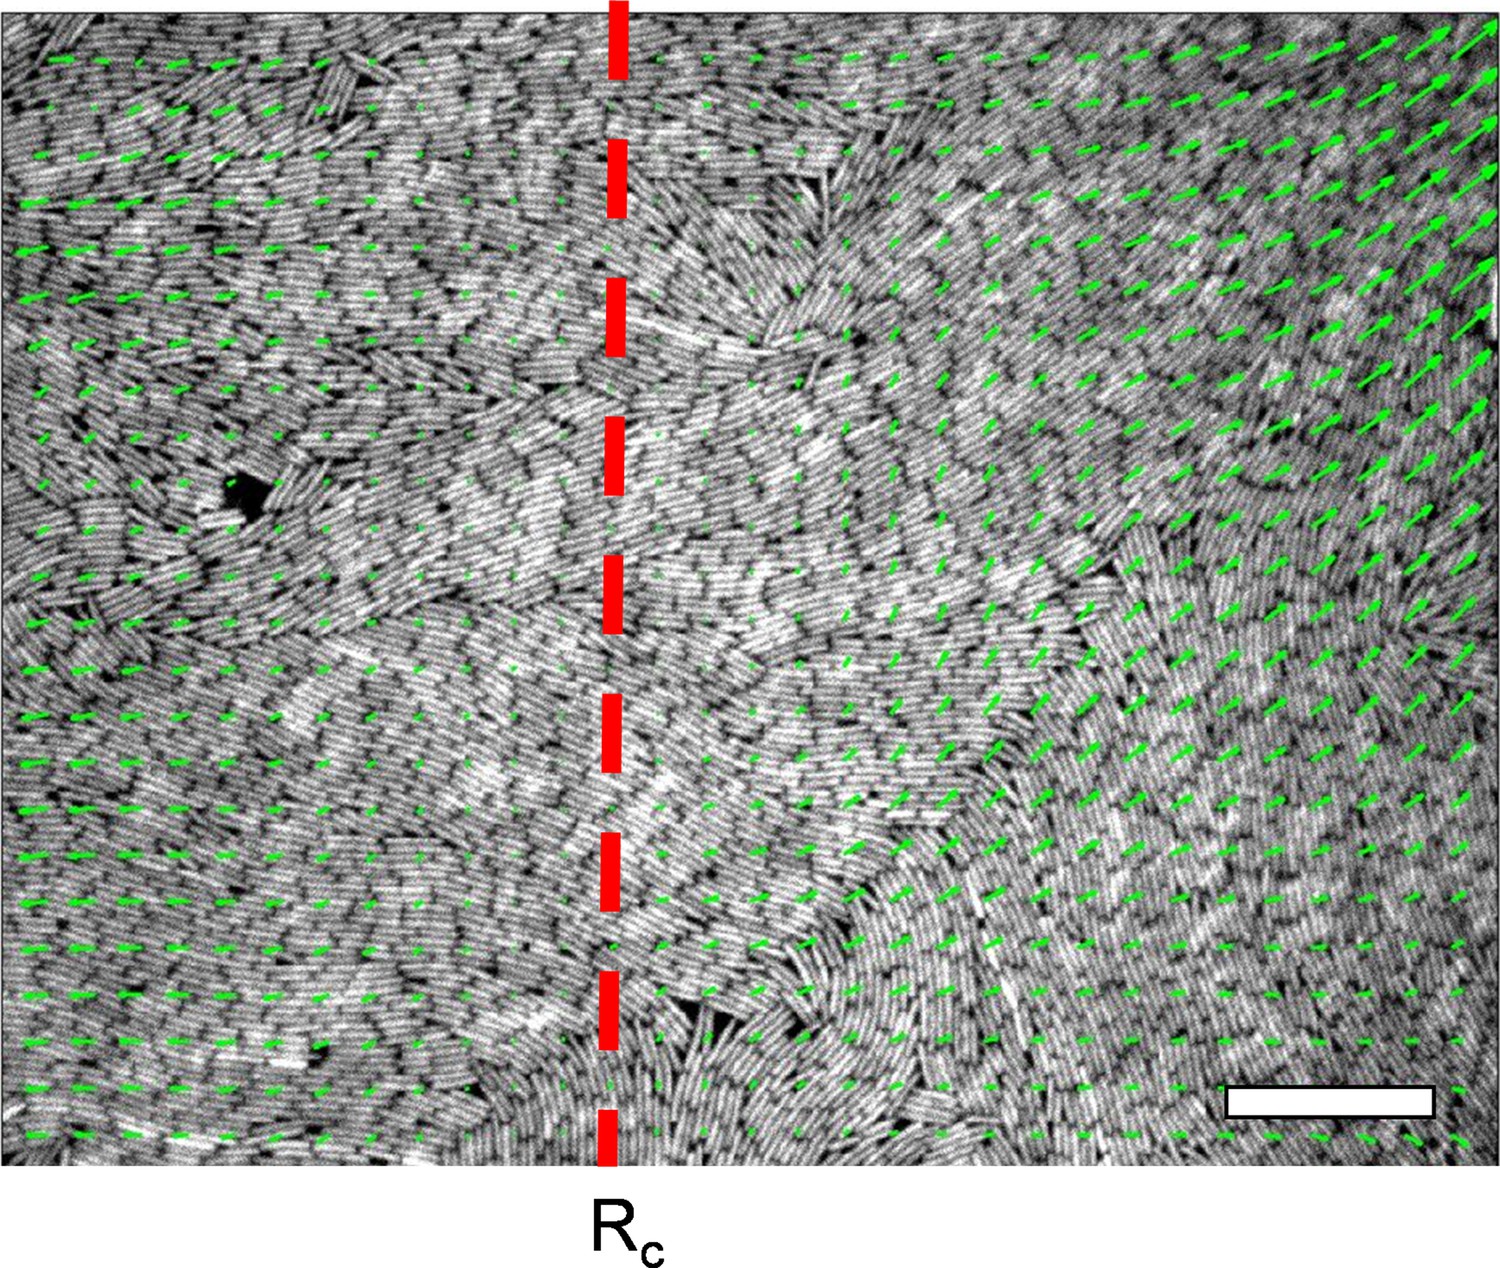
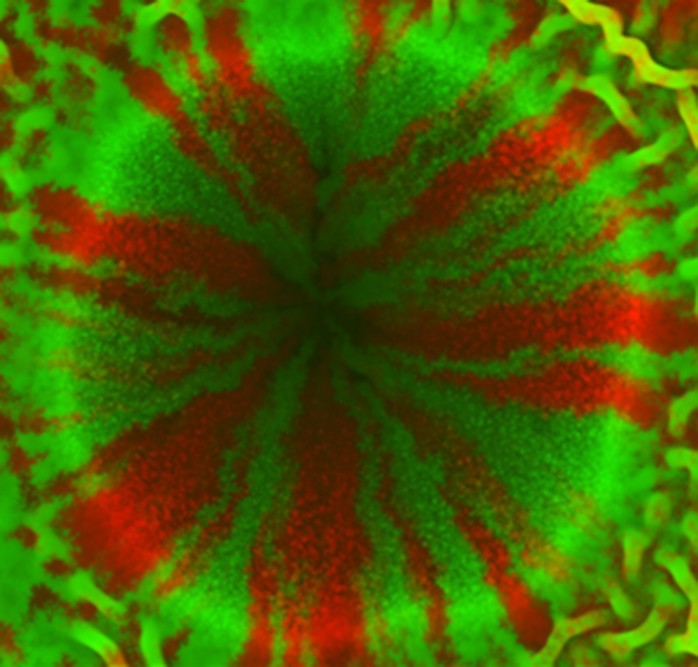
Experimental observation of inward growth of bacterial colonies and emergence of radial alignment.
(a) Early stage of a closed area surrounded by growing bacterial colonies (Bacillus subtilis). (b) Snapshot of the radially aligned bacterial profile immediately before hole closure. (c) A director field superimposed on an inward-growing domain displaying radial alignment. Scale bar 25 μm. (d) The azimuthally averaged radial order parameter (SR) and velocity against the distance from the colony center for the colony snapshot given in (c). Error bars are defined as s.d. (e,g) Simulation of 2D inward colony growth and regular expansion of bacterial colonies. (f,h) Schematic illustration of the velocity field (black arrow) and frictional force (red arrow) on bacteria in the inward and outward growing domain. Cell colors represent the radial order parameter (SR). Red represents radial alignment; blue, tangential alignment.
Figure 1—video 1
Radial alignment during inward growth and emergence of asters.
The video shows the second example of a fluorescence image of GFP labeled Bacillus subtilis strain (BAK 51) during inward growth. The video is associated with Figure 1a–d. The duration of the experiment is 100 min, and the scale bar is given in Figure 1a.
Figure 1—video 2
Two-dimensional (2D) simulation of the bacterial colony during regular expansion.
The video is associated with Figure 1g.
Figure 2 with 6 supplements
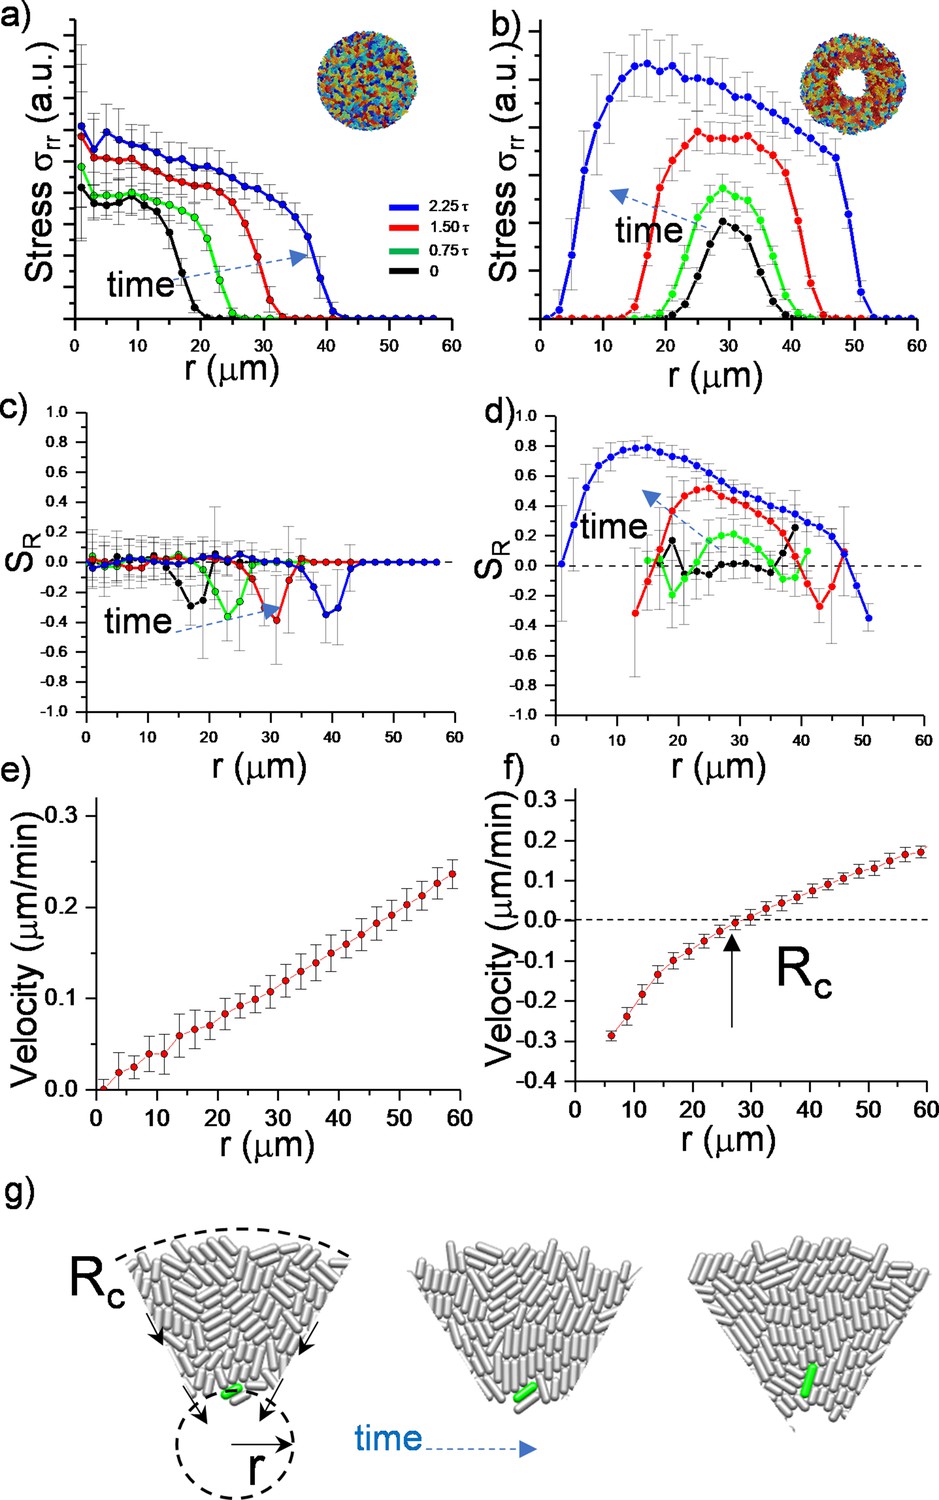
Numerical analysis of critical physical parameters during inward growth.
(a, b) Plot of azimuthally averaged radial stress distribution () at different time points of regular expanding and inward-growing colonies against the distances from the center of the colony. Time points are given in cell division time (t). (c,d) Plot of the azimuthally averaged radial order parameter (SR) across the colonies. Radial order emerges not only below the critical radius but also beyond this level. Negative radial order corresponds to a tangential orientation or active anchoring. (e,f) Comparison of azimuthally averaged radial velocity (vr) profiles of regular expanding and inward-growing colonies. Regular expanding colonies display a linear profile; however, inward-growing colonies form a nonlinear velocity profile. Error bars are defined as s.d. and averaged over 25 simulations. (g) Snapshots of gradual rotation of a single bacterium (green) into a radial orientation during inward growth. Similar bacterial rotation can be seen in experimental results (Figure 2—figure supplement 5).
Figure 2—figure supplement 1
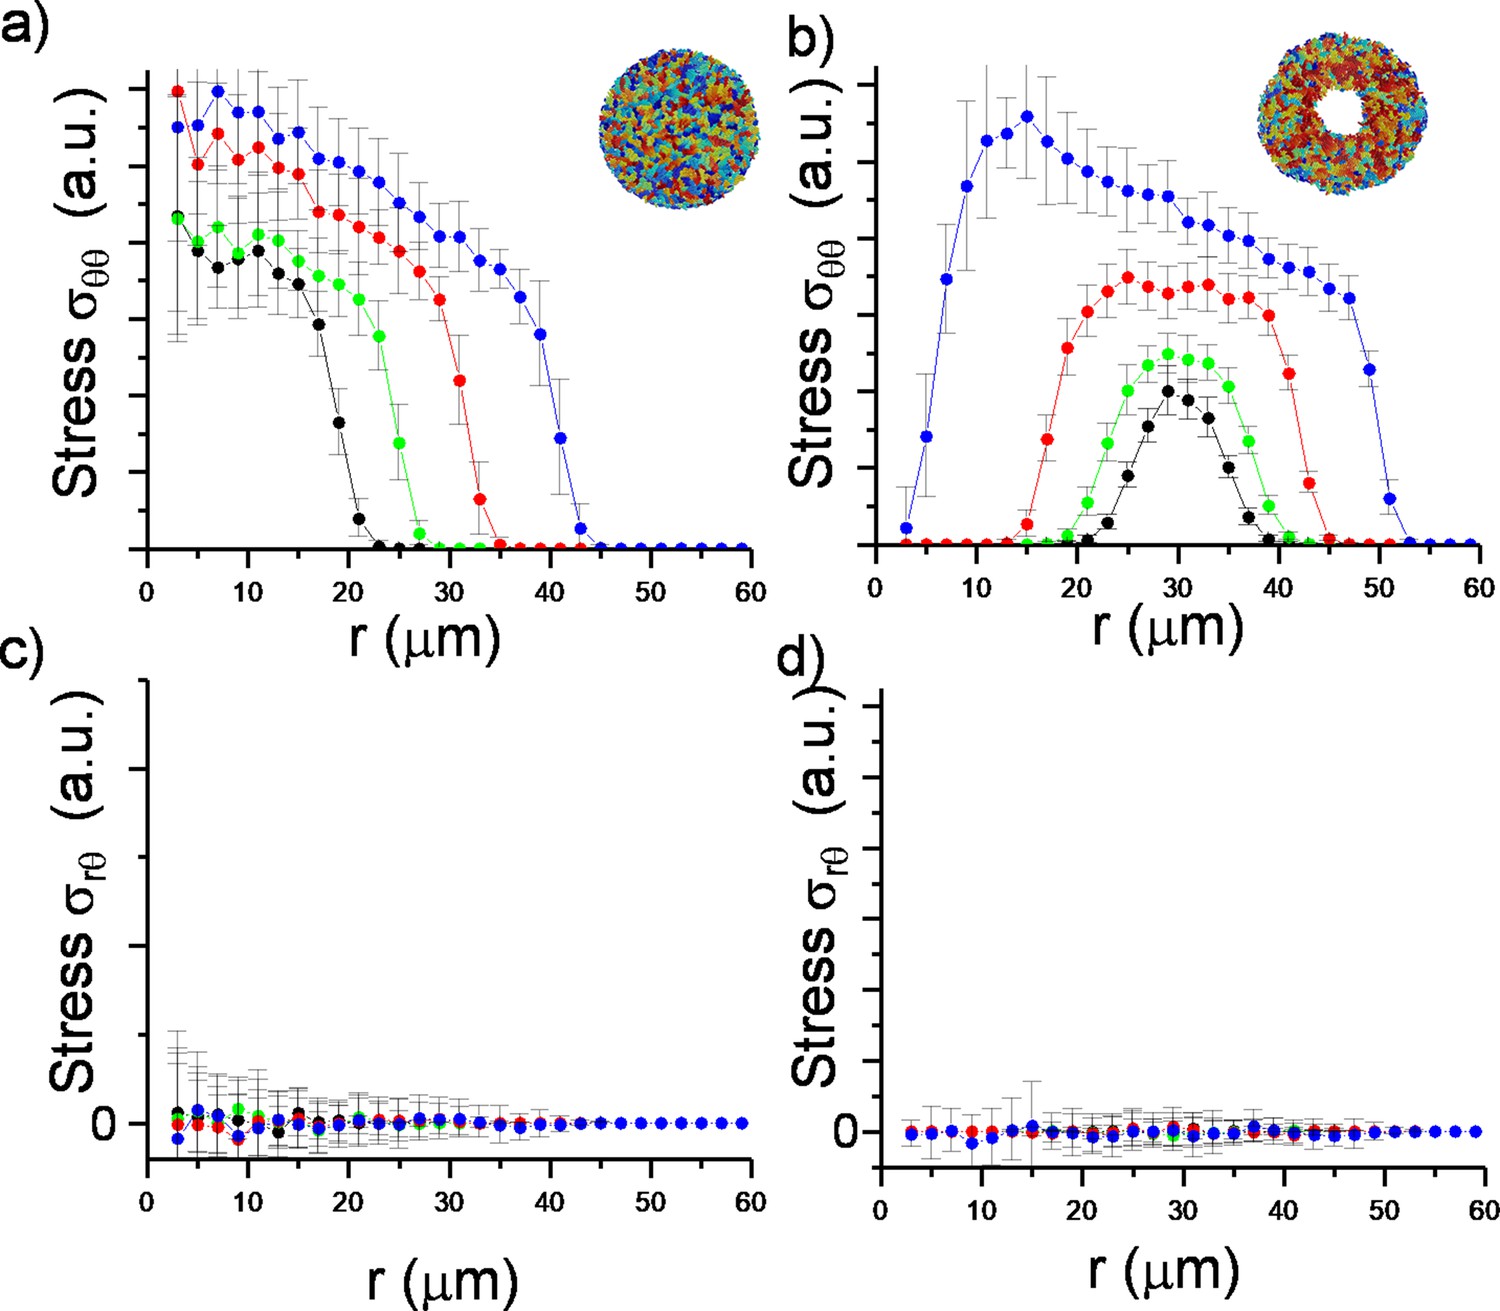
Plot of azimuthally averaged stress distribution ( and ) at different time points of regular expanding and inward-growing colonies against the distances from the center of the colony.
Figure 2—figure supplement 2
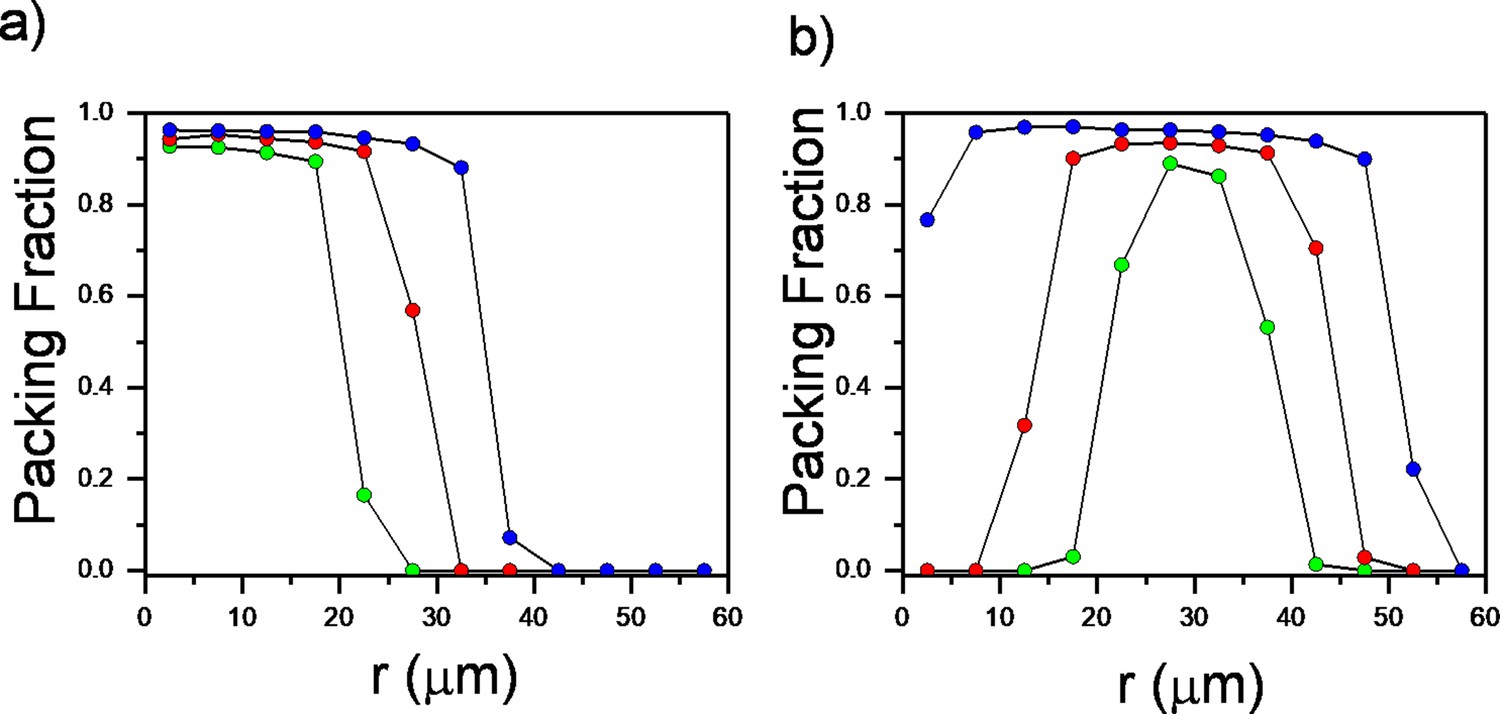
Plot of azimuthally averaged packing fraction of bacteria at different time points of regular expanding and inward-growing colonies against the distances from the center of the colony.
Figure 2—figure supplement 3
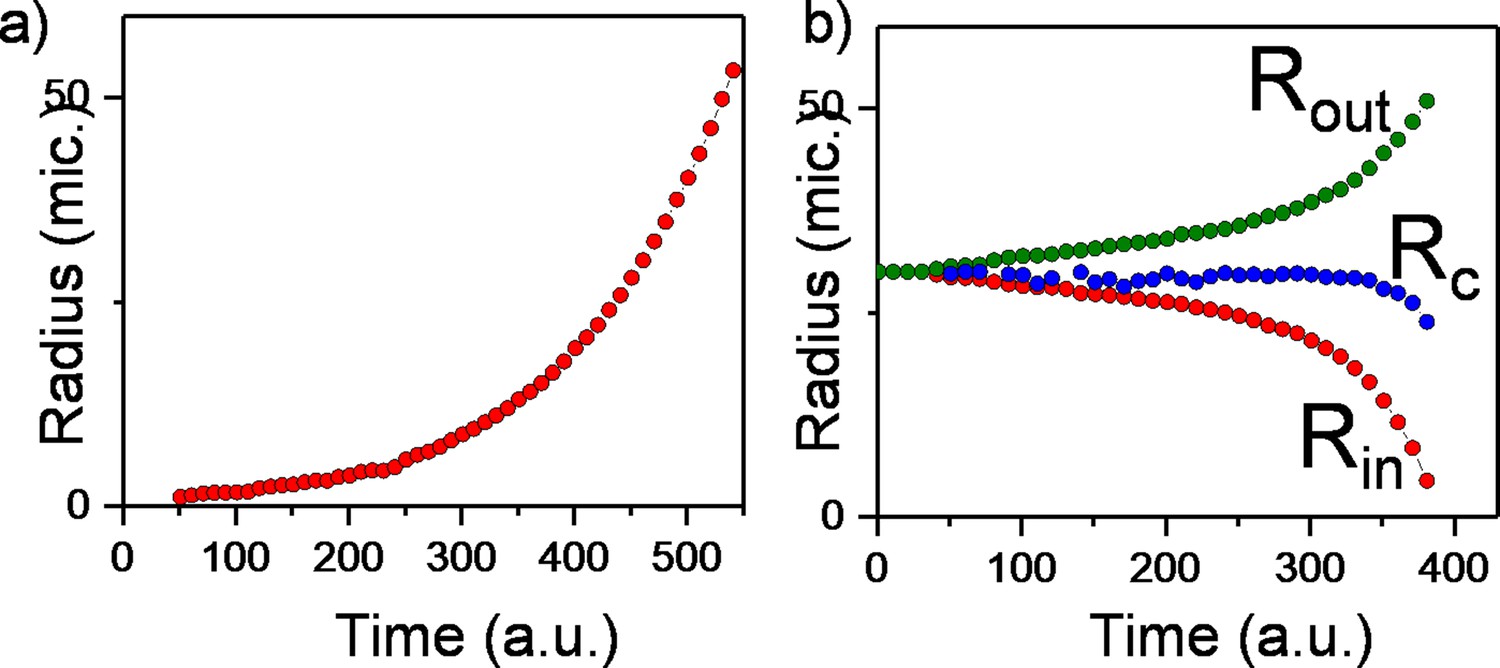
Molecular dynamics simulations of colony radius.
(a) Plot of the radius of the regular expanding colony against time. (b) Plot of the inner and outer radius of the bacterial colony of the inward-growing colony against time. Critical radius is determined by where vr equals to zero. Critical radius shows constant profile immediately before hole closure.
Figure 2—figure supplement 4
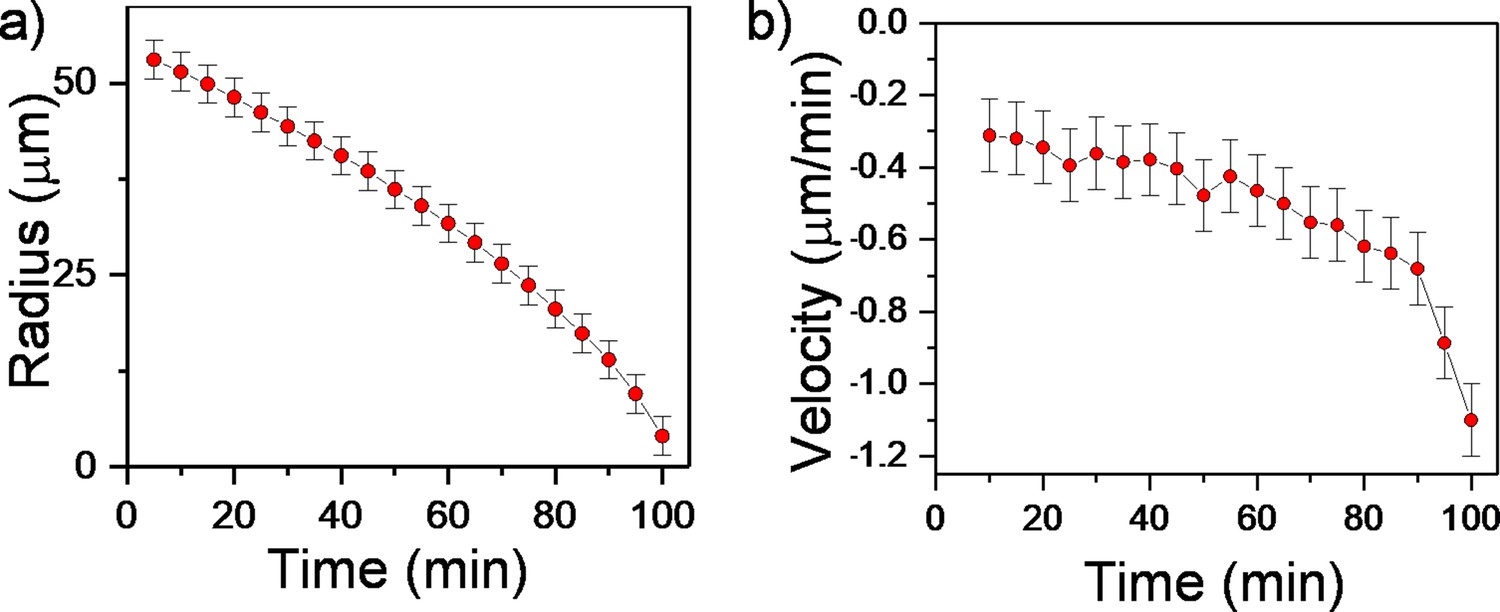
Experimental measurements of the velocity profile.
(a) Plot of the inner radius of inward-growing bacterial domain against time. (b) Plot of radial velocity (vr) of the inner edge of the inward-growing bacterial domain in the experiment against time.
Figure 2—figure supplement 5
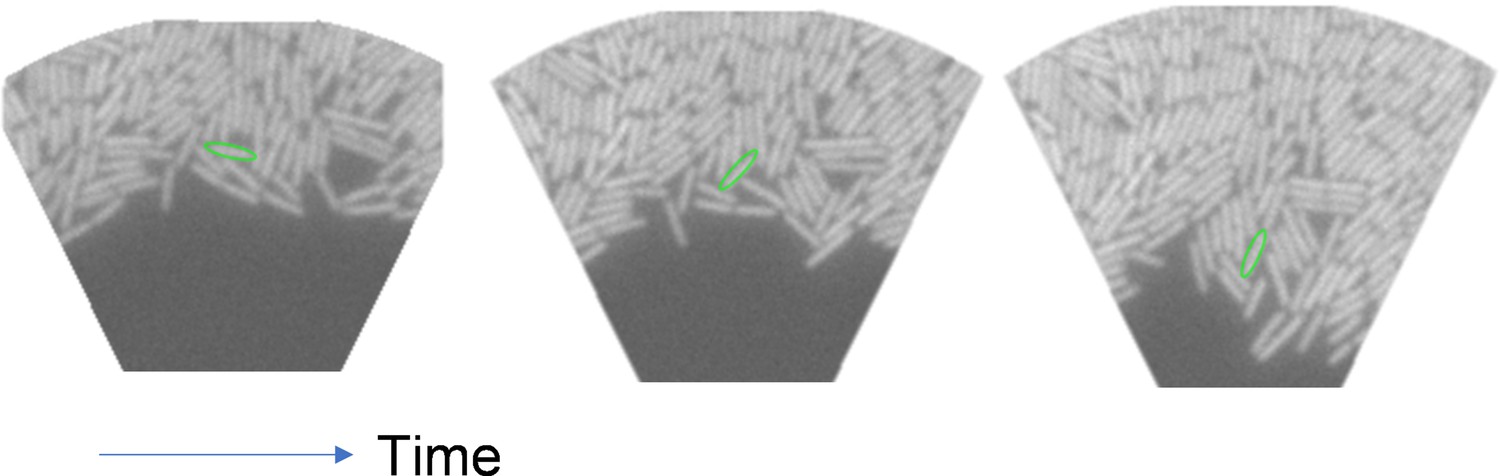
Experimental images of gradual rotation of a single bacterium (labeled green) into a radial orientation during inward growth.
Figure 2—figure supplement 6

Simulation results of growing bacterial colony and scalar order parameters (S) under circular confinement defined by a fixed wall.
Under both conditions, colonies can develop radial alignment.
Figure 3 with 4 supplements
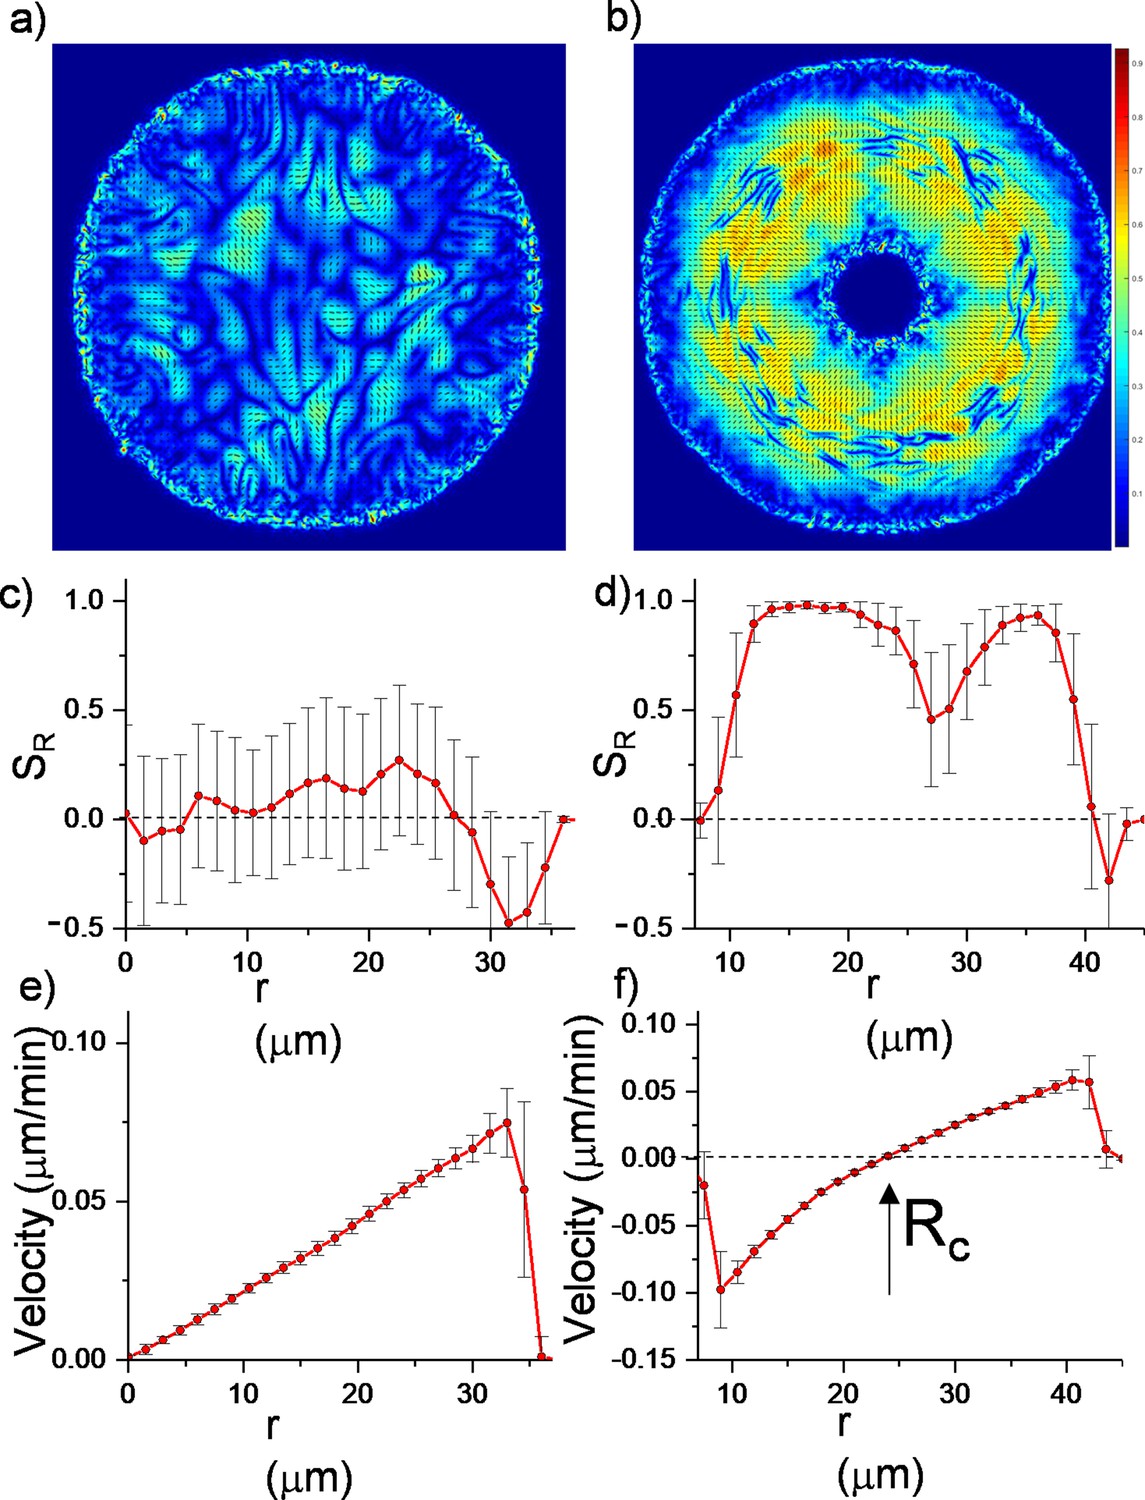
Continuum simulations of two-dimensional (2D) colony growth.
(a,b) Scalar order parameter (S) overlapped with the director field pattern of both regular expanding and inward-growing bacterial colonies. Comparison of azimuthally averaged (c,d) radial order parameter (SR) and (e,f) radial velocity (vr) profiles of the colonies against the distance from the center of the colony. In contrast with regular expanding colonies, inward-growing domains developed radial order throughout the colony. A sudden velocity drop near the edge of the colonies resulted in tangential orientation. Error bars are defined as s.d.
Figure 3—figure supplement 1
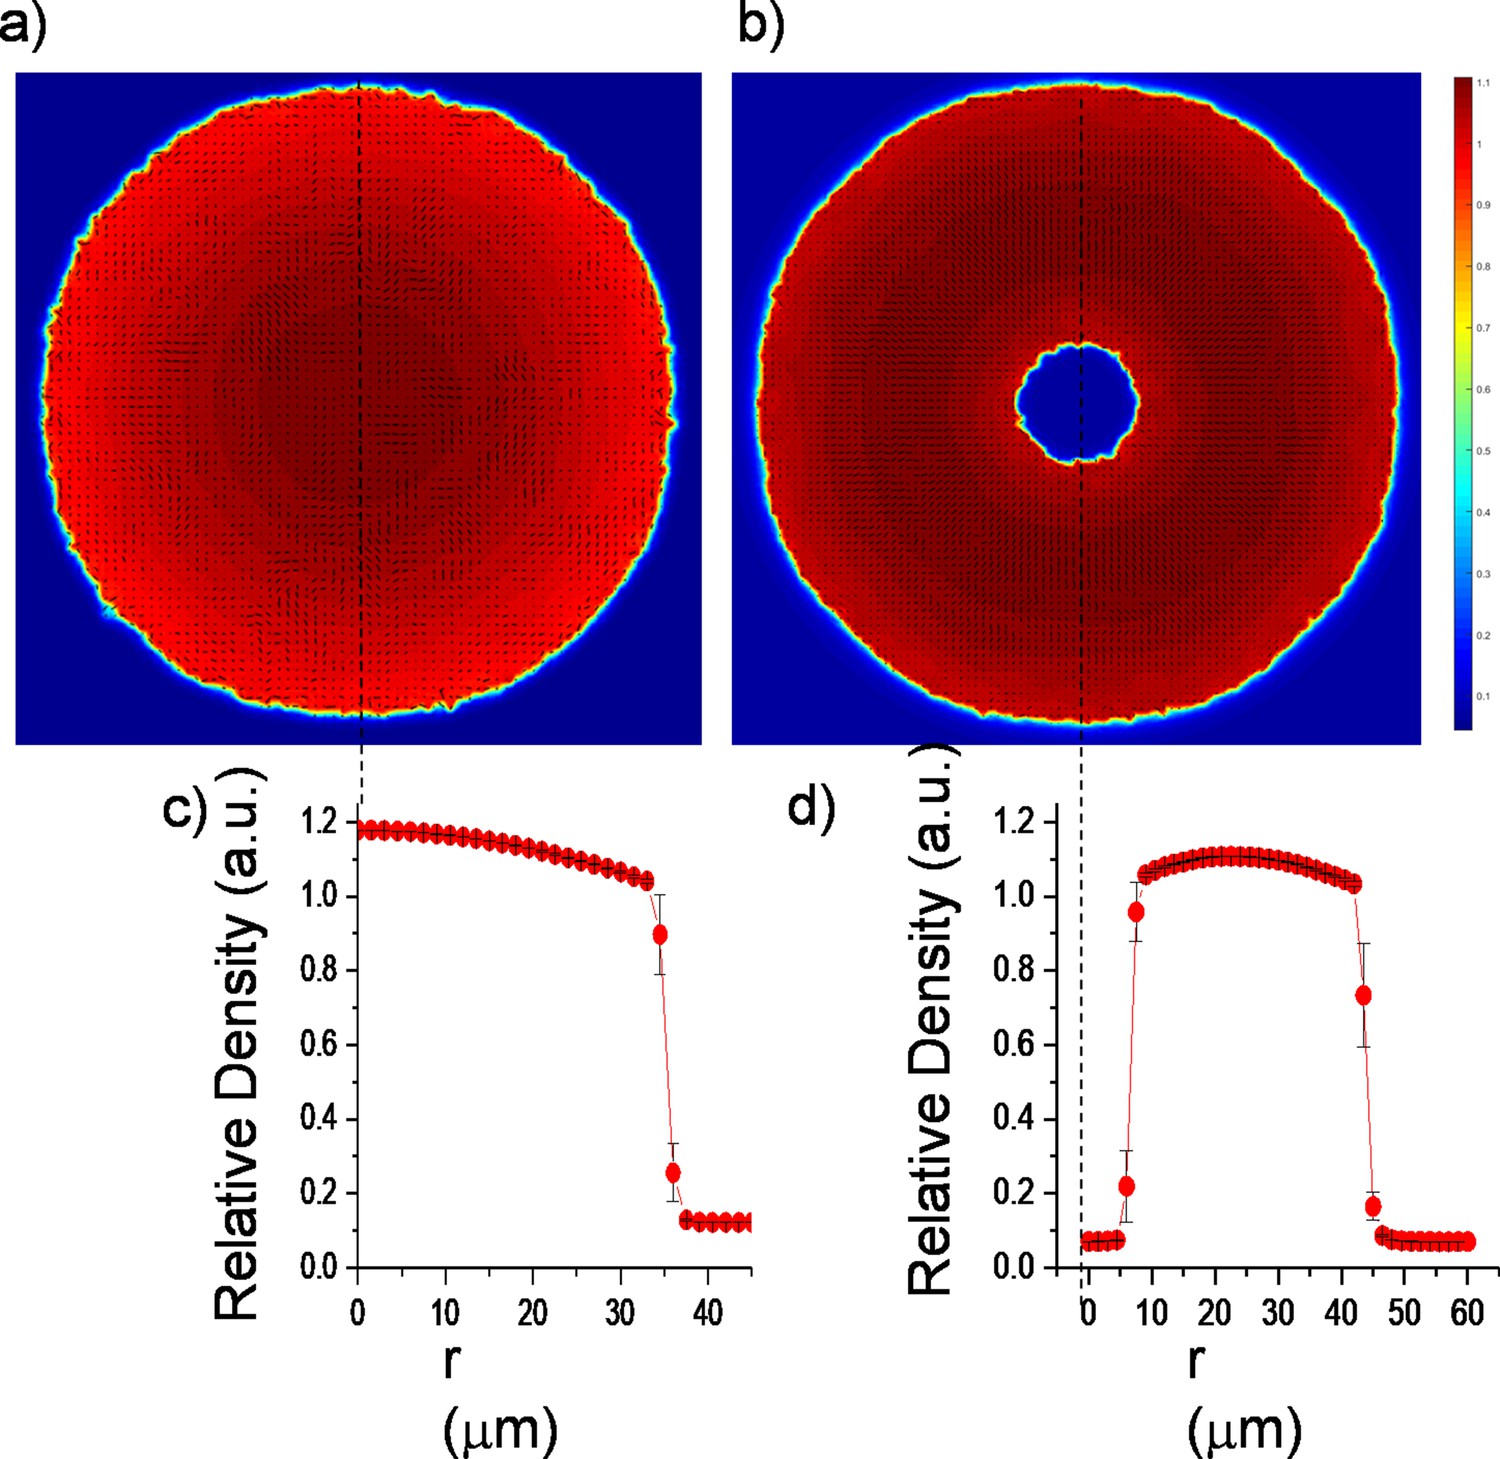
Continuum simulation results of colony density and velocity profiles.
(a,b) Velocity field superimposed on a density profile of regular expanding and inward-growing colony. (c,d) Plot of azimuthally averaged density against the distance from the colony center for regular expanding and inward-growing colony.
Figure 3—video 1
Continuum simulation of two-dimensional (2D) colony growth during regular expansion.
The scalar order parameter is overlapped with the director field pattern. This video is associated with Figure 3a.
Figure 3—video 2
Continuum simulation of two-dimensional (2D) colony growth during regular expansion.
Colony density is overlapped with velocity field pattern. This video is associated with Figure 3e.
Figure 3—video 3
Continuum simulation of two-dimensional (2D) colony growth during inward growth.
Colony density is overlapped with velocity field pattern. This video is associated with Figure 3f.
Figure 4 with 2 supplements
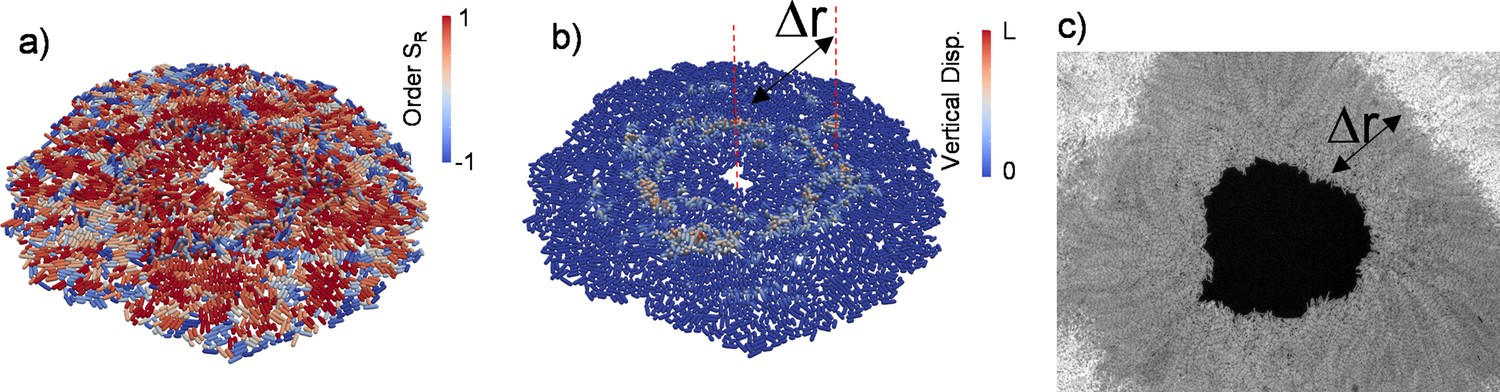
Three-dimensional (3D) colony growth and multi-layer formation.
(a,b) Snapshot of inward-growing bacterial domains obtained through the finite element model simulation in 3D. The colors represent (a) the radial order parameter ( ) and (b) the vertical displacement of the bacteria during growth. L is the bacterial length. (c) Experimental snapshot of the inward-growing domain indicating the transition between mono- to multi-layer. Δr represents the width of the monolayer bacteria domain.
Figure 4—figure supplement 1
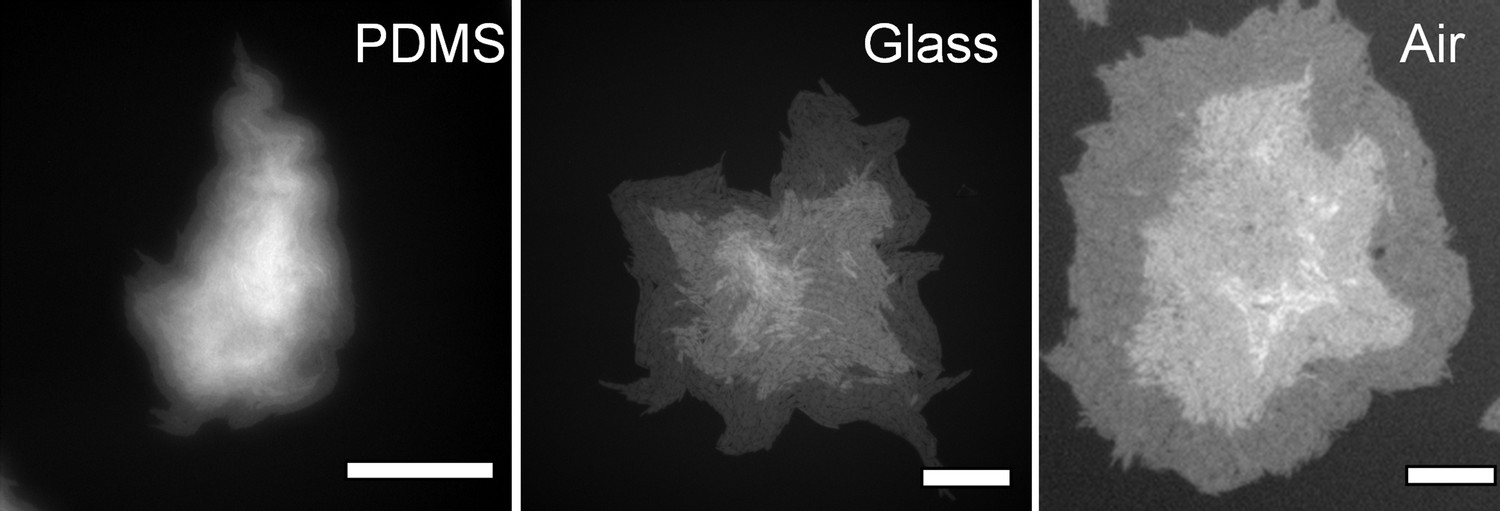
Comparison of the formation of multi-layered colony structures with and without physical confinement.
Using PDMS and glass flat surfaces as vertical confinement, cannot generate large bacterial monolayers. Bright white regions around the center correspond to the second and the third layers. Scale bar corresponds to 100 μm.
Figure 4—figure supplement 2
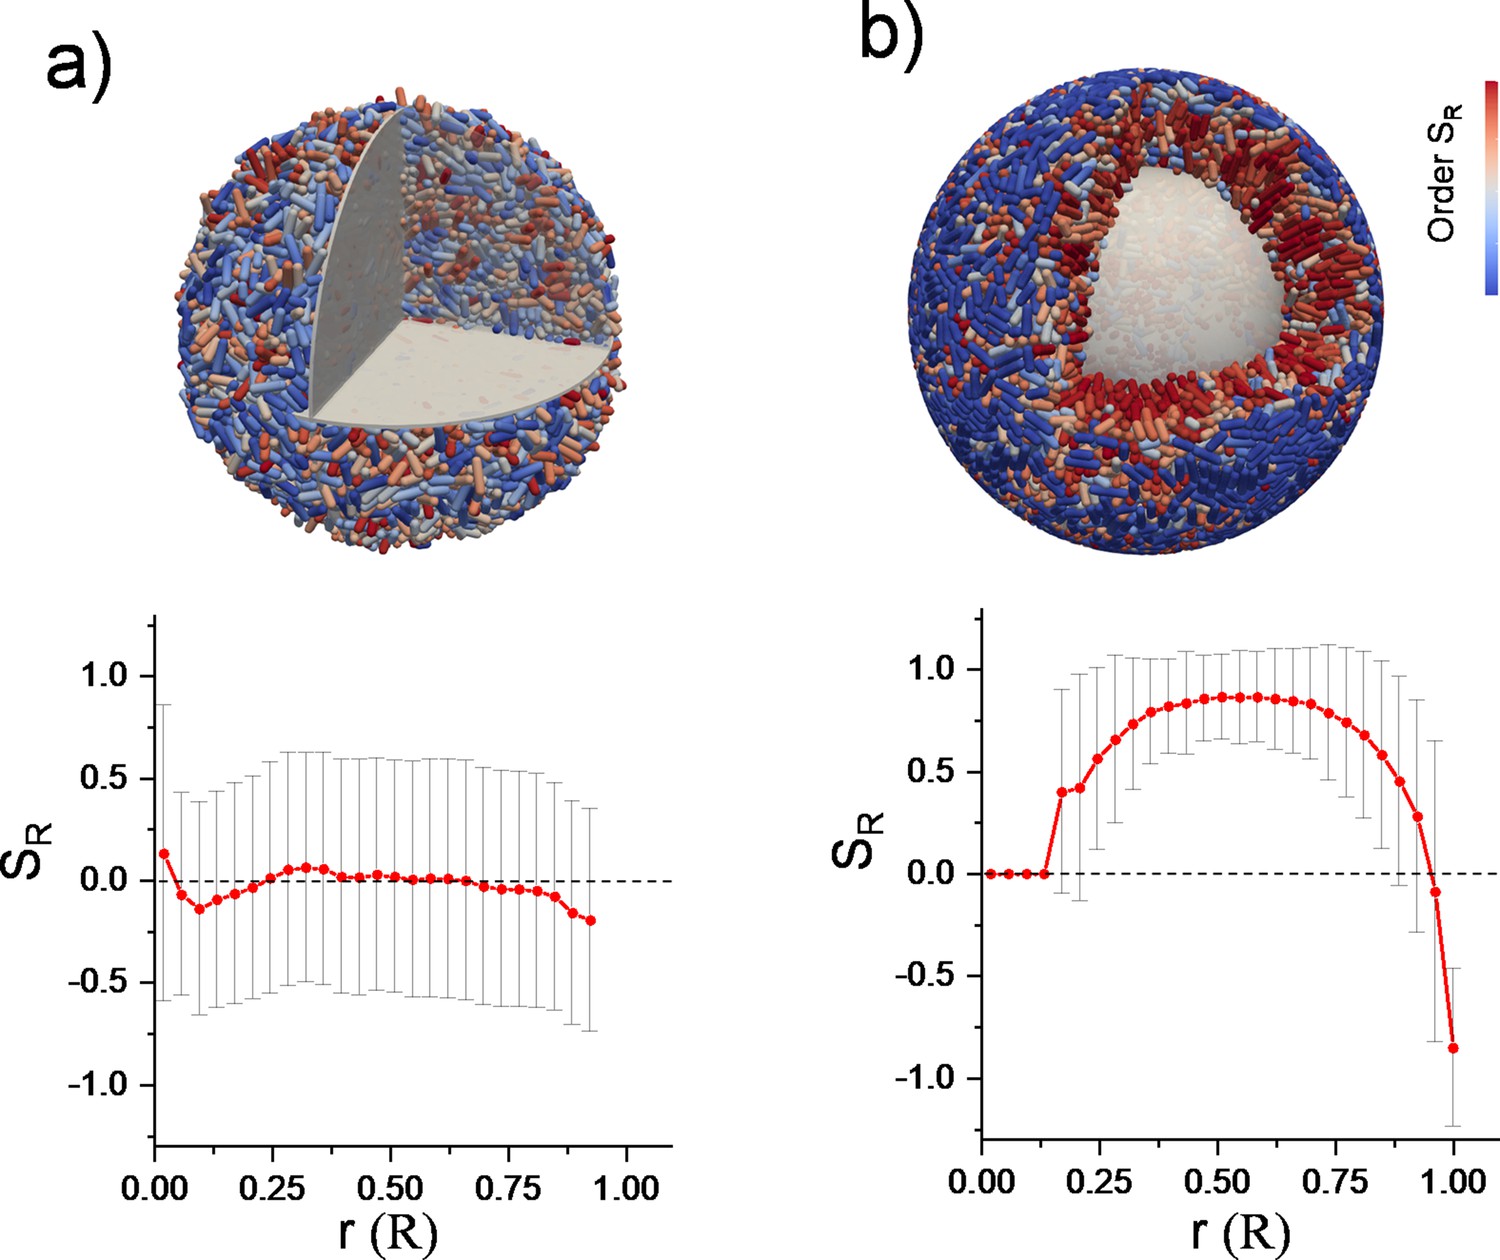
Three-dimensional (3D) finite element method (FEM) simulation results of growing bacterial colony and radial order for (a) freely expanding bacterial colony and (b) inward-growing colony under spherical confinement.
A confined colony can develop strong radial alignment. Gray surfaces were added for visualization purposes. Cell colors represent the radial order. The blue color on the surface indicates surface anchoring.
Figure 5 with 12 supplements

Patterning initial distribution of growing bacterial colonies.
(a,b) Snapshot of inward-growing bacterial colonies (Bacillus subtilis) on different surfaces. Initial bacterial distribution is defined by non-contact lithographic techniques with blue light exposure. Inward-growing domains are formed by merging colonies originating from annulus-shaped initial distribution. (a) On an agarose surface, growing colonies easily form multi-layer structures and provide narrow monolayer inward-growing domains. However, (b) on a low friction polycarbonate (PC) surface, bacteria form monolayer colonies and provide large-scale inward-growing domains. Scale bar 500 μm. (c) Magnified fluorescence image superimposed with director field of the inward-growing domain indicating the radial alignment of bacteria. Δr represents the width of the monolayer region. Scale bar 50 μm. (d) Radial order parameter (SR) and (e) radial velocity profile (vr) as a function of distance across the monolayer colony. Velocity profile was extracted by using PIV algorithms around the center of the annulus shape (Figure 5—video 2). (f) The experimentally measured inner and outer and critical radius. d, e, f are averaged over four different colonies, starting from the same initial annulus-shaped distribution.
Figure 5—figure supplement 1
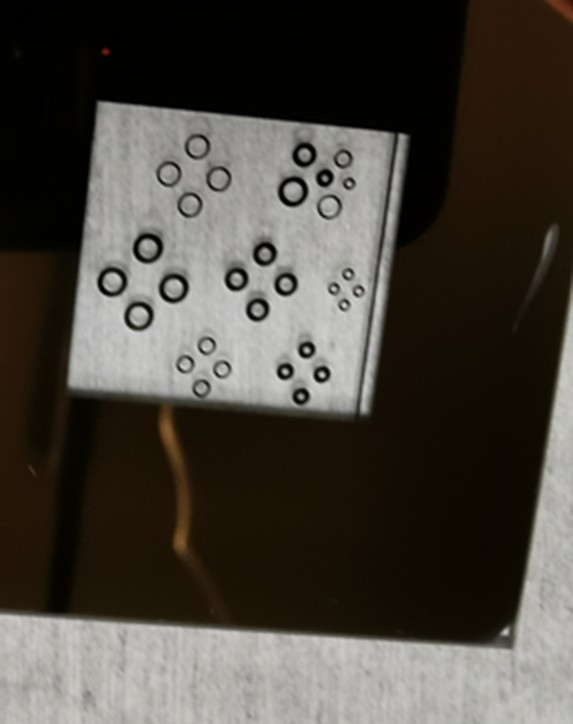
Photomask with different annulus shapes was used to define the initial distribution of bacteria.
Figure 5—figure supplement 2
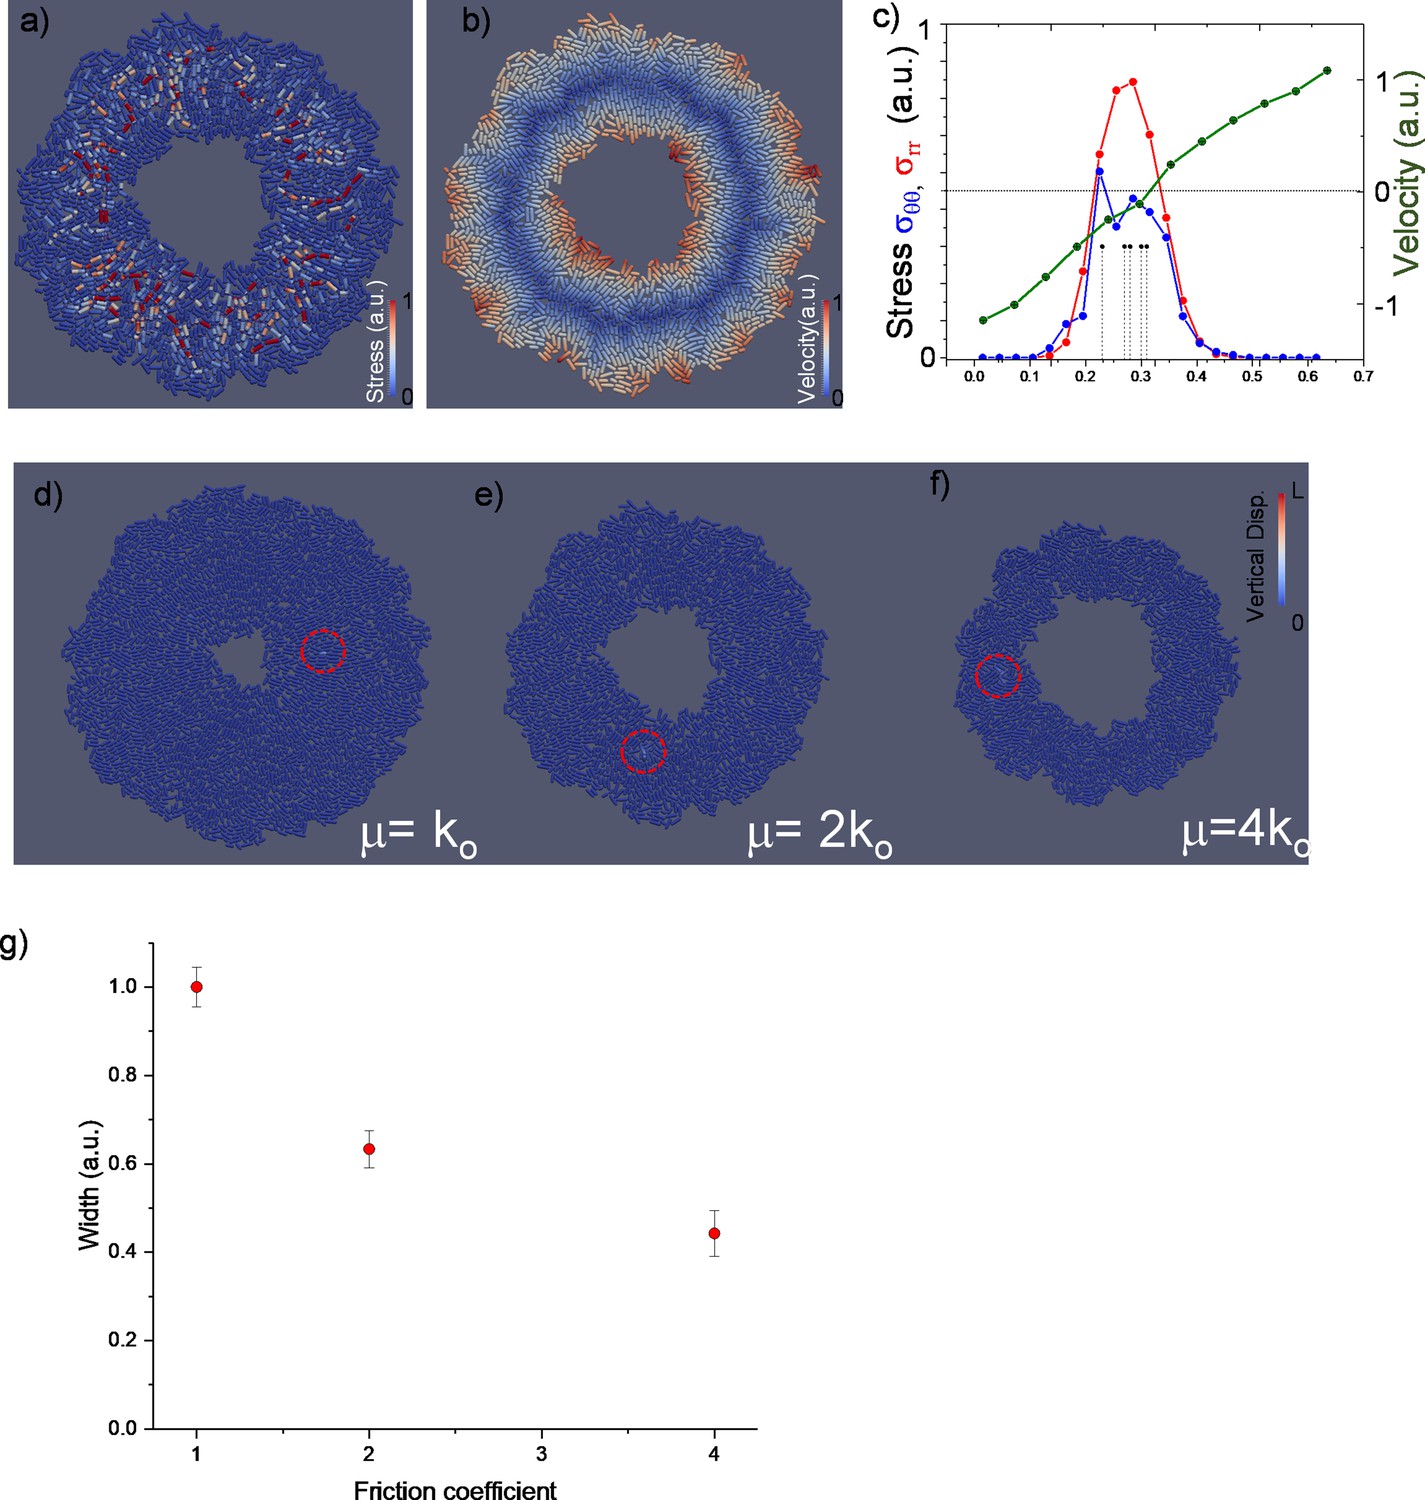
Snapshot of inward-growing bacterial domains with the color representing compressive stress (a) on individual bacteria, velocity profile (b), and azimuthally averaged radial, hoop stress, the velocity profile, and the positions of the first five extrusion events triggering the multi-layering process (c).
(d–f) Snapshot of the colonies under different surface friction. Snapshots were taken during the first extrusion event before multi-layer formation. The first verticalization processes are shown in red circles. (g) The width of the monolayer colony obtained through the finite element model simulation on flat surfaces as a function of friction coefficients.
Figure 5—figure supplement 3
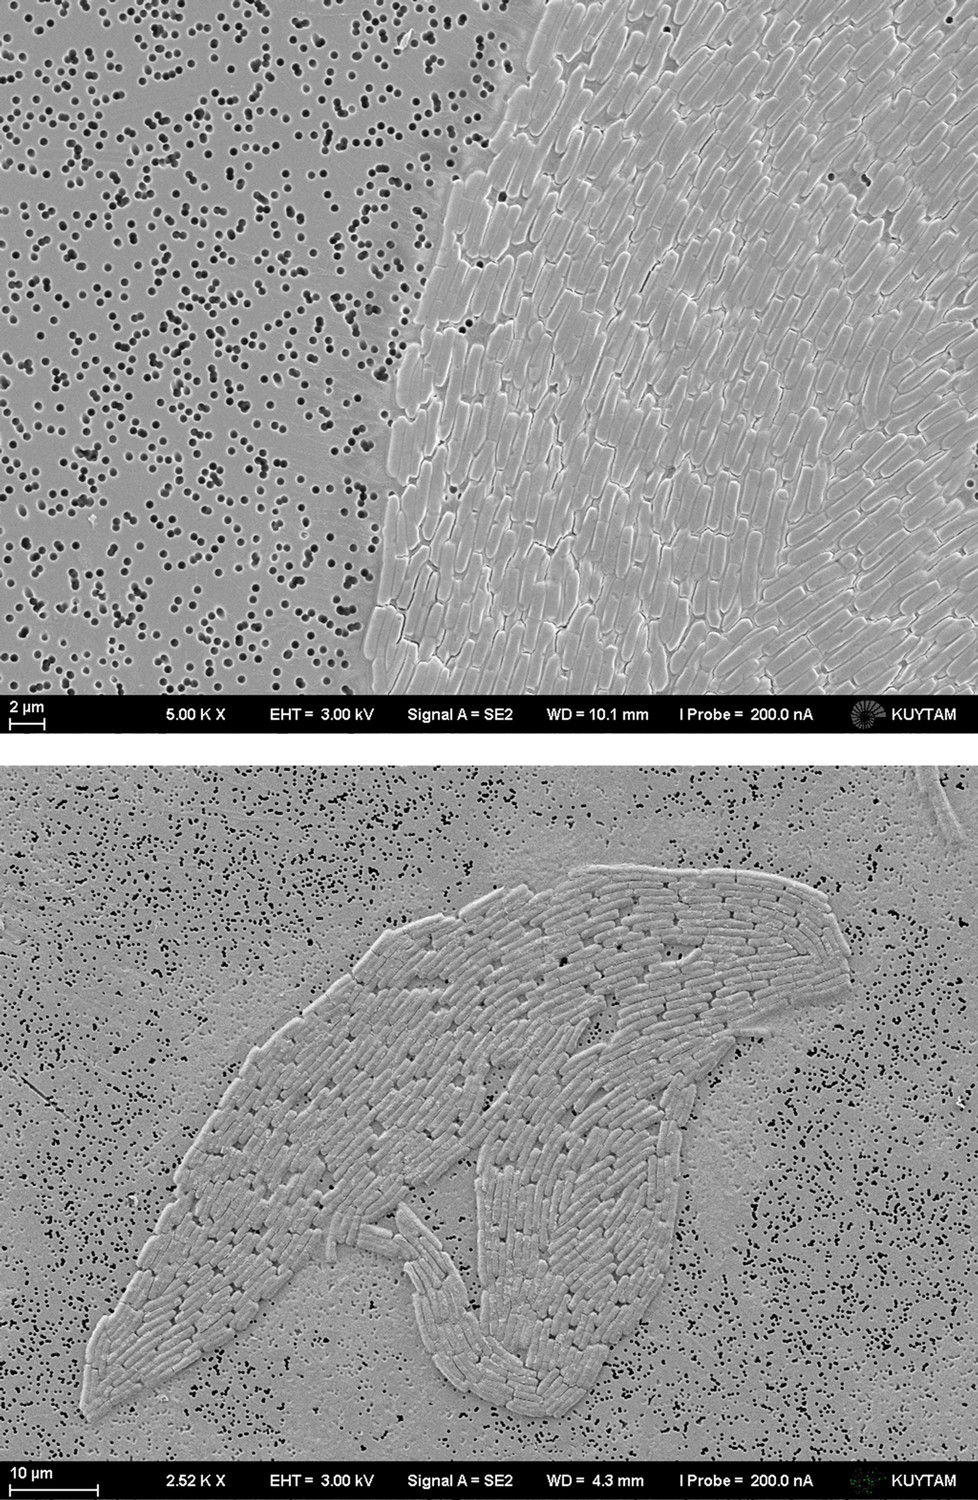
Sample SEM images of growing colonies on a polycarbonate (PC) membrane surface.
Nutrition can leak from Luria-Bertani (LB) plate through the holes and provide a sufficient growth environment for bacteria.
Figure 5—figure supplement 4
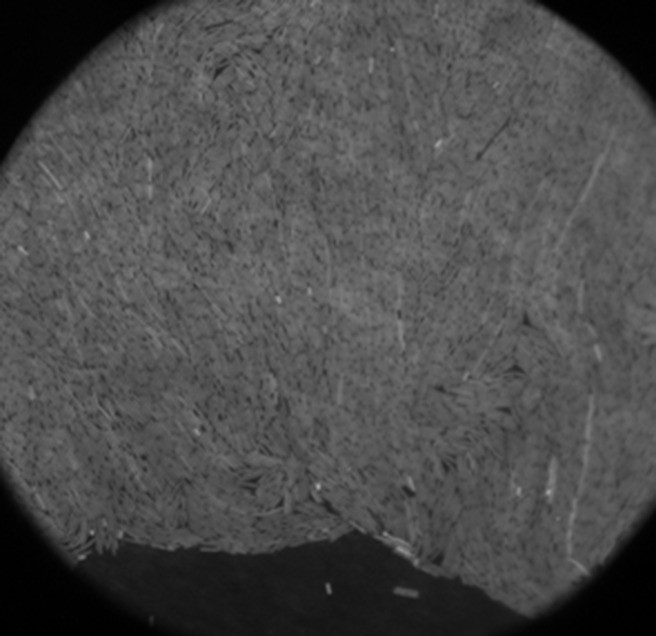
Fluorescence image of growing monolayer colony on a polycarbonate (PC) surface during inward growth.
The bottom edge corresponds to the inner radius of the annulus shape. Large-scale radial alignment occurs around the colony. Scale bar 50 μm.
Figure 5—figure supplement 5
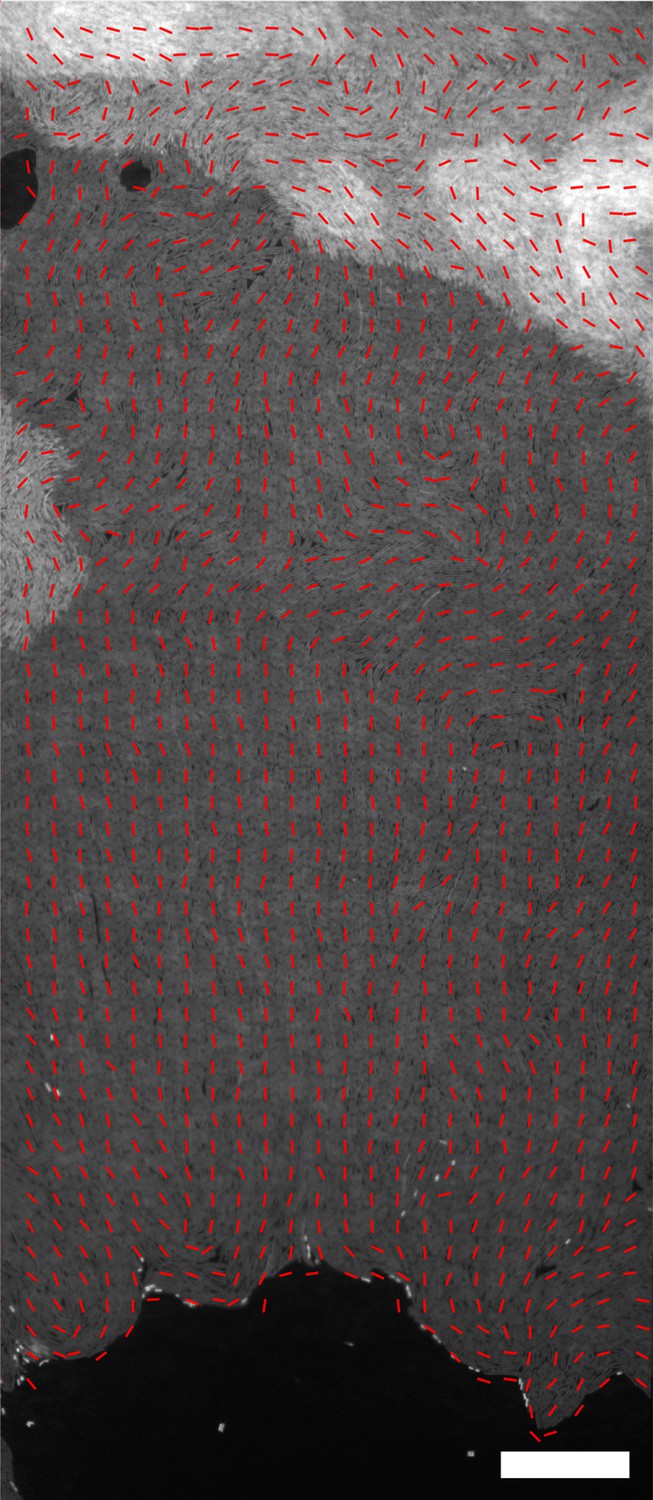
Sample fluorescence image of inward-growing domain superimposed with director field showing large-scale radial bacterial alignment.
The bottom side corresponds to the inner leading edge of the colony. Scale bar 50 μm.
Figure 5—figure supplement 6
Fluorescence image of growing monolayer colony on a polycarbonate (PC) surface starting from a single bacterium.
Scale bar 50 μm.
Figure 5—figure supplement 7
Sample PIV measurement used to determine the position of stationary regions indicating the critical radius Rc.
Scale bar 20 μm. The left side corresponds to the inward-growing domain.
Figure 5—figure supplement 8

Radial alignment of biofilm-forming bacteria during inward growth.
(a) Time evolution of growing chaining bacterial colonies starting from annulus-shaped initial geometry. (b) Magnified fluorescence images indicating the radial alignment of the biofilm around the inner radius. The regions are highlighted in (a). (c) Finite element method (FEM) simulation of growing biofilm structure. (d) Magnified images of simulation results indicating the radial alignment.
Figure 5—video 1
Time evolution of growing colonies starting from annulus-shaped initial distribution.
Figure 5—video 2
High magnification time-lapse imaging of bacterial growth around the critical radius.
Figure 5—video 3
Time evolution of growing biofilm-forming colonies starting from annulus-shaped initial distribution.
The initial bacterial pattern was defined by blue light exposure. The video shows the fluorescence image of GFP labeled biofilm-forming strain Bacillus subtilis 168 (BAK 47) during inward growth. This video is associated with Figure 5—figure supplement 7. The scale bar is given in the associated figure.
Figure 5—video 4
Two-dimensional (2D) finite element method (FEM) simulation results of growing biofilm structure during inward growth.
This video is associated with Figure 5—figure supplement 7.
Figure 6 with 3 supplements
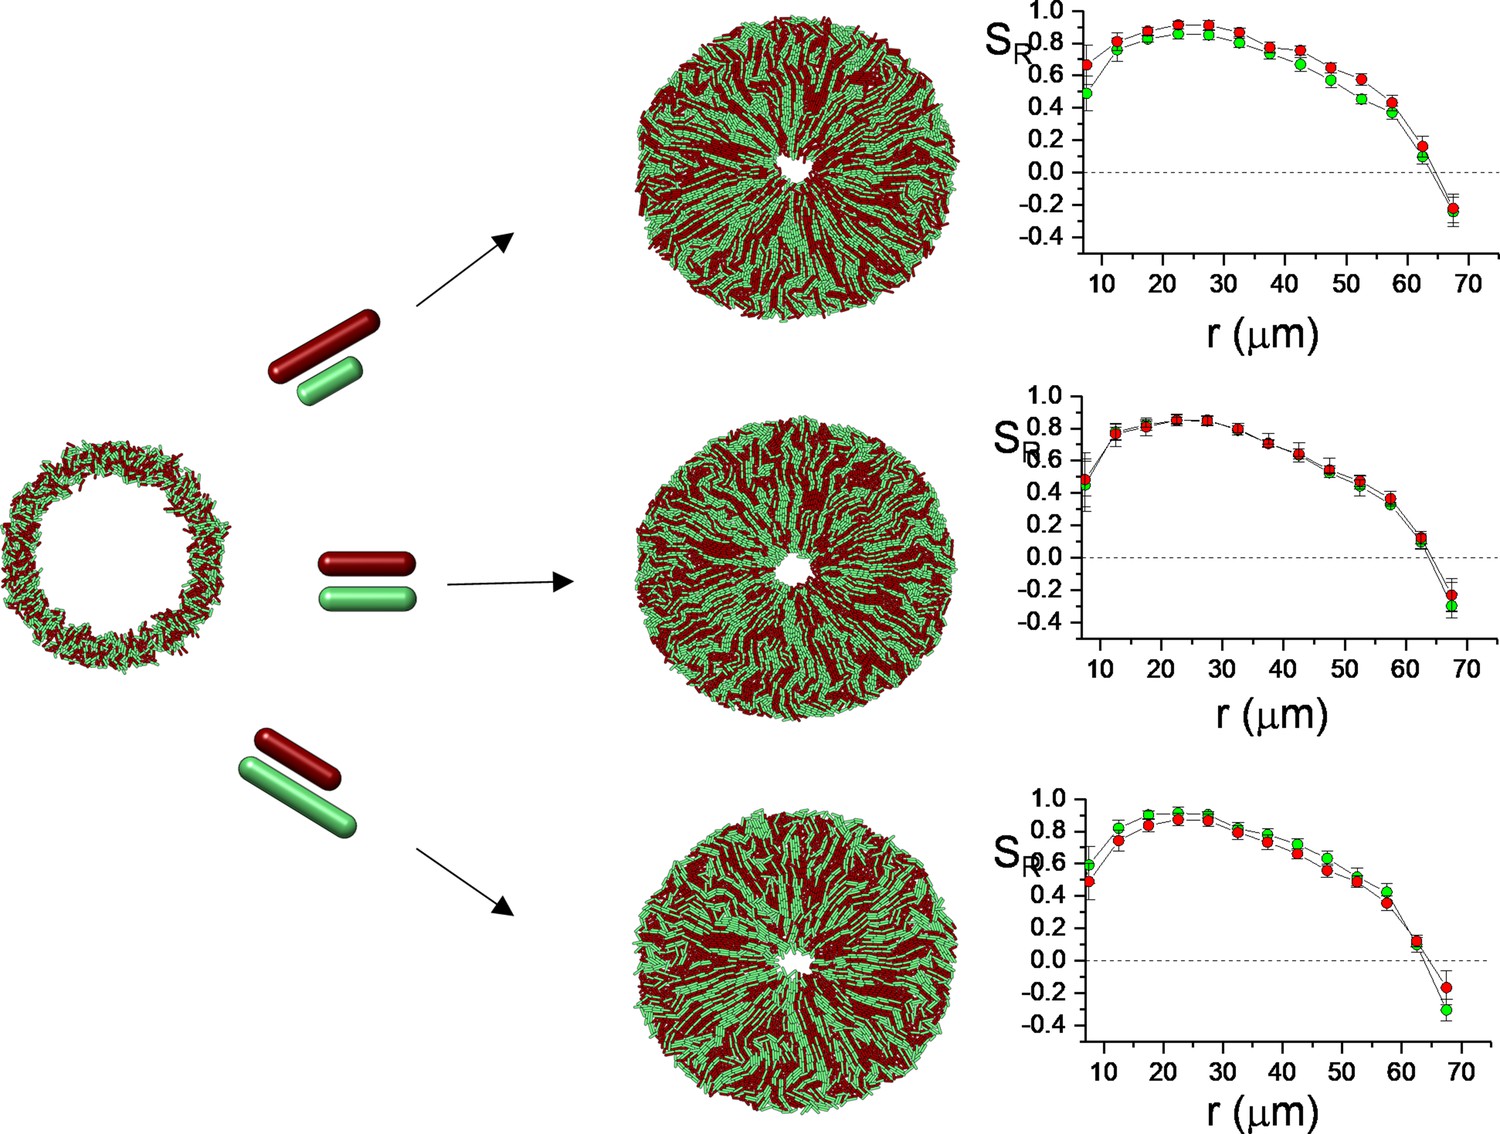
Simulations of bacterial competition during inward growth.
Figure 6—figure supplement 1
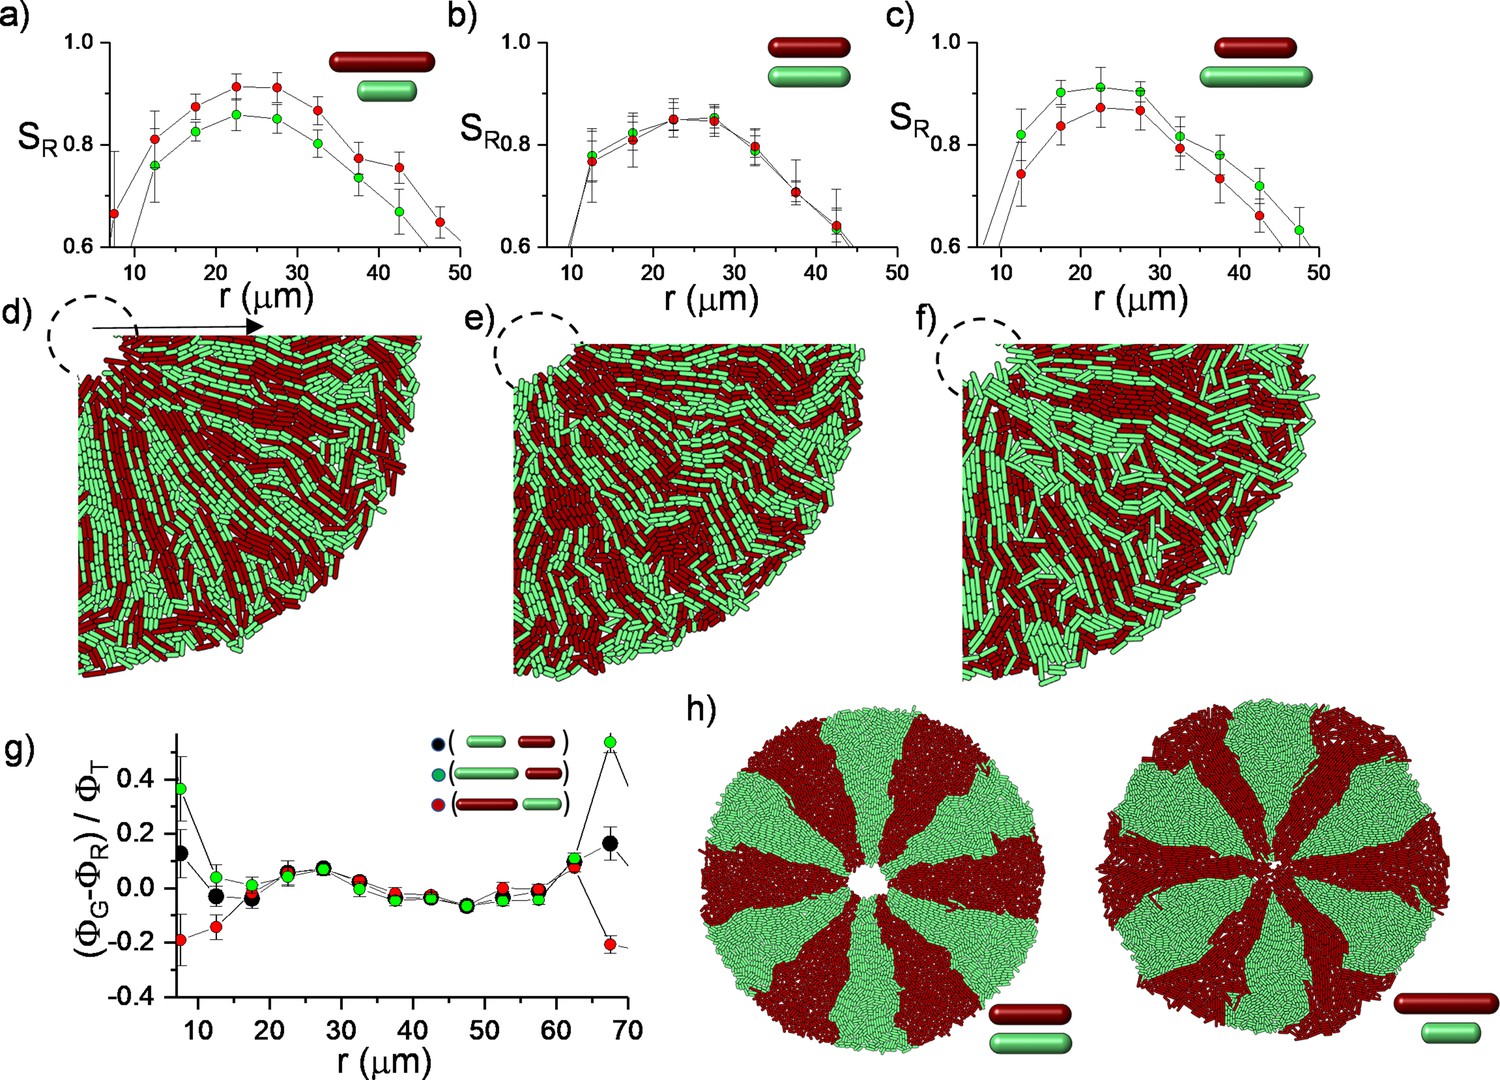
Two-dimensional (2D) simulation results of competing bacterial strains with different division lengths.
Starting from random initial annulus distribution, the longest bacteria could develop higher radial order (SR ) shown in Figure 6a–c. The zoomed versions of (SR ) are given in Figure 6a. This packed and random distribution is hypothetical initial distribution to test the worst-case scenario to challenge bacterial competition. The relative packing fraction is shown in Figure 6g.
Figure 6—figure supplement 2
Experimental verification of bacterial segregation due to random fluctuation during inward growth.
Competing RFP and GFP labeled, identical bacterial strains were mixed and printed on an agar surface using a sharp cylindrical object.
Figure 6—figure supplement 3
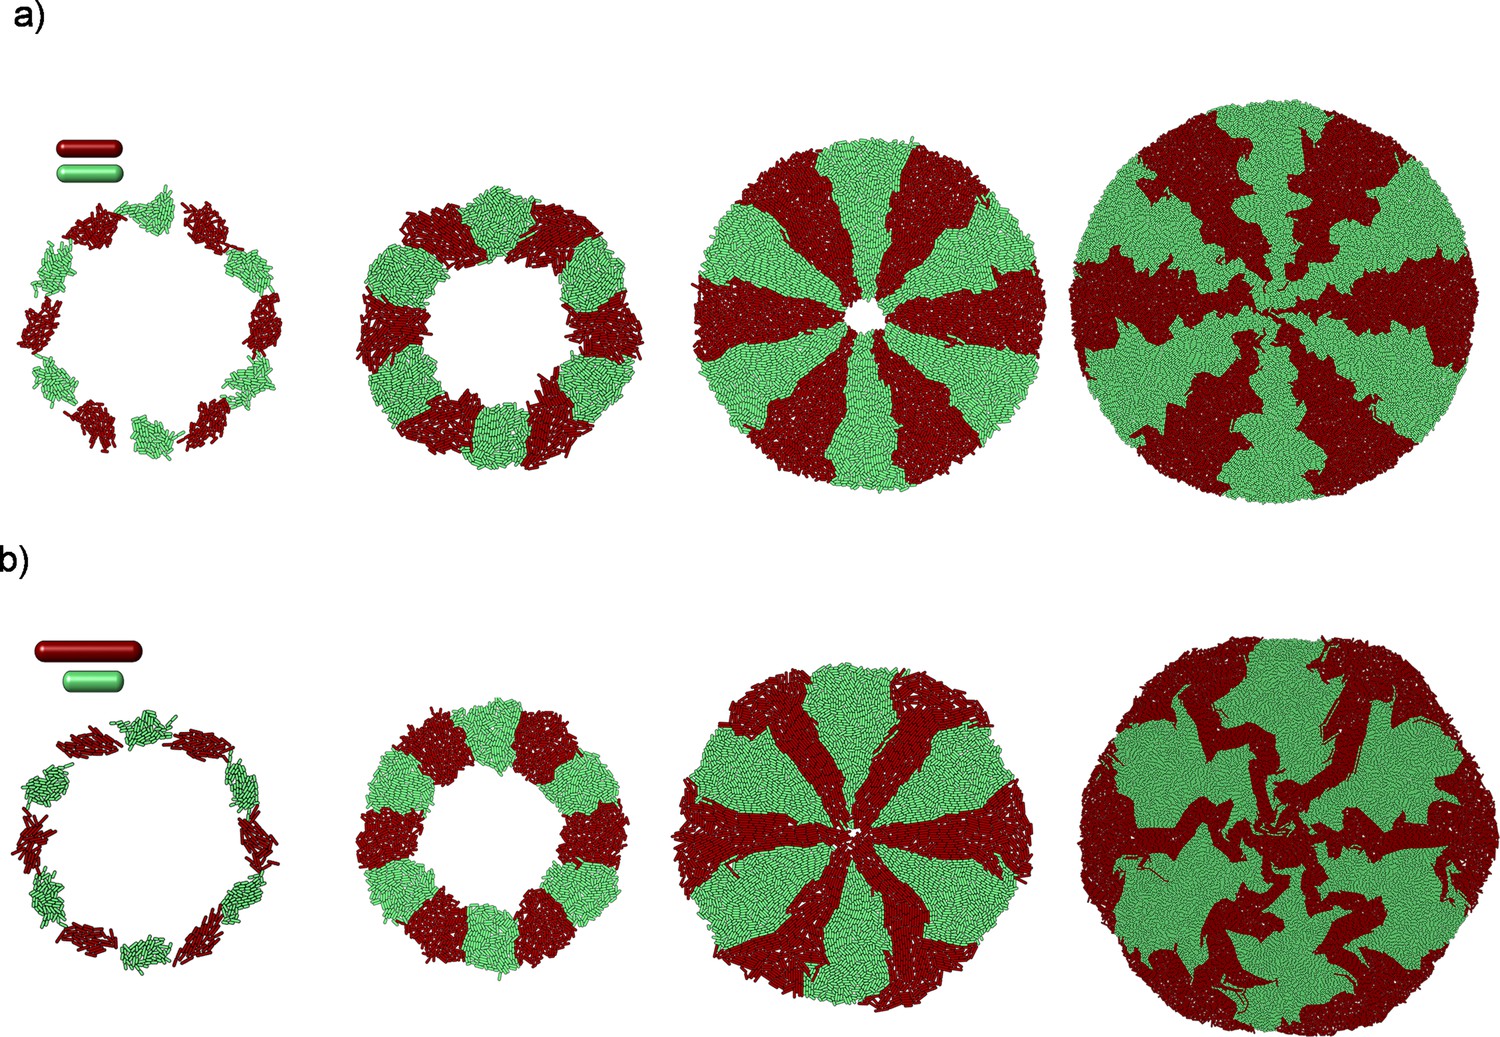
Simulation results of competition of segregated bacterial strains.
The longest bacteria can invade the center more effectively. After a complete invasion of the center, the radial lanes buckle.
Videos
Video 1
Radial alignment during inward growth and emergence of asters.
The video shows the fluorescence image of GFP labeled Escherichia coli (BAK 55) during inward growth. The duration of the experiment is 120 min and the total area is 125 × 125 μm2.
Video 2
Simulation of a bacterial colony during inward growth.
This video is associated with Figure 1f.
Video 3
Continuum simulation of two-dimensional (2D) colony growth during inward growth.
The scalar order parameter is overlapped with the director field pattern. This video is associated with Figure 3b.
Video 4
Finite element method (FEM) simulation of colony growth during inward growth.
Color represents vertical displacement. This video is associated with Figure 4b.
Video 5
Finite element method (FEM) simulation of colony growth during inward growth.
Color represents the radial order parameter. This video is associated with Figure 4a.
Video 6
Simulation results of competing bacterial strains with identical division lengths.
RFP and GFP labeled bacteria are initially segregated. Color represents the bacterial type. This video is associated with Figure 6h.
Video 7
Simulation results of competing bacterial strains with different division lengths.
RFP and GFP labeled bacteria are initially segregated. Color represents the bacterial type. This video is associated with Figure 6h.
Tables
Table 1
List of strains used in this study.
| Strain | Parent | Operation | Genotype |
|---|---|---|---|
| BAK47 | 168 | Transformed with plasmid ECE321 from Bacillus Genetic Stock Center | amyE::Pveg-sfGFP (Spc) |
| BAK115 | TMN1138 | Transformed with plasmid ECE327 from Bacillus Genetic Stock Center | amyE::Pveg-mKate (Spc) sacA::Phag-mKate2L (Kan) hagA233V (Phleo) |
| BAK51 | TMN1138 | Transformed with plasmid ECE321 from Bacillus Genetic Stock Center | amyE::Pveg-sfGFP (Spc) sacA::Phag-mKate2L (Kan) hagA233V (Phleo) |
| BAK 55 | DH5alpha | Transformed with plasmid 107741 from Addgene | pDawn-sfGFP |
Additional files
Download links
A two-part list of links to download the article, or parts of the article, in various formats.
Downloads (link to download the article as PDF)
Open citations (links to open the citations from this article in various online reference manager services)
Cite this article (links to download the citations from this article in formats compatible with various reference manager tools)
Large-scale orientational order in bacterial colonies during inward growth
eLife 11:e72187.
https://doi.org/10.7554/eLife.72187


