Proton transfer pathway in anion channelrhodopsin-1
- Department of Applied Chemistry, The University of Tokyo, Japan
- Graduate School of Medicine, Dentistry and Pharmaceutical Sciences, Okayama University, Japan
- Research Center for Advanced Science and Technology, The University of Tokyo, Japan
Figures
Figure 1
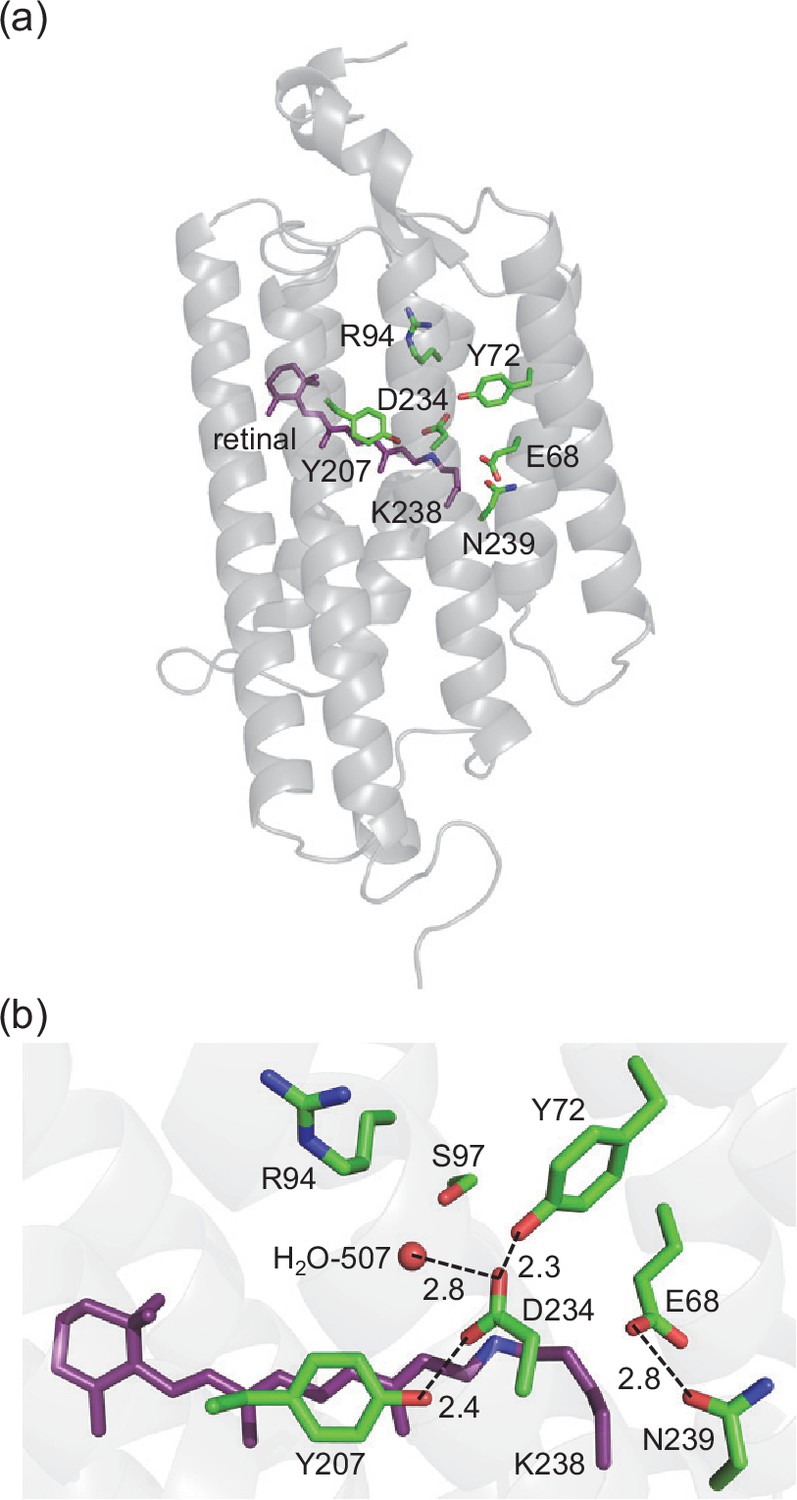
GtACR1.
(a) Overview of the GtACR1 structure. (b) Residues near the Schiff base in GtACR1 (PDB code: 6EDQ; Li et al., 2019). Dotted lines indicate H-bonds.
Figure 2 with 1 supplement
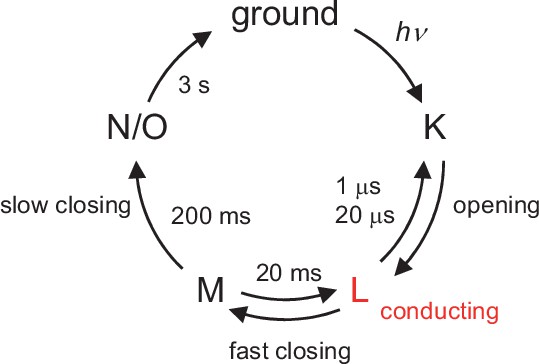
Photocycle of GtACR1 proposed in Sineshchekov et al., 2016.
The L- to M-state and M- to N/O-state transitions involve deprotonation and reprotonation of the Schiff base, respectively.
Figure 2—figure supplement 1
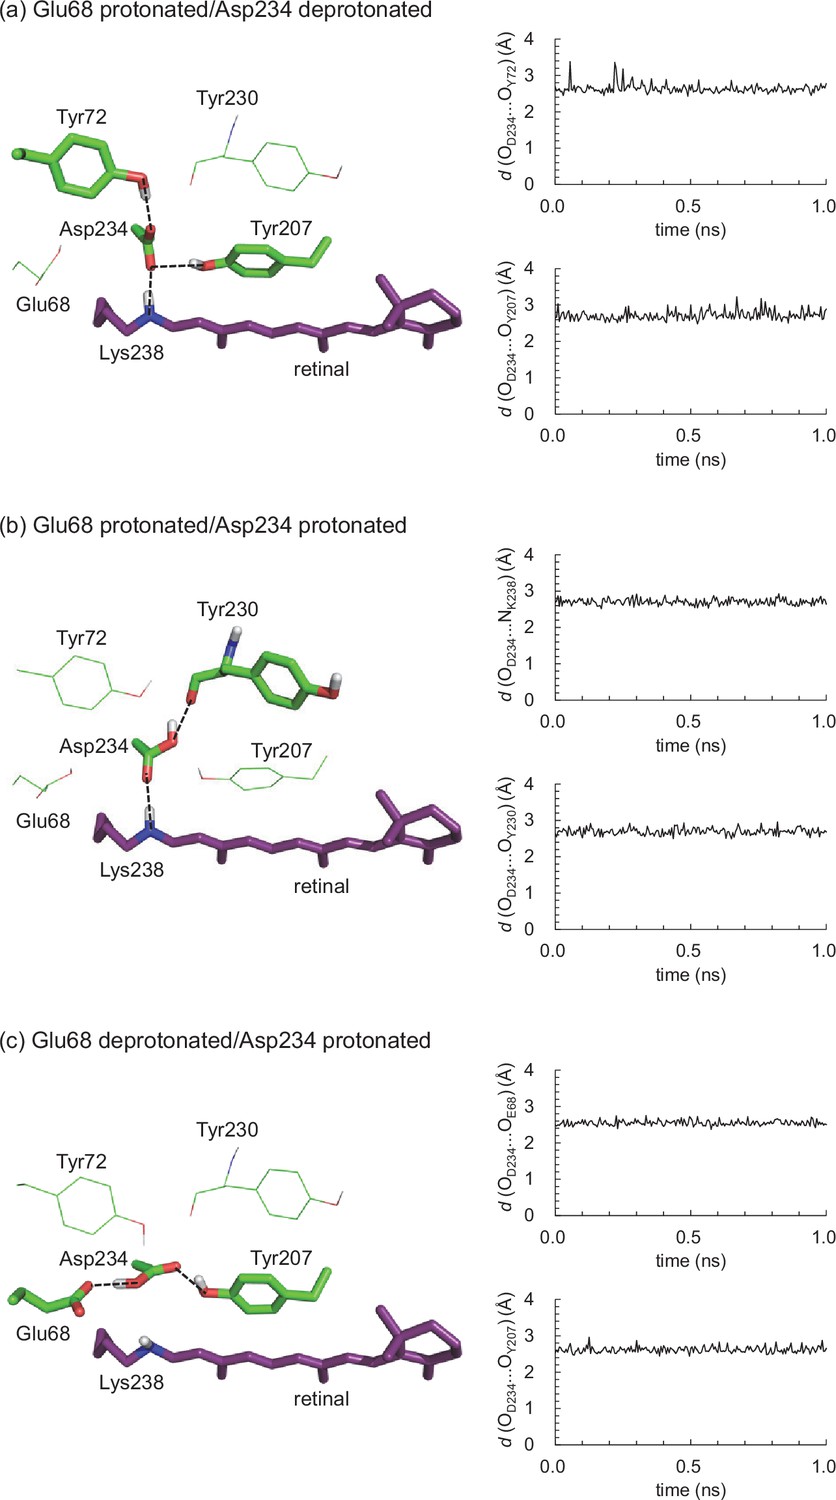
Representative MDgenerated conformations (left panel) and the distances (d) between Asp234 and the adjacent residues during the 1 ns production run (right panel) in the wild-type GtACR1s with (a) protonated Glu68/deprotonated Asp234, (b) protonated Glu68/protonated Asp234, and (c) deprotonated Glu68/protonated Asp234.
Dotted lines indicate the H-bonds of Asp234.
Figure 3 with 2 supplements
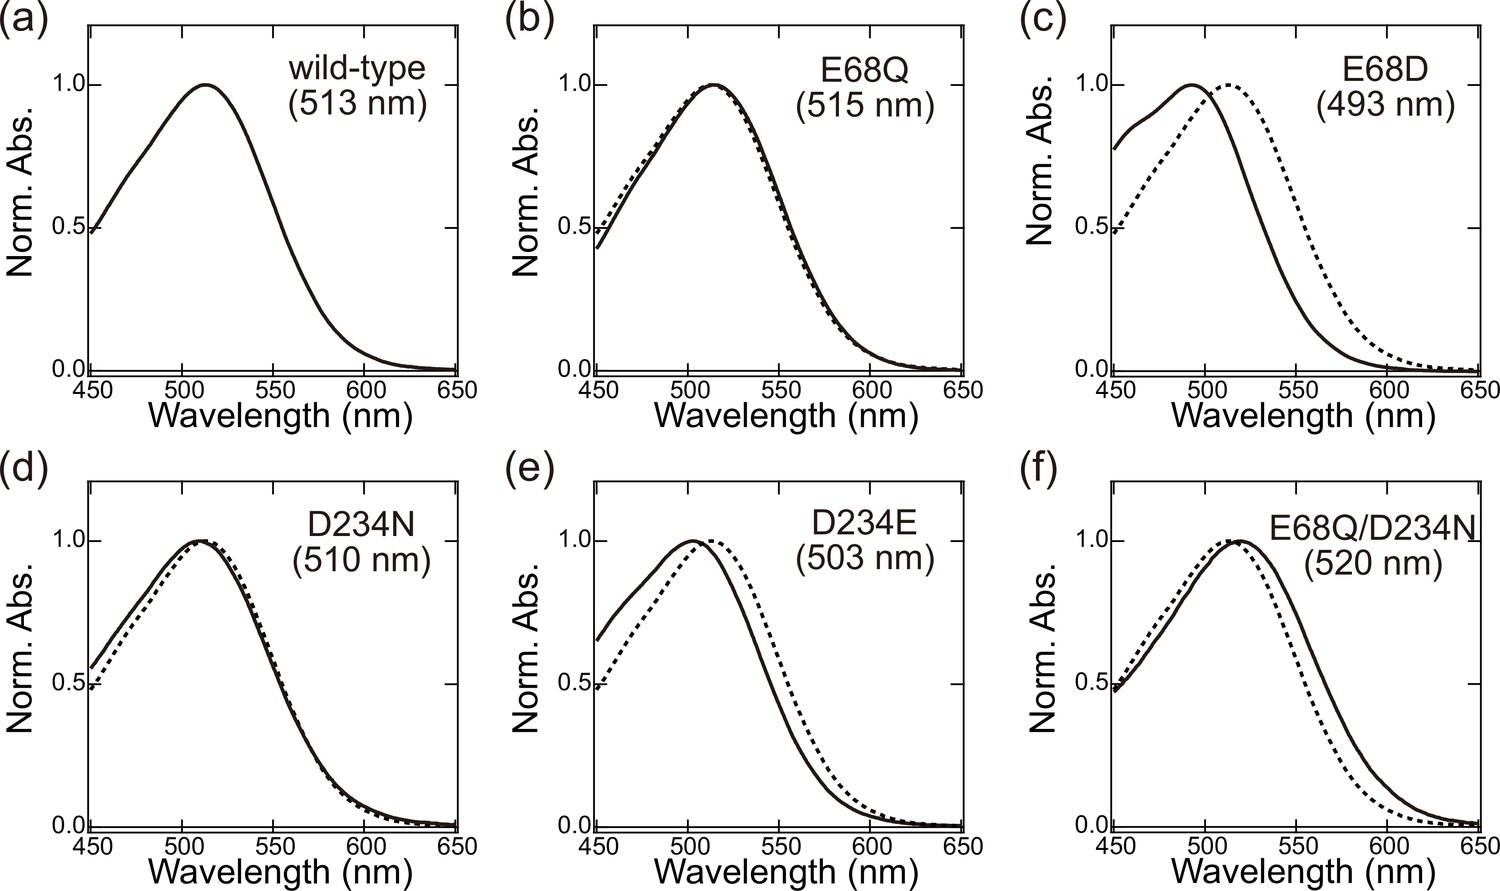
Absorption spectrum of (a) wild-type, (b) E68Q, (c) E68D, (d) D234N, (e) D234E, and (f) E68Q/D234N GtACR1s in DDM micelles.
Spectra are normalized at peak absorbance. The spectra for the wild-type (dotted curves in panels b–f) are shown for comparison. For each absorption spectrum, the results of four-traces were averaged to improve the signal-to-noise ratio. Absorption wavelengths were measured from the averaged spectra.
Figure 3—figure supplement 1
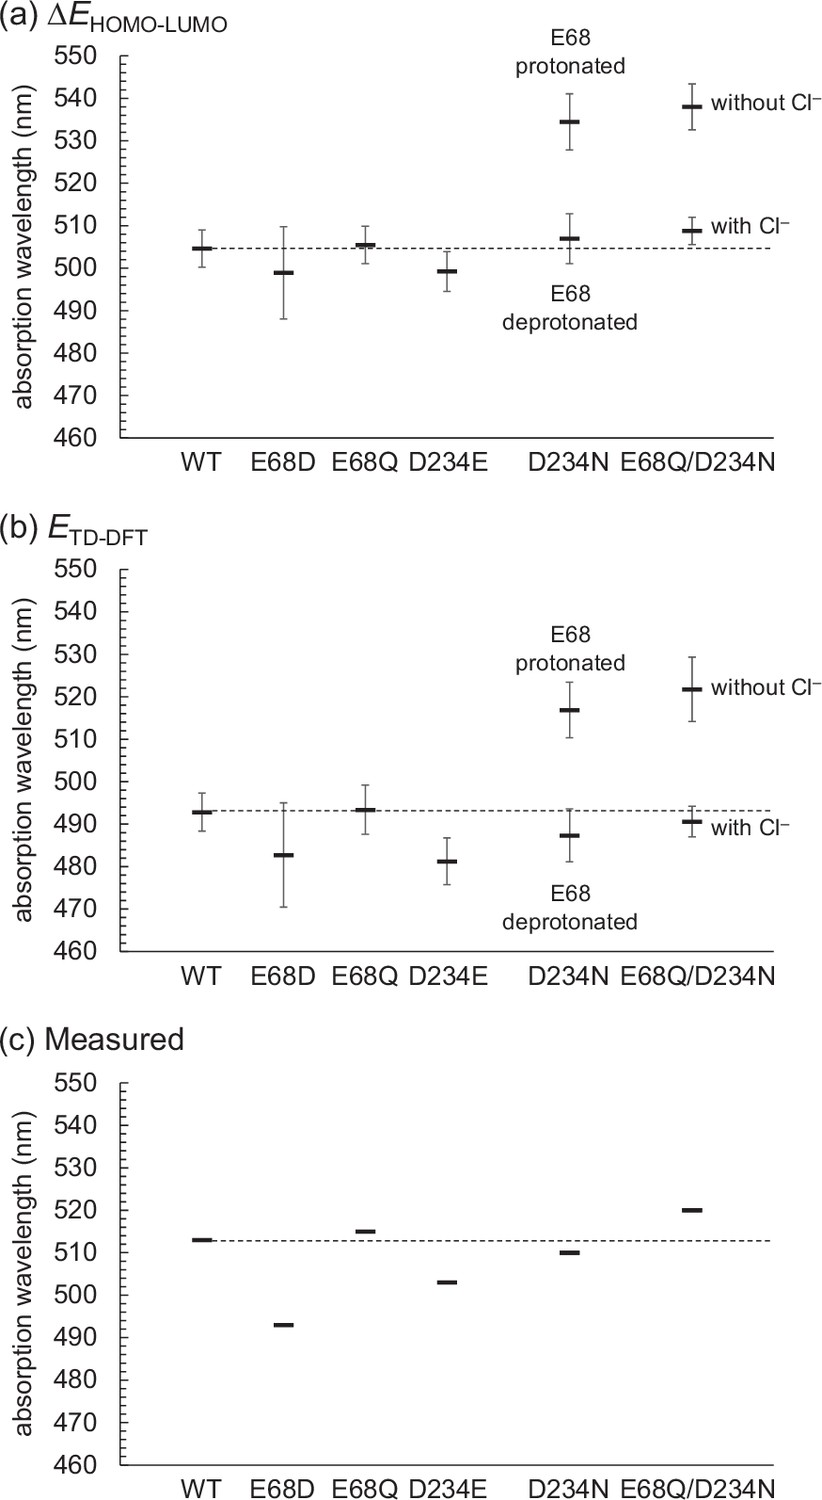
Absorption wavelengths of wild-type and mutant GtACR1s calculated using (a) Equation 1 with ΔEHOMO-LUMO and (b) Equation 2 with ETD-DFT.
Vertical bars represent standard deviations of 10 MD-based protein conformations. (c) Measured absorption wavelengths of wild-type and mutant GtACR1s.
Figure 3—figure supplement 2
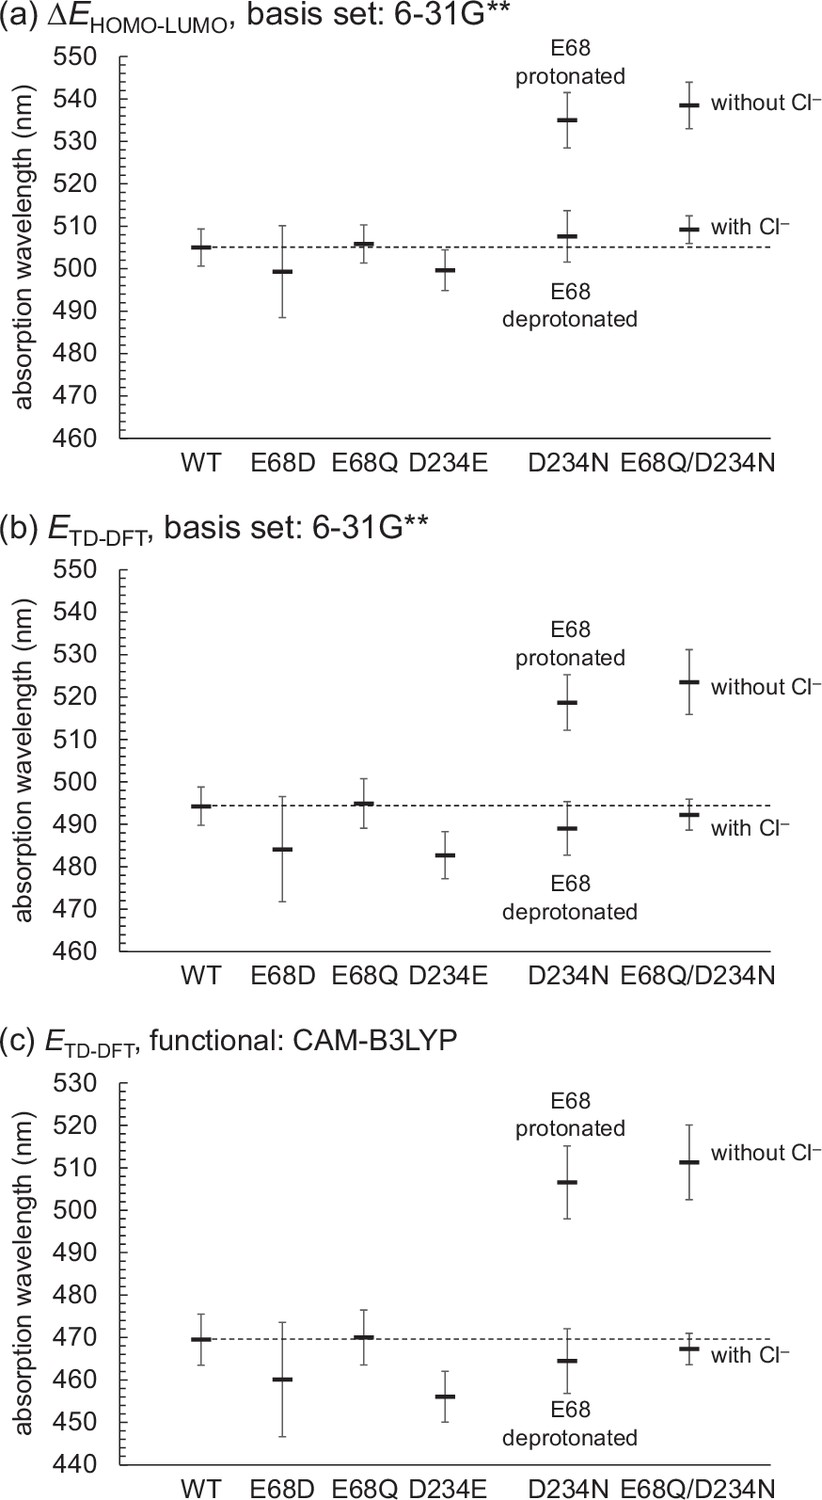
Absorption wavelengths of wild-type and mutant GtACR1s.
Calculated using (a) Equation 1 with ΔEHOMO-LUMO and 6-31G** basis sets, (b) Equation 2 with ETD-DFT and 6-31G** basis sets, and (c) Equation 2 with ETD-DFT and the CAM-B3LYP (Yanai et al., 2004) functional (μ = 0.14).
Figure 4 with 2 supplements
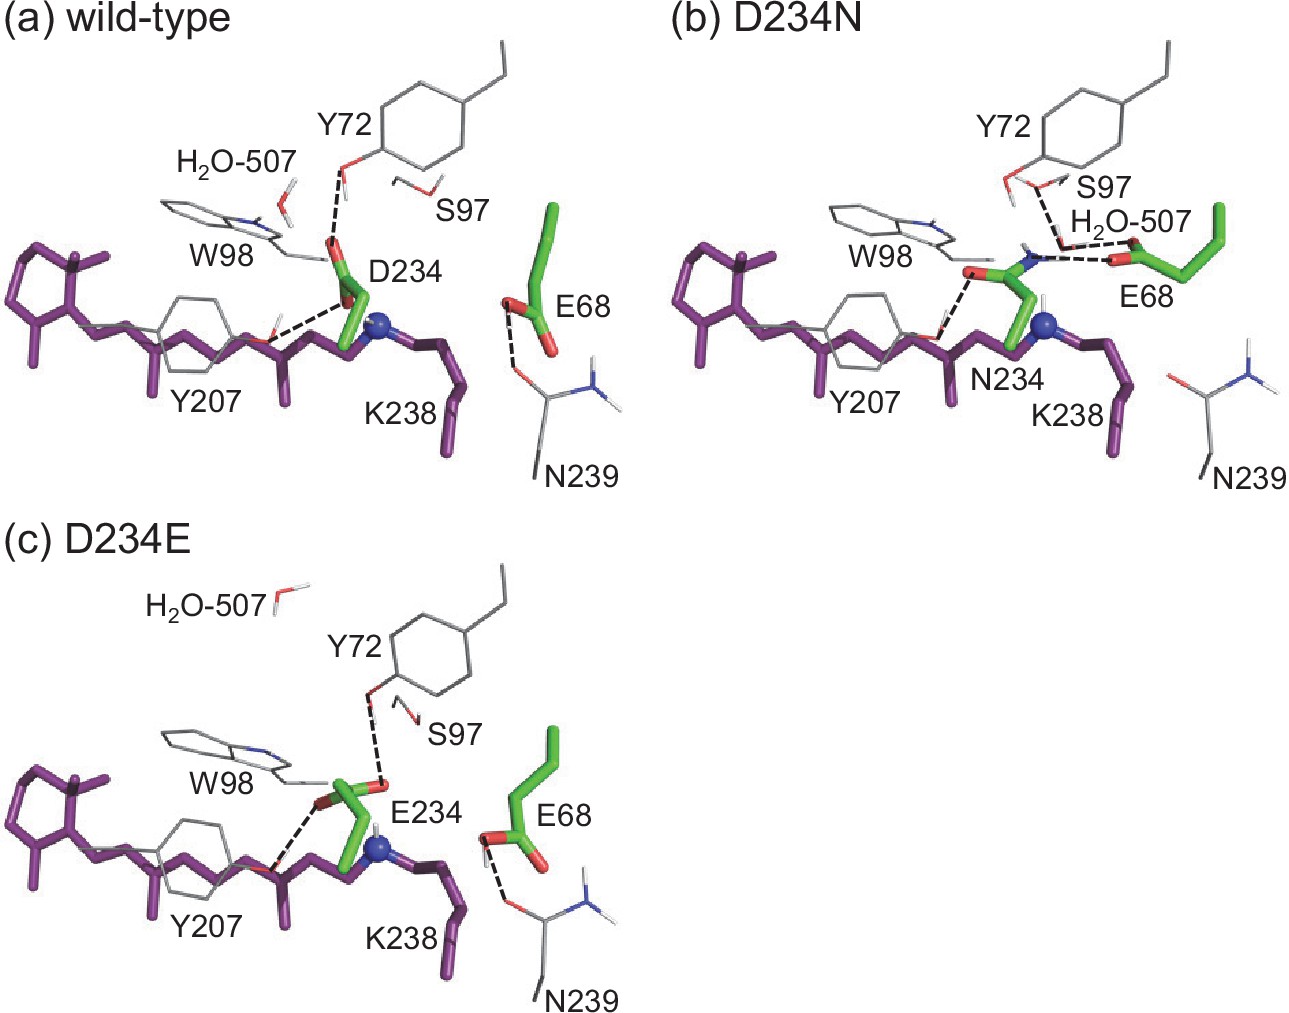
The H-bond network of the Schiff base of (a) wild-type, (b) D234N, and (c) D234E GtACR1s.
Representative MDgenerated conformations, whose absorption wavelengths are closest to the average value for the 10 MD-generated structures, are shown. Dotted lines indicate H-bonds.
Figure 4—figure supplement 1
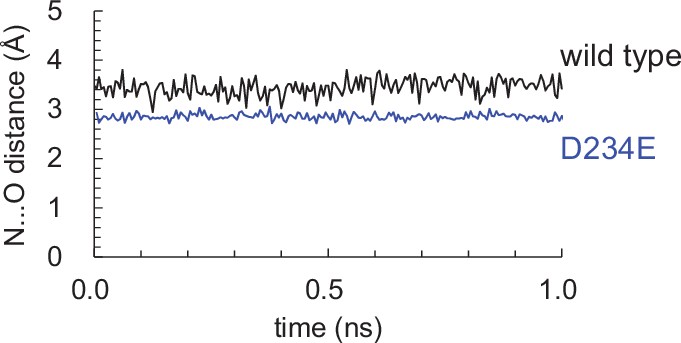
The distances between Schiff base and Asp234 in the wild-type GtACR1 and between Schiff base and Glu234 in the D234E GtACR1 during the 1 ns production run.
Averaged values of the two distances between the N atom of the Schiff base and the two O atoms of the side chains of Asp234/Glu234 are shown.
Figure 4—figure supplement 2
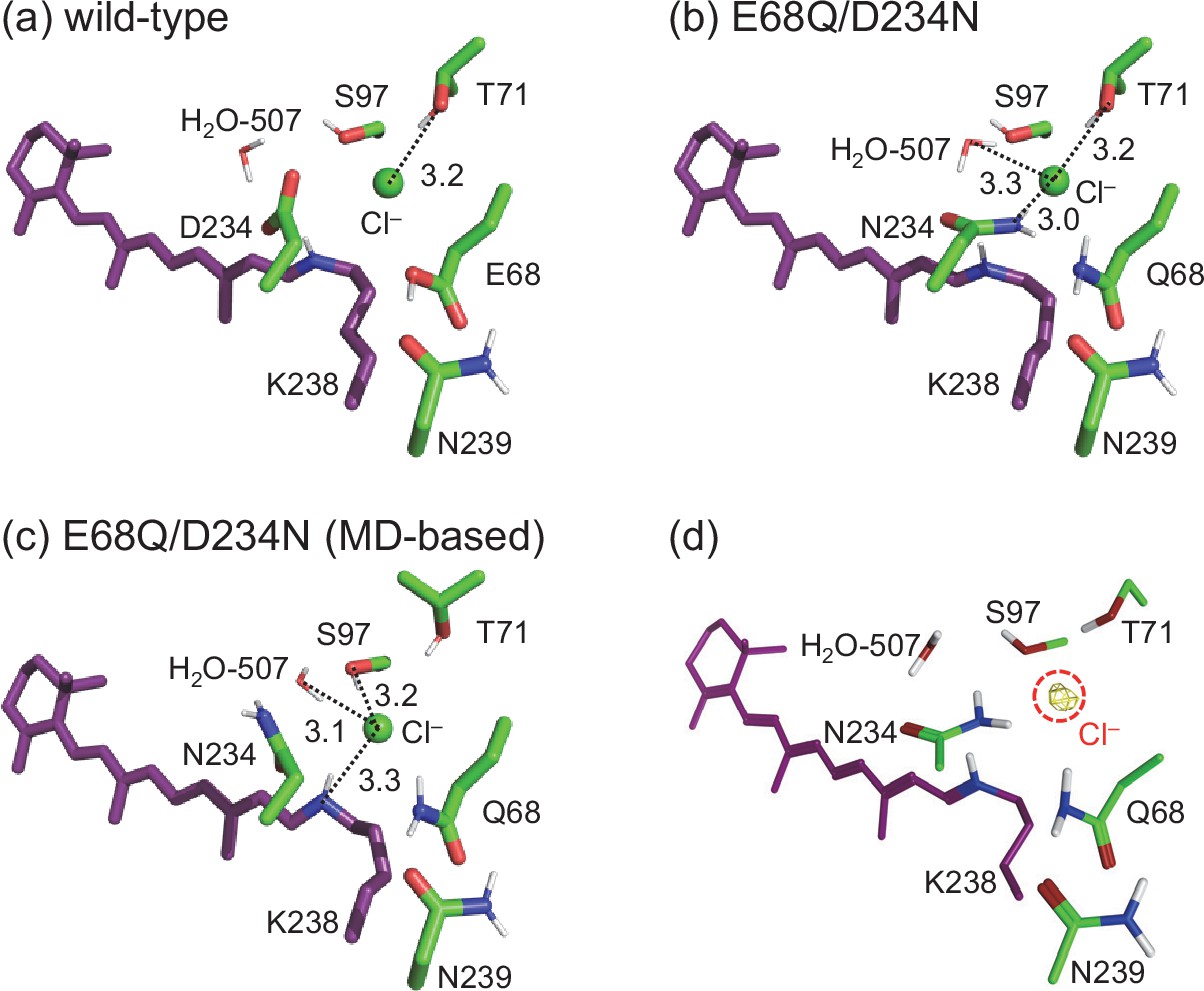
QM/MM-optimized Cl–-binding structures of (a) wild-type and (b) E68Q/D234N mutant GtACR1s.
For the QM/MM optimization, the QM region was defined as retinal, the Schiff base (K238), Cl–, H2O-507, and the side chains of the residues near the Schiff base (Glu (Gln) 68, Thr71, Tyr72, Ser97, Thr101, Tyr207, Asp (Asn) 234, and Asn239). (c) MD-based Cl–-binding E68Q/D234N mutant structure. (d) Distribution pattern of Cl– (yellow mesh) in the QM/MM-optimized E68Q/D234N GtACR1 structure calculated using a three-dimensional reference interaction site model (3D-RISM). 3D-RISM calculation (Beglov and Roux, 1997; Kovalenko and Hirata, 1999; Sindhikara et al., 2012) was performed using the Molecular Operating Environment (MOE), 2021, program.
Figure 5 with 1 supplement
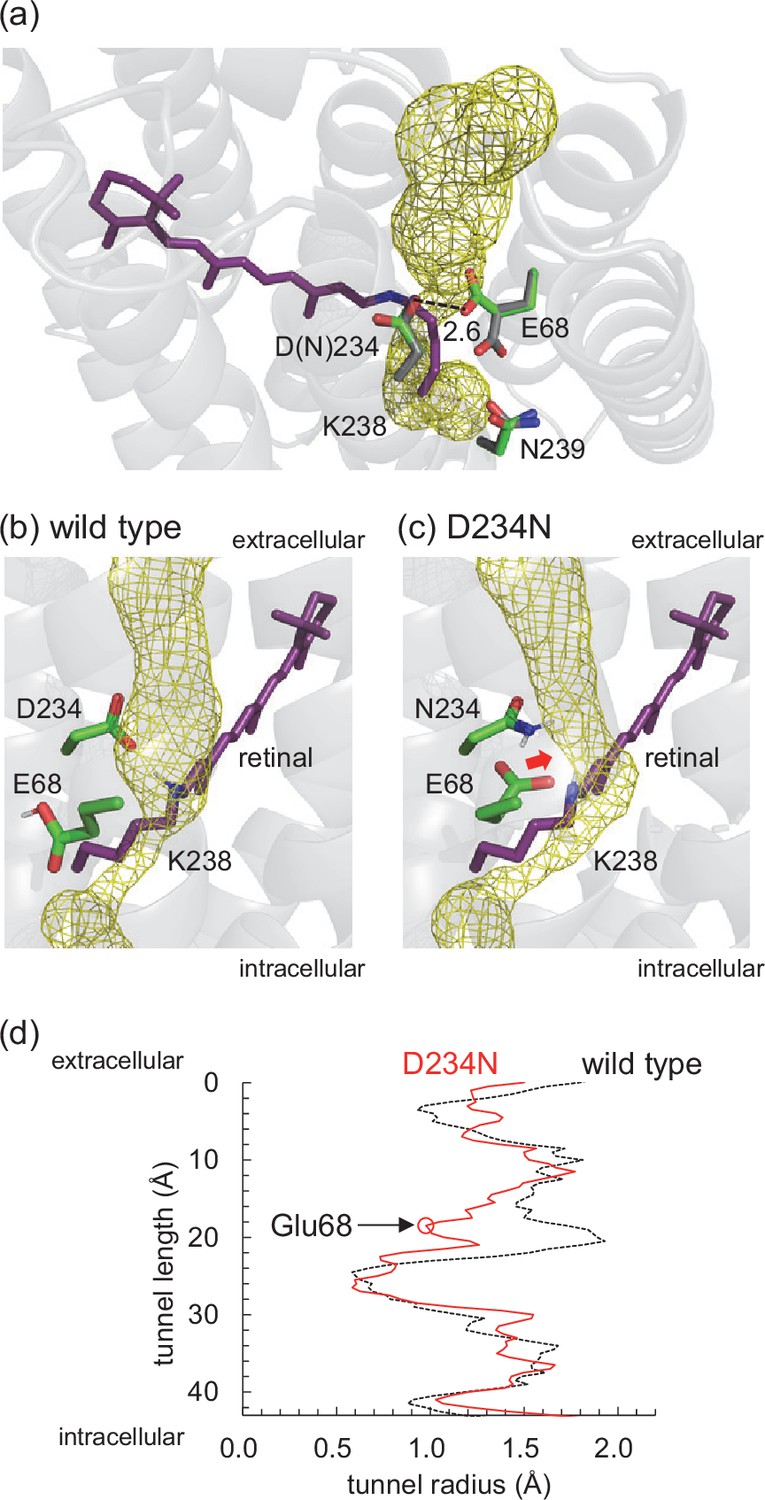
Channel space in GtACR1.
(a) Channel space and side-chain orientations in the wild-type (gray sticks, PDB code 6EDQ; Li et al., 2019) and D234N (green sticks, a representative MD-generated conformation) GtACR1s. The yellow mesh indicates the channel space in the wild-type GtACR1 analyzed using the CAVER program (Chovancova et al., 2012). Note that the channel space is consistent with that reported by Li et al., 2019. Channel space and side-chain orientations in the representative MD-generated structures of (b) wild-type and (c) D234N GtACR1s. Chovancova et al., 2012 The red arrow indicates the decrease in the channel space (radius) owing to the approach of Glu68. (d) Channel radii along the channel in wild-type (dotted black line) and D234N (solid red line) GtACR1s. The red open circle indicates the constriction created by reoriented Glu68 in D234N GtACR1.
Figure 5—figure supplement 1
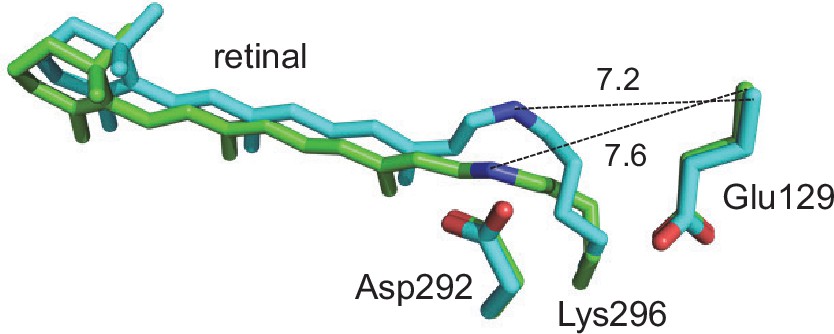
Retinal Schiff base, Glu129 (Glu68 in GtACR1), and Asp292 (Asp234 in GtACR1) in the structures of the ground state (green sticks, PDB code 7C86; Oda et al., 2021) and 4 ms after light irradiation (cyan sticks, PDB code 7E6X; Oda et al., 2021) of cation channelrhodopsin C1C2.
Values indicate the distances between the N atom of the Schiff base and the Cα atom of Glu129 (Å).
Figure 6
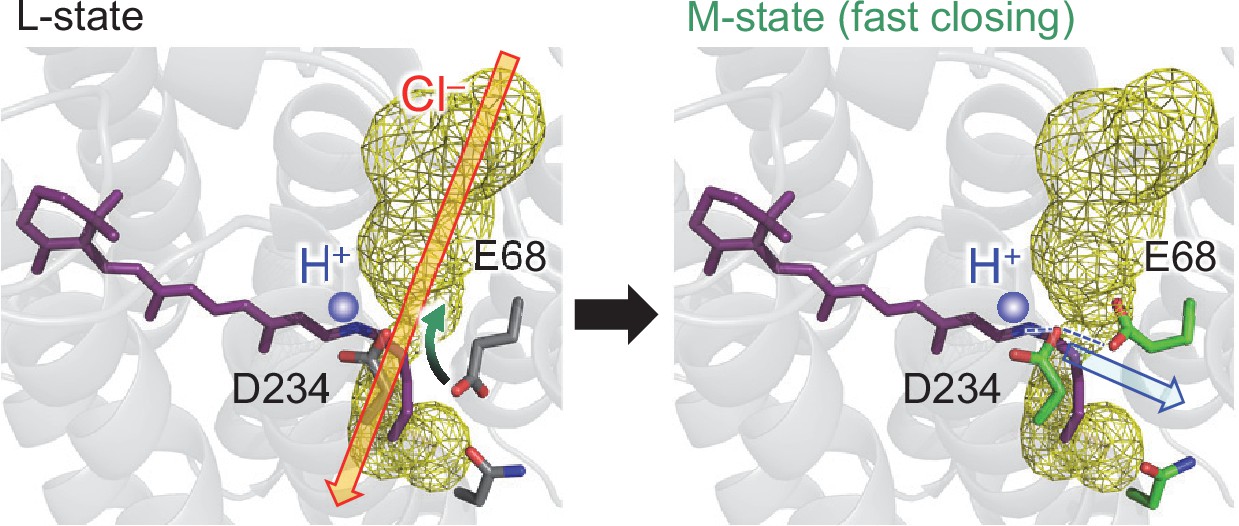
Formation of the proton transfer pathway and disconnection of the anion conduction channel during the L- to M-state transition.
The channel is open (red open arrow) in the anion conducting L-state. The reorientation of the Glu68 side chain (black and green curved arrow) leads to the formation of the H-bond network that proceeds from the Schiff base to Glu68 via Asp234 (blue dotted lines) and the closing of the channel bottle neck (fast channel closing). Thus, the release of the proton from the Schiff base toward Glu68 occurs in the M-state (blue open arrow).
Tables
Table 1
Protonation states of Glu68 and Asp234.
Changes in the protonation states are in bold. – indicates not applicable.
| Fixed state during MD* | Calculated state after MD† | ||
|---|---|---|---|
| Wild-type (1) | E68 | Protonated | Protonated |
| D234 | Deprotonated | Deprotonated | |
| Wild-type (2) | E68 | Protonated | Protonated |
| D234 | Protonated | Deprotonated | |
| Wild-type (3) | E68 | Deprotonated | Protonated |
| D234 | Protonated | Deprotonated | |
| E68D (1) | D68 | Protonated | Protonated |
| D234 | Deprotonated | Deprotonated | |
| E68D (2) | D68 | Deprotonated | Protonated |
| D234 | Deprotonated | Deprotonated | |
| E68Q (1) | Q68 | – | – |
| D234 | Deprotonated | Deprotonated | |
| E68Q (2) | Q68 | – | – |
| D234 | Protonated | Deprotonated | |
| D234E (1) | E68 | Protonated | Protonated |
| E234 | Deprotonated | Deprotonated | |
| D234E (2) | E68 | Protonated | Protonated ‡ |
| E234 | Protonated | Protonated ‡ | |
| D234N (1) | E68 | Deprotonated | Deprotonated |
| N234 | – | – | |
| D234N (2) | E68 | Protonated | Protonated § |
| N234 | – | – | |
| E68Q/D234N | Q68 | – | – |
| N234 | – | – |
-
*
The system was equilibrated for 5 ns. 10 conformations were sampled at 0.1 ns intervals during the 1 ns production run.
-
†
Protonation patterns obtained using the MD-generated conformations.
-
‡
Although we were able to obtain the MD-generated conformation with protonated Glu68 and protonated Glu234, which was confirmed in the calculated protonation pattern, the conformation cannot reproduce the experimentally measured absorption wavelength (Supplementary file 1D) and is unlikely relevant to the D234E GtACR1.
-
§
Although we were able to obtain the MD-generated conformation with protonated Glu68, which was confirmed in the calculated protonation pattern, the protonation state is not consistent with deprotonated Glu68 suggested in FTIR studies by Dreier et al., 2021.
Table 2
Table 3
pKa for Glu68 in GtACR1.
The corresponding sites of BR are shown in the same line. – indicates not applicable.
| GtACR1 | BR | |||
|---|---|---|---|---|
| pKa* | Glu68 | 12 | Ala53 | – |
| Contribution | ||||
| Schiff base | −6.6 | Schiff base | – | |
| Arg94 | −1.3 | Arg82 | – | |
| Asn239 | 2.5 | Val217 | – | |
| Asp234 | 4.9 | Asp212 | – |
-
*
See Saito et al., 2012.
Table 4
Calculated and experimentally measured absorption wavelengths λmax (nm).
Δλ (nm) denotes the shift with respect to the wild-type GtACR1.
| Calculated* | Measured | |||
|---|---|---|---|---|
| λmax | Δλ | λmax | Δλ | |
| Wild-type | 505(493) | 0(0) | 513 | 0 |
| E68D | 499(483) | −6(−10) | 493 | −20 |
| E68Q | 505(493) | 0(0) | 515 | 2 |
| D234E | 499(481) | −6(−12) | 503 | −10 |
| D234N(deprotonated E68) | 507(487) | 2(−6) | 510 | −3 |
| D234N(protonated E68) | 534(517) | 29(24) | ||
| E68Q/D234N | 538(522) | 33(29) | 520 | 7 |
| E68Q/D234N(with Cl–)† | 509(491) | 4(−2) | ||
-
*
Average values of 10 MD-generated structures, which are finally QM/MM-optimized. Absorption wavelengths were calculated using Equation 1 with ΔEHOMO-LUMO. Absorption wavelengths calculated using Equation 2 with ETD-DFT are shown in parenthesis.
-
†
With Cl– binding at the Schiff base moiety (see below).
Table 5
Components that contribute to the absorption wavelength in the wild-type and D234N GtACR1s (nm).
The contributions were analyzed using a single MD-generated structure whose absorption wavelength is closest to the average value of the 10 MD-generated structures.
| Wild-type | D234N | |
|---|---|---|
| Glu68 | 0 | −20 |
| Asp234 | −28 | |
| Asn234 | 0 | |
| H2O | 0 | −7 |
| Total | −28 | −27 |
Additional files
-
Supplementary file 1
Calculated pKa, absorption wavelength, and binding energy values.
(A) Calculated pKa values of Glu68 and Asp234 (PDB codes 6EDQ [Li et al., 2019] and 6CSM [Kim et al., 2018]). (B) Calculated pKa values of Glu68 and Asp234 in wild-type GtACR1 using the 10 MD-generated conformations with deprotonated Glu68/protonated Asp234. (C) Absorption wavelengths of 10 MD-generated structures calculated using Equation 1 with ΔEHOMO-LUMO (λHOMO-LUMO) and Equation 2 with ETD-DFT (λTD-DFT) (nm). (D) Calculated absorption wavelengths of wild-type GtACR1 with protonated Asp234 and D234E GtACR1 with protonated Glu234 (nm). The absorption wavelengths were calculated using Equation 1 with ΔEHOMO-LUMO (λHOMO-LUMO) and Equation 2 with ETD-DFT (λTD-DFT). Δλ234 (nm) denotes the electrostatic contributions of protonated Asp234 in wild-type GtACR1 and protonated Glu234 in D234E GtACR1 to the absorption wavelengths. (E) Binding energies between Cl– and the surrounding environments in Cl–-binding wild-type and E68Q/D234N mutant structures (kcal/mol). The binding energies were calculated based on the QM/MM-optimized and MD-based structures, using the MOE program (Molecular Operating Environment (MOE), 2021). (F) Calculated pKa values of Glu68 and Asp234 in wild-type GtACR1 using the 10 MD-generated conformations with protonated Glu68/deprotonated Asp234. (G) Absorption wavelengths of 10 MD-generated wild-type GtACR1 structures calculated using Equation 1 with ΔEHOMO-LUMO (λHOMO-LUMO) and Equation 2 with ETD-DFT (λTD-DFT) (nm).
- https://cdn.elifesciences.org/articles/72264/elife-72264-supp1-v1.docx
-
Transparent reporting form
- https://cdn.elifesciences.org/articles/72264/elife-72264-transrepform1-v1.docx
-
Source data 1
Atomic coordinates of MD-generated/QM/MM-optimized wild-type and mutant GtACR1 structures.
- https://cdn.elifesciences.org/articles/72264/elife-72264-supp2-v1.zip
Download links
A two-part list of links to download the article, or parts of the article, in various formats.
Downloads (link to download the article as PDF)
Open citations (links to open the citations from this article in various online reference manager services)
Cite this article (links to download the citations from this article in formats compatible with various reference manager tools)
Proton transfer pathway in anion channelrhodopsin-1
eLife 10:e72264.
https://doi.org/10.7554/eLife.72264


