Rescue of behavioral and electrophysiological phenotypes in a Pitt-Hopkins syndrome mouse model by genetic restoration of Tcf4 expression
- Department of Cell Biology and Physiology, University of North Carolina at Chapel Hill, United States
- Neuroscience Center, University of North Carolina at Chapel Hill, United States
- Department of Biology, University of North Carolina at Chapel Hill, United States
- Department of Chemistry and Biochemistry, Bates College, United States
- HHMI Janelia Research Campus, United States
- Department of Genetics, University of North Carolina at Chapel Hill, United States
- Carolina Institute for Developmental Disabilities, University of North Carolina at Chapel Hil, United States
Figures
Figure 1 with 1 supplement

Embryonic, pan-cellular reinstatement of Tcf4 fully rescues behavioral deficits in a mouse model of Pitt-Hopkins syndrome.
(A) Schematic depicting a conditional Pitt-Hopkins syndrome mouse model in which expression of the bHLH region of Tcf4 is prevented by the insertion of a loxP-P2A-GFP-STOP-loxP cassette into intron 17 of Tcf4 (Tcf4STOP/+). Adenovirus splicing acceptor is shown by the blue box. Crossing Tcf4STOP/+ mice with Actb-Cre+/– transgenic mice can produce mice with embryonic pan-cellular reinstatement of Tcf4 expression (Tcf4STOP/+::Actb-Cre). (B) Relative Tcf4 mRNA expression in embryonic brain lysates from Tcf4+/+, Tcf4STOP/+, and Tcf4STOP/+::Actb-Cre. The primers were designed to detect Tcf4 exon 18. (C) Representative Western blot for TCF4 and β-tubulin loading control protein and quantification of relative intensity of TCF4 protein in embryonic brain lysates from Tcf4+/+, Tcf4STOP/+, and Tcf4STOP/+::Actb-Cre mice. The data were analyzed by one-way ANOVA followed by Bonferroni’s post hoc. (D) Left panel: Heatmaps indicate time spent in proximity to one object located in the familiar position and the other object relocated to the novel position. Right panel: Percent time interacting with the novel location object (Tcf4+/+: n = 36, Tcf4STOP/+: n = 22, Tcf4STOP/+::Actb-Cre: n = 15). (E) Open field data. Left panel: Distance traveled per 5 min. Center panel: Total distance traveled for the 30 min testing period. Right panel: Percent time spent in the center zone (Tcf4+/+: n = 30, Tcf4STOP/+: n = 23, Tcf4STOP/+::Actb-Cre: n = 10). (F) Nest building data. Left panel: Representative images of nests built by Tcf4STOP/+ and Tcf4STOP/+::Actb-Cre mice. Right panel: Percentage of nest material used during the 4 day nest building period (Tcf4+/+: n = 13, Tcf4STOP/+: n = 10, Tcf4STOP/+::Actb-Cre: n = 5). (G) Elevated plus maze data. Left panel: Heatmaps reveal relative time spent on the elevated plus maze. Right panels: Percent time spent in the closed and open arms, percent of entries made into the closed and open arms, and percent time spent in the center zone (Tcf4+/+: n = 30, Tcf4STOP/+: n = 23, Tcf4STOP/+::Actb-Cre: n = 10). Values are means ± SEM. *p < 0.05, **p < 0.005, ***p < 0.001, ****p < 0.0001.
-
Figure 1—source data 1
Numerical data shown in Figure 1.
- https://cdn.elifesciences.org/articles/72290/elife-72290-fig1-data1-v2.zip
-
Figure 1—source data 2
Numerical data shown in Figure 2.
- https://cdn.elifesciences.org/articles/72290/elife-72290-fig1-data2-v2.xlsx
Figure 1—figure supplement 1
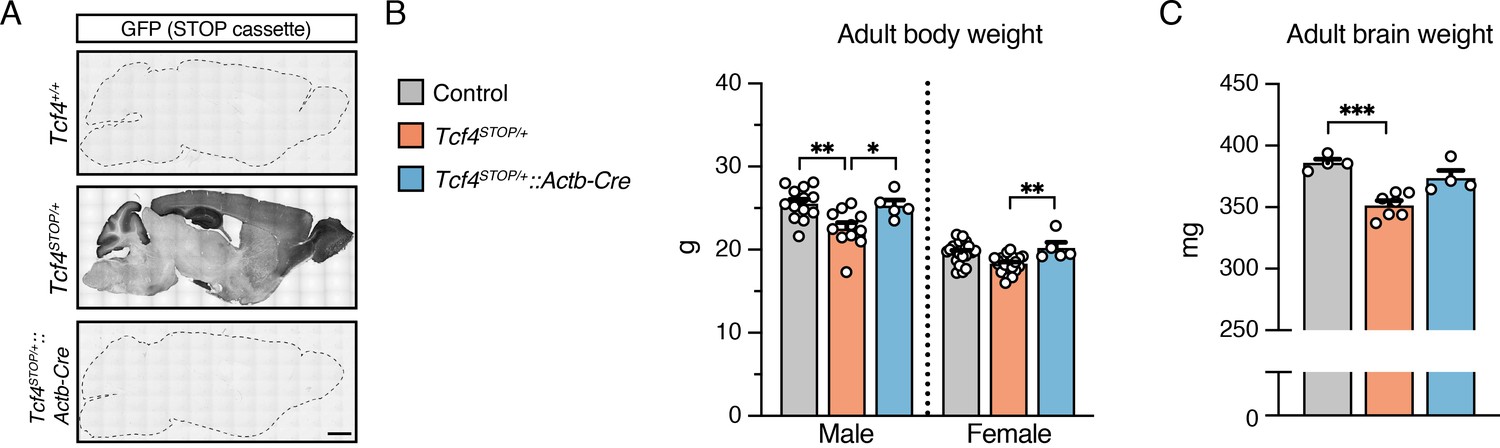
Body and brain weight analysis.
(A) DAB immunostaining of GFP (indicating presence of the STOP cassette) in sagittal brain sections of adult Tcf4+/+, Tcf4STOP/+, and Tcf4STOP/+::Actb-Cre mice. Scale bar = 1 mm. (B) Adult male (Tcf4+/+: n = 13, Tcf4STOP/+: n = 11, Tcf4STOP/+::Actb-Cre: n = 5) and female (Tcf4+/+: n = 22, Tcf4STOP/+: n = 21, Tcf4STOP/+::Actb-Cre: n = 5) body weights of each genotypic group. (C) Adult brain weight measured from dissected brains (Tcf4+/+: n = 4; 1 male; 3 females, Tcf4STOP/+: n = 7; 4 males; 3 females, Tcf4STOP/+::Actb-Cre: n = 4; 1 male; 3 females). Values are means ± SEM. *p < 0.05, **p < 0.005, ***p < 0.001.
Figure 2 with 3 supplements
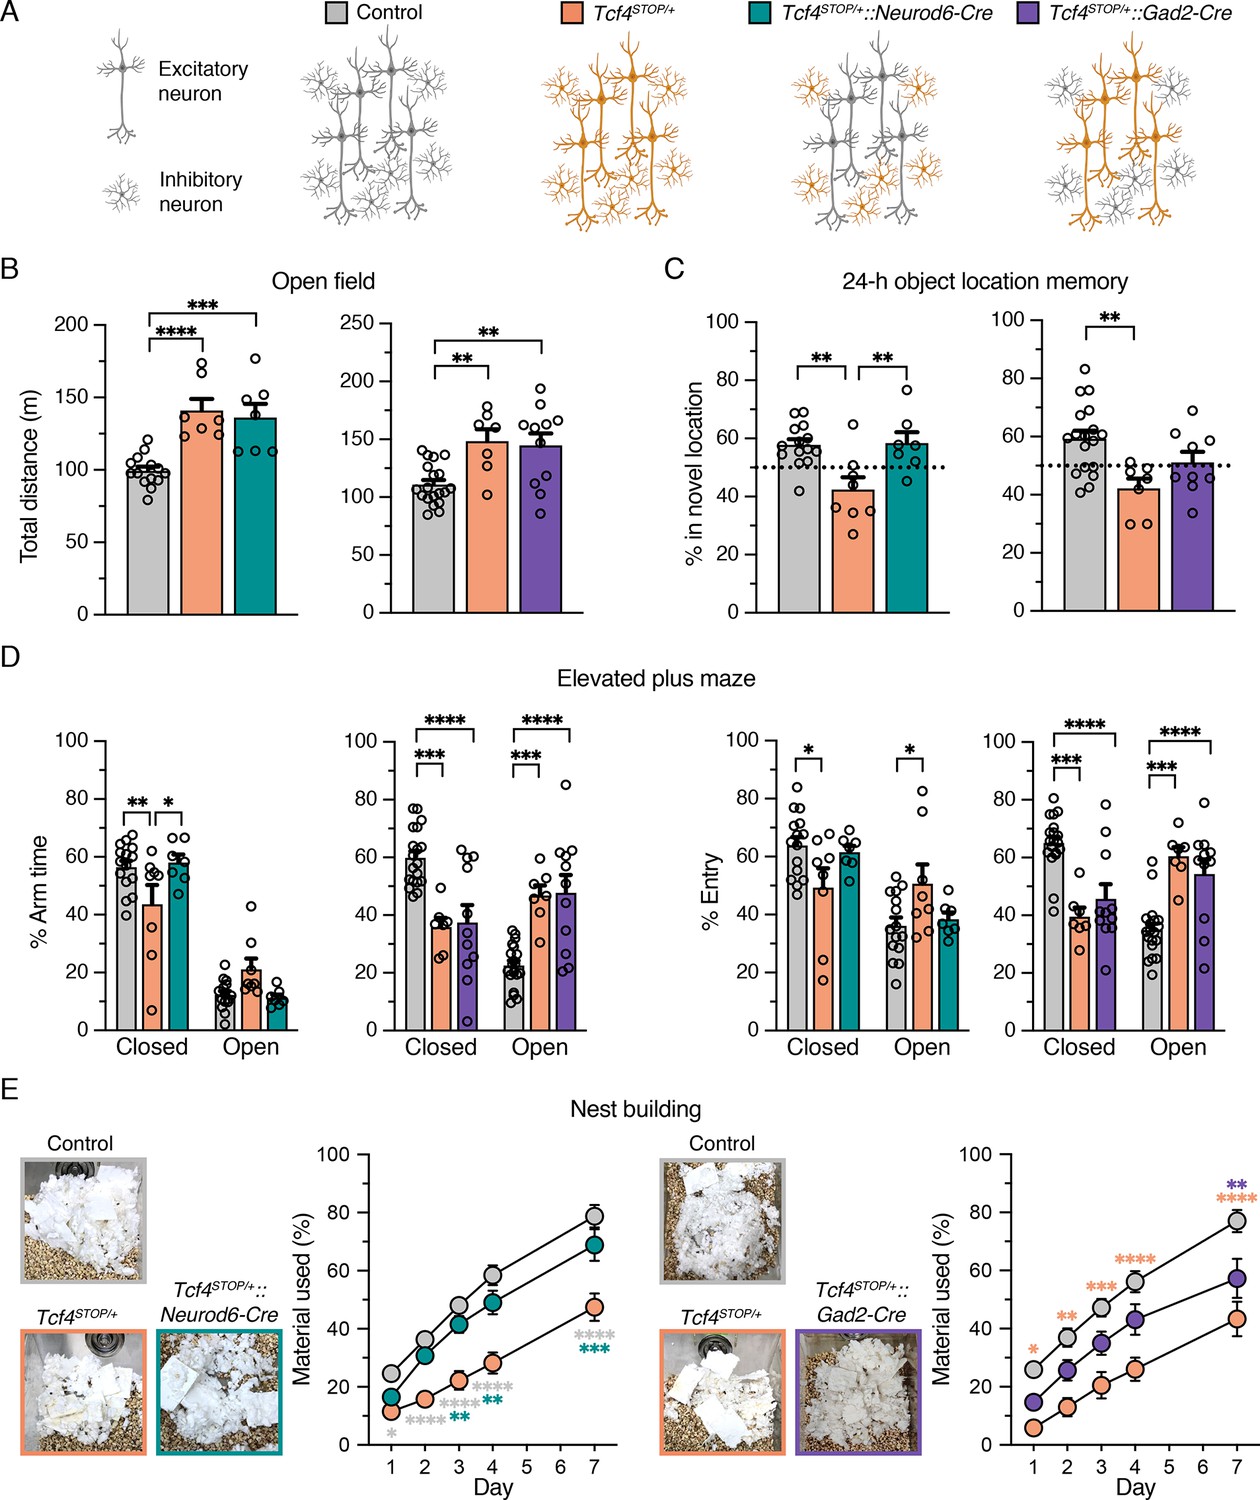
Embryonic reinstatement of Tcf4 expression in glutamatergic or GABAergic neurons rescues selective behavioral deficits in a mouse model of PTHS.
(A) Schematic representation of cell type-specific Tcf4 reinstatement strategy. Tcf4STOP/+::Neurod6-Cre or Tcf4STOP/+::Gad2-Cre mice normalize Tcf4 expression in glutamatergic or GABAergic neurons, respectively, while controls (Tcf4+/+, Neurod6-Cre+/–, or Gad2-Cre+/– mice) have normal Tcf4 expression. (B) Total distance traveled for the 30 min testing period in the open field (Left panel: Control: n = 14, Tcf4STOP/+: n = 7, Tcf4STOP/+::Neurod6-Cre: n = 7, and right panel: Control: n = 19, Tcf4STOP/+: n = 7, Tcf4STOP/+::Gad2-Cre: n = 11). (C) Percent time interacting with the novel location object (Left panel: Control: n = 14, Tcf4STOP/+: n = 8, Tcf4STOP/+::Neurod6-Cre: n = 7, and right panel: Control: n = 18, Tcf4STOP/+: n = 7, Tcf4STOP/+::Gad2-Cre: n = 9). (D) Percent time spent in closed and open arms and percent entries made into the closed and open arms (Left panel: Control: n = 15, Tcf4STOP/+: n = 8, Tcf4STOP/+::Neurod6-Cre: n = 7, and right panel: Control: n = 19, Tcf4STOP/+: n = 7, Tcf4STOP/+::Gad2-Cre: n = 11). (E) Representative images of nests built by mice and percentage of nest material used during the 7 day nest building period (Left panel: Control: n = 15, Tcf4STOP/+: n = 8, Tcf4STOP/+::Neurod6-Cre: n = 7, and right panel: Control: n = 19, Tcf4STOP/+: n = 7, Tcf4STOP/+::Gad2-Cre: n = 11). Values are means ± SEM. *p < 0.05, **p < 0.005, ***p < 0.001, ****p < 0.0001.
-
Figure 2—source data 1
Numerical data shown in Figure 2.
- https://cdn.elifesciences.org/articles/72290/elife-72290-fig2-data1-v2.xlsx
Figure 2—figure supplement 1
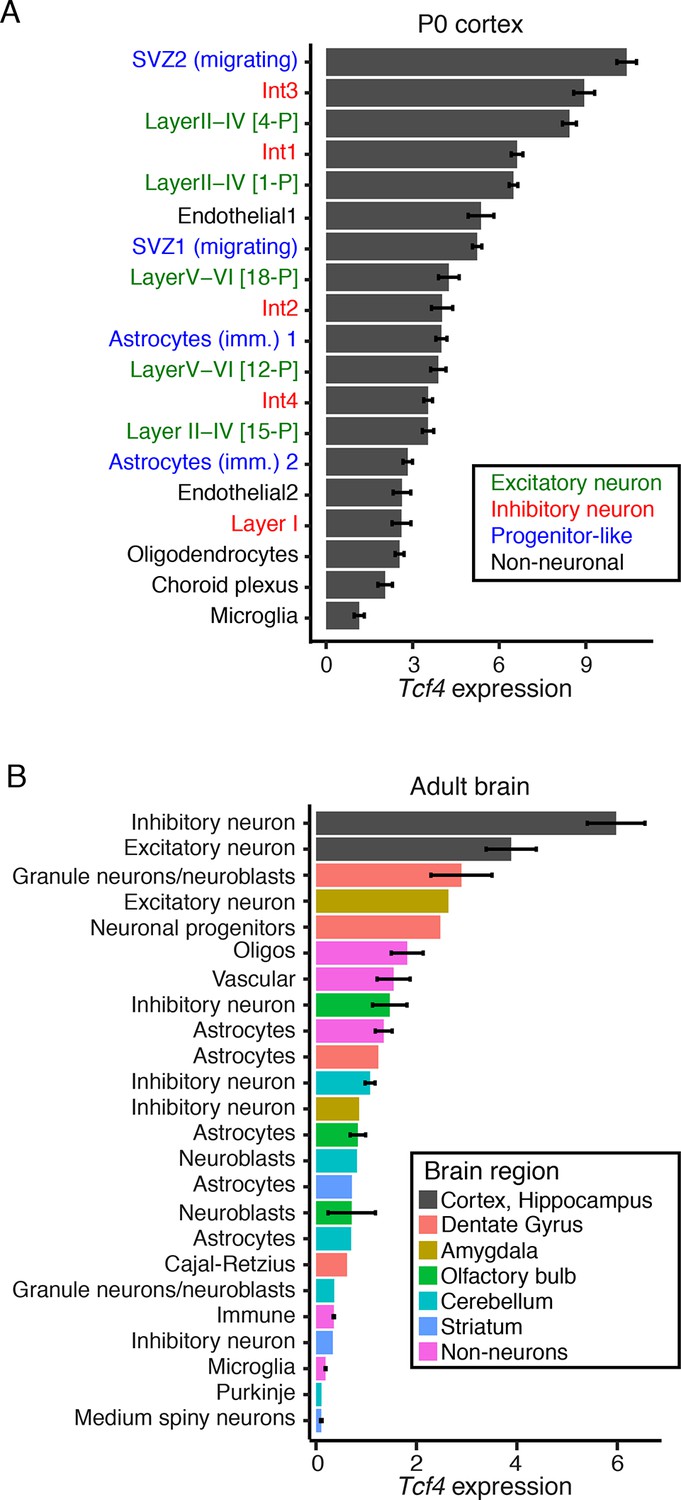
Single-cell RNA sequencing reveals cell type-specific Tcf4 expression in the neonatal and adult mouse brain.
(A) Average expression of Tcf4 in 19 cell types identified in the P0 cortex data analyzed from reference (Loo et al., 2019). Cell type names are colored by principal cell classifications. (B) Average expression of Tcf4 in cell types identified in the adult mouse brain data analyzed from reference (Zeisel et al., 2015). Bars are colored by brain region, and clusters were aggregated into principal cell types. Values are means ± SEM.
Figure 2—figure supplement 2
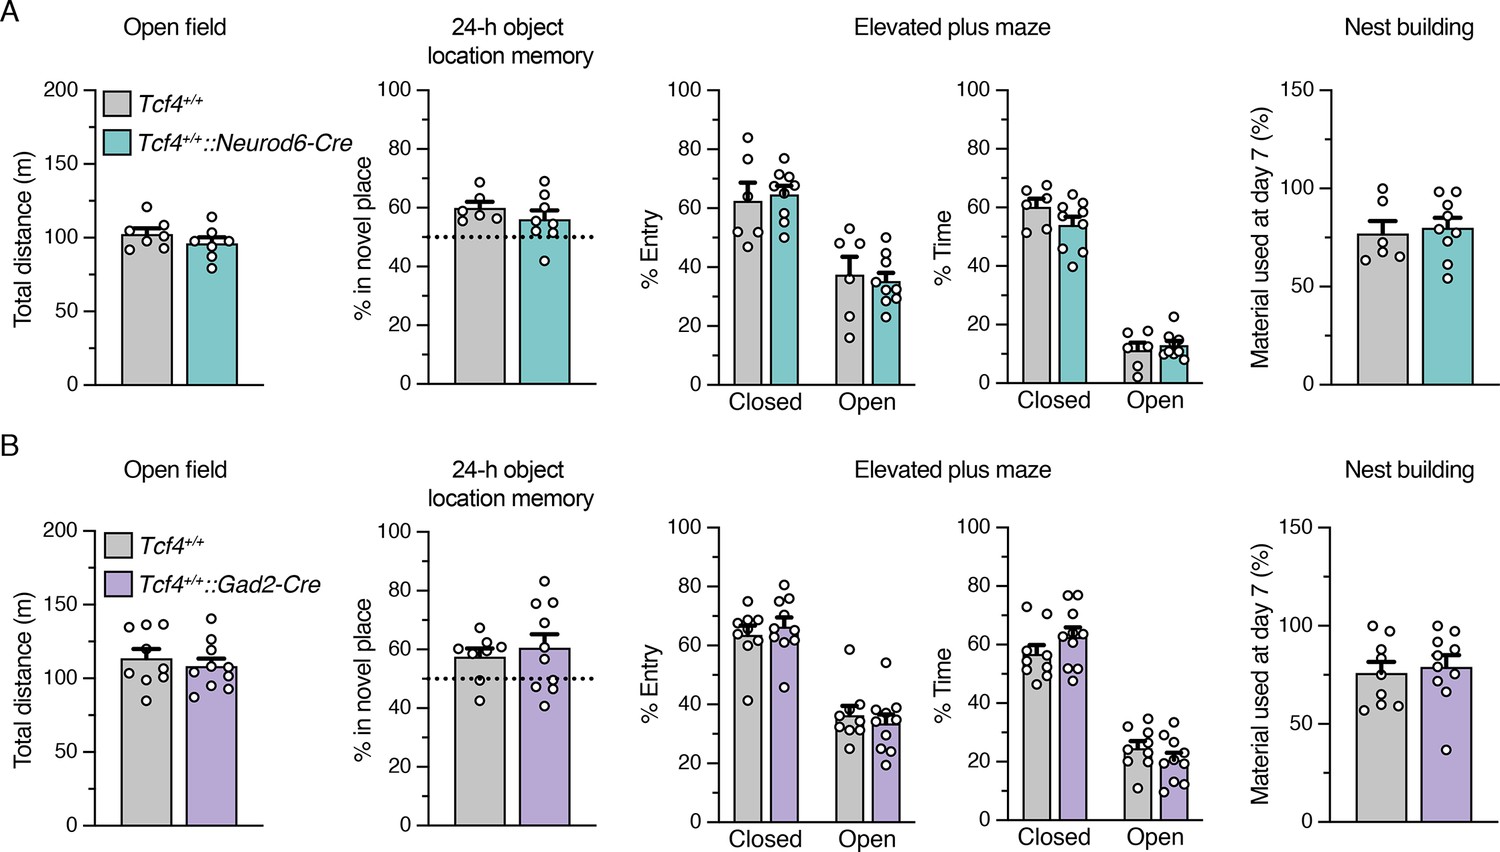
Behavioral phenotypes are not affected in Neurod6-Cre +/- and Gad2-Cre +/- mice.
(A–B) Behavioral performance of Cre transgenic mice (Tcf4+/+::Neurod6-Cre and Tcf4+/+::Gad2-Cre) was statistically indistinguishable from wildtype mice (Tcf4+/+) in open field (A: Tcf4+/+: n = 7, Tcf4+/+::Neurod6-Cre: n = 7, B: Tcf4+/+: n = 9, Tcf4+/+::Gad2-Cre: n = 10), object location memory (A: Tcf4+/+: n = 6, Tcf4+/+::Neurod6-Cre: n = 8, B: Tcf4+/+: n = 8, Tcf4+/+::Gad2-Cre: n = 10), elevated plus maze (A: Tcf4+/+: n = 6, Tcf4+/+::Neurod6-Cre: n = 9, B: Tcf4+/+: n = 9, Tcf4+/+::Gad2-Cre: n = 10), and nest building assay (A: Tcf4+/+: n = 6, Tcf4+/+::Neurod6-Cre: n = 9, B: Tcf4+/+: n = 9, Tcf4+/+::Gad2-Cre: n = 10). Values are means ± SEM.
Figure 2—figure supplement 3
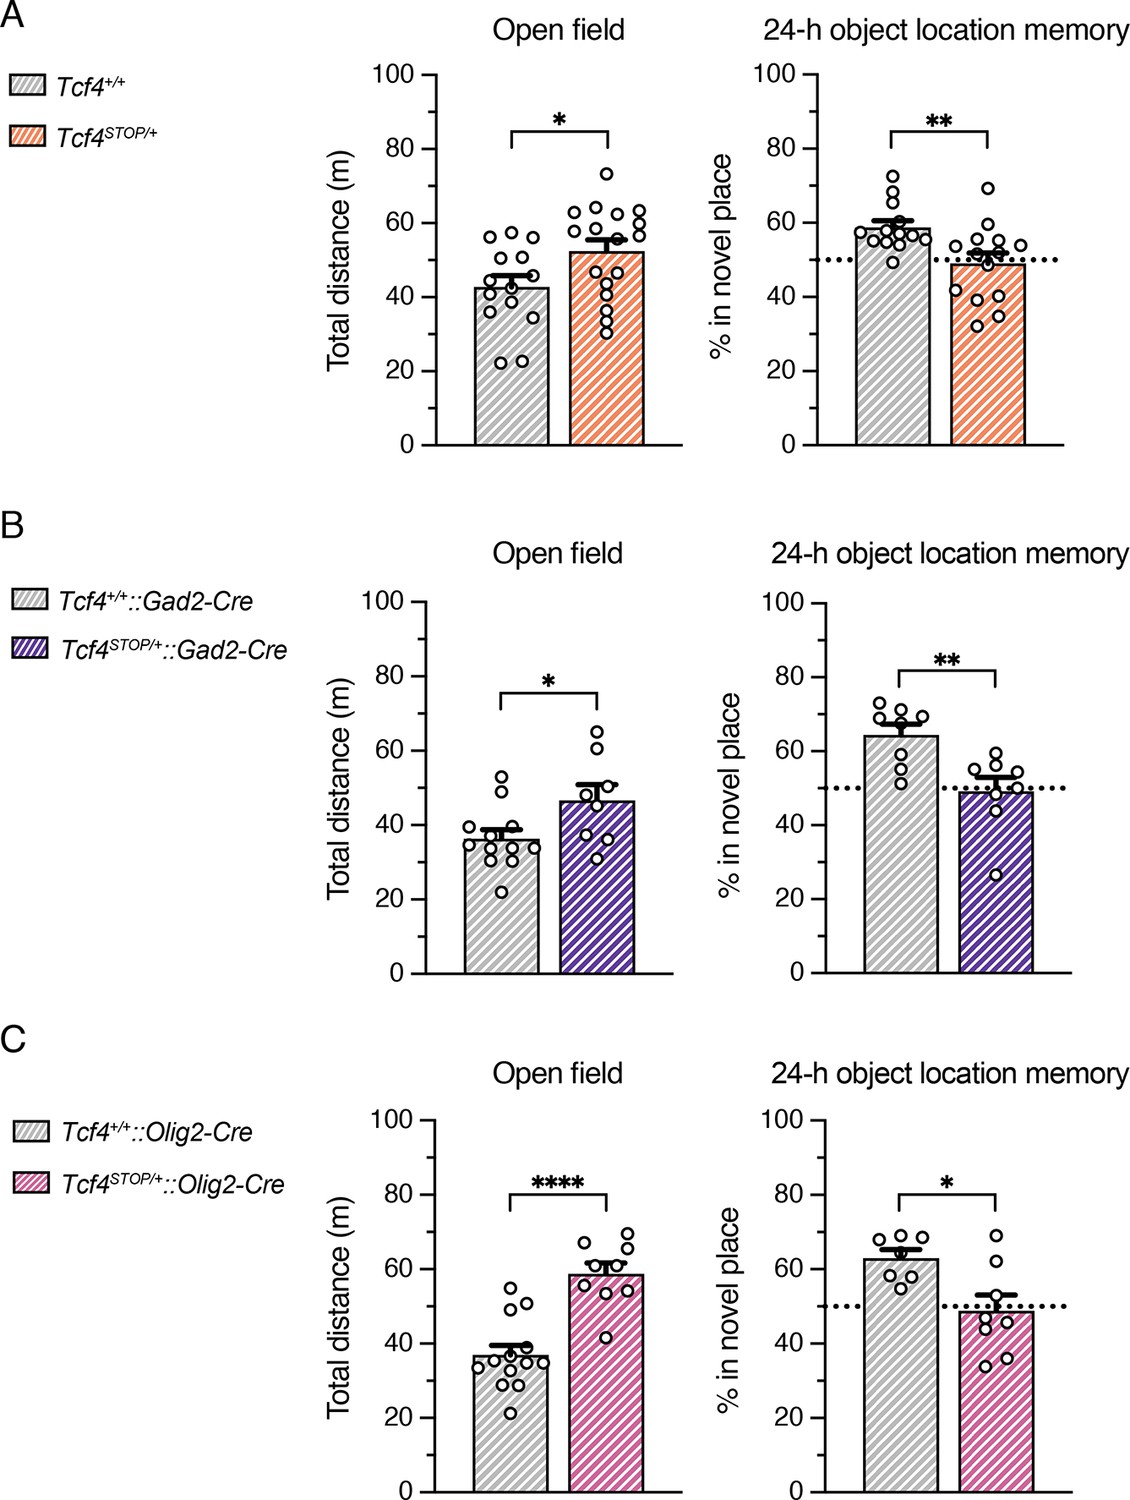
Behavioral outcomes of Tcf4STOP/+::Gad2-Cre and Tcf4STOP/+::Olig2-Cre mice.
(A–C) Total distance traveled for the 30-min testing period (A: Tcf4+/+: n = 14, Tcf4STOP/+: n = 17, B: Tcf4+/+::Gad2-Cre: n = 12, Tcf4STOP/+::Gad2-Cre: n = 8, C: Tcf4+/+::Olig2-Cre: n = 13, Tcf4STOP/+::Olig2-Cre: n = 9) and percent time interacting with the novel location object (A: Tcf4+/+: n = 13, Tcf4STOP/+: n = 14, B: Tcf4+/+::Gad2-Cre: n = 8, Tcf4STOP/+::Gad2-Cre: n = 8, C: Tcf4+/+::Olig2-Cre: n = 7, Tcf4STOP/+::Olig2-Cre: n = 8). Behavioral outcomes of Tcf4STOP/+ and Tcf4STOP/+::Gad2-Cre mice were independently replicated. Reinstating Tcf4 from GABAergic neurons and oligodendrocytes did not rescue hyperactivity and memory function deficit. Values are means ± SEM. *p < 0.05, **p < 0.005, ****p < 0.0001. These experiments were performed at Bates College in the lab of Dr. Andrew Kennedy.
Figure 3 with 1 supplement
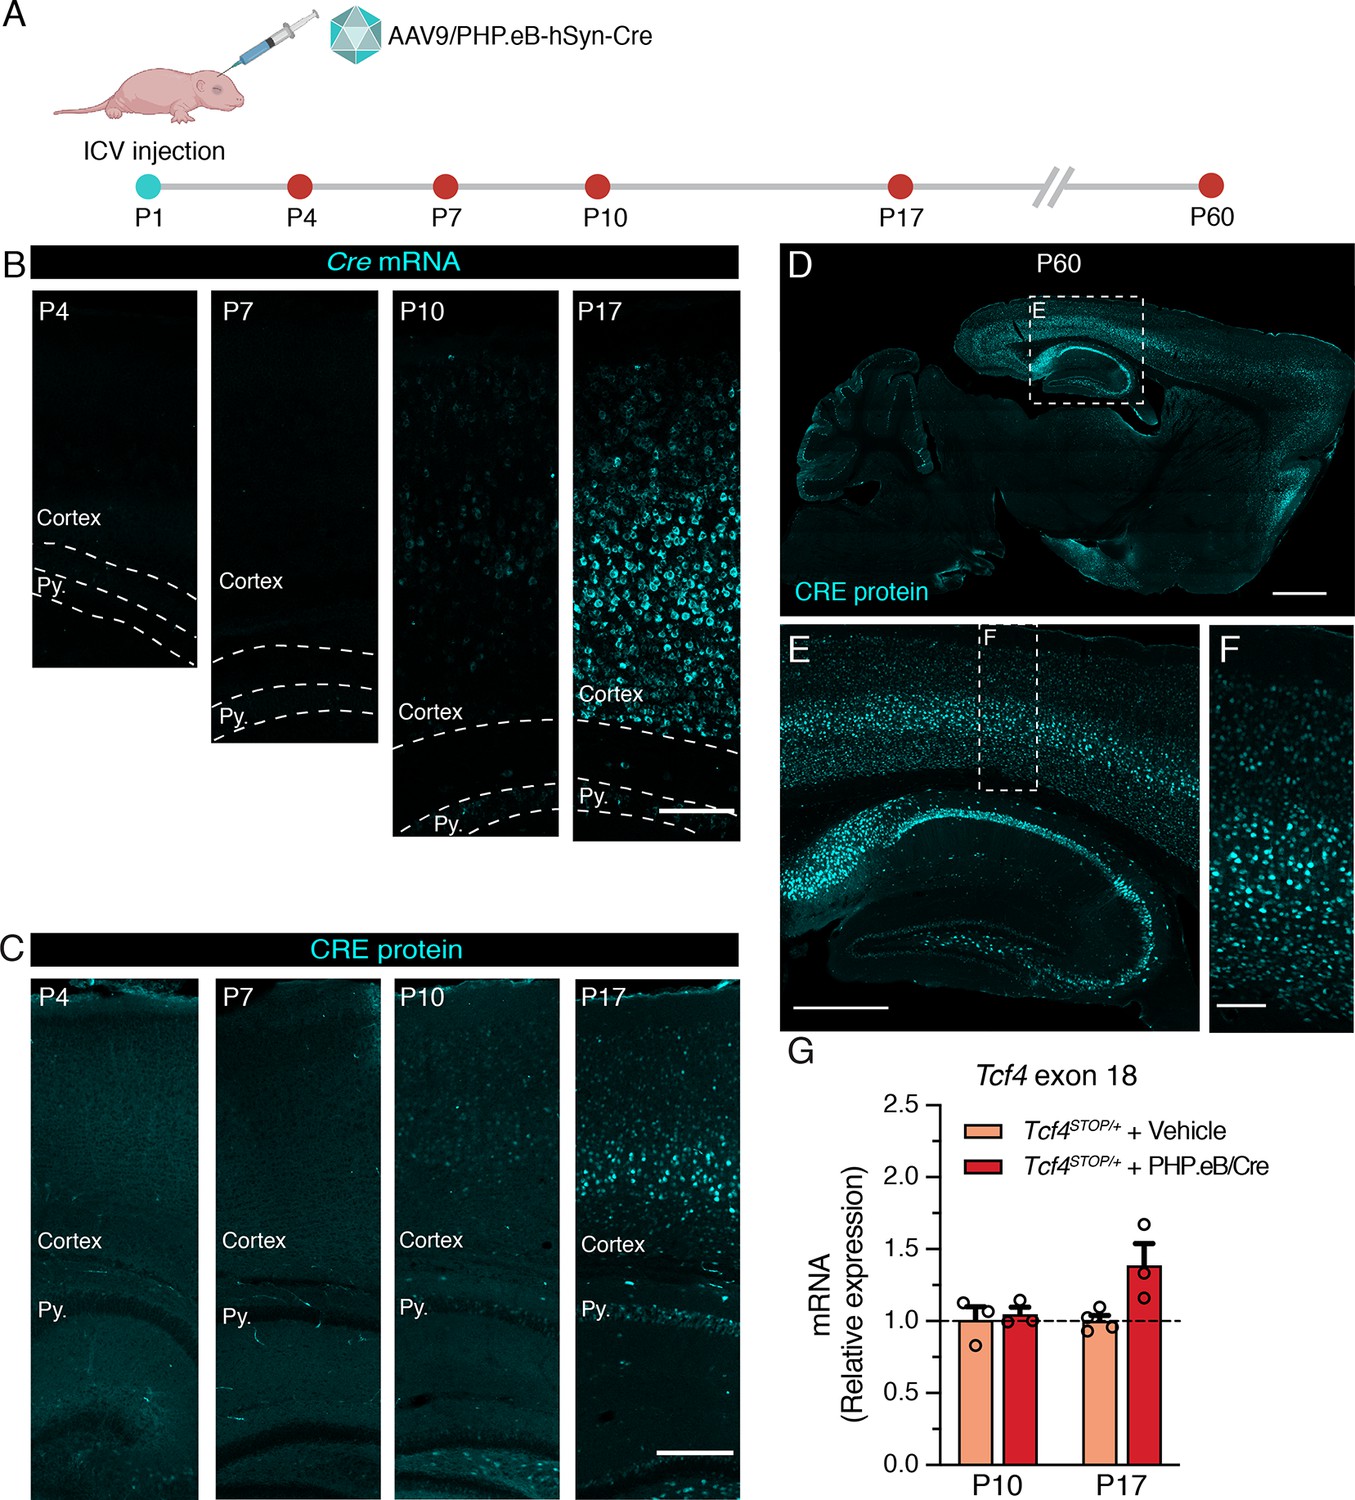
Neonatal ICV delivery of PHP.eB/Cre yields Cre expression by approximately P10-P17.
(A) A timeline of experiment to evaluate timing of Cre biodistribution following intracerebroventricular (ICV) injection of 1 µl of 3.2 × 10¹³ vg/ml AAV9/PHP.eB-hSyn-Cre to P1 mice. (B) In situ hybridization for Cre mRNA, and (C) immunofluorescence staining for CRE protein in the cortex and hippocampus of P4, P7, P10, and P17 wildtype mice neonatally treated with PHP.eB/Cre. Py. = Stratum pyramidale. Scale bars = 100 µm (B) and 250 µm (C). (D–F) CRE immunofluorescence staining in sagittal section of P60 wildtype mouse brain. Scale bars = 1 mm (D), 500 µm (E), and 100 µm (F). (G) Relative Tcf4 transcript levels detected in the brains of P10 Tcf4STOP/+ mice treated with vehicle or PHP.eB/Cre and P17 Tcf4STOP/+ mice treated with vehicle or PHP.eB/Cre.
-
Figure 3—source data 1
Numerical data shown in Figure 3.
- https://cdn.elifesciences.org/articles/72290/elife-72290-fig3-data1-v2.xlsx
Figure 3—figure supplement 1
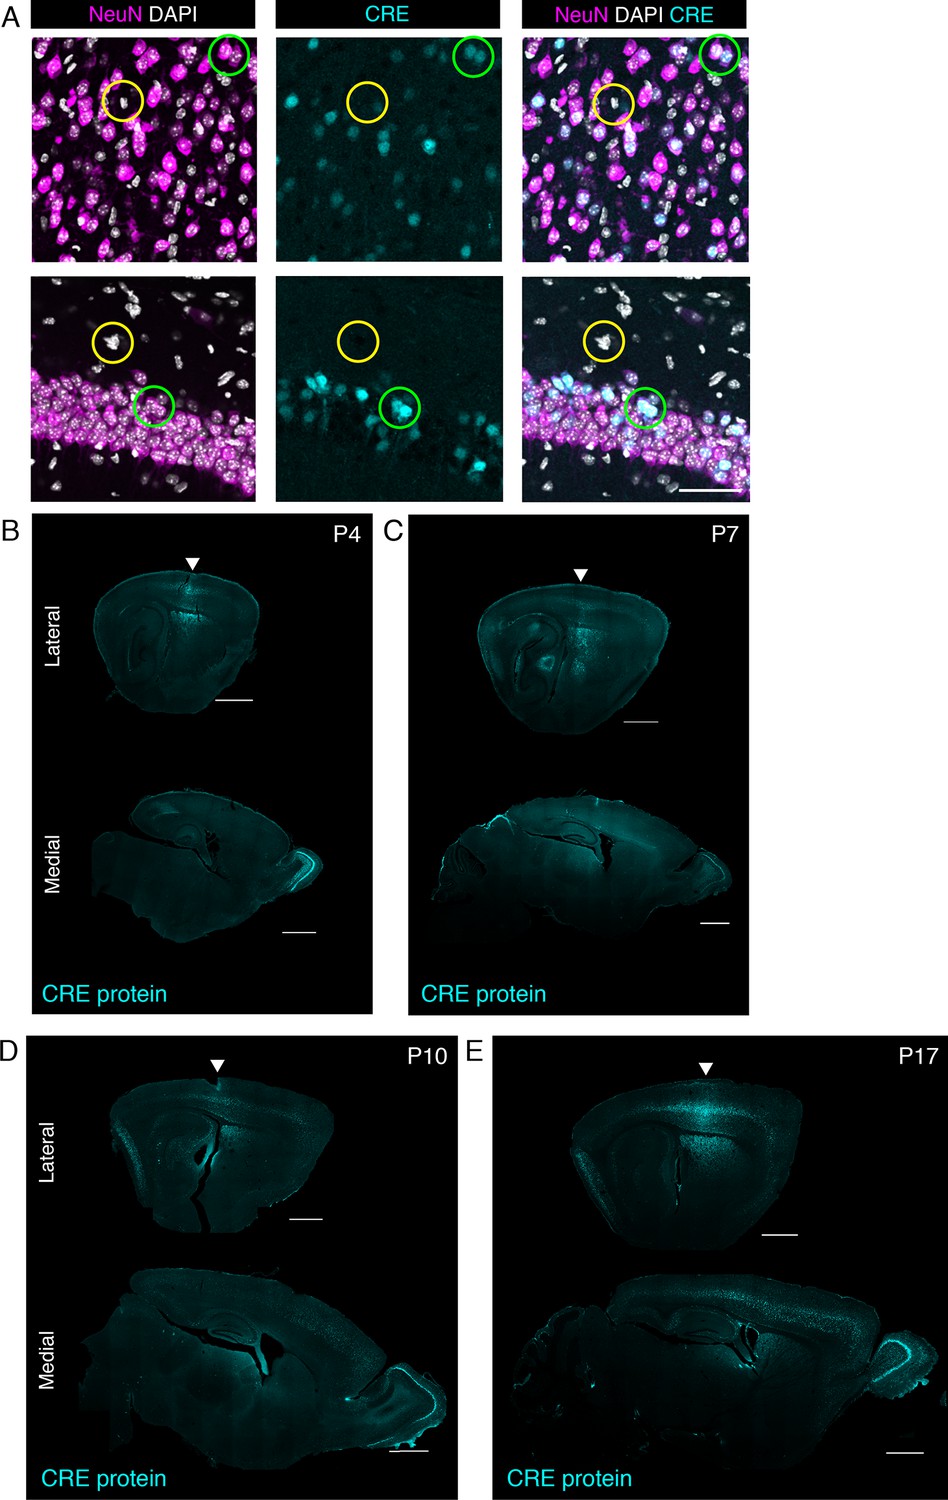
Cre immunofluorescence staining in sagittal sections of P4, P7, P10, and P17 mice.
(A) Dual immunostaining of neuronal marker (NeuN) and Cre in P17 brain of a mouse treated with PHP.eB/Cre. CRE protein was detected in NeuN-positive cells (green circle), but absent in NeuN-negative cells (yellow circle). Scale bars = 100 µm. (B–E) CRE protein spatial pattern in lateral (top row) and medial (bottom row) sagittal sections at different postnatal time points. Arrows indicate the brain area close to the injection site. Scale bars = 1 mm.
Figure 4 with 2 supplements
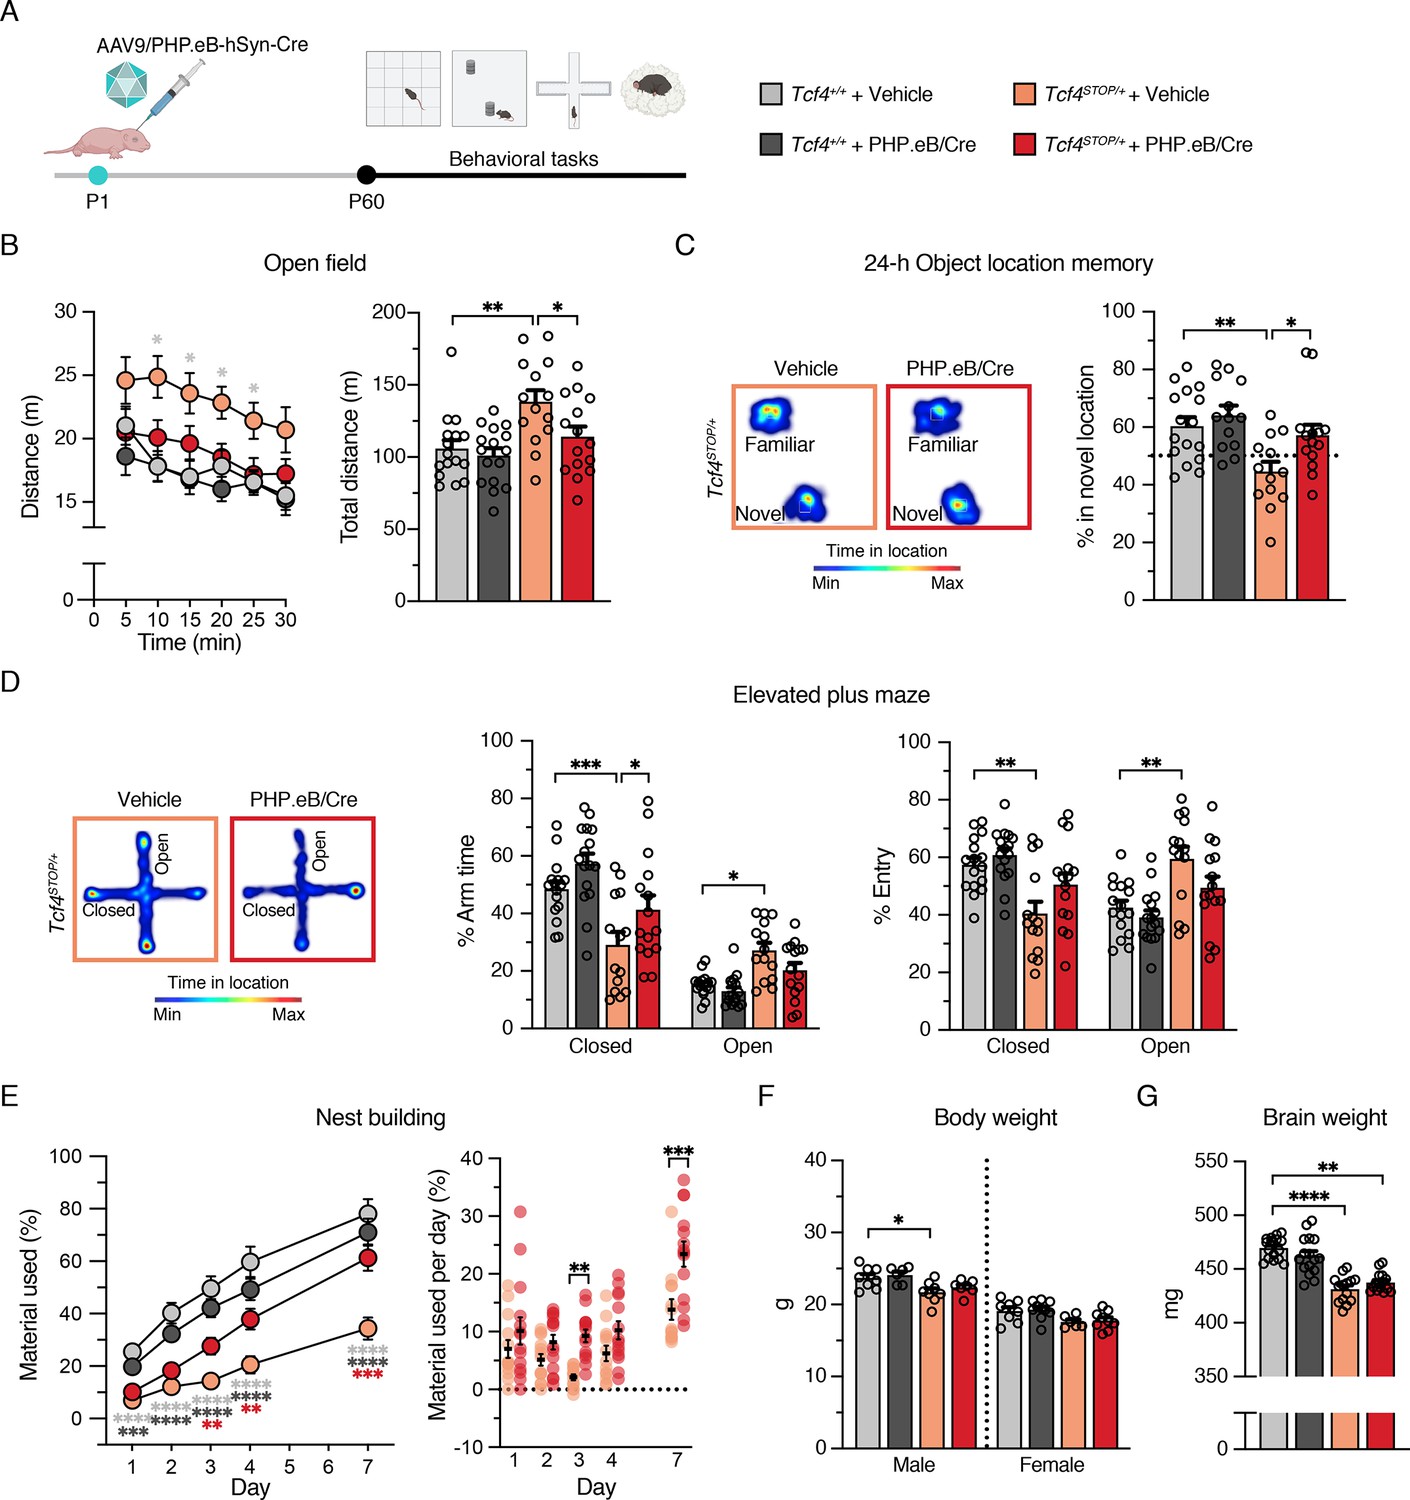
Neonatal ICV injection of PHP.eB/Cre improves behavioral phenotypes in Tcf4STOP/+ mice.
(A) Experimental timeline for evaluation of behavioral phenotypes in Tcf4+/+ and Tcf4STOP/+ mice treated with vehicle or PHP.eB/Cre. (B) Left panel: Distance traveled per 5 min. Right panel: Total distance traveled for the 30-min testing period. (C) Left panel: Heatmaps indicate time spent in proximity to one object located in the familiar position and the other object relocated to a novel position. Right panel: Percent time interacting with the novel location object. (D) Left panel: Heatmaps reveal time spent in elevated plus maze. Right panels: Percent time spent in the closed and open arms and percent entries made into the closed and open arms. (E) Left panel: Percentage of nest material used during the 7-day nest building period. Right panel: Percentage of nest material used per day. (F) Body weight analysis of P65-69 male and female mice. (G) Adult brain weight analysis. Values are means ± SEM. *p < 0.05, **p < 0.005, ***p < 0.001, ****p < 0.0001.
-
Figure 4—source data 1
Mean and SD data of each biological replicate for Figure 4.
- https://cdn.elifesciences.org/articles/72290/elife-72290-fig4-data1-v2.xlsx
-
Figure 4—source data 2
Numerical data shown in Figure 4.
- https://cdn.elifesciences.org/articles/72290/elife-72290-fig4-data2-v2.xlsx
Figure 4—figure supplement 1
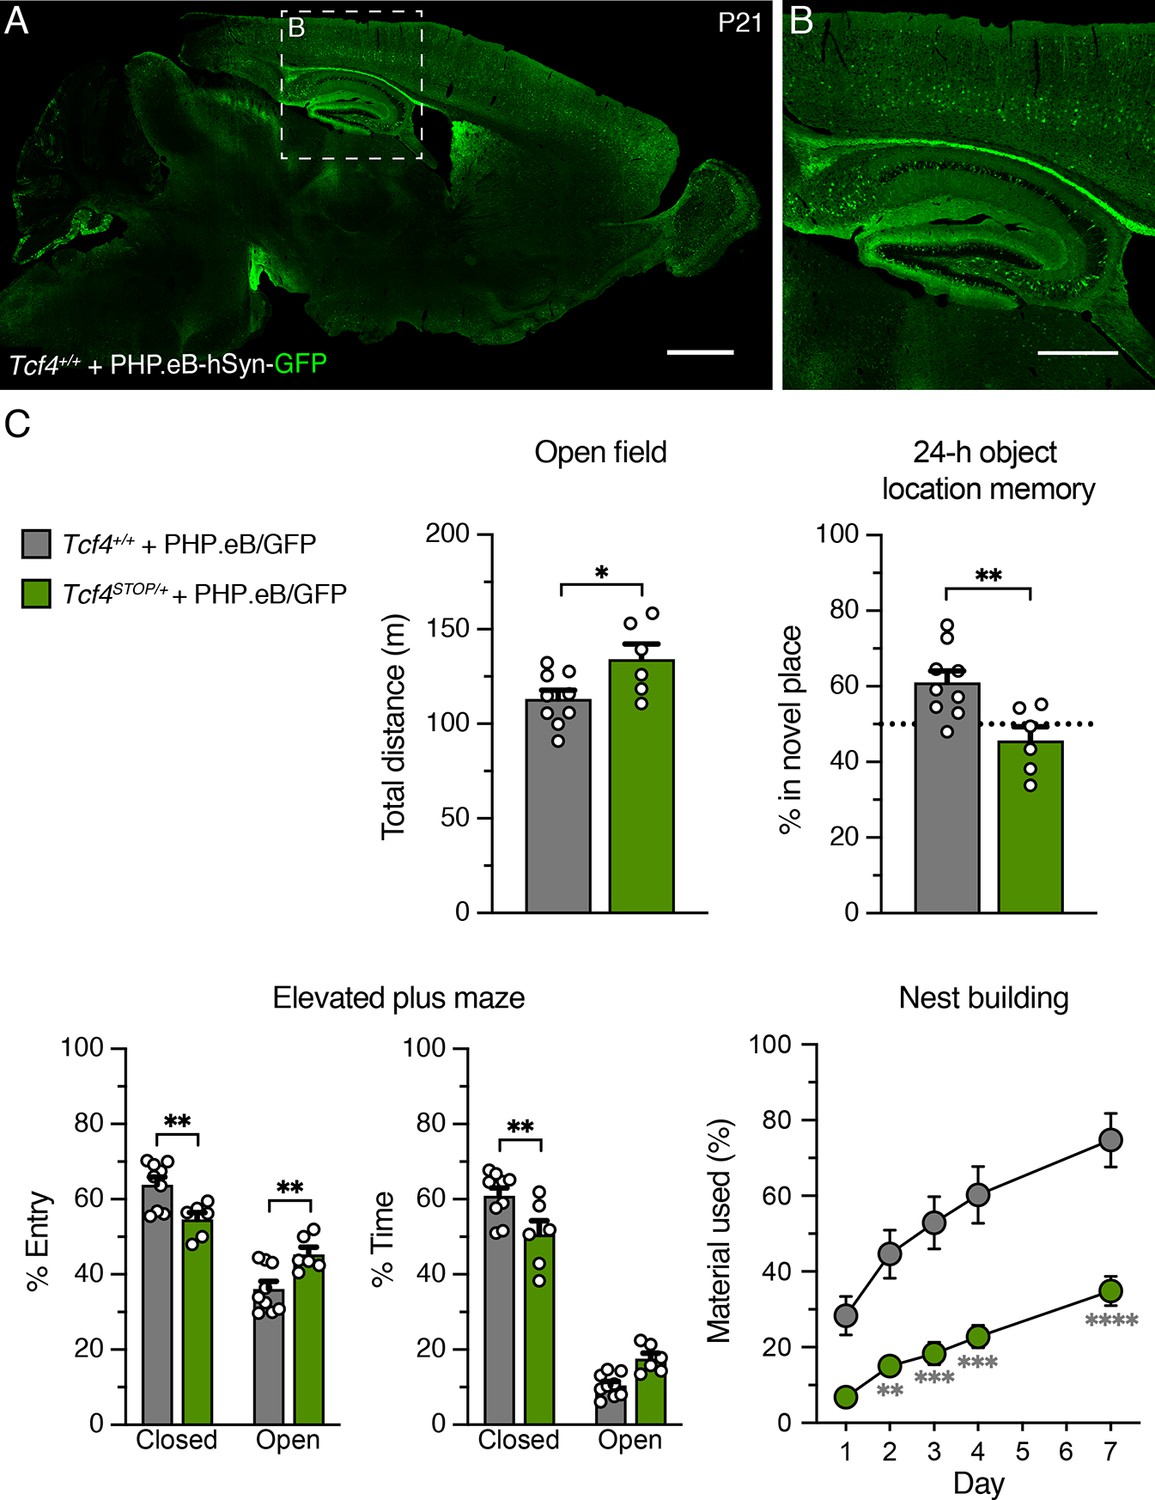
Behavioral outcomes of Tcf4+/+ and Tcf4STOP/+ treated with PHP.eB/GFP.
(A–B) Green fluorescence protein (GFP) immunofluorescence staining in sagittal section of P21 wildtype mouse brain that had ICV injection of 1 µl of 8.5 × 10¹² vg/ml PHP.eB-hSyn-GFP at P1. Scale bars = 1 mm (A) and 500 µm (B). (C) Treating Tcf4STOP/+ mice with PHP.eB/GFP did not rescue abnormal behavioral phenotypes in open field, object location memory, elevated plus maze, and nest building assay. Values are means ± SEM. *p < 0.05, **p < 0.005, ***p < 0.001, ****p < 0.0001.
Figure 4—figure supplement 2
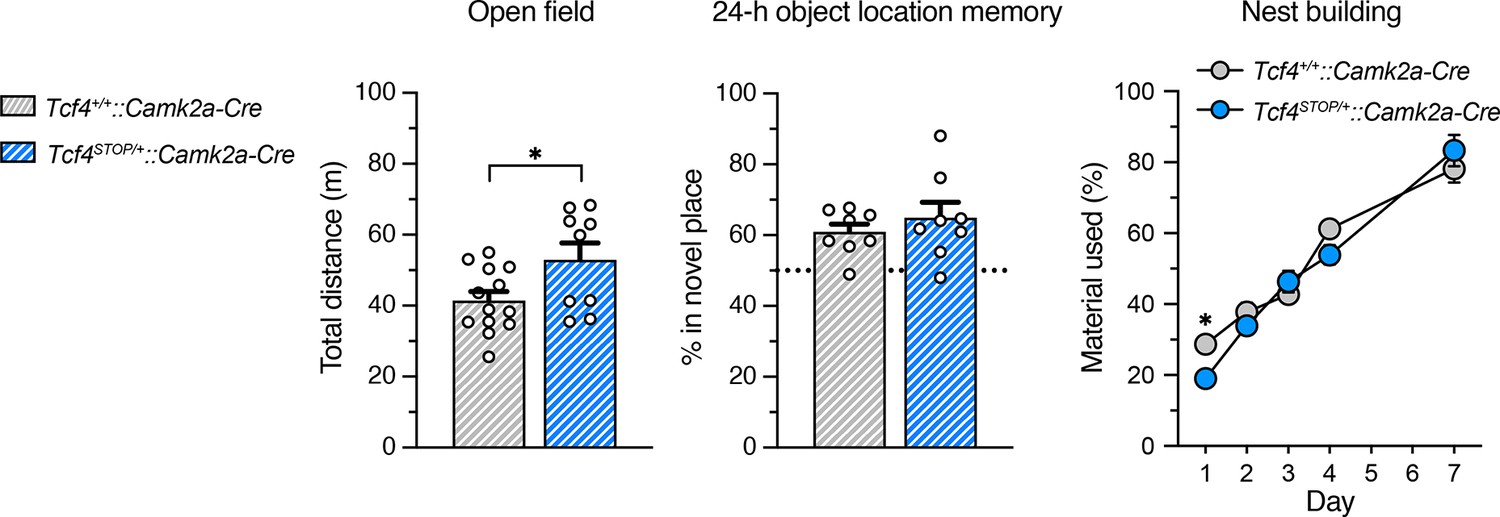
Behavioral outcomes of Tcf4STOP/+::Camk2a-Cre mice.
Total distance traveled for the 30-min testing period in the open field (Tcf4+/+::Camk2a-Cre: n = 13, Tcf4STOP/+::Camk2a-Cre: n = 9), percent time interacting with the novel location object (Tcf4+/+::Camk2a-Cre: n = 8, Tcf4STOP/+::Camk2a-Cre: n = 8), and nest building assay (Tcf4+/+::Camk2a-Cre: n = 8, Tcf4STOP/+::Camk2a-Cre: n = 8). Reinstating Tcf4 expression in Camk2a-expressing neurons rescued memory deficit and abnormal innate behavior in PTHS model mice. Values are means ± SEM. *p < 0.05.
Figure 5 with 1 supplement
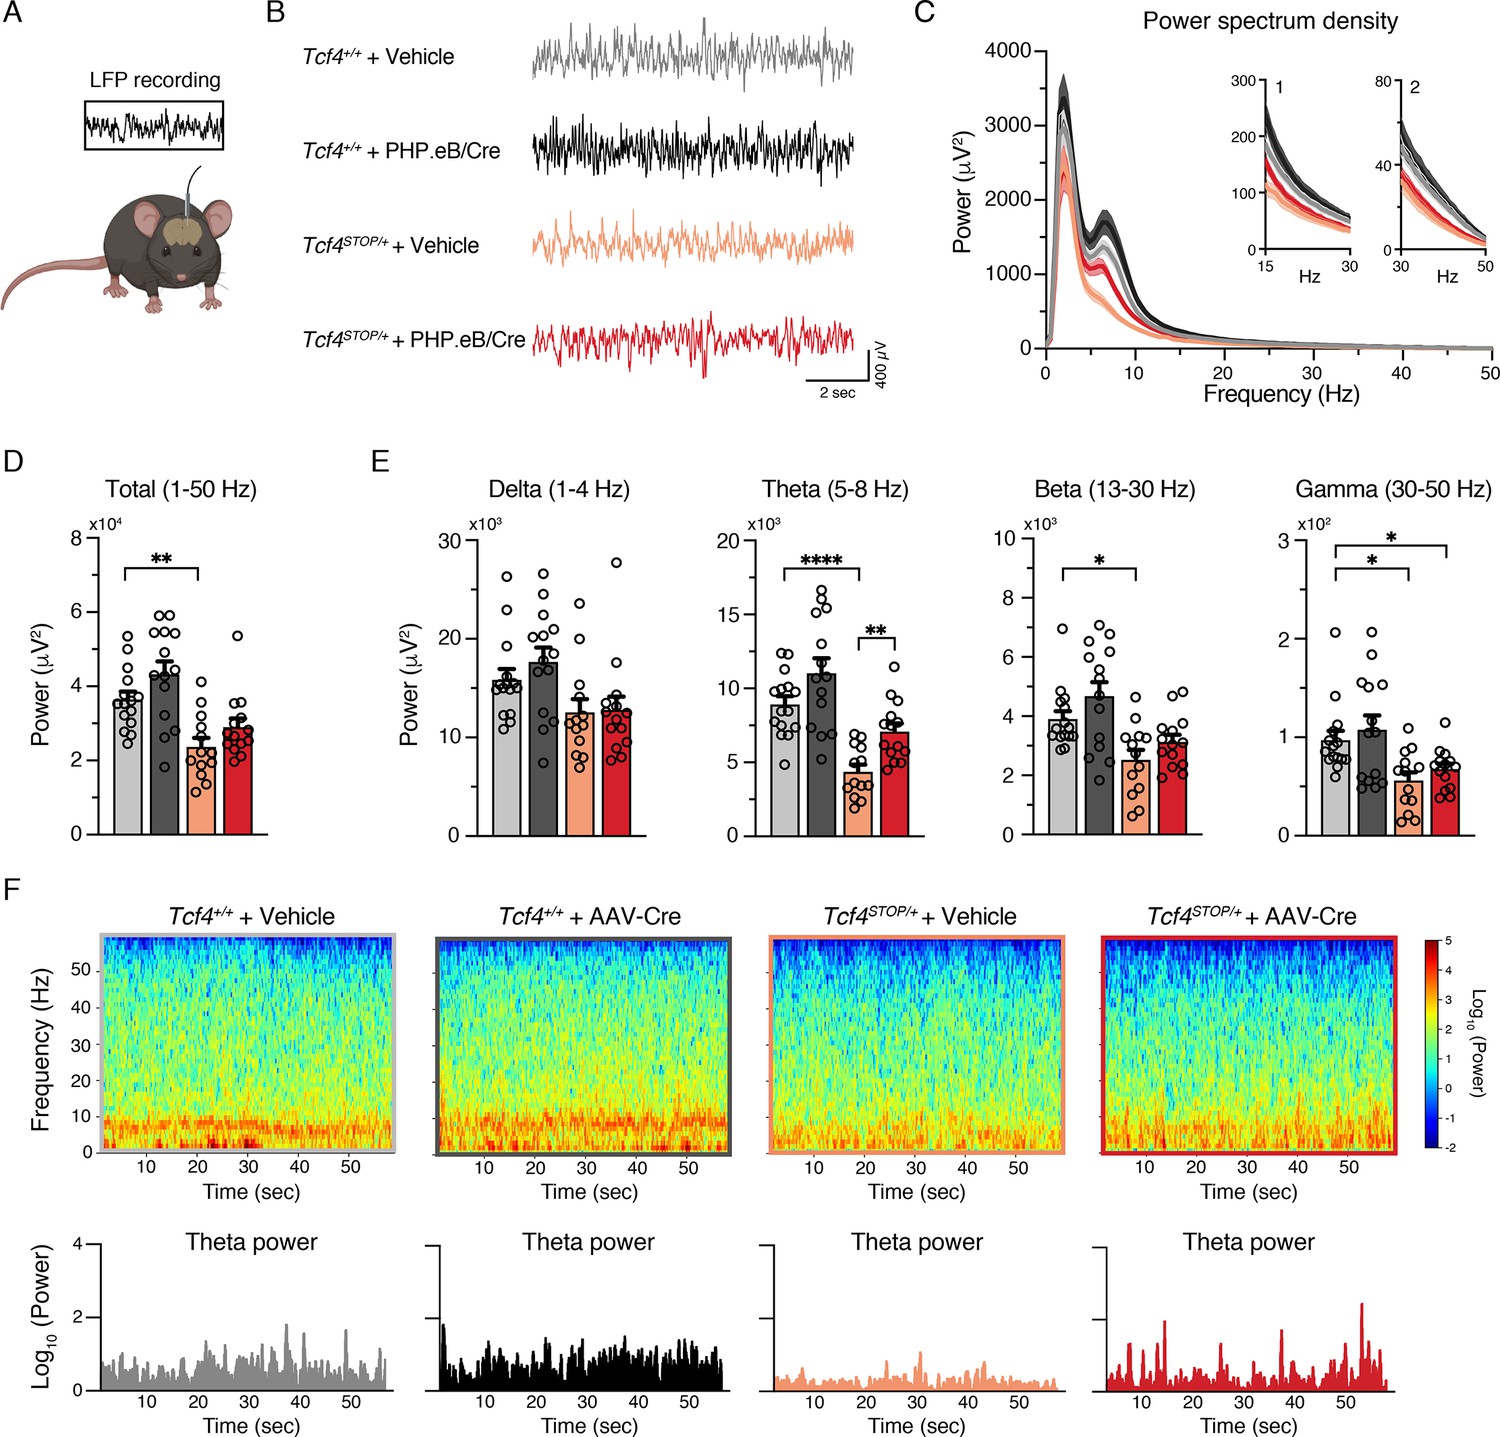
Neonatal ICV injection of PHP.eB/Cre partially rescues LFP spectral power in Tcf4STOP/+ mice.
(A) Schematic of local field potential (LFP) recording from the hippocampus of a freely moving mouse. (B) Representative examples of LFP in each experimental group. (C) Power spectrum density of hippocampal LFP analyzed from Tcf4+/+ and Tcf4STOP/+ mice treated with vehicle or PHP.eB/Cre. Inset 1 spans from 15 to 30 Hz. Inset 2 spans from 30 to 50 Hz on x-axis. (D) LFP power analyses of frequency bands ranging from 1 to 50 Hz, (E) delta (1–4 Hz), theta (5–8 Hz), beta (13–30 Hz), and gamma (30–50 Hz) bands (Tcf4+/+ + vehicle: n = 15, Tcf4+/+ + PHP.eB/Cre: n = 14, Tcf4STOP/+ + vehicle: n = 13, and Tcf4STOP/+ + PHP.eB/Cre: n = 14). (F) Top panels: Spectrograms in single LFP sessions of representative experimental groups. Bottom panels: Representative theta power extracted from spectrogram in the top panel. Values are means ± SEM. *p < 0.05, **p < 0.005, ****p < 0.0001.
-
Figure 5—source data 1
Numerical data shown in Figure 5.
- https://cdn.elifesciences.org/articles/72290/elife-72290-fig5-data1-v2.xlsx
Figure 5—figure supplement 1
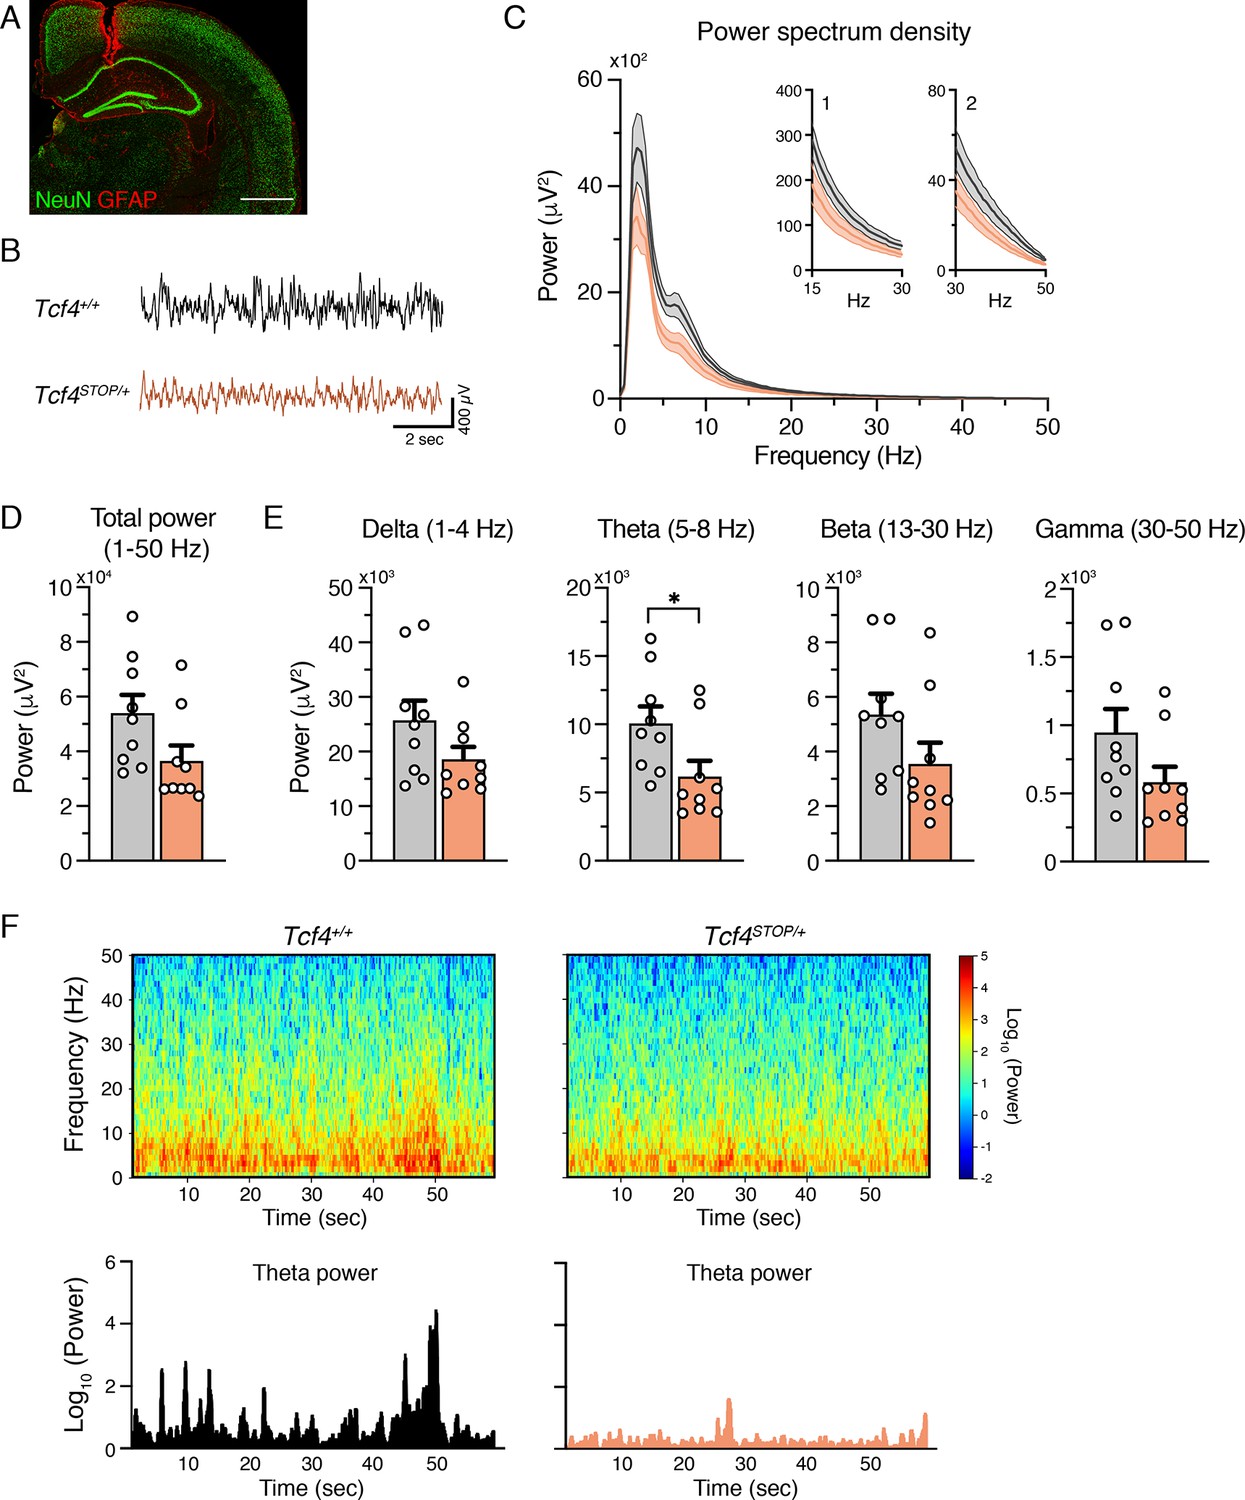
Tcf4 haploinsufficiency alters LFP spectral power in the theta band.
(A) Example electrode location (red, GFAP; green, NeuN). Scale bar = 100 µm. (B) Representative examples of LFP in Tcf4+/+ and Tcf4STOP/+ mice. (C) Power spectrum density of hippocampal LFP analyzed from Tcf4+/+ and Tcf4STOP/+ mice. Inset 1 spans from 15 to 30 Hz. Inset 2 spans from 30 to 50 Hz on x-axis. (D) LFP power analyses of frequency bands ranging from 1 to 50 Hz, (E) delta (1–4 Hz), theta (5–8 Hz), beta (13–30 Hz), and gamma (30–50 Hz) bands (Tcf4+/+: n = 9 and Tcf4STOP/+: n = 9). (F) Top panels: Spectrograms in a single LFP session of representative experimental groups. Bottom panels: Representative theta power extracted from spectrogram in the top panel. Values are means ± SEM. *p < 0.05.
Figure 6

Widespread Cre expression of the forebrain leads to partial upregulation of Tcf4 and partial recovery of selected TCF4-regulated gene expression.
(A) Representative image of in situ hybridization for Cre mRNA in sagittal section of 6-month-old Tcf4STOP/+ mouse that was treated at P1 with PHP.eB/Cre. Scale bar = 1 mm. (B–D) Higher magnification images of boxed regions in panel A. Scale bars = 200 µm. (E) Cre mRNA fluorescence levels of neocortex and CA1 pyramidal cell layer analyzed from individual Tcf4STOP/+ + PHP.eB/Cre mice. The red line and black dotted lines of the violin plot represent median and interquartile ranges of the data, respectively. (F) Relative Tcf4 mRNA expression of the forebrain from vehicle-treated Tcf4+/+ (n = 15), vehicle-treated Tcf4STOP/+ (n = 14), and PHP.eB/Cre-treated Tcf4STOP/+ (n = 15) mice. Tcf4 mRNA expression levels of PHP.eB/Cre-treated Tcf4STOP/+ mice are relatively higher than vehicle-treated Tcf4STOP/+ mice. Relative mRNA expressions of selected TCF4-regulated genes: Grin2a (Tcf4+/+ + Vehicle: 1.0 ± 0.05, n = 15; Tcf4STOP/+ + Vehicle: 0.67 ± 0.02, n = 14; Tcf4STOP/+ + PHP.eB/Cre: 0.85 ± 0.05, n = 14), Mal (Tcf4+/+ + Vehicle: 1.0 ± 0.04, n = 15; Tcf4STOP/+ + Vehicle: 0.70 ± 0.02, n = 14; Tcf4STOP/+ + PHP.eB/Cre: 0.83 ± 0.04, n = 14), Glra3 (Tcf4+/+ + Vehicle: 1.0 ± 0.04, n = 15; Tcf4STOP/+ + Vehicle: 0.80 ± 0.04, n = 14; Tcf4STOP/+ + PHP.eB/Cre: 0.93 ± 0.04, n = 14), and Lpar1 (Tcf4+/+ + Vehicle: 1.0 ± 0.04, n = 15; Tcf4STOP/+ + Vehicle: 0.71 ± 0.03, n = 14; Tcf4STOP/+ + PHP.eB/Cre: 0.84 ± 0.05, n = 14). Values are means ± SEM. *p < 0.05, **p < 0.005, ***p < 0.001, ****p < 0.0001.
-
Figure 6—source data 1
Numerical data shown in Figure 6.
- https://cdn.elifesciences.org/articles/72290/elife-72290-fig6-data1-v2.xlsx
Author response image 1
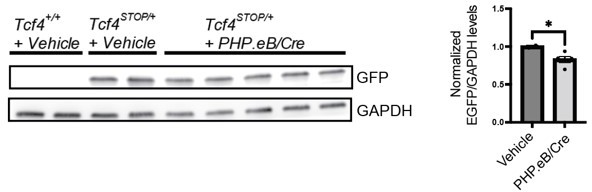
Representative Western blot and quantification for GFP and GAPDH loading control protein from P17 mouse brain lysates.
Quantification represents data from Vehicle- and PHP.eB/Cre-treated Tcf4Stop/+ mice.
Tables
Key resources table
| Reagent type (species) or resource | Designation | Source or reference | Identifiers | Additional information |
|---|---|---|---|---|
| Gene (M. musculus) | Transcription factor 4 (Tcf4) | GenBank | MGI:MGI:98,506 | |
| Genetic reagent (M. musculus) | (C57BL/6 J) Tcf4STOP/+ | doi:10.3389/fnana2020.00042 | ||
| Genetic reagent (M. musculus) | (C57BL/6 J) Actb-Cre+/- | Jackson Laboratory | Strain #: 019099 | PMID:9598348 |
| Genetic reagent (M. musculus) | (C57BL/6 J) Gad2-Cre+/- | Jackson Laboratory | Strain #: 010802 | PMID:21943598 |
| Genetic reagent (M. musculus) | (C57BL/6 J) Olig2-Cre+/- | Jackson Laboratory | Strain #: 025567 | PMID:20569695 |
| Genetic reagent (M. musculus) | (C57BL/6 J) Camk2a-Cre+/- | Jackson Laboratory | Strain #: 005359 | PMID:8980237 |
| Genetic reagent (M. musculus) | (C57BL/6 J) Neurod6-Cre+/- | doi:10.1002/dvg.20256 | ||
| Antibody | Mouse monoclonal anti-Cre recombinase | Millipore Sigma | MAB3120 | (1:1000) |
| Antibody | Guinea pig polyclonal anti-NeuN | Millipore Sigma | ABN90P | (1:1000) |
| Antibody | Rabbit polyclonal anti-GFAP | Agilent Dako | Z033429-2 | (1:1000) |
| Antibody | Rabbit polyclonal anti-GFP | NOVUS Biologicals | NB600-308 | (1:1000) |
| Antibody | Goat polyclonal anti-rabbit Alexa 568 | Invitrogen | A11011 | (1:1000) |
| Antibody | Goat polyclonal anti-mouse Alexa 647 | Invitrogen | A21240 | (1:1000) |
| Antibody | Goat polyclonal anti-guinea pig Alexa 594 | Invitrogen | A11076 | (1:1000) |
| Antibody | Goat polyclonal anti-rabbit Alexa 448 | Invitrogen | A32731 | (1:1000) |
| Other | Biotinylated goat anti-rabbit antibody | Vector Laboratories | BA-1000–1.5 | Biotinylated secondary antibody, (1:500) |
| Other | ABC elite avidin-biotin-peroxidase system | Vector Laboratories | Vector PK-7100 | Detection of biotinylated molecule |
| Other | DAPI stain | Invitrogen | D1306 | Blue-fluorescent DNA stain (700 ng/m) |
| Antibody | Mouse monoclonal anti-ITF-2 | Santa Cruz Biotechnology | Sc-393407 | (1:1000), doi: 10.1523/ENEURO.0197–21.2021 |
| Antibody | Rabbit polyclonal anti-beta Tubulin | Abcam | Ab6046 | (1:5000) |
| Antibody | Goat polyclonal anti-mouse secondary antibody, HRP | Thermo Fisher | 31,430 | (1:5000) |
| Antibody | Goat polyclonal anti-rabbit secondary antibody, HRP | Thermo Fisher | 31,460 | (1:5000) |
| Other | Bicinchoninic acid assay | Thermo Scientific | 23,225 | Quantitation of total protein |
| Other | Protease inhibitor cocktail | Sigma | P8340 | Inhibition of serine-proteases |
| Other | Odyssey blocking buffer | Li-COR Biosciences | 927–40100 | Phosphate-buffered saline that provides optimal blocking conditions |
| Other | Polyvinylidene fluoride membranes | Fisher Scientific | 45-004-110 | Membrane materials used for Western blot |
| Commercial assay, kit | Clarity Western ECL Substrate | Bio-Rad | 1705061 | |
| Commercial assay, kit | RNAscope Fluorescent Multiplex Assay | Advanced Cell Diagnostics | 320,850 | |
| Commercial assay, kit | RNAscope Protease IV | Advanced Cell Diagnostics | 322,340 | |
| Commercial assay, kit | RNAscope Probe-iCRE-C3 | Advanced Cell Diagnostics | 423321-C3 | Accession No:AY056050.1 |
| Commercial assay, kit | RNeasy Mini Kit | Qiagen | 74,106 | |
| Commercial assay, kit | SYBR green master mix | Thermofisher | A25742 | |
| Other | cDNA SuperMix | QuantaBio | 101414–106 | First-strand cDNA synthesis |
| Sequence-based reagent | mTcf4 Forward | This paper | PCR primers | GGGAGGAAGAGAAGGTGT |
| Sequence-based reagent | mTcf4 Reverse | This paper | PCR primers | CATCTGTCCCATGTGATTCGC |
| Sequence-based reagent | Grin2a Forward | This paper | PCR primers | TTCATGATCCAGGAGGAGTTTG |
| Sequence-based reagent | Grin2a Reverse | This paper | PCR primers | AATCGGAAAGGCGGAGAATAG |
| Sequence-based reagent | Mal Forward | This paper | PCR primers | CTGGCCACCATCTCAATGT |
| Sequence-based reagent | Mal Reverse | This paper | PCR primers | TGGACCACGTAGATCAGAGT |
| Sequence-based reagent | Glra3 Forward | This paper | PCR primers | GGGCATCACCACTGTACTTA |
| Sequence-based reagent | Glra3 Reverse | This paper | PCR primers | CCGCCATCCAAATGTCAATAG |
| Sequence-based reagent | Npar1 Forward | This paper | PCR primers | CCCTCTACAGTGACTCCTACTT |
| Sequence-based reagent | Npar1 Reverse | This paper | PCR primers | GCCAAAGATGTGAGCGTAGA |
| Sequence-based reagent | Actin Forward | This paper | PCR primers | GGCACCACACCTTCTACAATG |
| Sequence-based reagent | Actin Reverse | This paper | PCR primers | GGGGTGTTGAAGGTCTCAAAC |
| Software, algorithm | Ethovision XT 15.0 | Noldus | ||
| Software, algorithm | Spike2 | Cambridge Electronic Design Ltd | ||
| Software, algorithm | GraphPad Prism 9.1.1 | GraphPad Software |
Additional files
Download links
A two-part list of links to download the article, or parts of the article, in various formats.
Downloads (link to download the article as PDF)
Open citations (links to open the citations from this article in various online reference manager services)
Cite this article (links to download the citations from this article in formats compatible with various reference manager tools)
Rescue of behavioral and electrophysiological phenotypes in a Pitt-Hopkins syndrome mouse model by genetic restoration of Tcf4 expression
eLife 11:e72290.
https://doi.org/10.7554/eLife.72290


