Quantitative proteomics reveals the selectivity of ubiquitin-binding autophagy receptors in the turnover of damaged lysosomes by lysophagy
- Department of Cell Biology, Harvard Medical School, Boston, United States
- Aligning Science Across Parkinson’s (ASAP) Collaborative Research Network, United States
Figures
Figure 1 with 1 supplement
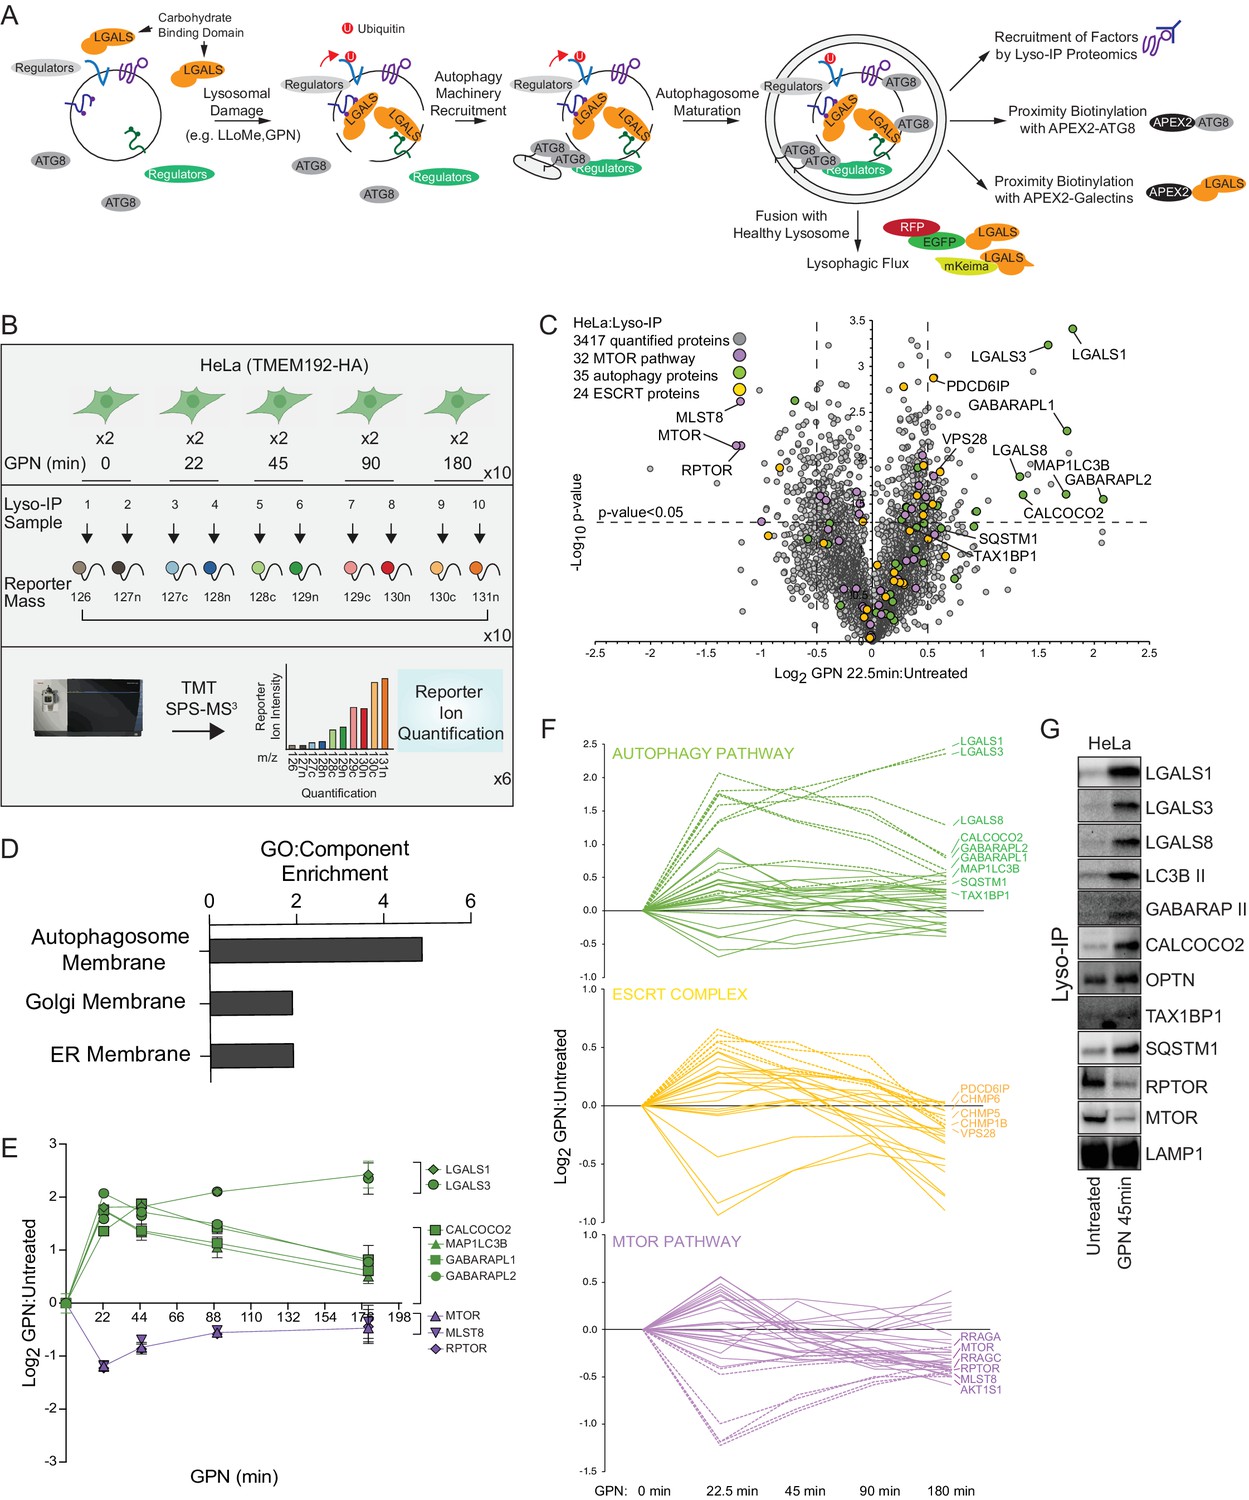
Quantitative analysis of the lysosomal proteome in response to damage.
(A) Scheme depicting major steps in lysophagy and the approaches employed to elucidate components of the pathway. (B) Scheme for tandem mass tagging (TMT)-based proteomics of lysosomes from HeLa cells in response to lysosome rupture by glycyl-l-phenylalanine 2-naphthylamide (GPN). Cells expressing TMEM192-HA were left untreated or treated with GPN for the indicated period of time (in duplicate) and cell lysates subjected to a Lyso-IP protocol prior to TMT-based proteomics. (C) Volcano plot for GPN (22.5 min)-treated cells versus untreated Lyso-IP samples (Log2 FC versus −Log10 p-value) based on the TMT experiment in (B). Specific categories of proteins are indicated by colored circles. (D) GO enrichment (component) for proteins that accumulate on lysosomes in response to GPN treatment. (E) Time course reflecting the dynamics of recruitment or loss of selected proteins from lysosomes in response to GPN treatment. Error bars represent SD from two biological replicates. (F) Dynamics of recruitment or loss of proteins linked with autophagy (top), ESCRT (middle), and MTOR (lower) pathways in association with lysosomes upon GPN treatment. All the lines for each category represent individual proteins (see Supplementary file 2), and proteins with the most highly dynamic changes are indicated as dashed lines. (G) HeLa cells were either left untreated or treated with GPN for 45 min prior to isolation of lysosomes by Lyso-IP. Samples were then subjected to immunoblotting with the indicated antibodies.
-
Figure 1—source data 1
Uncropped blots for Figure 1G.
- https://cdn.elifesciences.org/articles/72328/elife-72328-fig1-data1-v2.pdf
-
Figure 1—source data 2
TMT ratios from GPN time course for Figure 1E.
- https://cdn.elifesciences.org/articles/72328/elife-72328-fig1-data2-v2.xlsx
Figure 1—figure supplement 1
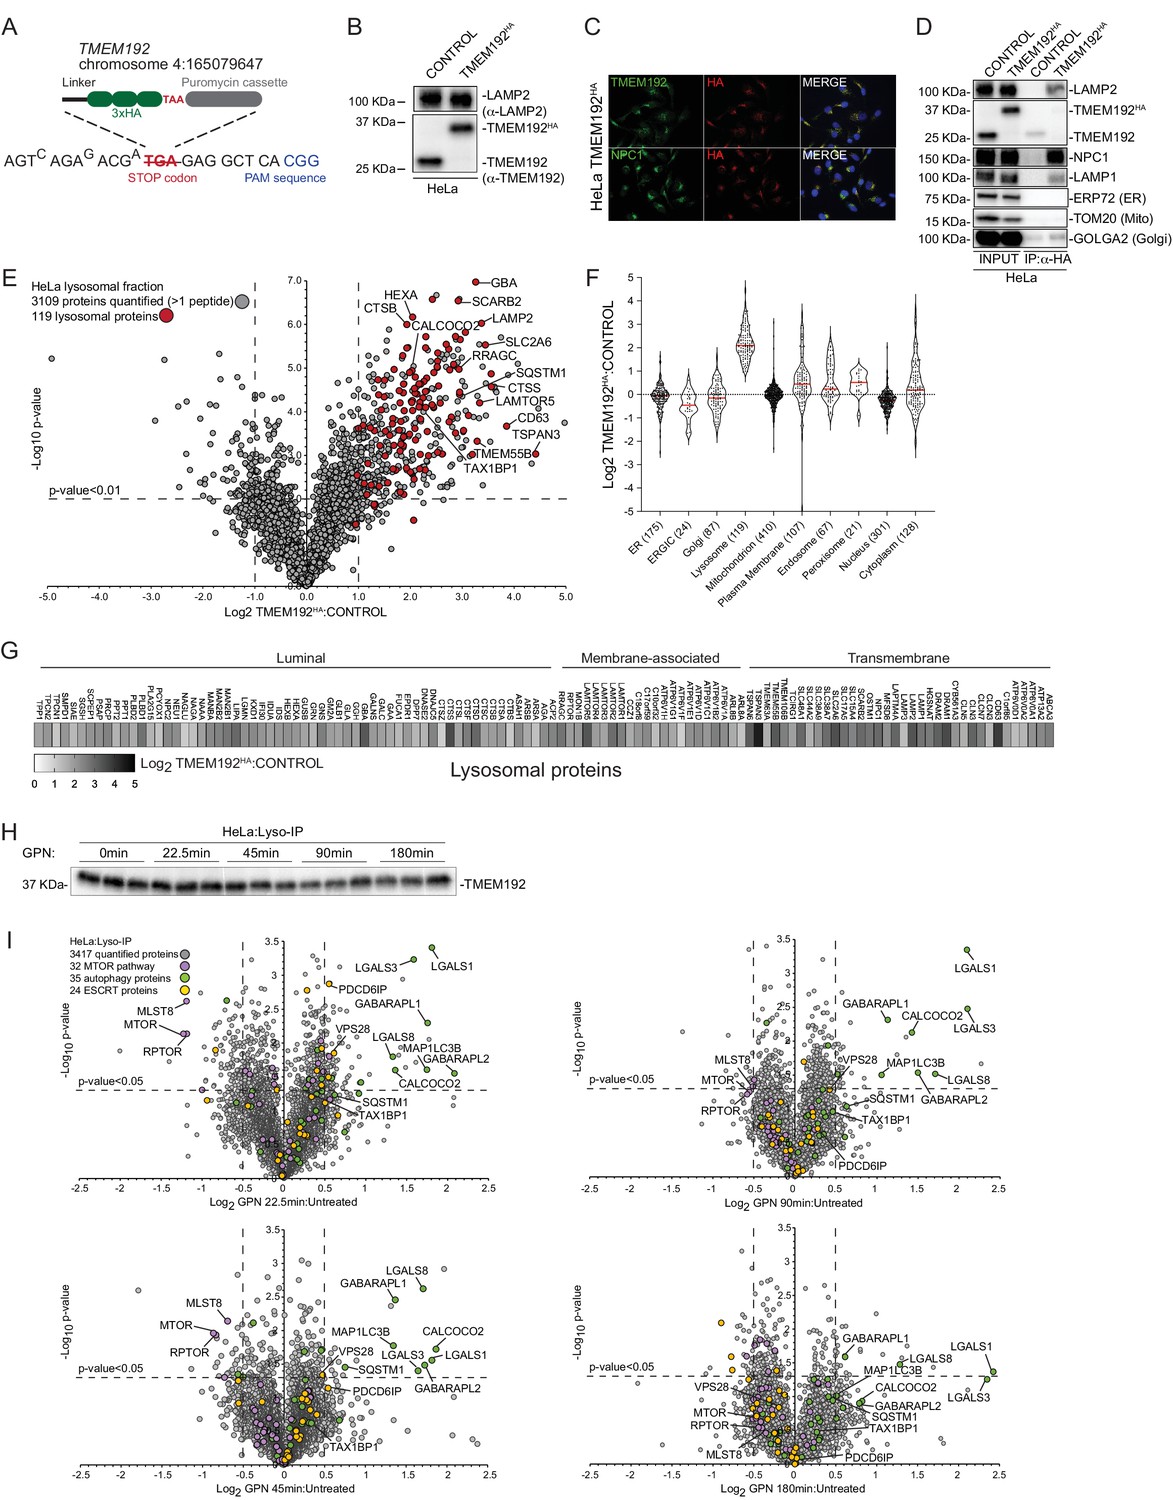
Quantitative analysis of the lysosomal proteome in response to damage.
(A) Scheme depicting the targeting strategy for insertion of a 3 x-HA epitope at the C-terminus of the TMEM192 gene in HeLa cells. (B) Whole cell extracts from the indicated HeLa cells (CONTROL or TMEM192HA) were immunoblotted using the indicated antibodies. (C) Immunostaining of HeLa TMEM192HA cells with α-TMEM192, α-NPC1 as a lysosome marker, and α-HA. Nuclei were stained with DAPI. (D) CONTROL or TMEM192HA cells were subjected to Lyso-IP and immune complexes as well as input cell extracts subjected to immunoblotting for the indicated proteins. (E) Volcano plot for 6-plex TMT experiment comparing Lyso-IP from TMEM192HA-tagged cell extracts versus CONTROL cells lacking the HA tag (−Log10 p-value versus Log2 FC TMEM192HA Lyso-IP versus control cell Lyso-IP). All proteins quantified are indicated in grey and lysosomal proteins are indicated in red and show strong enrichment in the Lyso-IP sample. (F) Violin plots for individual organelles, showing enrichment of lysosomal proteins in the Lyso-IP-enriched proteins. (G) Heatmap of Log2 FC for individual lysosomal proteins annotated based on their localization within lysosomes within the Lyso-IP. (H) Western blot analysis of TMEM192 (bait) levels after Lyso-IP from untreated and GPN-treated HeLa TMEM192HA cells. (I) Volcano plot representation for GPN-treated cells versus untreated Lyso-IP samples (Log2 FC versus −Log10 p-value) for various time points after treatment, based on the TMT experiment in Figure 1B. Specific categories of proteins are indicated by colored circles.
-
Figure 1—figure supplement 1—source data 1
Uncropped blots for Figure 1B, D and H.
- https://cdn.elifesciences.org/articles/72328/elife-72328-fig1-figsupp1-data1-v2.pdf
Figure 2 with 1 supplement
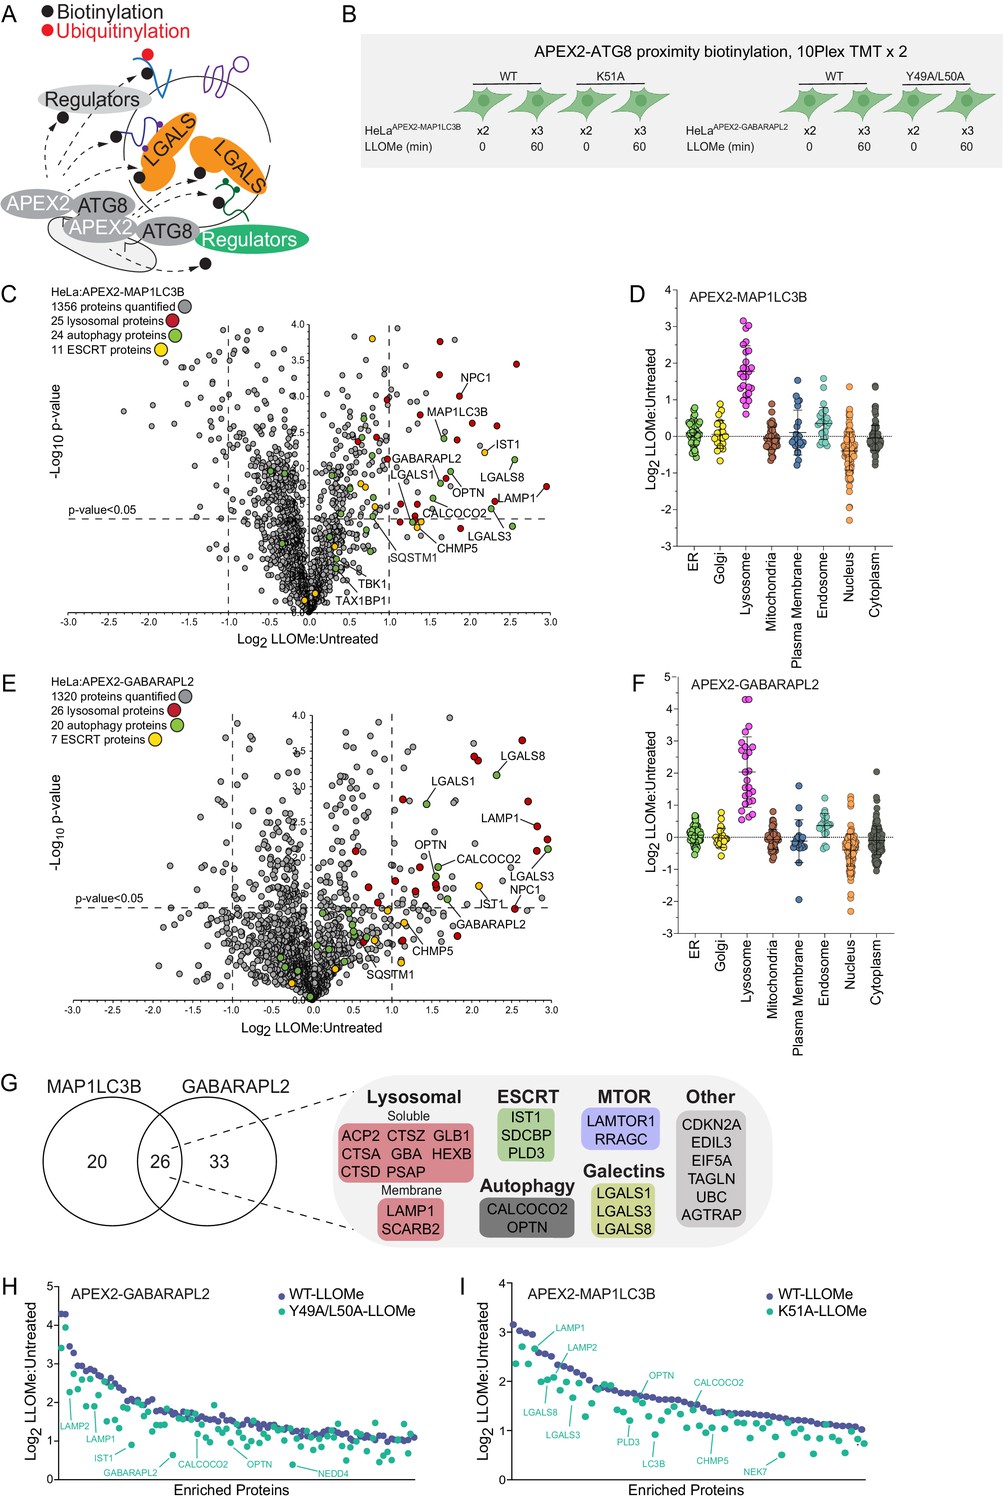
Proximity biotinylation of ATG8 proteins in response to lysosomal damage.
(A) Scheme depicting proximity biotinylation of proteins in response to recruitment of ATG8 proteins to damaged lysosomes. (B) Experimental workflow for ATG8 proximity biotinylation. APEX2-tagged GABARAPL2 (or the corresponding Y49A mutant) or MAP1LC3B (or the corresponding K51A mutant) expressed in HeLa cells were subjected to proximity biotinylation 60 min post-LLOMe treatment using 10plex TMT. (C) Volcano plot for LLOMe (60 min)-treated cells versus untreated cells (Log2 FC versus −Log10 p-value) for APEX-MAP1LC3B-based proximity biotinylation based on the TMT experiment in B. Specific categories of proteins are indicated by colored circles. (D) Log2 FC for individual proteins localized to the indicated subcellular compartments found to be enriched in biotinylated proteins from cells expressing APEX2-MAP1LC3B. Mean and standard deviation are calculated from two untreated and three treated biological replicates. (E) Volcano plot for LLOMe (60 min)-treated cells versus untreated cells (Log2 FC versus −Log10 p-value) for APEX-GABARAPL2-based proximity biotinylation based on the TMT experiment in (B). Specific categories of proteins are indicated by colored circles. (F) Log2 FC for individual proteins localized to the indicated subcellular compartments found to be enriched in biotinylated proteins from cells expressing APEX2-GABARAPL2. Mean and standard deviation are calculated from two untreated and three treated biological replicates. (G) Summary of overlap between biotinylated proteins found with MAP1LC3B and GABARAPL2 APEX2 proteomics. Proteins enriched with Log2 FC >1.0 and p-value <0.05 were included. Proteins identified in both APEX2 experiments are indicated. (H) Plot of means of Log2 FC for biotinylated proteins in cells expressing APEX-GABARAPL2 or the Y49A/L50A mutant. Means are calculated from two untreated and three treated biological replicates. (I) Plot of means of Log2 FC for biotinylated proteins in cells expressing APEX-MAP1LC3B or the Y49A/L50A mutant. Means are calculated from two untreated and three treated biological replicates.
-
Figure 2—source data 1
Log2 FCs of various organelle proteins for APEX2-MAP1LC3B in response to LLOMe for Figure 2D.
- https://cdn.elifesciences.org/articles/72328/elife-72328-fig2-data1-v2.xlsx
-
Figure 2—source data 2
Log2 FCs of various organelle proteins for APEX2-GABARAPL2 in response to LLOMe for Figure 2F.
- https://cdn.elifesciences.org/articles/72328/elife-72328-fig2-data2-v2.xlsx
-
Figure 2—source data 3
Log2 FCs of GABARAPL2 LIR dependent interactors for Figure 2H.
- https://cdn.elifesciences.org/articles/72328/elife-72328-fig2-data3-v2.xlsx
-
Figure 2—source data 4
Log2 FCs of MAP1LC3B LIR-dependent interactors for Figure 2I.
- https://cdn.elifesciences.org/articles/72328/elife-72328-fig2-data4-v2.xlsx
Figure 2—figure supplement 1
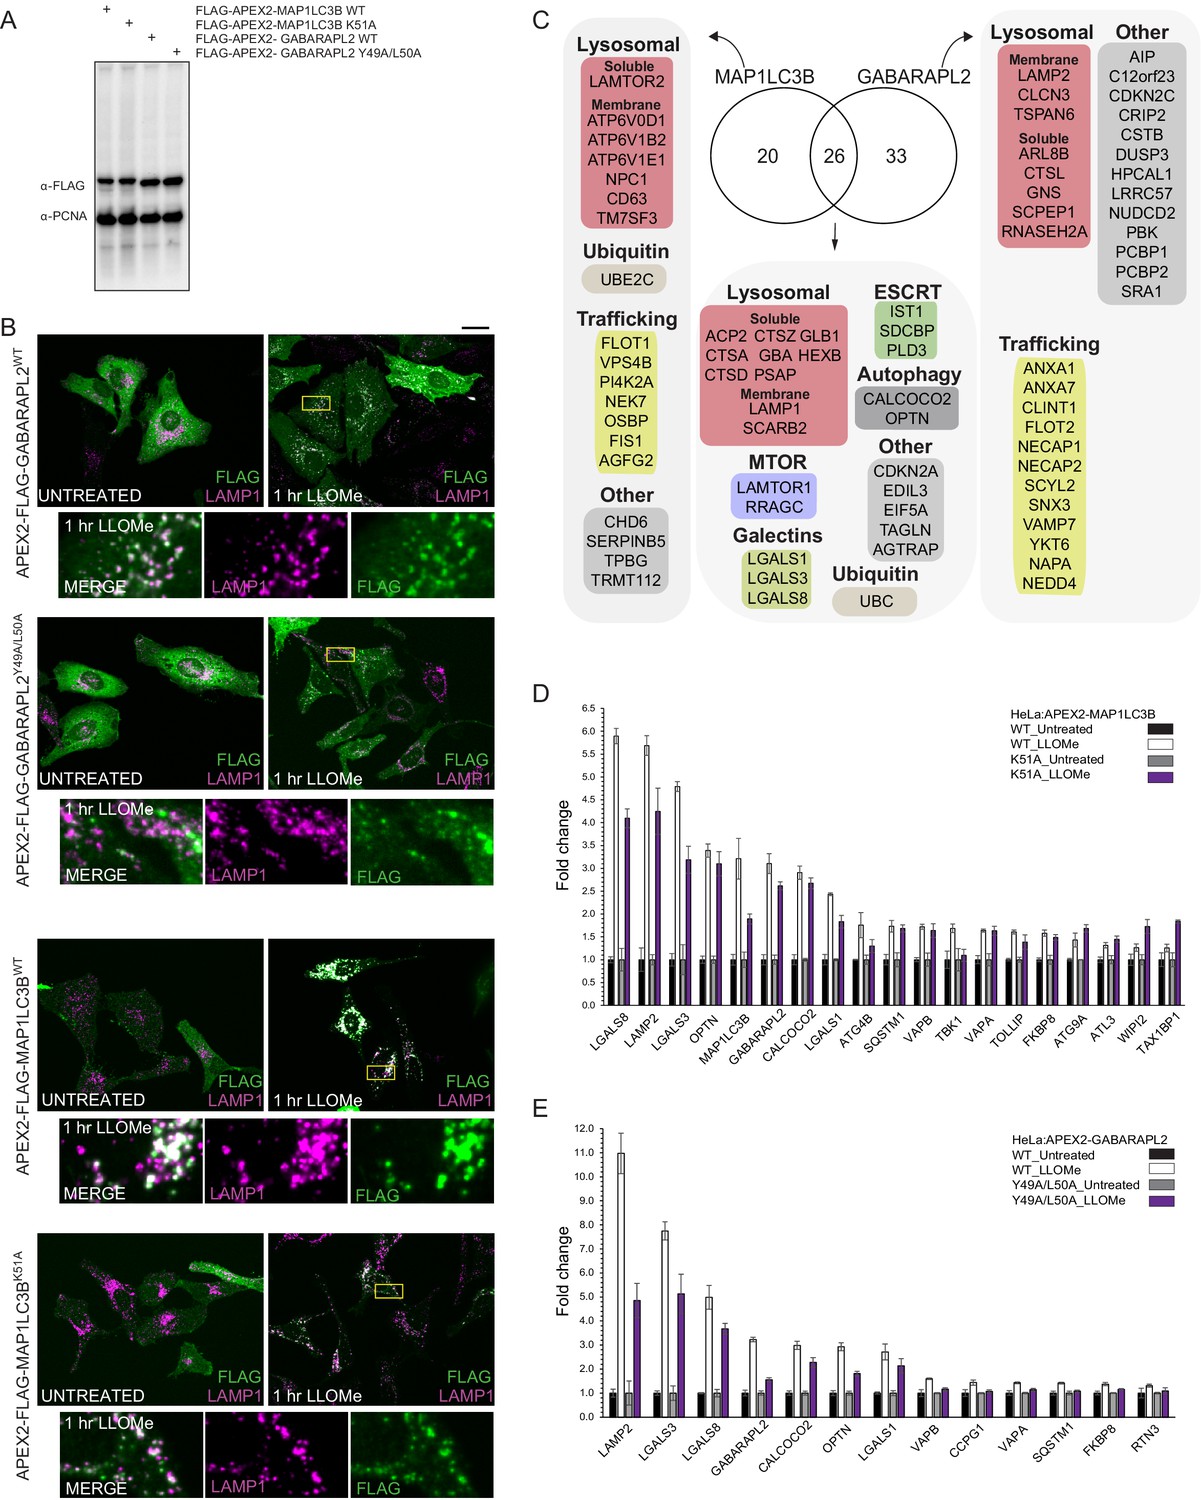
Proximity biotinylation of ATG8 proteins in response to lysosomal damage.
(A) Extracts from HeLa cells stably expressing the indicated APEX2 fusion proteins were subjected to immunoblotting with the indicated antibodies. (B) HeLa cells expressing APEX2-GABARAPL2 or APEX2-MAP1LC3B were treated with LLOMe (1 hr) followed by immunofluorescence using α-LAMP1 to detect lysosomes and α-Flag to detect the Flag epitope on the APEX2 portion of the fusion protein. Scale bar = 25 μm. Zoom-in panels 15 μm × 25 μm. (C) Summary of proteins enriched by proximity biotinylation of GABARAPL2 and MAP1LC3B (Log2 FC >1.0 and p-value <0.05). (D) Histogram showing the effect of mutation of the LIR-binding regions of MAP1LC3B on proximity biotinylation. FC for TMT intensities of both untreated samples is normalized to 1.0 for WT and mutant. Mean and standard deviation are calculated from two untreated and two treated biological replicates. (E) Histogram showing the effect of mutation of the LIR-binding regions of GABARAPL2 on proximity biotinylation. FC for TMT intensities of both untreated samples are normalized to 1.0 for WT and mutant. Mean and standard deviation are calculated from two untreated and two treated biological replicates.
-
Figure 2—figure supplement 1—source data 1
Uncropped blots for Figure 2—figure supplement 1A.
- https://cdn.elifesciences.org/articles/72328/elife-72328-fig2-figsupp1-data1-v2.pdf
-
Figure 2—figure supplement 1—source data 2
Source data for APEX2 LC3 LIR-dependent interactors.
- https://cdn.elifesciences.org/articles/72328/elife-72328-fig2-figsupp1-data2-v2.xlsx
-
Figure 2—figure supplement 1—source data 3
Source data for APEX2 GABARAPL2 LIR-dependent interactors.
- https://cdn.elifesciences.org/articles/72328/elife-72328-fig2-figsupp1-data3-v2.xlsx
Figure 3 with 1 supplement
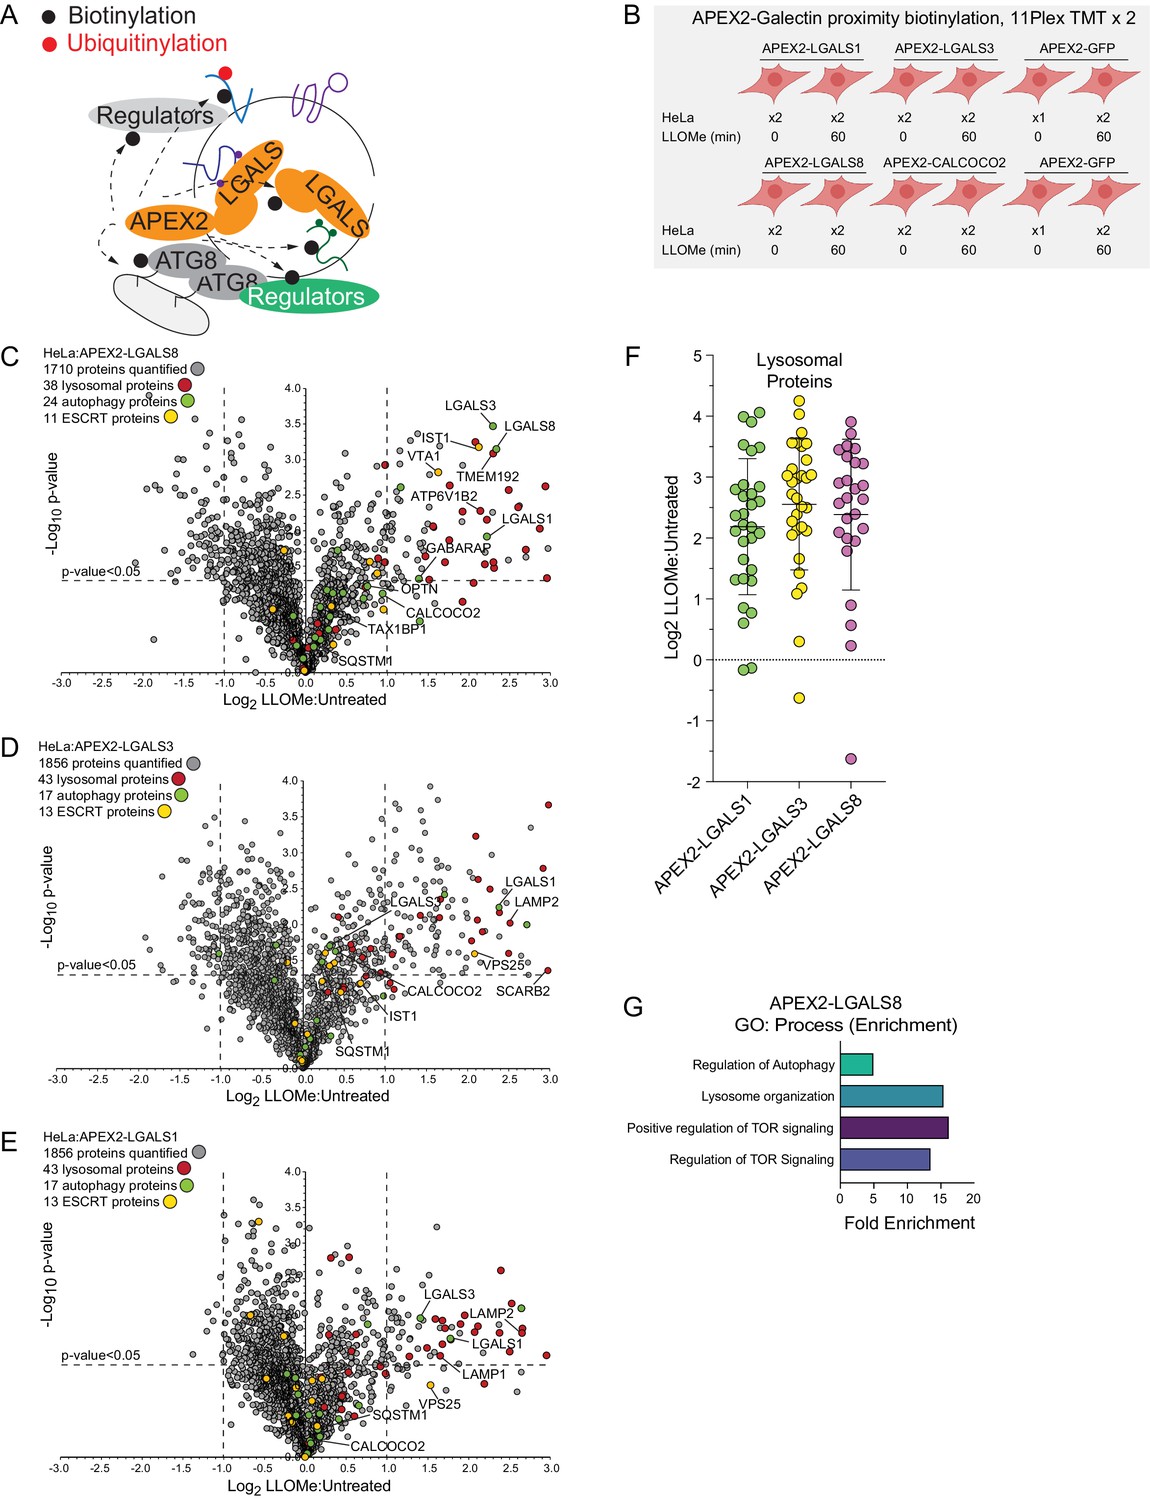
Proximity biotinylation of galectins in response to lysosomal damage.
(A) Scheme depicting proximity biotinylation of proteins in response to recruitment of LGALS1, LGALS3, and LGALS8 proteins to damaged lysosomes. (B) Experimental workflow for galectin proximity biotinylation. APEX2-tagged LGALS1, LGALS3, and LGALS8 expressed in HeLa cells were subjected to proximity biotinylation 60 min post-LLOMe treatment using 10-plex TMT. (C) Volcano plot for LLOMe (60 min)-treated cells versus untreated cells (Log2 FC versus −Log10 p-value) for APEX-LGALS8-based proximity biotinylation based on the TMT experiment in (B). Specific categories of proteins are indicated by colored circles. (D) Volcano plot for LLOMe (60 min)-treated cells versus untreated cells (Log2 FC versus −Log10 p-value) for APEX-LGALS3-based proximity biotinylation based on the TMT experiment in B. Specific categories of proteins are indicated by colored circles. (E) Volcano plot for LLOMe (60 min)-treated cells versus untreated cells (Log2 FC versus −Log10 p-value) for APEX-LGALS1-based proximity biotinylation based on the TMT experiment in B. Specific categories of proteins are indicated by colored circles. (F) Log2 FC for individual proteins localized to the lysosomal compartment found to be enriched in biotinylated proteins from cells expressing the indicated APEX2-galectin protein. Mean and standard deviation are calculated from two untreated and two treated biological replicates. (G) GO: process enrichment categories for APEX2-LGALS8.
-
Figure 3—source data 1
Log2 FCs for lysosomal proteins from APEX2-LGALS1, 3, and 8 for Figure 3F.
- https://cdn.elifesciences.org/articles/72328/elife-72328-fig3-data1-v2.xlsx
-
Figure 3—source data 2
GO enrichments for APEX2-LGALS8 for Figure 3G.
- https://cdn.elifesciences.org/articles/72328/elife-72328-fig3-data2-v2.xlsx
Figure 3—figure supplement 1
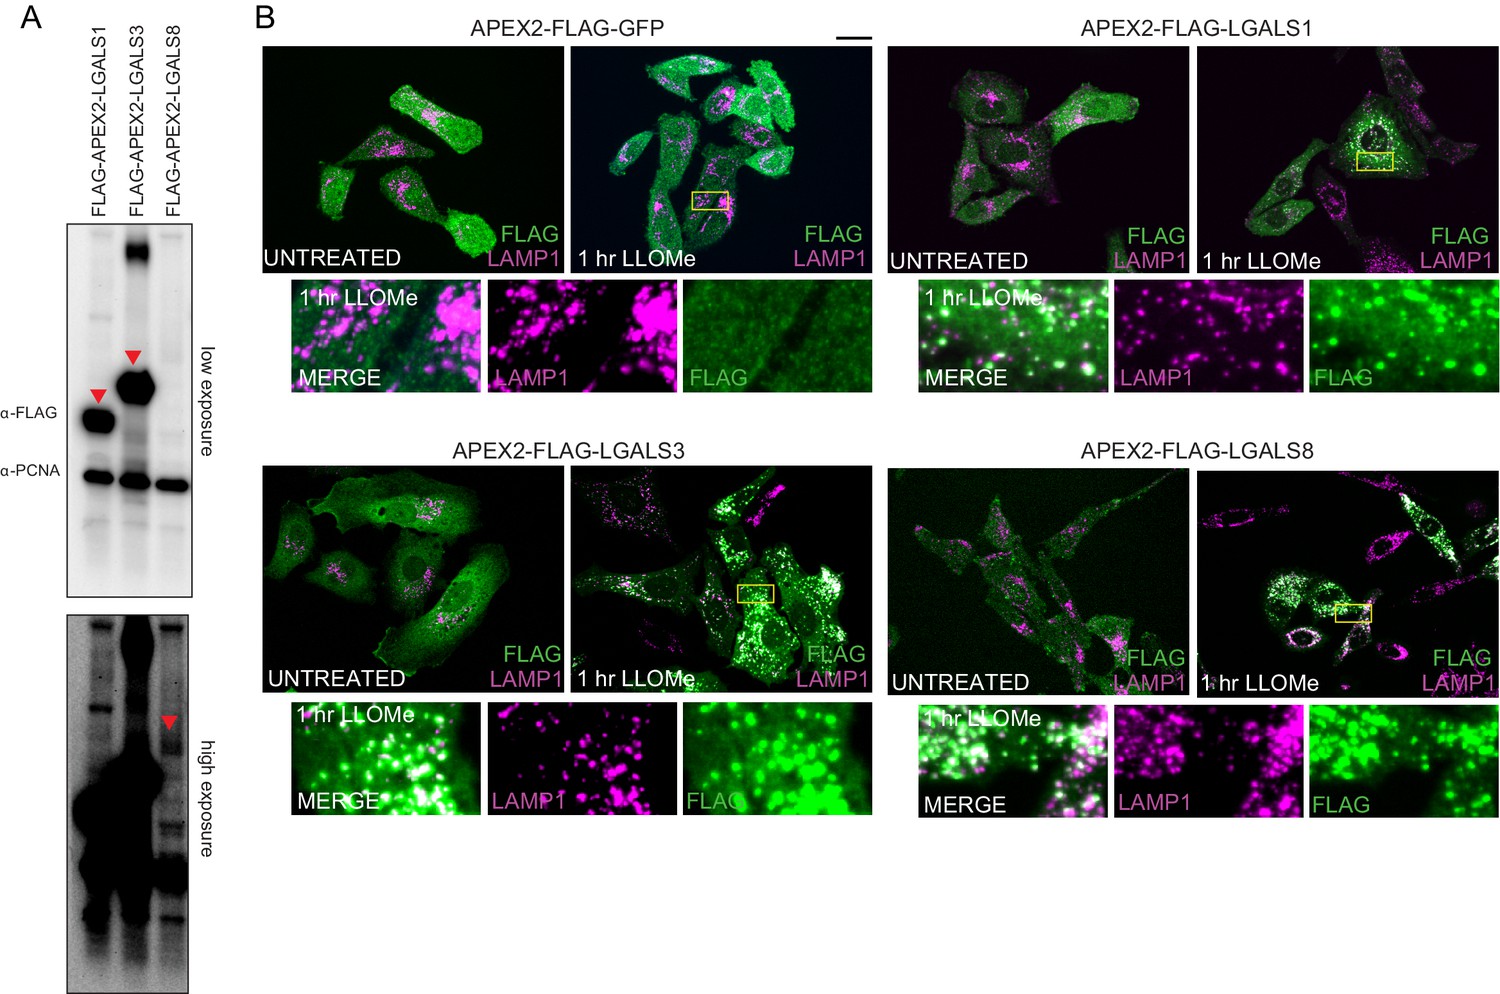
Proximity biotinylation of galectins in response to lysosomal damage.
(A) Extracts from HeLa cells stably expressing the indicated APEX2 fusion proteins were subjected to immunoblotting with the indicated antibodies. (B) HeLa cells expressing the indicated APEX2-fusion proteins with galectins were treated with LLOMe (1 hr) followed by immunofluorescence using α-LAMP1 to detect lysosomes and α-FLAG to detect the Flag epitope on the APEX2 portion of the fusion protein. Scale bar = 25 μm. Zoom-in panels 15 μm × 25 μm.
-
Figure 3—figure supplement 1—source data 1
Uncropped blots for Figure 3—figure supplement 1A.
- https://cdn.elifesciences.org/articles/72328/elife-72328-fig3-figsupp1-data1-v2.pdf
Figure 4 with 1 supplement
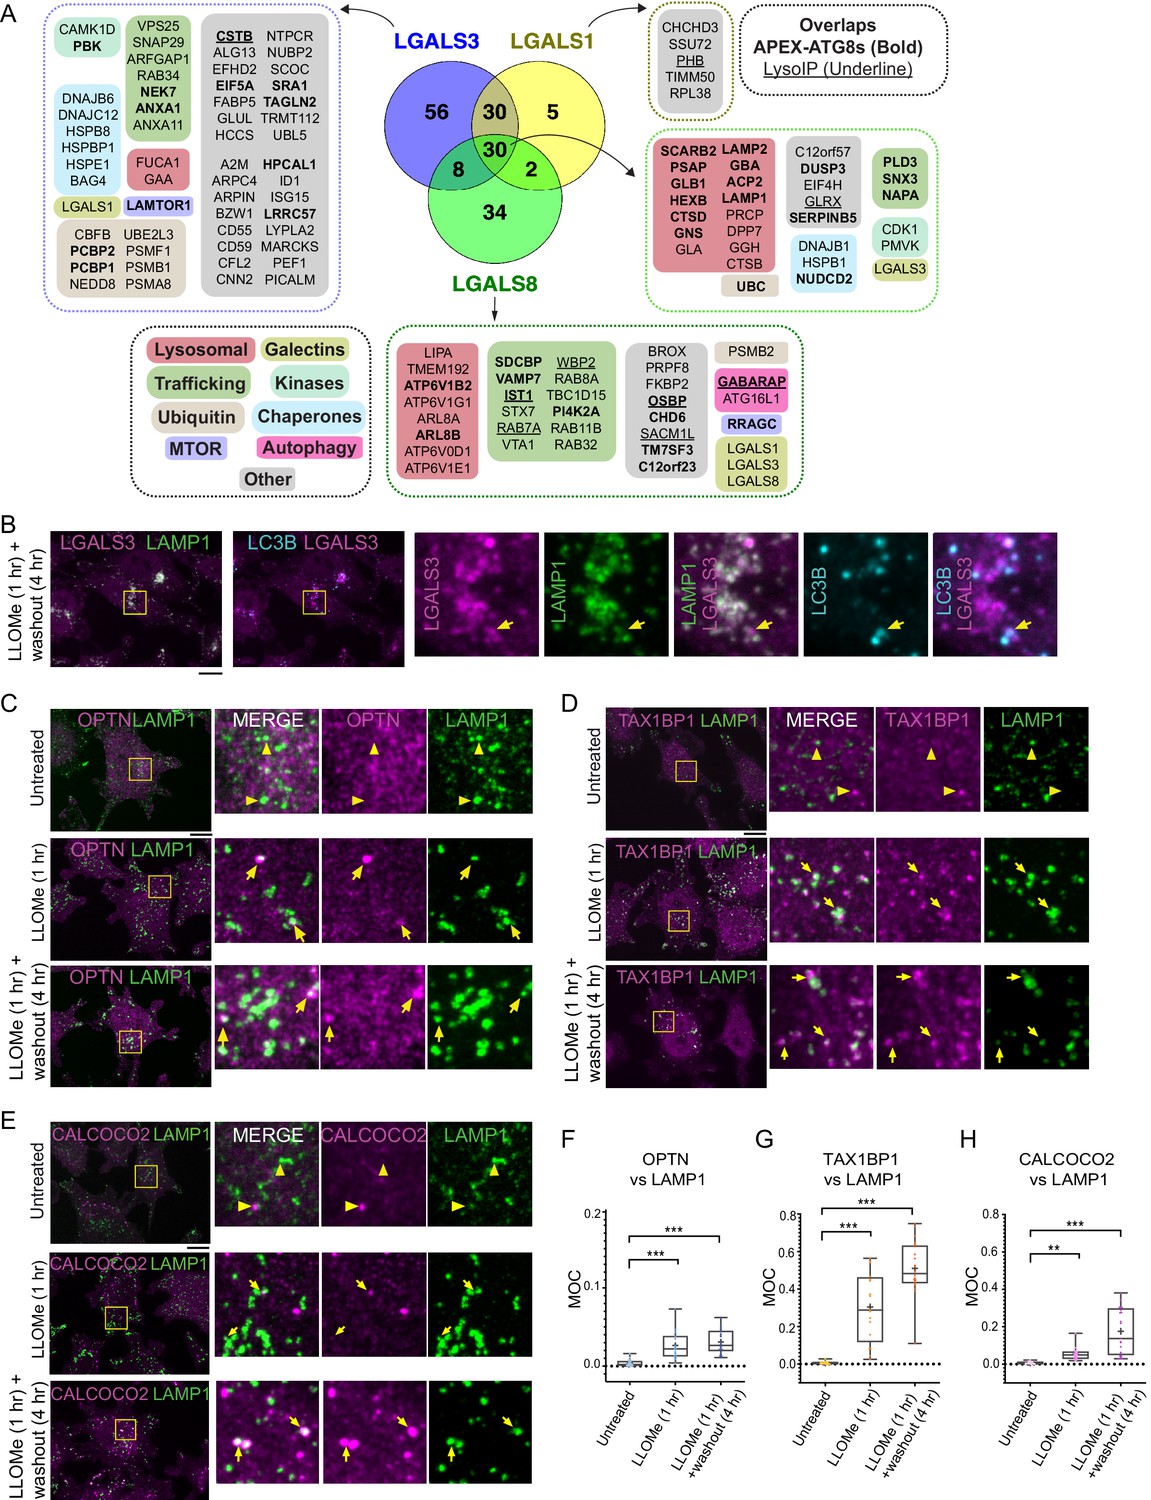
Landscape of lysophagy reveals autophagy receptor recruitment.
(A) Summary of proteins in proximity to galectins and integration with associations found with APEX2-ATG8 (bold) and Lyso-IP (underline). Other functional classes are indicated. (B) Localization of LGALS3 with LAMP1 and MAP1LC3B in response to lysosomal damage. Cells were treated with LLOMe for 1 hr and the LLOMe washed out for 4 hr prior to immunofluorescence using the indicated antibodies and imaging by confocal microscopy. Scale bars 10 μm. Zoom-in panels, 10 μm × 10 μm. (C) Cells were left untreated (Untreated), treated with LLOMe for 1 hr and either fixed (LLOMe 1 hr) or the LLOMe was washed out for 4 hr prior to fixation (LLOMe 1 hr+ washout 4 hr). Immunofluorescence was done using α-OPTN/α-LAMP1 and imaging by confocal microscopy. Scale bars 10 μm. Zoom-in panels, 10 μm × 10 μm. (D) Cells were treated as in (C). Immunofluorescence was done using α-TAX1BP1/α-LAMP1 and imaging by confocal microscopy. Scale bars 10 μm. Zoom-in panels, 10 μm × 10 μm. (E) Cells were treated as in (C). Immunofluorescence was done using α-CALCOCO2/α-LAMP1 and imaging by confocal microscopy. Scale bars 10 μm. Zoom-in panels, 10 μm × 10 μm. (F) Quantification of OPTN localization at LAMP1 lysosomes using Mander’s overlap coefficient (MOC). 23 (0 hr), 19 (1 hr), and 22 (4 hr washout) cells were analyzed for MOC. ***p < 0.001. + marks the mean and the line marks the median. The plot represents merged data from three biological replicates for each condition. (G) Quantification of TAX1BP1 localization at LAMP1 lysosomes using Mander’s overlap coefficient (MOC). 20 (0 hr), 17 (1 hr), and 22 (4 hr washout) cells were analyzed for MOC. ***p < 0.001. + marks the mean and the line marks the median. The plot represents merged data from three biological replicates for each condition. (H) Quantification of CALCOCO2 localization at LAMP1 lysosomes using MOC. 18 (0 hr), 20 (1 hr), and 21 (4 hr washout) cells were analyzed for MOC. **p < 0.01 and ***p < 0.001. + marks the mean and the line marks the median. The plot represents merged data from three biological replicates for each condition.
-
Figure 4—source data 1
Mander’s overlap coefficient (MOC) values for Figure 4F, G and H.
- https://cdn.elifesciences.org/articles/72328/elife-72328-fig4-data1-v2.xlsx
Figure 4—figure supplement 1
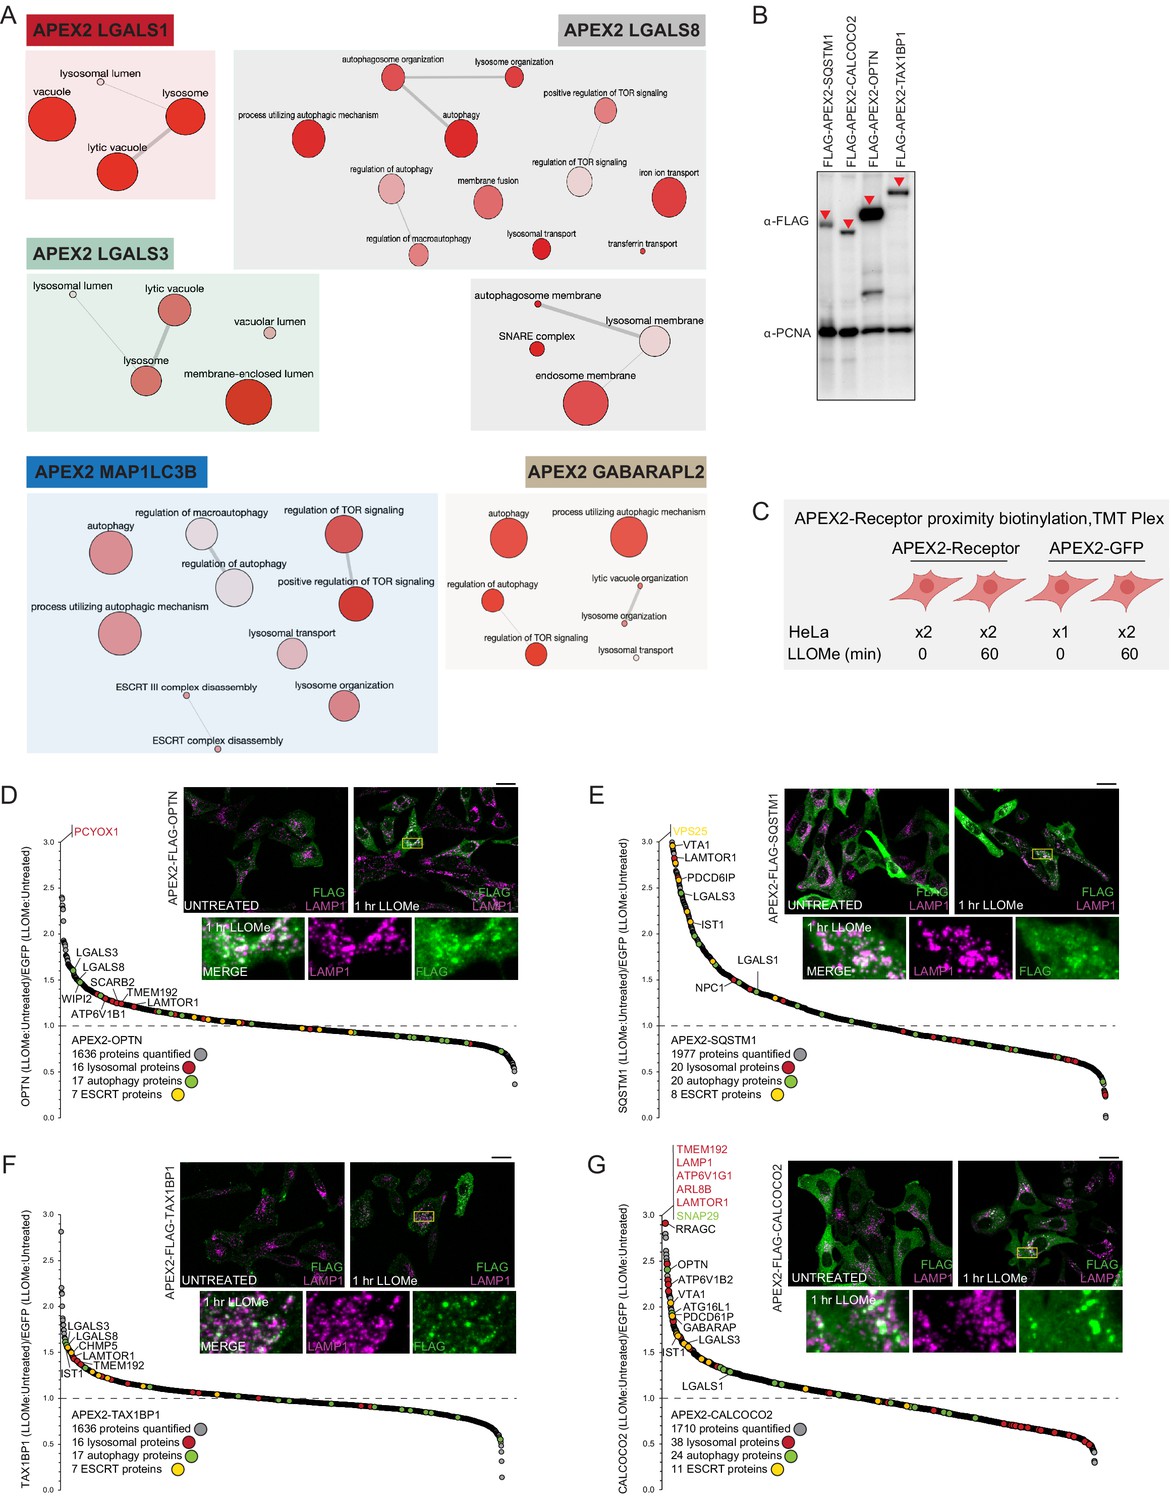
Proximity biotinylation of Ub-binding cargo adaptors in response to lysosomal rupture.
(A) Gene Ontology (GO) terms linked with enriched proteins identified by proximity biotinylation of galectins and ATG8 proteins. Analysis was performed using the reduce and visualize gene ontology server (REVIGO) (http://revigo.irb.hr/). (B) HeLa cells expressing the indicated APEX2 constructs were lysed and extracts analyzed by immunoblotting with α-FLAG antibody to detect the expressed APEX-tagged receptor, and α-PNCA as a loading control. (C) Experimental workflow for Ub-binding cargo receptor proximity biotinylation. APEX2-tagged cargo receptors expressed in HeLa cells in biological duplicate were subjected to proximity biotinylation 60-min post-LLOMe treatment using 7-plex TMT and APEX2-GFP as a control. (D) Plot of Log2 FC for all proteins identified in the proximity biotinylation experiment for OPTN as described in C. Means are calculated from biological replicates indicated in C. Specific categories of proteins are indicated by colored circles. Inset: HeLa cells expressing APEX2-FLAG-OPTN were treated with LLOMe (1 hr) followed by immunofluorescence using α-LAMP1 to detect lysosomes (magenta) and α-FLAG (green) to detect the FLAG epitope on the APEX2 portion of the fusion protein. Scale bar = 25 μm. Zoom-in panels 15 μm × 25 μm. (E) Plot of Log2FC for all proteins identified in the proximity biotinylation experiment for SQSTM1 as described in (C). Means are calculated from biological replicates indicated in (C). Specific categories of proteins are indicated by colored circles. Inset: HeLa cells expressing APEX2-FLAG-SQSTM1 were treated with LLOMe (1 hr) followed by immunofluorescence using α-LAMP1 to detect lysosomes (magenta) and α-FLAG (green) to detect the Flag epitope on the APEX2 portion of the fusion protein. Scale bar = 25 μm. Zoom-in panels 15 μm × 25 μm. (F) Plot of Log2 FC for all proteins identified in the proximity biotinylation experiment for TAX1BP1 as described in (C). Means are calculated from biological replicates indicated in (C). Specific categories of proteins are indicated by colored circles. Inset: HeLa cells expressing APEX2-FLAG-TAX1BP1 were treated with LLOMe (1 hr) followed by immunofluorescence using α-LAMP1 to detect lysosomes (magenta) and α-FLAG (green) to detect the FLAG epitope on the APEX2 portion of the fusion protein. Scale bar = 25 μm. Zoom-in panels 15 μm × 25 μm. (G) Plot of Log2 FC for all proteins identified in the proximity biotinylation experiment for CALCOCO2 as described in Figure 3B. Means are calculated from biological replicates indicated in Figure 3B. Specific categories of proteins are indicated by colored circles. Inset: HeLa cells expressing APEX2-FLAG-CALCOCO2 were treated with LLOMe (1 hr) followed by immunofluorescence using α-LAMP1 to detect lysosomes (magenta) and α-FLAG (green) to detect the FLAG epitope on the APEX2 portion of the fusion protein. Scale bar = 25 μm. Zoom-in panels 15 μm × 25 μm.
-
Figure 4—figure supplement 1—source data 1
Uncropped blots for Figure 4—figure supplement 1B.
- https://cdn.elifesciences.org/articles/72328/elife-72328-fig4-figsupp1-data1-v2.pdf
Figure 5 with 1 supplement
TBK1 is required for lysophagic flux.
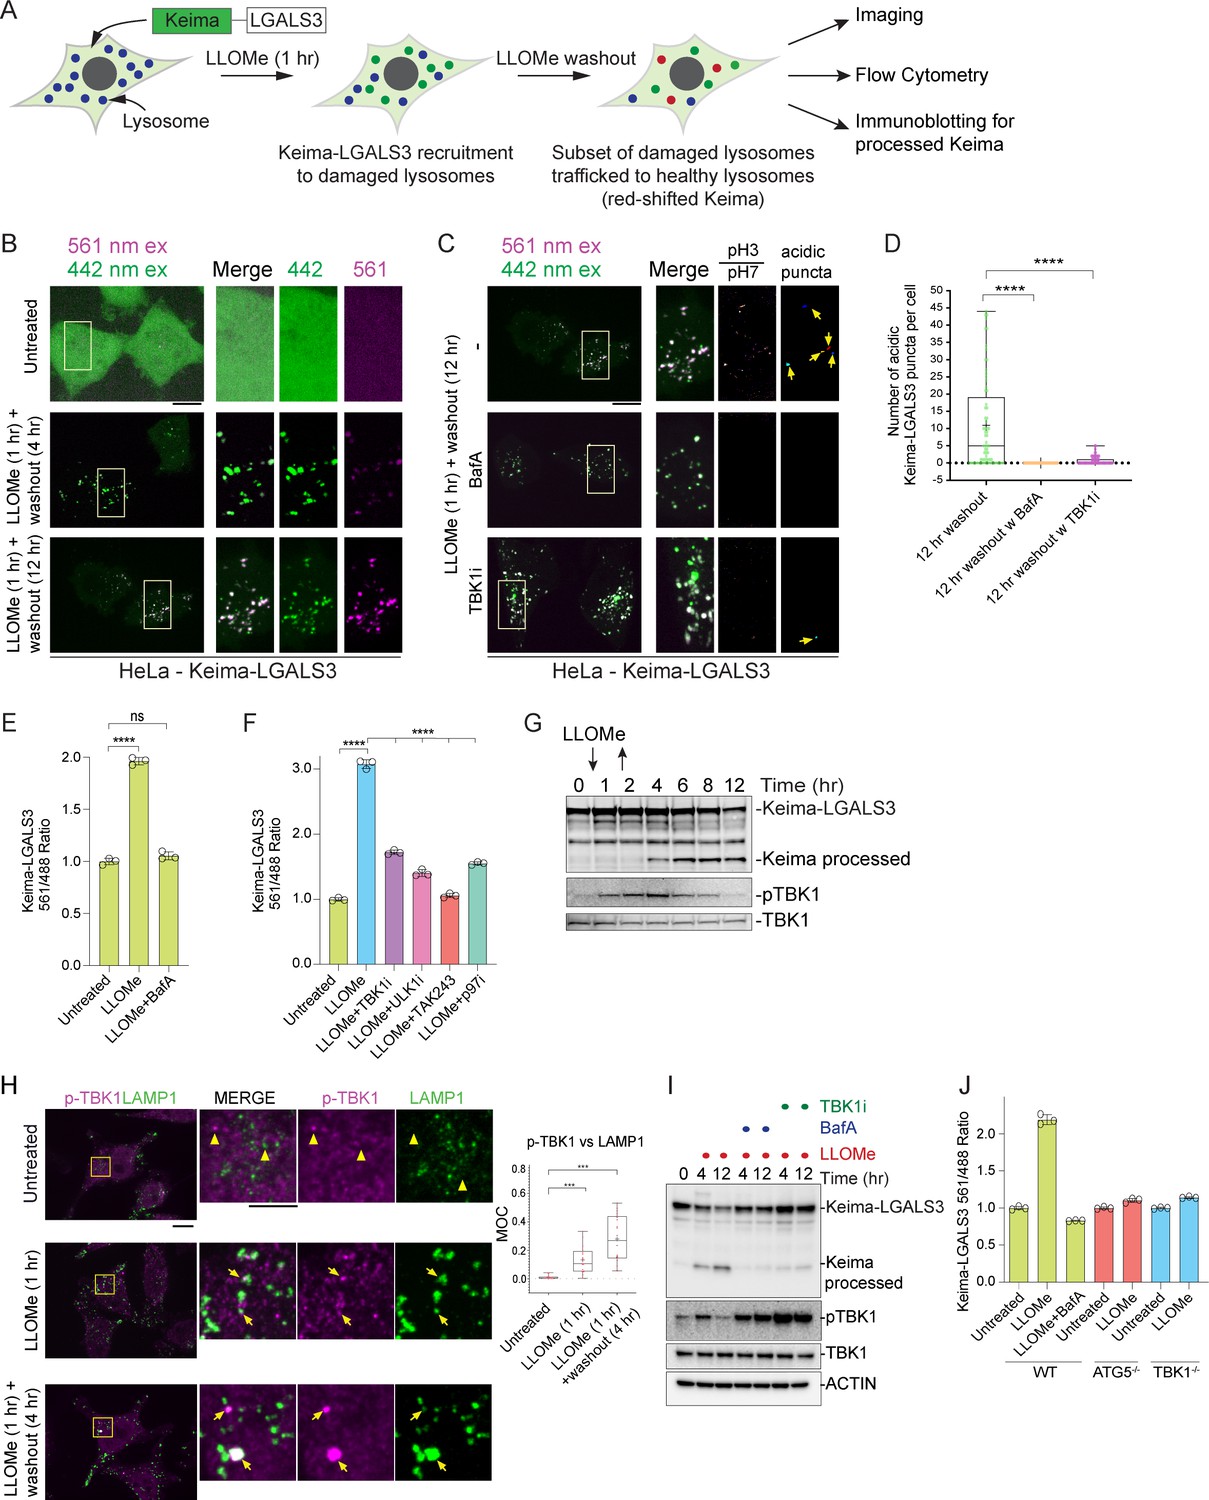
(A) Scheme depicting measurement of lysophagic flux using Lyso-Keima (Keima-LGALS3). Cells stably expressing Keima-LGALS3 are treated with LLOMe (1 hr), and the Keima-LGALS3 is recruited from the cytosol to damaged lysosomes, representing the initial recruitment step (green dot). After removing LLOMe (washout), damaged lysosomes undergo autophagy-dependent trafficking to a healthy lysosome, leading to a red-shift in Keima fluorescence (red dots) due to the acidic environment of the lysosome. Cells can be analyzed by imaging, flow cytometry or SDS–PAGE for processed Keima. (B) Keima-LGALS3 in untreated HeLa cells or in cells that were treated with LLOMe for 1 hr and the LLOMe washed out for 4 or 12 hr and imaged using excitation at 442 or 561 nm. Scale bar 10 μm. Zoom-in panels, 10 μm × 20 μm. (C) Keima-LGALS3 HeLa cells were either left untreated or treated for 1 hr followed by washout (12 hr) with or without prior addition of TBK1i or BafA. Cells were imaged using excitation at 442 or 561 nm. A ratio of the 561 nm/442 nm images was taken and puncta were identified from this 561 nm/442 nm image. Scale bar 10 μm. Zoom-in panels, 10 μm × 20 μm. (D) Quantification of Keima-positive lysosomes. 69 (untreated), 83 (BafA), and 66 (TBKi) cells were analyzed ****p < 0.0001. + marks the mean and the line is at the median. The plot represents merged data from three biological replicates. (E) Triplicate HeLa cells expressing Keima-LGALS3 were either left untreated or treated for 1 hr followed by washout (12 hr) with or without addition of BafA. Cells were then subjected to flow cytometry to measure the 561 nm/488 nm ratio. All values are normalized to the untreated sample. ****p < 0.0001. The plot represents mean and standard deviation from three biological replicates. (F) Triplicate HeLa cells expressing Keima-LGALS3 were either left untreated or treated for 1 hr followed by washout (12 hr) with or without prior addition of TBK1i, ULK1i, TAK243, and p97i. Cells were then subjected to flow cytometry to measure the 561 nm/488 nm ratio. All values are normalized to the untreated sample. ****p < 0.0001. The plot represents mean and standard deviation from three biological replicates. (G) HeLa cells expressing Keima-LGALS3 were either left untreated or treated for 1 hr followed by washout followed by harvesting at the indicated times. Lysed cells were then subjected to immunoblotting with the indicated antibodies. (H) Cells were left untreated (Untreated), treated with LLOMe for 1 hr and either fixed (LLOMe 1 hr) or the LLOMe was washed out for 4 hr prior to fixation (LLOMe 1 hr + washout 4 hr). Immunofluorescence was done using α-pTBK1/α-LAMP1 and imaging by confocal microscopy. Scale bar = 10 μm. Zoom-in panels, 10 μm × 10 μm. Right: quantification of localization using Mander’s overlap coefficient (MOC). 23 (0 hr), 21 (1 hr), and 18 (4 hr washout) cells were analyzed for MOC. ***p < 0.001. + marks the mean and the line is at the median. The plot represents merged data from three biological replicates. (I) HeLa cells expressing Keima-LGALS3 were either left untreated or treated with LLOMe for 1 hr and then incubated for four or 12 hr post-washout in the presence or absence of either BafA or TBK1i. Cell lysates were subjected to immunoblotting using the indicated antibodies. (J) Triplicate WT, ATG5−/−, or TBK1−/− HeLa cells expressing Keima-LGALS3 were either left untreated or treated for 1 hr followed by washout (4 hr) prior to flow cytometry to measure the 561 nm/488 nm ratio. All values are normalized to the untreated sample within each genotype. The plot represents mean and standard deviation from three biological replicates.
-
Figure 5—source data 1
Quantification of Keima-positive lysosomes.
- https://cdn.elifesciences.org/articles/72328/elife-72328-fig5-data1-v2.xlsx
-
Figure 5—source data 2
561/488 Keima ratios for Figure 5E.
- https://cdn.elifesciences.org/articles/72328/elife-72328-fig5-data2-v2.xlsx
-
Figure 5—source data 3
561/488 Keima ratios for Figure 5F.
- https://cdn.elifesciences.org/articles/72328/elife-72328-fig5-data3-v2.xlsx
-
Figure 5—source data 4
Uncropped blots for Figure 5G.
- https://cdn.elifesciences.org/articles/72328/elife-72328-fig5-data4-v2.pdf
-
Figure 5—source data 5
MOC values for Figure 5H.
- https://cdn.elifesciences.org/articles/72328/elife-72328-fig5-data5-v2.xlsx
-
Figure 5—source data 6
561/488 Keima ratios for Figure 5J.
- https://cdn.elifesciences.org/articles/72328/elife-72328-fig5-data6-v2.xlsx
Figure 5—figure supplement 1
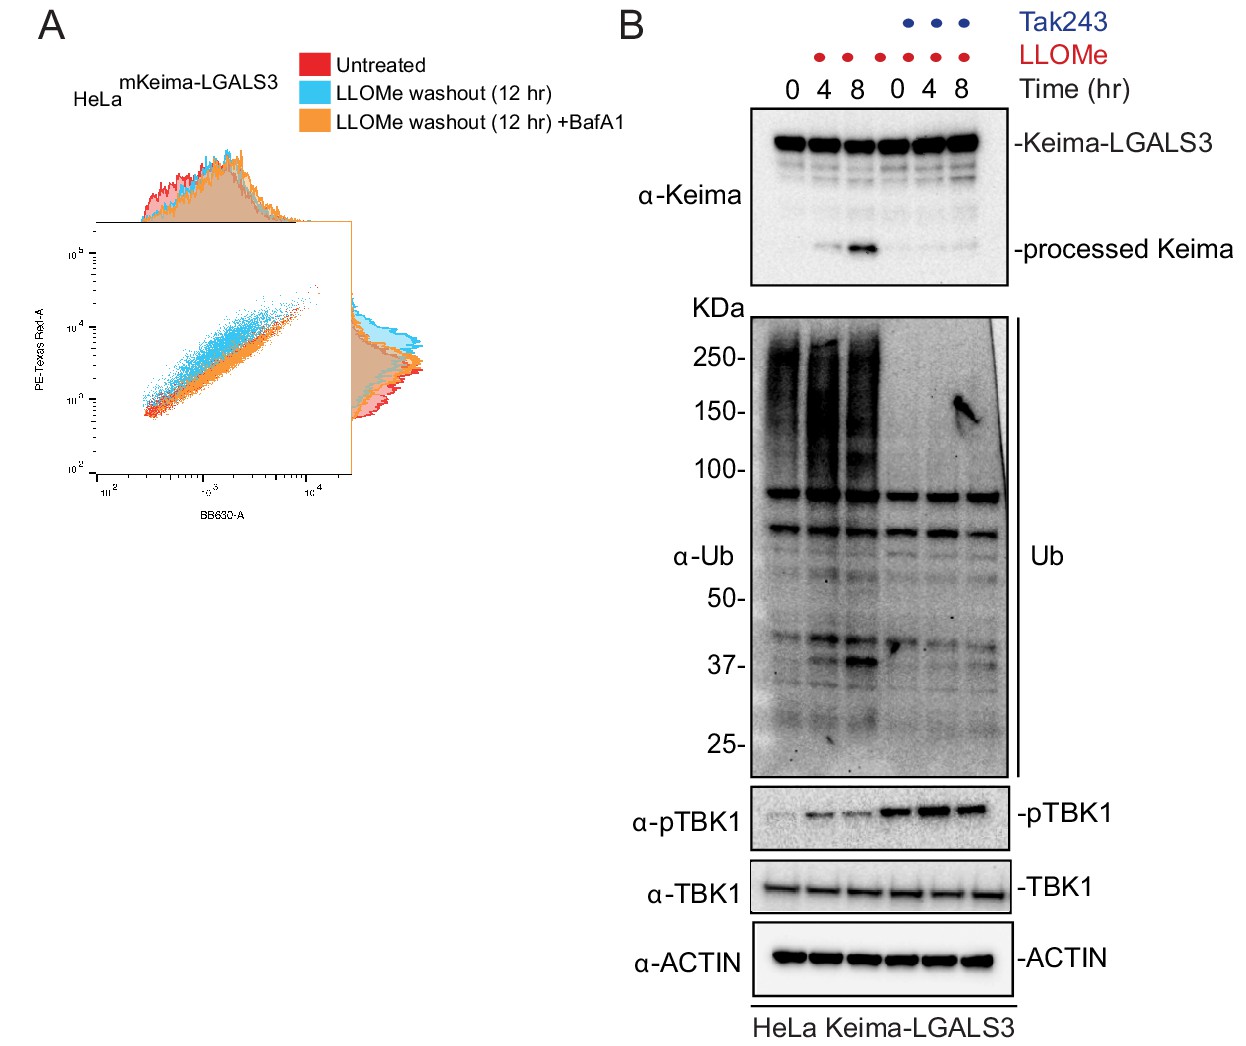
Analysis of lysophagic flux using Lyso-Keima.
(A) Raw flow cytometry data. HeLa cells expressing Keima-LGALS3 were either left untreated (red), or treated for 1 hr followed by washout (12 hr) with (orange) or without (blue) addition of BafA. Cells were then subjected to flow cytometry to measure the 561 nm/488 nm ratio. (B) HeLa cells expressing Keima-LGALS3 were treated with LLOMe (1 hr) prior to washout for 4 or 8 hr. In one set of samples, the E1 inhibitor TAK243 at 2 μM was added prior to damage. Cell extracts at the indicated time were subjected to immunoblotting with the indicated antibodies.
-
Figure 5—figure supplement 1—source data 1
Uncropped blots.
- https://cdn.elifesciences.org/articles/72328/elife-72328-fig5-figsupp1-data1-v2.pdf
Figure 6 with 1 supplement
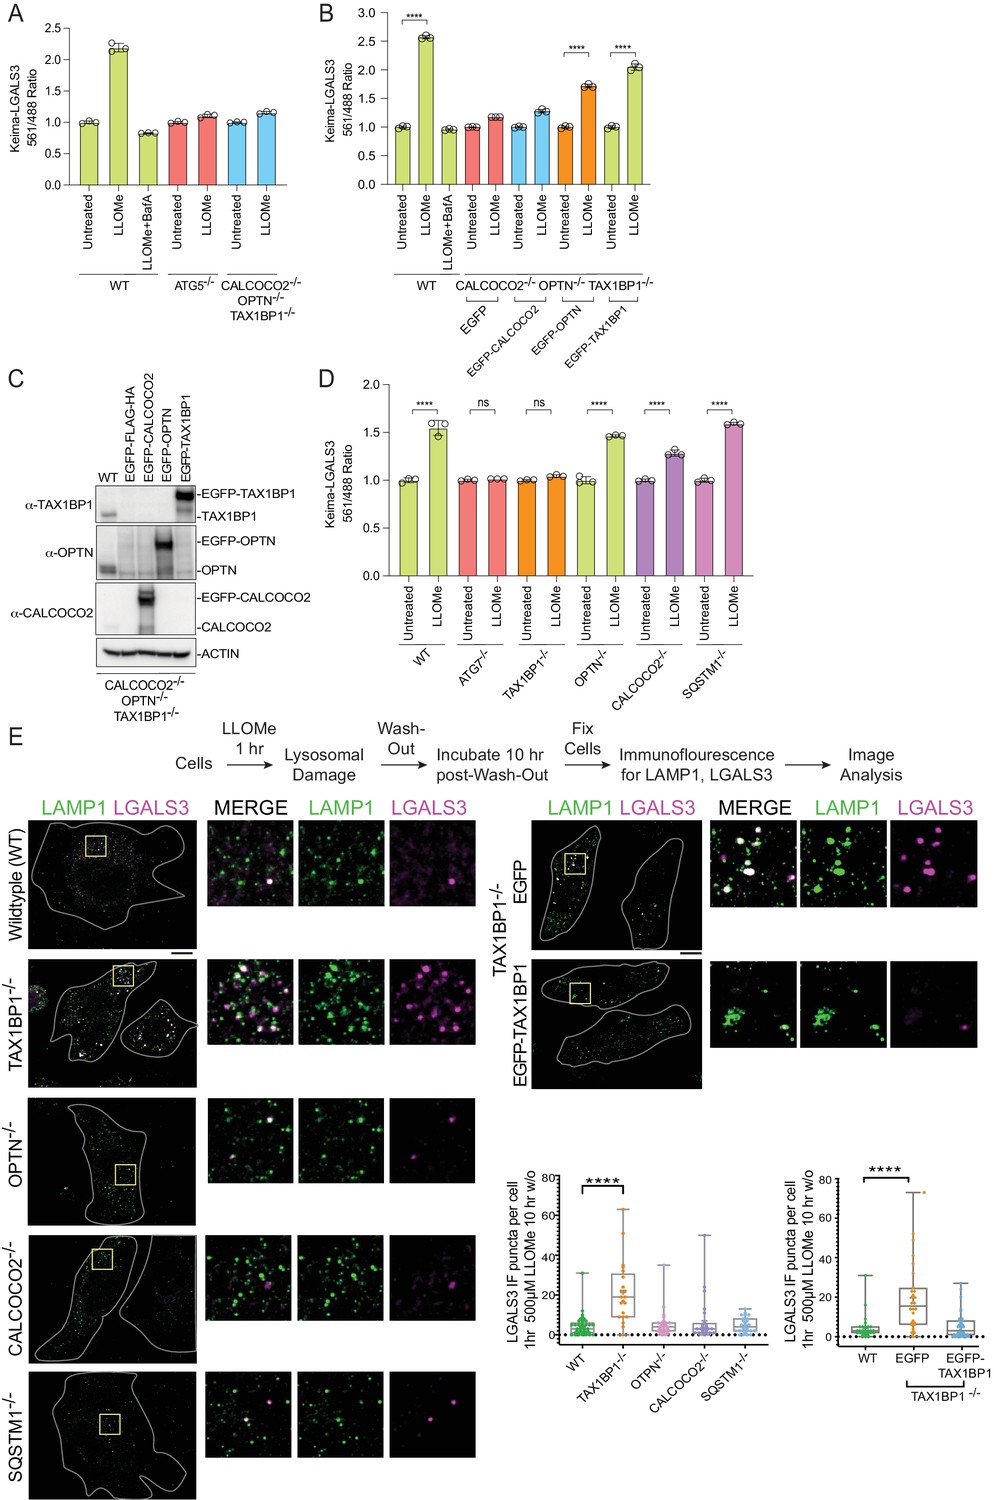
Role for Ub-binding autophagy receptors in lysophagy.
(A) Triplicate WT; ATG5−/−; or OPTN−/−; TAX1BP1−/−; CALCOCO2−/− (TKO) HeLa cells expressing Keima-LGALS3 were either left untreated or treated for 1 hr followed by washout (12 hr) prior to flow cytometry to measure the 561 nm/488 nm ratio. All values are normalized to the untreated sample within each genotype. The plot represents mean and standard deviation from three biological replicates. (B) Triplicate WT or TKO HeLa cells expressing Keima-LGALS3 were reconstituted with lentivirally expressed EGFP-FLAG-HA, EGFP-CALCOCO2, EGFP-OPTN, or EGFP-TAX1BP1. Cells were either left untreated or treated for 1 hr followed by washout (12 hr) prior to flow cytometry to measure the 561 nm/488 nm ratio. As a control for lysophagic flux, some samples were also treated with BafA during the washout. All values are normalized to the untreated sample within each genotype. ****p < 0.0001. The plot represents mean and standard deviation from three biological replicates. (C) Cells from panel B were lysed and subjected to immunoblotting with the indicated antibodies. (D) HeLa cells expressing Keima-LGALS3 (with or without deletion of ATG7, TAX1BP1, OPTN, CALCOCO2, or SQSTM1) were either left untreated or treated for 1 hr followed by washout (12 hr) prior to flow cytometry to measure the 561 nm/488 nm ratio. All values are normalized to the untreated sample within each genotype. ****p < 0.0001. The plot represents mean and standard deviation from three biological replicates. (E) HeLa cells (with or without deletion of TAX1BP1, OPTN, CALCOCO2, or SQSTM1) were either left untreated or treated for 1 hr followed by washout (10 hr) prior to immunostaining with α-LAMP1 (green) and α-LGALS3 (magenta). The number of LGALS3 puncta per cell present after washout is plotted (right top panel). The block to lysophagic flux was rescued by expression of EGFP-TAX1BP1 but not EGFP (lower right panel). 41 (WT), 21 (TAX1BP1), 25 (OPTN), 21 (CALCOCO2), and 27 (SQSTM1) cells were analyzed in the upper graph. 29 (WT), 28 (EGFP), and 32 (EGFP-TAX1BP1) cells were analyzed in the bottom graph. ****p < 0.0001. Scale bar 10 μm. Zoom-in panels, 10 μm × 10 μm. + marks the mean and the line is at the median. The plot represents merged data from three biological replicates.
-
Figure 6—source data 1
561/488 Keima ratios for Figure 6A.
- https://cdn.elifesciences.org/articles/72328/elife-72328-fig6-data1-v2.xlsx
-
Figure 6—source data 2
561/488 Keima ratios for Figure 6B.
- https://cdn.elifesciences.org/articles/72328/elife-72328-fig6-data2-v2.xlsx
-
Figure 6—source data 3
561/488 Keima ratios for Figure 6D.
- https://cdn.elifesciences.org/articles/72328/elife-72328-fig6-data3-v2.xlsx
-
Figure 6—source data 4
The number of galectin puncta per cell post-washout for Figure 6E.
- https://cdn.elifesciences.org/articles/72328/elife-72328-fig6-data4-v2.xlsx
-
Figure 6—source data 5
Uncropped blots for Figure 6C.
- https://cdn.elifesciences.org/articles/72328/elife-72328-fig6-data5-v2.pdf
Figure 6—figure supplement 1

Characterization of Ub-cargo receptor mutant cell lines.
(A–E) Validation of gene edited cell lines by immunoblotting. The location of the target exon and CRISPR guide sequence used for targeting are shown. Extracts from the indicated cells were then subjected to immunoblotting with actin used as a loading control.
-
Figure 6—figure supplement 1—source data 1
Uncropped blots.
- https://cdn.elifesciences.org/articles/72328/elife-72328-fig6-figsupp1-data1-v2.pdf
Figure 7 with 1 supplement
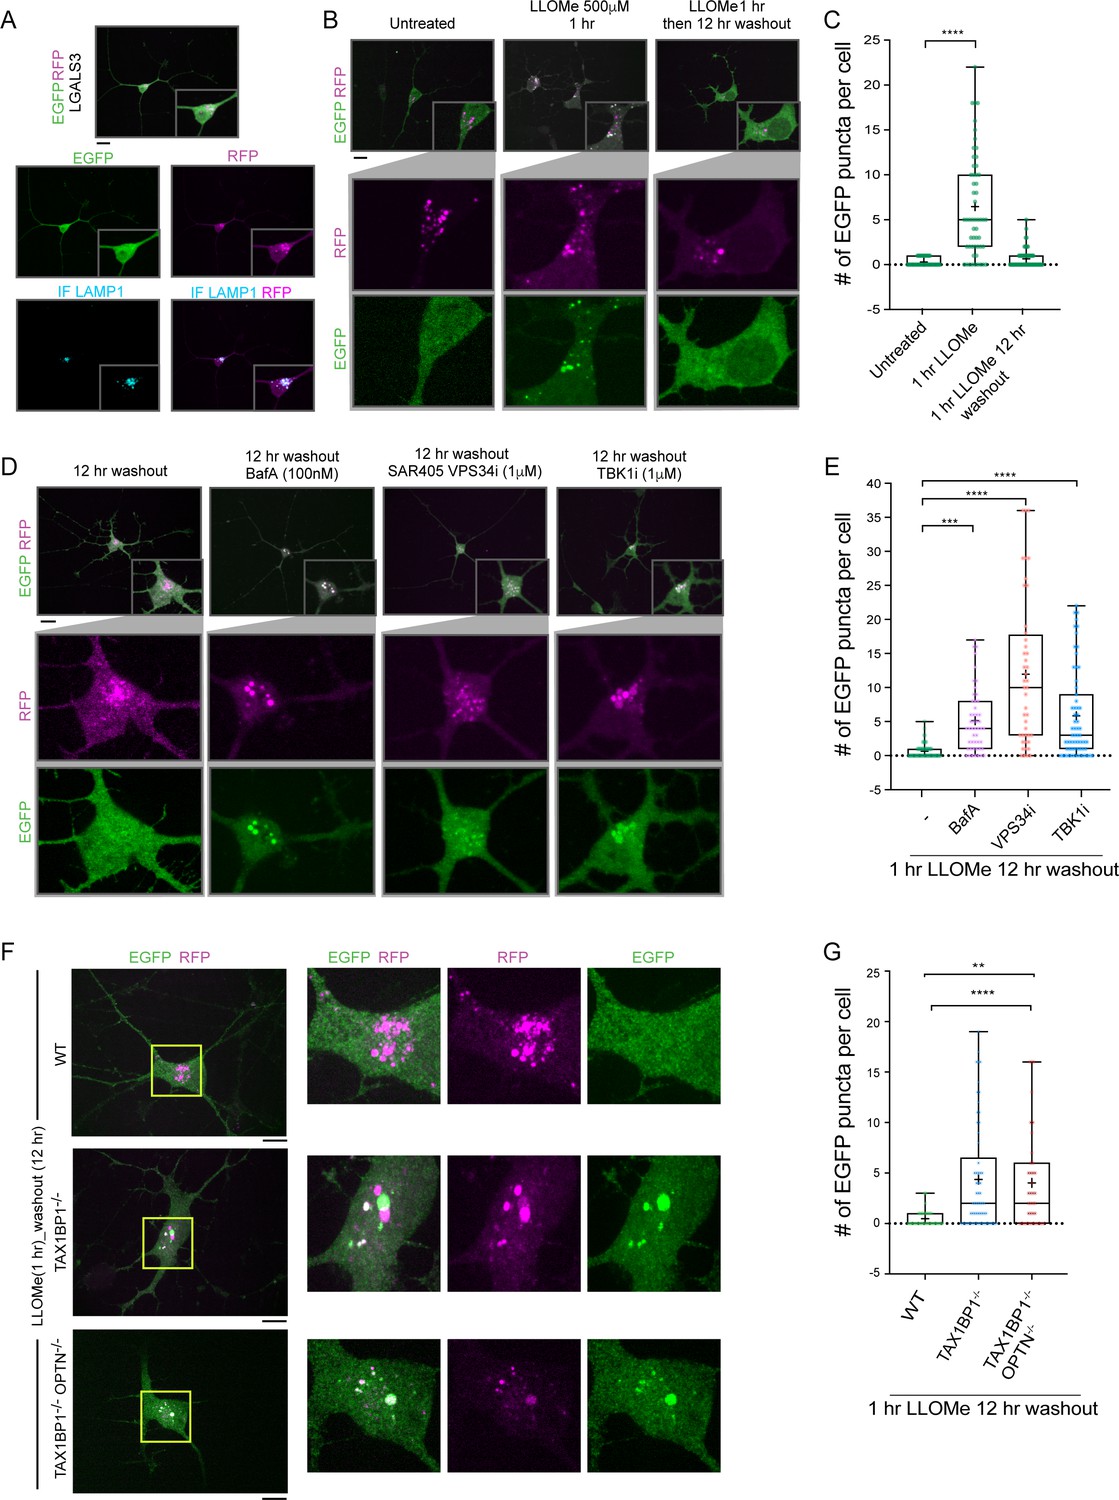
TAX1BP1 promotes lysophagic flux in iNeurons.
(A) RFP-EGFP-LGALS3 is trafficked to lysosomes in iNeurons. ES cells expressing RFP-EGFP-LGALS3 via a PiggyBac vector were converted to iNeurons using inducible NGN2 (see Materials and methods) and imaged for EGFP, RFP, and LAMP1 using α-LAMP1 antibodies. While EGFP signal was diffusely localized in the soma, RFP-positive puncta colocalized with lysosomes based on colocalization with LAMP1 staining, indicating that a subset of the RFP-EGFP-LGALS3 protein is trafficked to the lysosome under basal conditions. Scale bar = 20 μm. iN soma zoom-in panels, 30 μm × 40 μm. (B) iNeurons expressing RFP-EGFP-LGALS3 were either left untreated, treated with LLOMe for 1 hr, or treated with LLOMe for 1 hr followed by a 12 hr washout. Cells were imaged for EGFP and RFP and the number of EGFP puncta per cell quantified. Loss of EGFP puncta during the washout period is indicative of lysophagic flux. Scale bar = 20 μm. (C) Quantification of EGFP puncta per cell after washout from experiments in panel B. The average EGFP puncta per cell was 0.289 at 0 hr (45 cells), 6.46 at 1 hr LLOMe (55 cells) and 0.652 at 12 hr washout after LLOMe (66 cells). ****p < 0.0001. + marks the mean and the line is at the median. The plot represents merged data from three biological replicates. (D) iNeurons were subjected to LLOMe treatment and washout as in panel B but treated with or without TBK1i, VPS34i, or BafA during the washout period. Cells were imaged for EGFP and RFP. Scale bar = 20 μm. iN soma zoom-in panels, 30 μm × 40 μm. (E) Quantification of EGFP puncta per cell from the experiment in panel D. The average EGFP puncta per cell at 12 hr washout was 0.65 with no inhibitor (66 cells), 5.14 with BafA (49 cells), 11.95 with VPS34i (44 cells), and 5.84 with TBKi (63 cells). ****p < 0.0001, ***p < 0.001. + marks the mean and the line is at the median. The plot represents merged data from three biological replicates. (F) WT, TAX1BP1−/−, or TAX1BP1−/−; OPTN−/− iNeurons were subjected to LLOMe treatment and washout as in panel B. Cells were imaged for EGFP and RFP. Scale bar = 10 μm. iN soma zoom-in panels, 20 μm × 20 μm. (G) Quantification of EGFP puncta per cell from the experiment in panel F. The average EGFP puncta per cell at 12hr washout after LLOMe for wild-type cells was 0.474 (38 cells), for TAX1BP1−/− cells was 4.36 (62 cells) and for TAX1BP1−/−; OPTN−/− cells was 4.03 (39 cells). ****p < 0.0001, **p< 0.01. + marks the mean and the line is at the median. The plot represents merged data from three biological replicates.
-
Figure 7—source data 1
The number of GFP puncta per cell for Figure 7C.
- https://cdn.elifesciences.org/articles/72328/elife-72328-fig7-data1-v2.xlsx
-
Figure 7—source data 2
The number of GFP puncta per cell for Figure 7E.
- https://cdn.elifesciences.org/articles/72328/elife-72328-fig7-data2-v2.xlsx
-
Figure 7—source data 3
The number of GFP puncta per cell for Figure 7G.
- https://cdn.elifesciences.org/articles/72328/elife-72328-fig7-data3-v2.xlsx
Figure 7—figure supplement 1
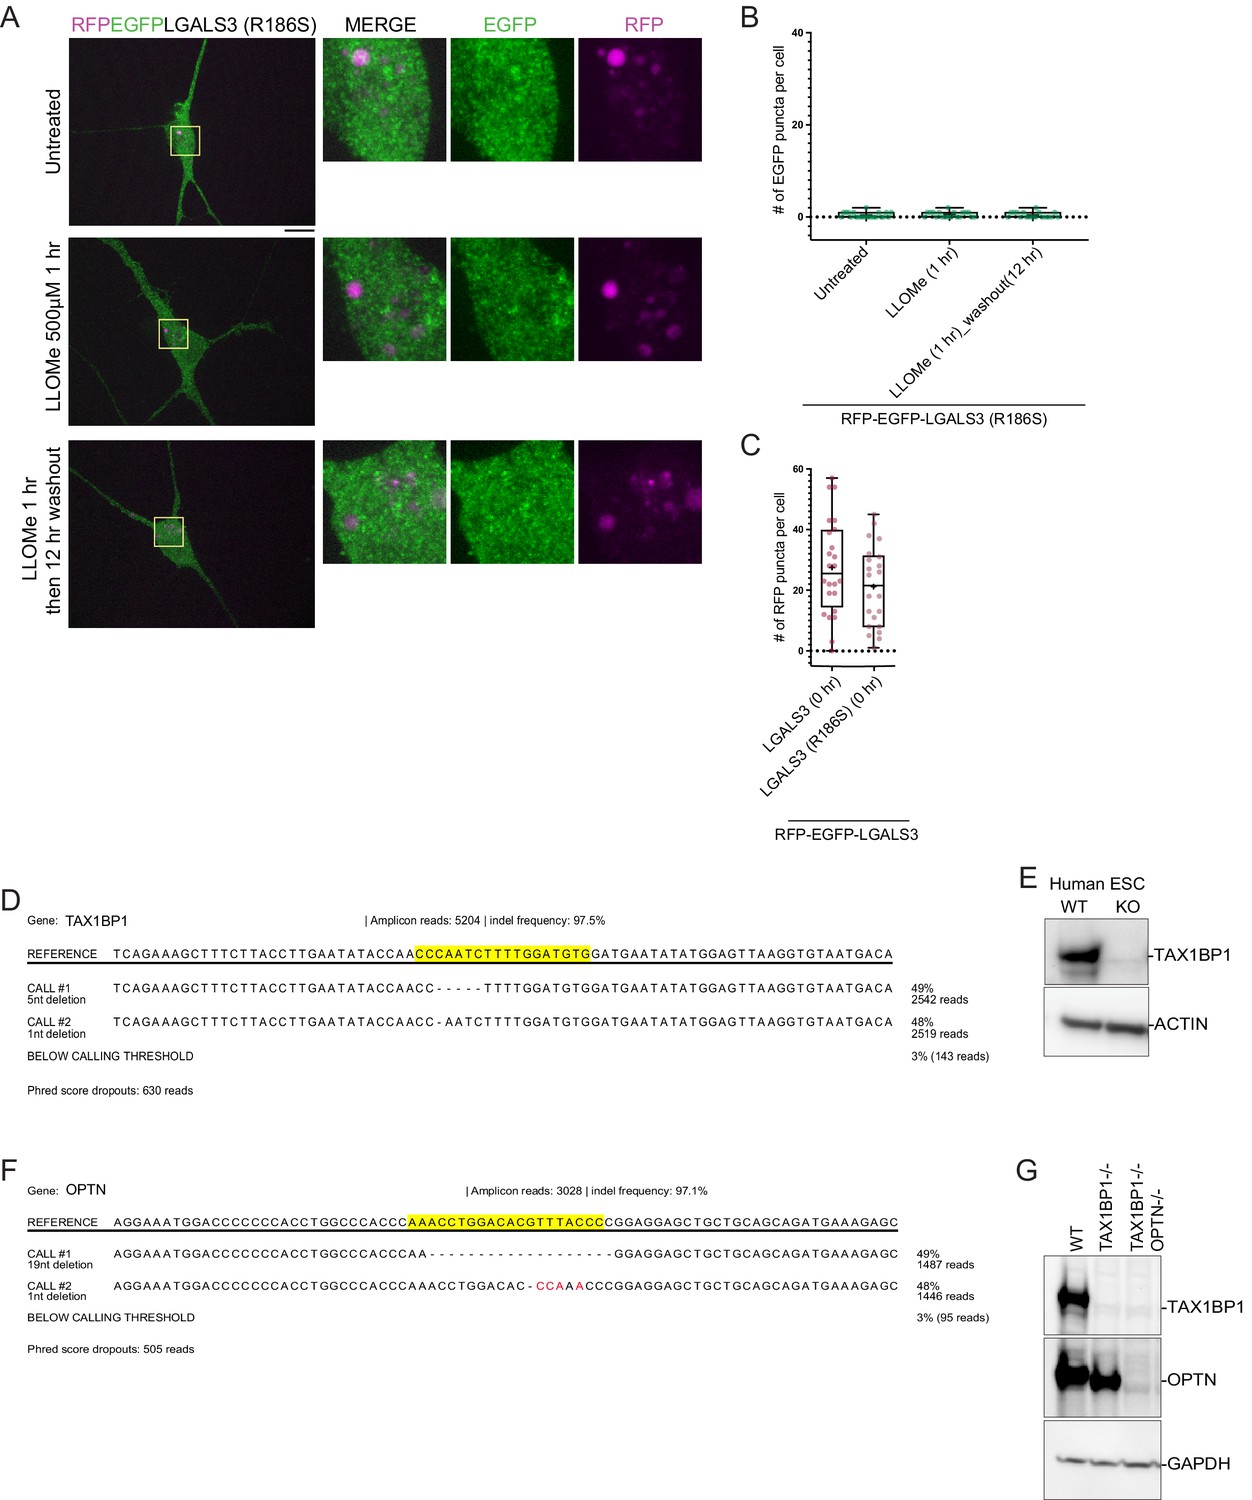
Analysis of LGALS3R186S recruitment to damaged lysosomes in iNeurons.
(A) iNeurons stably expressing RFP-EGFP-LGALS3R186S were either left untreated, treated with LLOMe for 1 hr, or treated with LLOMe for 1 hr followed by a 12hr washout. Cells were imaged for EGFP and RFP. Scale bar = 10 μm. Zoom-in panels, 10 μm × 10 μm. (B) Quantification of GFP puncta per cell after washout from experiments in panel A demonstrates the absence of GFP-positive puncta in response to lysosomal damage. + marks the mean and the line is at the median. The plot represents data from one replicate. (C) RFP-positive puncta in cells expressing RFP-EGFP-LGALS3 WT or the R186S mutant demonstrates comparable number of puncta. + marks the mean and the line is at the median. The plot represents data from one replicate. (D) TAX1BP1 lesion read by Illumina Miseq analysis. (E) Extracts from WT or TAX1BP1−/− ES cells were immunoblotted with the indicated antibodies to demonstrate deletion of TAX1BP1. (F) OPTN lesion read by Illumina Miseq analysis. (G) Extracts from WT, TAX1BP1−/−, or TAX1BP1−/−; OPTN−/− ES cells were immunoblotted with the indicated antibodies to demonstrate deletion of OPTN and TAX1BP1.
-
Figure 7—figure supplement 1—source data 1
The number of EGFP puncta per cell for Figure 7—figure supplement 1B and C.
- https://cdn.elifesciences.org/articles/72328/elife-72328-fig7-figsupp1-data1-v2.xlsx
-
Figure 7—figure supplement 1—source data 2
Uncropped blots for Figure 7—figure supplement 1E, G.
- https://cdn.elifesciences.org/articles/72328/elife-72328-fig7-figsupp1-data2-v2.pdf
Figure 8 with 1 supplement
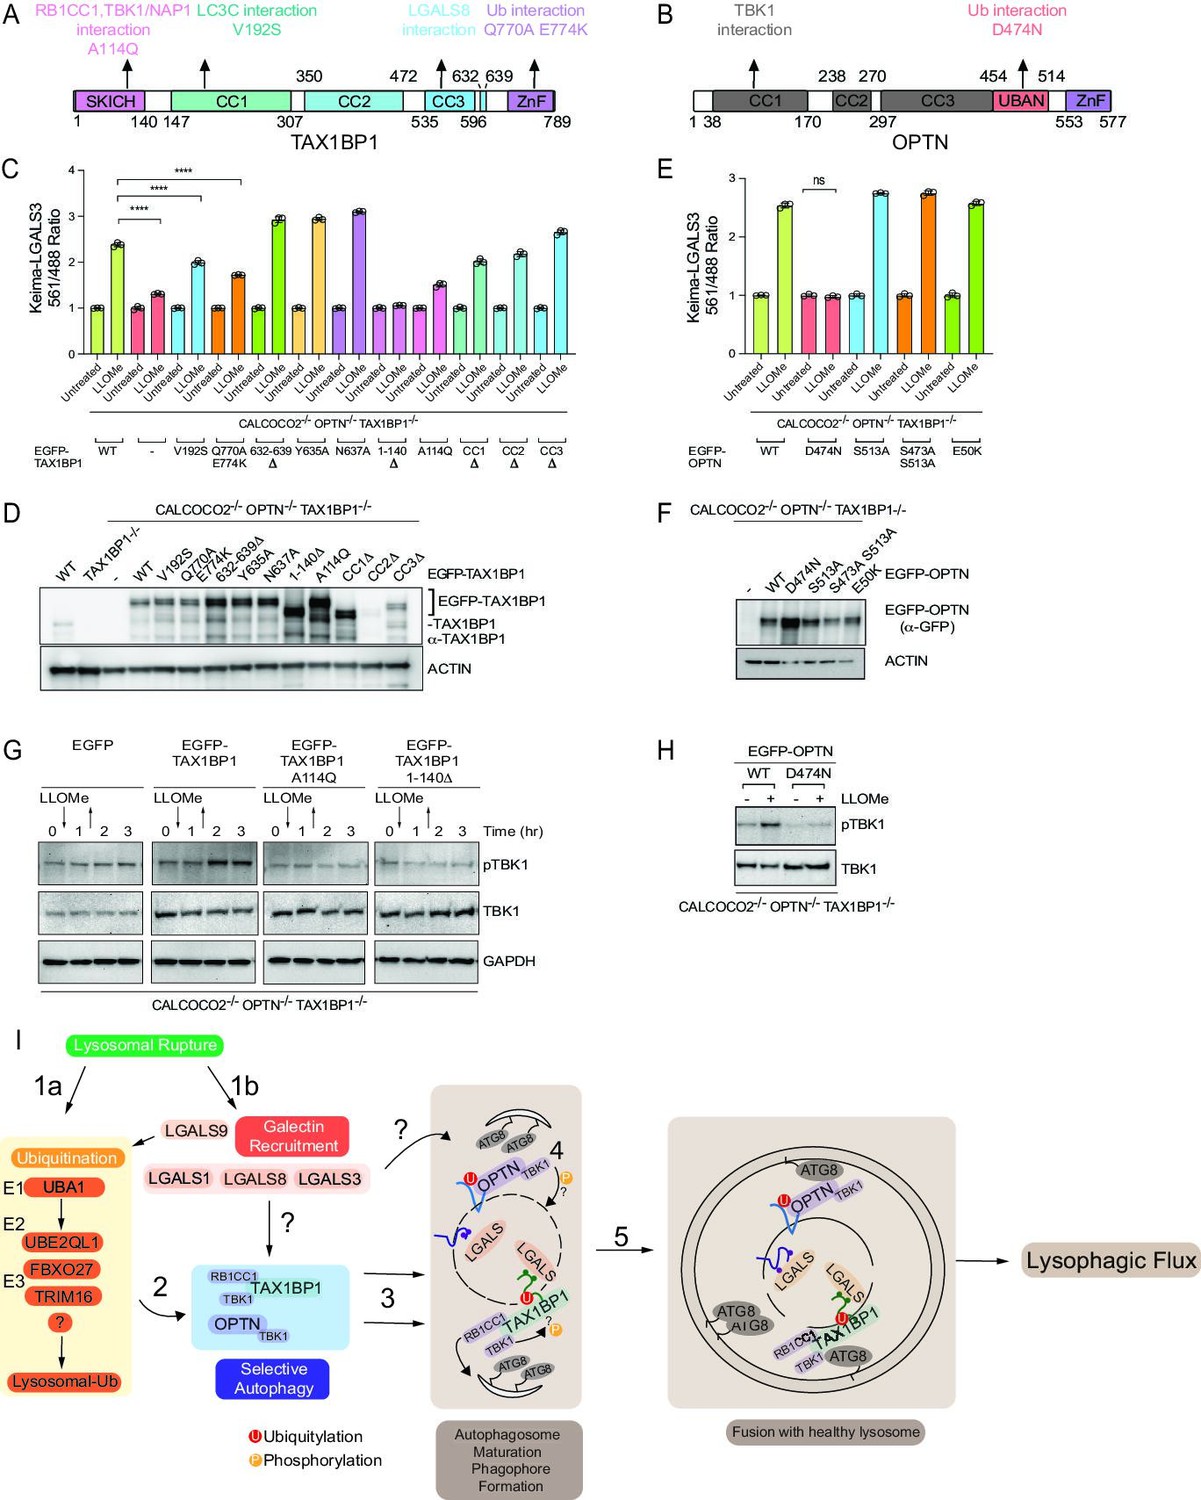
Structure–function analysis of TAX1BP1 and OPTN for lysophagy.
(A) Domain structure of TAX1BP1 showing the location of mutations examined in this study. (B) Domain structure of OPTN showing the location of mutations examined in this study. (C) HeLa TKO cells expressing Keima-LGALS3 were infected with lentiviruses expressing GFP-tagged WT or mutant TAX1BP1 proteins to obtain stable expression. Cells in biological triplicate were either left untreated or treated for 1 hr followed by washout (12 hr) prior to flow cytometry to measure the 561 nm/488 nm ratio. All values are normalized to the untreated sample within each genotype. The plot represents mean and standard deviation from three biological replicates. ****p < 0.0001 (D) Immunoblot of cell extracts from panel C probed with α-TAX1BP1 or α-actin as a loading control. Note that some mutants are highly stabilized, as reported previously (Ohnstad et al., 2020). The EGFP-TAX1BP1 CC2Δ mutant is not detected by western blot due to the loss of the epitope-binding site of the antibody, nevertheless is detected by FACS (Figure 8—figure supplement 1A). (E) HeLa TKO cells expressing Keima-LGALS3 were infected with lentiviruses expressing GFP-tagged WT or mutant OPTN proteins to obtain stable expression. Cells in biological triplicate were either left untreated or treated for 1 hr followed by washout (12 hr) prior to flow cytometry to measure the 561 nm/488 nm ratio. The plot represents mean and standard deviation from three biological replicates. ****p < 0.0001. (F) Immunoblot of cell extracts from panel E probed with α-GFP or α-actin as a loading control. (G) HeLa TKO cells were infected with lentiviruses expressing EGFP-tagged WT or mutant TAX1BP1 proteins to obtain stable expression. Cells were either left untreated or treated for 1 hr with LLOMe followed by washout. Cells were harvested at the indicated times and subjected to immunoblotting with the indicated antibodies. (H) HeLa TKO cells were infected with lentiviruses expressing EGFP-tagged WT or mutant OPTN proteins to obtain stable expression. Cells were either left untreated or treated for 1 hr with LLOMe followed by washout (12 hr). Cells were harvested at the indicated times and subjected to immunoblotting with the indicated antibodies. (I) Model figure. Lysosomal rupture leads to the parallel recruitment of galectins and unleashes a wave of ubiquitination on the lysosome (Steps 1a and b). In step 2, ubiquitination promotes the recruitment of both OPTN-TBK1 and TAX1BP1-TBK1-RB1CC1 complexes to the damage lysosome, thereby promoting de novo phagophore formation and local TBK1 activation to drive efficient lysophagy (Steps 3–5).
-
Figure 8—source data 1
561/488 Keima ratios for Figure 8C.
- https://cdn.elifesciences.org/articles/72328/elife-72328-fig8-data1-v2.xlsx
-
Figure 8—source data 2
561/488 Keima ratios for Figure 8E.
- https://cdn.elifesciences.org/articles/72328/elife-72328-fig8-data2-v2.xlsx
-
Figure 8—source data 3
Uncropped blots for Figure 8.
- https://cdn.elifesciences.org/articles/72328/elife-72328-fig8-data3-v2.pdf
Figure 8—figure supplement 1

Structure–function analysis of TAX1BP1 and OPTN for lysophagy.
(A) Flow cytometry analysis of EGFP-TAX1BP1-CC1Δ, CC2Δ, and CC3Δ cell lines to verify comparable expression of the CC2Δ mutant. (B) Analysis of EGFP, EGFP-TAX1BP1 (WT, Q770A/E774K, Δ SKITCH, and A114Q) as well as EGFP-OPTN (WT and D747N) recruitment to damaged lysosomes (1 hr after LLOMe). Scale bar = 10 μm. (C) Recruitment of endogenous TAX1BP1 (green) to damaged LAMP1-positive lysosomes (pink) was determined by immunofluorescence after 1 hr or LLOMe treatment and a 4hr washout period. ****p < 0.0001. Scale bar = 10 μm. + marks the mean and the line is at the median. The plot represents merged data from two biological replicates.
-
Figure 8—figure supplement 1—source data 1
The number of colocalized TAX1BP1- and LAMP1-positive puncta.
- https://cdn.elifesciences.org/articles/72328/elife-72328-fig8-figsupp1-data1-v2.xlsx
Tables
Key resources table
| Reagent type (species) or resource | Designation | Source or reference | Identifiers | Additional information |
|---|---|---|---|---|
| Cell line (Homo sapiens) | Hela Flp-in-TRex | This paper | Obtained from Brian Raught, Ontario Cancer institute | |
| Cell line (Homo-sapiens) | Hela | ATCC | CCL-2; RRID:CVCL_0030 | |
| Cell line (Homo-sapiens) | HEK293T | ATCC | CRL-1573; RRID:CVCL_0045 | |
| Cell line (Homo-sapiens) | H9 | Wicell | WA9, CVCL_9773;RRID: CVCL_9773 | |
| Antibody | Galectin-1/LGALS1 (D608T) (Rabbit mAb, monoclonal) | Cell Signaling Technology | #12936 S;RRID:AB_2137707 | IF (1:300), WB (1:1000) |
| Antibody | Galectin-3/ LGALS3 (Rabbit Antibody, polyclonal) | Proteintech | 60207–1-I; RRID:AB_10951109 | IF (1:300), WB (1:1000) |
| Antibody | Galectin-3/ LGALS3 Antibody (M3/38) for immunofluorescence (rat, monoclonal) | Santa-Cruz | sc-23938; RRID:AB_627658 | IF (1:300), WB (1:1000) |
| Antibody | Human Galectin-8/LGALS8 Antibody, (goat polyclonal) | R&D Systems | AF1305; RRID:AB_2137229 | IF (1:300), WB (1:1000) |
| Antibody | LC3B D11 (Rabbit mAb, monoclonal) | Cell Signaling Technology | #3868 S; RRID:AB_2137707 | IF (1:300), WB (1:1000) |
| Antibody | GABARAPL2 (D1W9T) (Rabbit mAb, monoclonal) | Cell Signaling Technology | 14256; RRID:AB_2798436 | IF (1:300), WB (1:1000) |
| Antibody | Anti-CALCOCO2 antibody, (Rabbit, polyclonal) | Abcam | ab68588;RRID:AB_1640255 | IF (1:300), WB (1:1000) |
| Antibody | Anti-OPTN (rabbit, polyclonal) | Sigma | HPA003279; RRID:AB_1079527 | IF (1:300), WB (1:1000) |
| Antibody | Anti-TAX1BP1 (rabbit, polyclonal) | Sigma | HPA024432;RRID:AB_1857783 | IF (1:300), WB (1:1000) |
| Antibody | SQSTM1 monoclonal antibody (M01), clone 2C11 (mouse, monoclonal) | Abnova | H00008878-M01;RRID: AB_437085 | IF (1:300), WB (1:1000) |
| Antibody | Raptor (24C12) (Rabbit, monoclonal) | Cell Signaling Technology | #2280 S;RRID:AB_561245 | IF (1:300), WB (1:1000) |
| Antibody | mTOR (7C10) (Rabbit, monoclonal) | Cell Signaling Technology | #2983; RRID:AB_2105622 | IF (1:300), WB (1:1000) |
| Antibody | NPC1(Rabbit, monoclonal) | Abcam | ab134113;RRID: AB_2734695 | IF (1:300), WB (1:1000) |
| Antibody | LAMP1 (D2D11) Rabbit (Rabbit, monoclonal) | Cell Signaling Technology | #9091 S; RRID:AB_2687579 | IF (1:300), WB (1:1000) |
| Antibody | LAMP1 (D401S) (Mouse, monoclonal) | Cell Signaling Technology | #15665 S;RRID: AB_2798750 | IF (1:300), WB (1:1000) |
| Antibody | Anti-TMEM192 antibody [EPR14330] (Rabbit, monoclonal) | Abcam | ab185545, Discontinued | IF (1:300), WB (1:1000) |
| Antibody | Anti-HA,(Mouse, monoclonal) | Biolegend | #901513;RRID:AB_2565335 | IF (1:300), WB (1:1000) |
| Antibody | Anti-Flag M2 (mouse, monoclonal) | Sigma | F1804;RRID: AB_262044 | IF (1:300), WB (1:1000) |
| Antibody | Anti-Keima-Red (Mouse, monoclonal) | MBL international | M182-3M;RRID: AB_10794910 | IF (1:300), WB (1:1000) |
| Antibody | phospho-TBK1/NAK (Ser172) (D52C2) (Rabbit, monoclonal) | Cell Signaling Technology | #5483 S; RRID:AB_10693472 | IF (1:300), WB (1:1000) |
| Antibody | TBK1/NAK (Rabbit, polyclonal) | Cell Signaling Technology | #3013 S;RRID: AB_2199749 | IF (1:300), WB (1:1000) |
| Antibody | beta-actin (mouse, monoclonal) (AC-15) | Santa Cruz | sc-69879;RRID: AB_1119529 | IF (1:300), WB (1:1000) |
| Antibody | Anti-GFP (Mouse, monoclonal) | Roche | #11814460001;RRID:AB_390913 | IF (1:300), WB (1:1000) |
| Strain, strain background (Escherichia coli) | DH5 alpha E. coli competent cells | Homemade | ||
| Strain, strain background (E. coli) | T1R E. coli Competent cells | Homemade | ||
| Chemical compound, drug | Gly-Phe-β-naphthylamide | Cayman Chemical | #14634 | |
| Chemical compound, drug | l-Leucyl-l-Leucine methyl ester (hydrochloride) | Cayman Chemical | #16008 | |
| Chemical compound, drug | Biotin Tyramide | Iris Biotech(peptide solutions) | LS-3500.0250 | |
| Chemical compound, drug | Trolox | Cayman Chemical | #53188-07-1 | |
| Chemical compound, drug | Hydrogen peroxide solution | Sigma | H1009 | |
| Chemical compound, drug | Pierce Anti-HA Magnetic Beads | Thermo Scientific | #88837 | |
| Chemical compound, drug | TMTpro 16-plex Label Reagent Set | Thermo Scientific | A44520 | |
| Chemical compound, drug | IKKε/TBK1 Inhibitor II, MRT67307 | EMD millipore | CAS 1190378-57-4 | |
| Chemical compound, drug | ULK1 inhibitor, MRT68921 | Cayman chemical | #1190379-70-4 | |
| Chemical compound, drug | TAK-243 | SelleckChem | S8341 | |
| Chemical compound, drug | CB-5083 | Cayman Chemical | S810 | |
| Chemical compound, drug | Bafilomycin A1 | Cayman Chemical | #88899-55-2 | |
| Commercial assay or kit | Lipofectamine 3,000 | Invitrogen | L3000008 | |
| Commercial assay or kit | Pierce High pH Reversed-Phase Peptide Fractionation Kit | ThermoFisher Scientific | #84868 | |
| Commercial assay or kit | Pierce High Capacity Streptavidin Agarose | Pierce (Thermo Scientific) | #20359 | |
| Chemical compound, drug | PhosSTOP | Sigma-Aldrich | T10282 | |
| Chemical compound, drug | Puromycin | Gold Biotechnology | Gold Biotechnology | |
| Chemical compound, drug | DAPI | Thermo Fisher Scientific | D1306 | |
| Chemical compound, drug | Protease inhibitor cocktail | Sigma-Aldrich | P8340 | |
| Chemical compound, drug | TCEP | Gold Biotechnology | TCEP2 | |
| Chemical compound, drug | Formic Acid | Sigma-Aldrich | #94318 | |
| Peptide, recombinant protein | Trypsin | Promega | V511C | |
| Peptide, recombinant protein | Lys-C | 129–02541 | ||
| Commercial assay or kit | Trypan Blue Stain Thermo Fisher Scientific | Wako Chemicals | 129–02541 w | |
| Commercial assay or kit | BioRad Protein Assay Dye Reagent Concentrate | Bio-Rad | 5000006 | |
| Chemical compound, drug | Urea | Sigma | U5378 | |
| Chemical compound, drug | EPPS | Sigma-Aldrich | E9502 | |
| Chemical compound, drug | 2-Chloroacetamide | Sigma-Aldrich | C0267 | |
| Other | Empore SPE Disks C18 3 M | Sigma-Aldrich | #66883 U | |
| Commercial assay or kit | Pierce Quantitative Colorimetric Peptide Assay | Thermo Fisher Scientific | #23275 | |
| Recombinant DNA reagent | pHAGE-EGFP-NDP52 | Heo et al., 2015 | Addgene #175749;RRID:Addgene_175749 | |
| Recombinant DNA reagent | pHAGE-EGFP-OPTN | Heo et al., 2015 | Addgene #175750;RRID:Addgene_175750 | |
| Recombinant DNA reagent | pHAGE-APEX2-FLAG-GABARAPL2 | This paper | RRID:Addgene_175751 | Addgene #175751 |
| Recombinant DNA reagent | pHAGE-APEX2-FLAG-GABARAPL2Y49A/L50A | This paper | RRID:Addgene_175752 | Addgene #175752 |
| Recombinant DNA reagent | pHAGE-APEX2-FLAG-MAP1LC3B | This paper | RRID:Addgene_175753 | Addgene #175753 |
| Recombinant DNA reagent | pHAGE-APEX2-FLAG-MAP1LC3BK51A | This paper | RRID:Addgene_175754 | Addgene #175754 |
| Recombinant DNA reagent | pHAGE-APEX2-FLAG-LGALS1 | This paper | RRID:Addgene_175755 | Addgene #175755 |
| Recombinant DNA reagent | pHAGE-APEX2-FLAG-LGALS3 | This paper | RRID:Addgene_175756 | Addgene #175756 |
| Recombinant DNA reagent | pHAGE-APEX2-FLAG-GFP | This paper | RRID:Addgene_175757 | Addgene #175757 |
| Recombinant DNA reagent | pHAGE-APEX2-FLAG-LGALS8 | This paper | RRID:Addgene_175758 | Addgene #175758 |
| Recombinant DNA reagent | pHAGE-APEX2-FLAG-CALCOCO2 | This paper | RRID:Addgene_175759 | Addgene #175759 |
| Recombinant DNA reagent | pHAGE-APEX2-FLAG-OPTN | This paper | RRID:Addgene_175760 | Addgene #175760 |
| Recombinant DNA reagent | pHAGE-APEX2-FLAG-TAX1BP1 | This paper | RRID:Addgene_175761 | Addgene #175761 |
| Recombinant DNA reagent | pHAGE-EGFP-OPTN D474N | This paper | RRID:Addgene_175762 | Addgene #175762 |
| Recombinant DNA reagent | pHAGE-EGFP-OPTN S473A 513 A | This paper | RRID:Addgene_175763 | Addgene #175763 |
| Recombinant DNA reagent | pHAGE-EGFP-OPTN S513A | This paper | RRID:Addgene_175764 | Addgene #175764 |
| Recombinant DNA reagent | pHAGE-EGFP-OPTN E50K | This paper | RRID:Addgene_175765 | Addgene #175765 |
| Recombinant DNA reagent | pHAGE-EGFP-TAX1BP1 | This paper | RRID:Addgene_175766 | Addgene #175766 |
| Recombinant DNA reagent | pHAGE-EGFP-TAX1BP1 A114Q | This paper | RRID:Addgene_175767 | Addgene #175767 |
| Recombinant DNA reagent | pHAGE-EGFP-TAX1BP1 SKICH (1-140Δ) | This paper | RRID:Addgene_175768 | Addgene #175768 |
| Recombinant DNA reagent | pHAGE-EGFP-TAX1BP1 V192S | This paper | RRID:Addgene_175769 | Addgene #175769 |
| Recombinant DNA reagent | pHAGE-EGFP-TAX1BP1 Q770A E774K | This paper | RRID:Addgene_175770 | Addgene #175770 |
| Recombinant DNA reagent | pHAGE-EGFP-TAX1BP1 632-639Δ | This paper | RRID:Addgene_175771 | Addgene #175771 |
| Recombinant DNA reagent | pHAGE-EGFP-TAX1BP1 Y635A | This paper | RRID:Addgene_175772 | Addgene #175772 |
| Recombinant DNA reagent | pHAGE-EGFP-TAX1BP1 N637A | This paper | RRID:Addgene_175773 | Addgene #175773 |
| Recombinant DNA reagent | pHAGE-EGFP-TAX1BP1 CC1Δ | This paper | RRID:Addgene_175774 | Addgene #175774 |
| Recombinant DNA reagent | pHAGE-EGFP-TAX1BP1 CC2Δ | This paper | RRID:Addgene_175775 | Addgene #175775 |
| Recombinant DNA reagent | pHAGE-EGFP-TAX1BP1 CC3Δ | This paper | RRID:Addgene_175776 | Addgene #175776 |
| Recombinant DNA reagent | pSMART Tmem192-3X HA (targeting vector for genomic tagging) | This paper | RRID:Addgene_175777 | Addgene #175777 |
| Recombinant DNA reagent | pAC150 RFP-EGFP-LGALS3 | This paper | RRID:Addgene_175778 | Addgene #175778 |
| Recombinant DNA reagent | pAC150 RFP-EGFP-LGALS3 R186S | This paper | RRID:Addgene_175779 | Addgene #175779 |
| Recombinant DNA reagent | pHAGE-mKeima-LGALS3 | This paper | RRID:Addgene_175780 | Addgene #175780 |
| Recombinant DNA reagent | pCMV-hyBase-hyperactive piggyBac | Yusa et al., 2011 | ||
| Software, algorithm | Prism | GraphPad, V9 | https://www.graphpad.com/scientificsoftware/ prism/ | |
| Software, algorithm | SEQUEST | Eng et al., 1994 | N/A | |
| Software, algorithm | Flowjo | Flowjo, v10.7 | https://www.flowjo.com | |
| Software, algorithm | Perseus | Perseus v1.6.15.0Tyanova et al., 2016 | https://maxquant.org/perseus/ | |
| Software, algorithm | Fiji | ImageJ V.2.0.0 | https://imagej.net/software/fiji/ | |
| Software, algorithm | Imagelab | BioRad, v6.0.1 | https://www.bio-rad.com/en-us/product/image-lab-software?ID=KRE6P5E8Z&source_wt=imagelabsoftware_surl | |
| Software, algorithm | Cell Profiler | CellProfiler v4.0.6 | https://cellprofiler.org/ | |
| Software, algorithm | Metamorph | Metamorph v | https://www.moleculardevices.com/products/cellular-imaging-systems/acquisition-and-analysis-software/metamorph-microscopy#gref |
Additional files
-
Supplementary file 1
Quantitative proteomic analysis of lysosomes purified from HeLa cells.
See Supplementary file 6 for details.
- https://cdn.elifesciences.org/articles/72328/elife-72328-supp1-v2.xlsx
-
Supplementary file 2
Quantitative proteomic analysis of lysosomes in response to lysosomal damage with GPN (time course).
See Supplementary file 6 for details.
- https://cdn.elifesciences.org/articles/72328/elife-72328-supp2-v2.xlsx
-
Supplementary file 3
Proximity biotinylation of APEX1-GABARAPL2 and APEX2-MAP1LC3B in response to lysosomal damage with LLOMe.
See Supplementary file 6 for details.
- https://cdn.elifesciences.org/articles/72328/elife-72328-supp3-v2.xlsx
-
Supplementary file 4
Proximity biotinylation of APEX1-LGALS1, LGALS3, LGALS8 and CALCOCO2 in response to lysosomal damage with LLOMe.
See Supplementary file 6 for details.
- https://cdn.elifesciences.org/articles/72328/elife-72328-supp4-v2.xlsx
-
Supplementary file 5
Proximity biotinylation of APEX1-OPTN, TAX1BP1, and SQSTM1 in response to lysosomal damage with LLOMe.
See Supplementary file 6 for details.
- https://cdn.elifesciences.org/articles/72328/elife-72328-supp5-v2.xlsx
-
Supplementary file 6
List of corresponding experiments for .RAW files submitted to ProteomeXchange Consortium via the PRIDEpartner respository.
- https://cdn.elifesciences.org/articles/72328/elife-72328-supp6-v2.xlsx
-
Transparent reporting form
- https://cdn.elifesciences.org/articles/72328/elife-72328-transrepform1-v2.docx
Download links
A two-part list of links to download the article, or parts of the article, in various formats.
Downloads (link to download the article as PDF)
Open citations (links to open the citations from this article in various online reference manager services)
Cite this article (links to download the citations from this article in formats compatible with various reference manager tools)
Quantitative proteomics reveals the selectivity of ubiquitin-binding autophagy receptors in the turnover of damaged lysosomes by lysophagy
eLife 10:e72328.
https://doi.org/10.7554/eLife.72328


