Constitutive loss of DNMT3A causes morbid obesity through misregulation of adipogenesis
- Stem Cells and Regenerative Medicine Center, Baylor College of Medicine, United States
- Department of Molecular and Cellular Biology, Baylor College of Medicine, United States
- Department of Molecular and Human Genetics, Baylor College of Medicine, United States
- Graduate Program in Translational Biology and Molecular Medicine, Baylor College of Medicine, United States
- Institute of Molecular Medicine, McGovern Medical School at the University of Texas Health Science Center, United States
- Center for Metabolic and Degenerative Disease, Institute of Molecular Medicine, McGovern Medical School, University of Texas Health Science Center at Houston, United States
- Division of Endocrinology, Diabetes, and Metabolism, Department of Medicine, Baylor College of Medicine, United States
- Department of Pediatrics, Baylor College of Medicine and Texas Children's Hospital, United States
Figures
Figure 1 with 1 supplement

Dnmt3a-HET mice become overweight and develop obesity.
(A) Weight of male Dnmt3a-HET (HET, n=14) and WT (n=12) littermates on regular chow. * p=0.03, ***<p = 0.001 as determined by two-way ANOVA. (B) Distribution of weight from HET and WT mice females and males at 1 year of age. Dashed lines indicate 3 standard deviations (SD) above the mean of the WT. (C) Representative display of D3A-HET and WT mice at 1 year Left: D3A-HET and WT mice at 1 year. Right: dual energy X-ray absorptiometry (DEXA) analysis of 6-month-old WT and HET mice. Top: Representative image displaying lean (brown color) and fat (grey) tissues. (D) Quantification of fat and lean mass (n=10–14) from DEXA. Statistical analysis 1way ANOVA. (E) Representative H&E staining of gonadal white adipose tissue and BAT from 1-year-old mice. (F) Morphometric analysis of gWAT and BAT adipocyte diameter. ***p<0.001 by 1way ANOVA. (G) Representative staining of liver tissue from 1-year-old WT and 3A-HET littermates. Top: H&E staining. Bottom: Oil Red O lysochrome diazo dye. (H) Quantification of total red droplets from Oil Red O-stained livers (n=3 per group). Statistical analysis one-way ANOVA.
-
Figure 1—source data 1
List of cluster marker genes.
- https://cdn.elifesciences.org/articles/72359/elife-72359-fig1-data1-v1.xlsx
Figure 1—figure supplement 1

Dnmt3a-HET mice recapitulate TBRS phenotypes.
(A) Body weight gain of female Dnmt3a-HET (HET, n=12) compared to their WT (n=14) littermates on regular chow diet starting at 2 months of age. **p=0.02,***, ****p<0.001 by two-way ANOVA. (B) Mouse length nose to rump. p<0.05 by two-tailed unpaired Student’s t test. (C) Displayed percentage of fat from total body weight as measured from dual energy X-ray absorptiometry (DEXA). Fat composition analysis was done on 6 month and 1 year old WT and 3A-HET littermates. **p<0.01, ***p<0.001 by two-way ANOVA. (D) Fat mass of inguinal white adipose tissue (iWAT), gonadal white adipose tissue (gWAT) and brown adipose tissue (BAT) of WT (n=4–5) and 3A-HET (n=5) mice at 1 year. (E) F4\80 quantification in inguinal WAT in 1-year-old HET mice. Adipose tissue was dissected and F4\80+, Cd45 +macrophage cells were quantified by flow cytometry. (F) Adipocyte area as measured in histological sections of inguinal WAT.
Figure 2 with 1 supplement
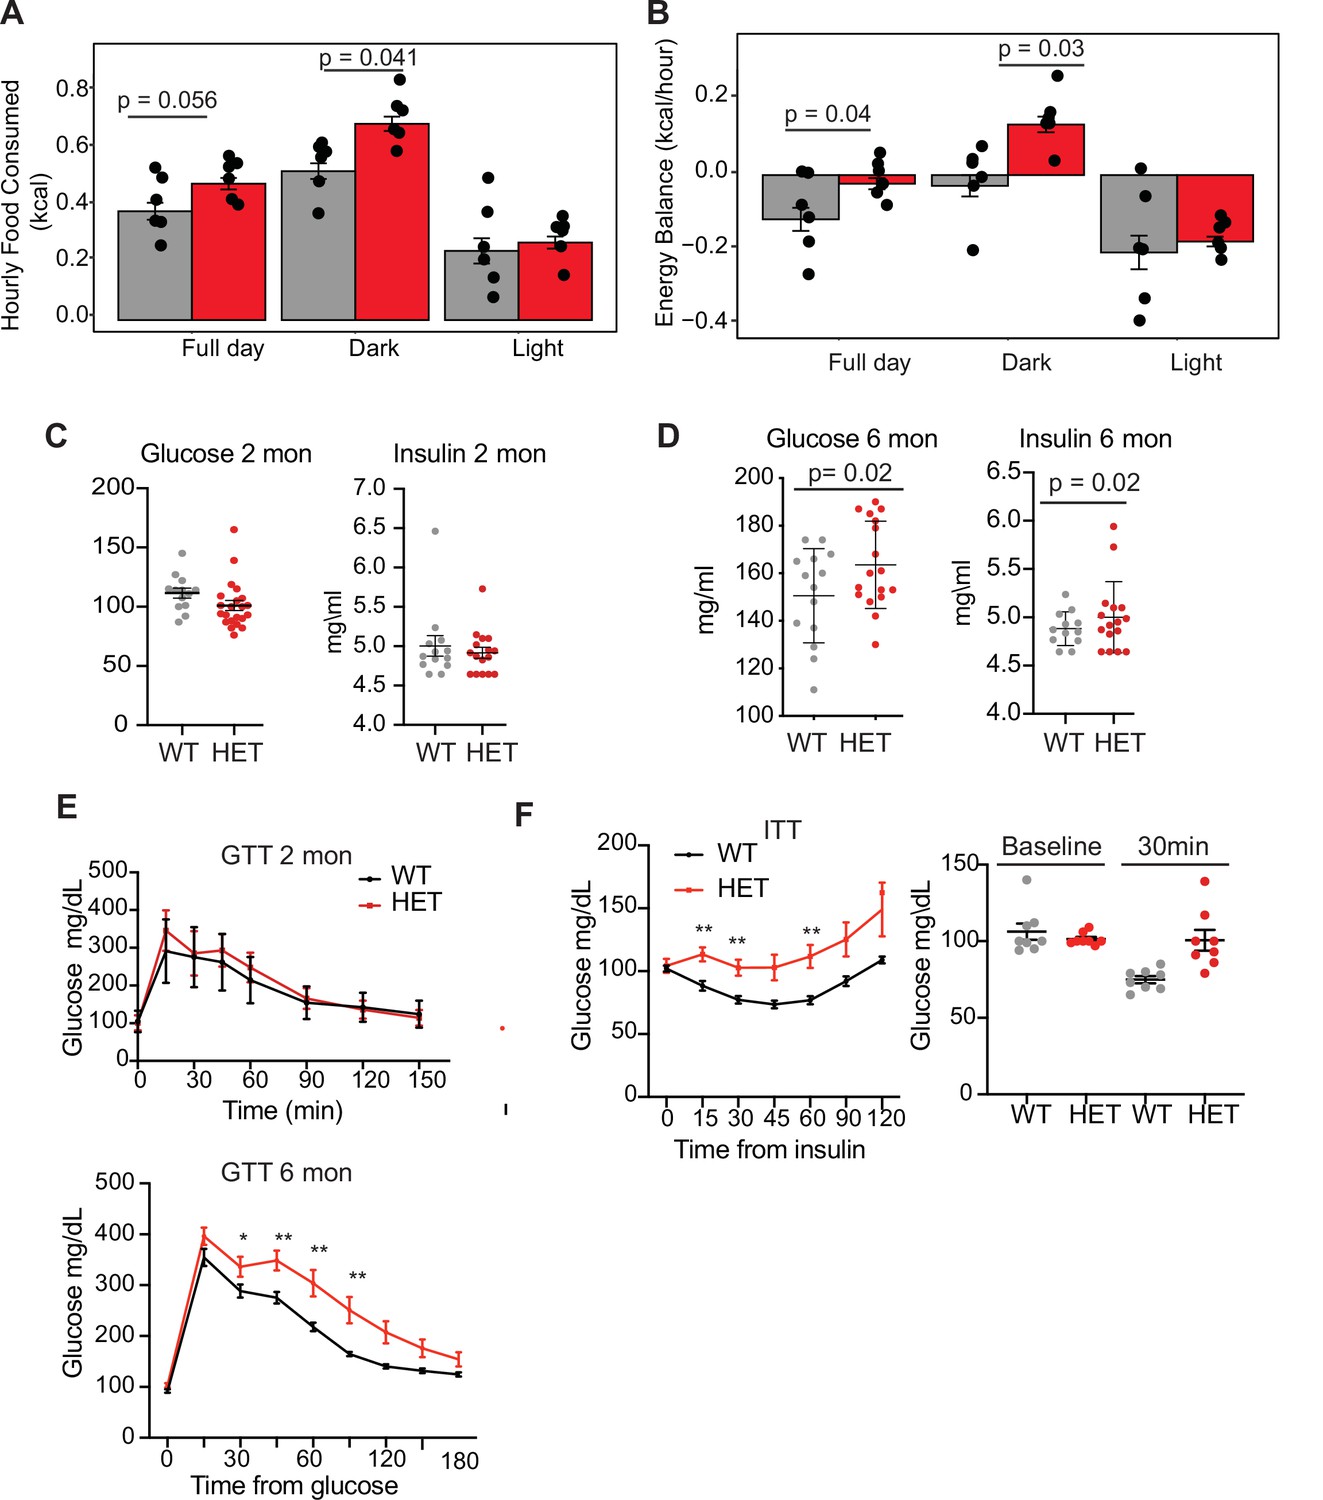
Dnmt3a-HET mice display increased feeding and develop glucose and insulin intolerance.
(A) Average hourly food consumption for WT (3 males and 3 females) and HET mice (3 males and 3 females) as averaged for data collected over 5 days. All analyses for CLAMS was performed using CalR and the Statical analysis ACNOVA. (B) Energy balance calculated from calories consumed versus calories expended. For the mice as in a. (C) Levels of fasting glucose and insulin of WT and HET mice at 2 months of age. All data are expressed as mean ± SEM. (D) Levels of fasting glucose and insulin of WT and HET mice at 6 months of age. All data are expressed as mean ± SEM. (E) Top: Glucose tolerance test at 2 months of age (n=10). Mice were fasted for 12 hr prior to beginning the test. Bottom: Glucose tolerance test at 6 months of age (n=10). Mice were fasted for 12 hr prior to beginning the test. All data are expressed as mean ± SEM. *p<0.05, **p<0.01, ***p<0.0001 by two-way ANOVA. (F) Left: Insulin tolerance test at 10 months of age (n=10). Mice were fasted for 12 hr prior to beginning the test. Right: scatter plot of glucose levels at baseline and at 30 min for the mice used in the analysis. All data are expressed as mean ± SEM. *p<0.05, **p<0.01, ***p<0.001 by two-way ANOVA.
Figure 2—figure supplement 1

Dnmt3a-HET mice display altered metabolic activity.
(A) Quantification of leptin over time. (B) Weight of mice used for CLAMS analysis. No significant weight difference for HET and WT mice at 6 months (M=males, F=females). (C) Trace over time of food consumption for WT and HET mice (3 males and 3 females per group) used for CLAMS analysis. Mice were individually housed and monitored in metabolic cages (CLAMS-HC) and average hourly food consumption was calculated. Gray marks the dark cycle. All data was analyzed by ClaR using ACNOVA for statistical analysis. (D) Energy balance over time analysis was done as in C. (E) Wheel running over time analysis was done as in C. (F) Average wheel running over time analysis was done as in C. (G) Water consumption over time analysis was done as in C. (H) Total water consumption over time analysis was done as in C. (I) Respiratory exchange rate over time analysis was done as in C. (J) Average respiratory exchange rate over time analysis was done as in C. (K) Carbon dioxide (CO2) production over time analysis was done as in C. (L) Average CO2 production over time analysis was done as in C. (M) Oxygen (O2) consumption over time analysis was done as in C. (N) Average O2 consumption over time analysis was done as in C.
Figure 3 with 1 supplement
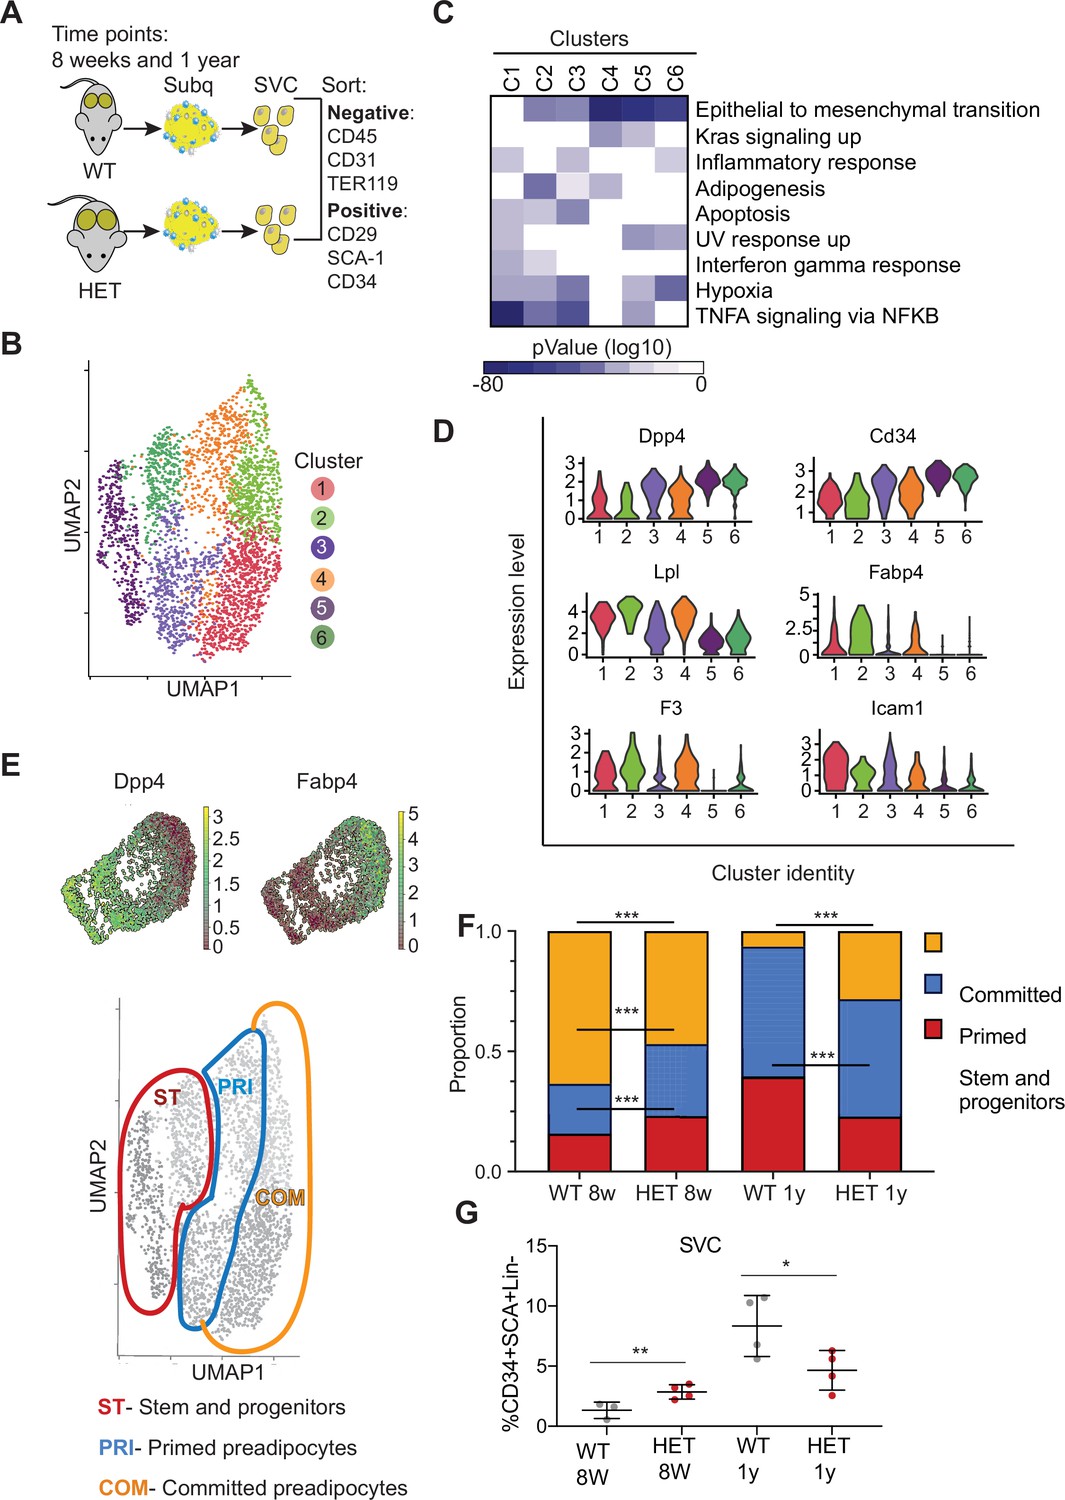
Dnmt3a-HET adipose tissue contains more stem cell-like preadipocytes at the expense of committed preadipocytes.
(A) Scheme of single cell RNA sequencing from stromal vascular cells (SVC) of WT and 3A-HET adipose tissue. (B) Uniform Manifold Approximation and projection (UMAP) clustering of pooled preadipocyte cells from WT and 3A-HET at 8 weeks and at 1 year of age. (C) Top hallmark pathways of marker genes for each cluster shown as a heat map. Marker genes were enriched in a cluster compared to all other clusters. (D) Expression levels of cluster-defining marker genes depicted by violin plots. The y-axis marks the normalized log-scale of average read counts. (E) Top: UMAP representation of the stem cell marker Dpp4 and the committed preadipocyte marker Fabp4 across all clusters. Bottom: definition of cellular states for the clusters based on the levels of Dpp4 and Fabp4. Stem and progenitor cells had the highest Dpp4 with no Fabp4. Primed preadipocytes expressed both Dpp4 and Fabp4, and committed preadipocytes expressed mainly Fabp4. (F) Quantification of the denoted cluster proportions at 8 weeks (8 w) and 1 year (1y). *p<0.05, **p<0.01, ***p<0.001 by Fisher exact test. (G) Quantification of preadipocytes in stromal vascular cells (SVC) cells by flow cytometry using the following strategy: cells were selected as lineage negative (lacking Cd45, Cd31, and Ter119) and positively expressing Cd34, Sca1, and Cd29 cell in WT and 3A-HET stromal vascular cells (SVCs) at 8 weeks and at 1 year of age. *p<0.05, **p<0.01 by Student’s- t- test.
Figure 3—figure supplement 1

Isolation of cells used for single cell RNAseq analysis.
(A) Flow cytometry gating strategy for isolation of preadipocytes and stromal cells used for single-cell RNAseq analysis (scRNAseq). Debris and doublets were excluded based on forward and side scatter profiles. Live cells were selected by the absence of propidium iodide staining. We sorted for cells that were negative for Cd45, Ter119, and Cd31 but expressed Cd29, Cd34, and Sca-1. (B) Cell cycle ratios prior to regression as calculated from the single-cell analysis. (C) Principle component analysis of WT and 3A-HET cells at 8 weeks and 1 year following regression of cell cycle and mitochondrial contamination. (D) tSNE plots show gene expression of the indicated transcripts across all the samples used for the scRNAseq analysis. These plots validate the sorting strategy used in A. (E) The cell numbers of WT and 3A-HET at 8 weeks and 1 year from each cluster used for the downstream analysis.
Figure 4 with 1 supplement
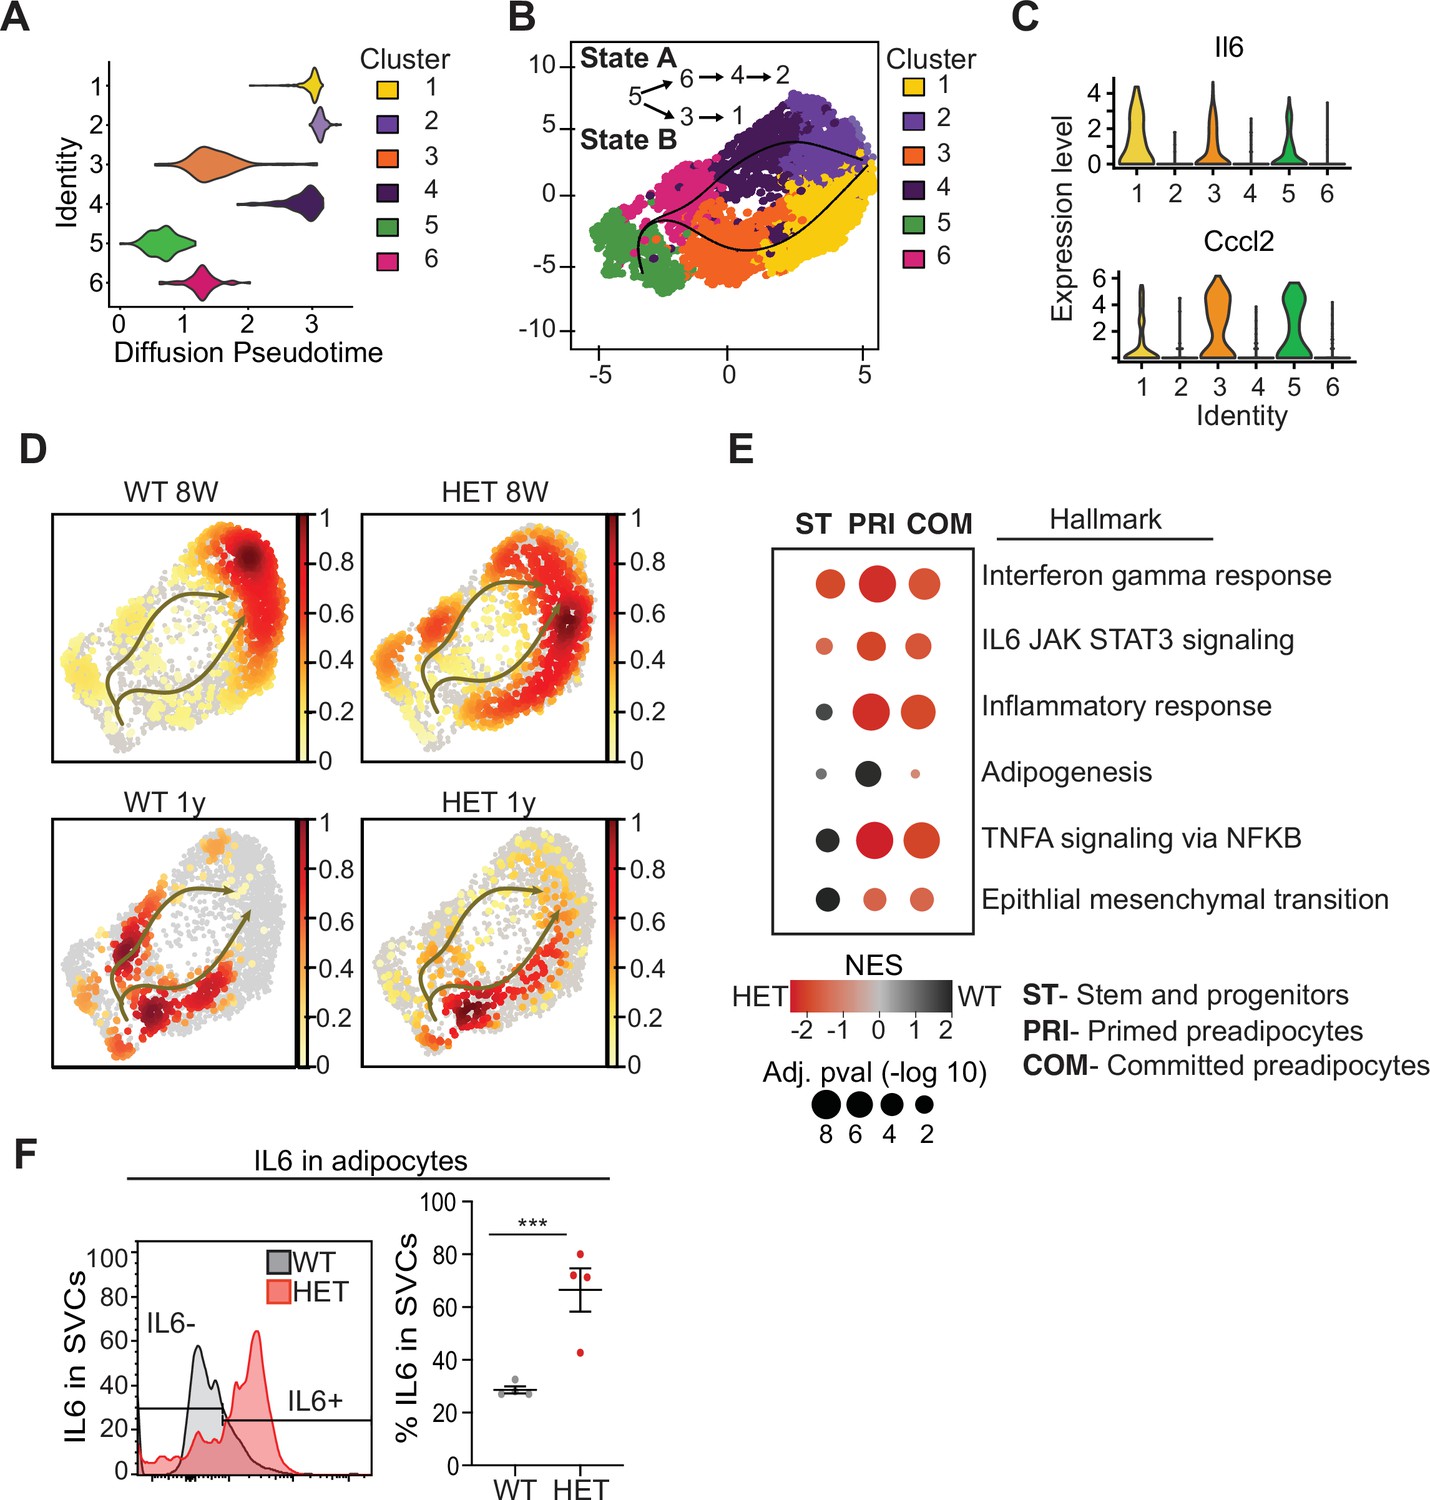
Pseudotime diffusion analysis shows that loss of Dnmt3a leads to increase in pro-inflammatory cellular trajectory.
(A) For each of the clusters as identified in 8-week-old WT mice preadipocytes we calculated diffusion score. The lowest diffusion value indicates that cells within the cluster display a more naïve stem-like gene expression profile. (B) Cell trajectories inferred by slingshot analysis overlaid on UMAP data (curved lines). (C) Expression levels of inflammatory marker genes that define clusters 1, 3 and 5, as depicted by violin plots. The y-axis marks the normalized log-scale of average read counts. (D) UMAP representation of the identified cell sates from B for cells from 8-week and 1-year-old mice. (E) Gene enrichment analysis (MsigDB) based on differential gene expression as calculated from the single cell RNA seq data. For each of the specified groups we ranked genes by average log2 fold change within state A or B and separated by genotype. Color indicates relative contribution of WT (blue) or HET (red) cells. Size of circle denotes bonferroni log transformed 10 adjusted p-value. (F) IL6 protein levels in permeabilizated SVCs that lack CD45 marker by flow cytometry. Left: representative quantification of Il6-positive cells. Bottom: quantification of Il6 positive cells as percentage of CD45-negative cells in adipocytes from 1-year-old mice.
Figure 4—figure supplement 1

Identification of cell cluster marker genes.
(A) Heatmap representation of gene expression levels of top 10 marker genes across all the identified cell clusters identified in the scRNAseq analysis. (B) Violin plots depicting the expression of differentially expressed genes between 3A-HET and WT preadipocytes defined for the denoted groups. Plotted are key genes as identified for the hallmark inflammatory response. (C) Violin plots depicting the expression of differentially expressed genes between 3A-HET and WT preadipocytes defined for the denoted groups. Plotted are key genes as identified for the hallmark TNFa activation via NFkB. (D) Violin plots depicting the expression of differentially expressed genes between 3A-HET and WT preadipocytes defined for the denoted groups. Plotted are key genes as identified for the hallmark adipogenesis pathway.
Figure 5 with 1 supplement
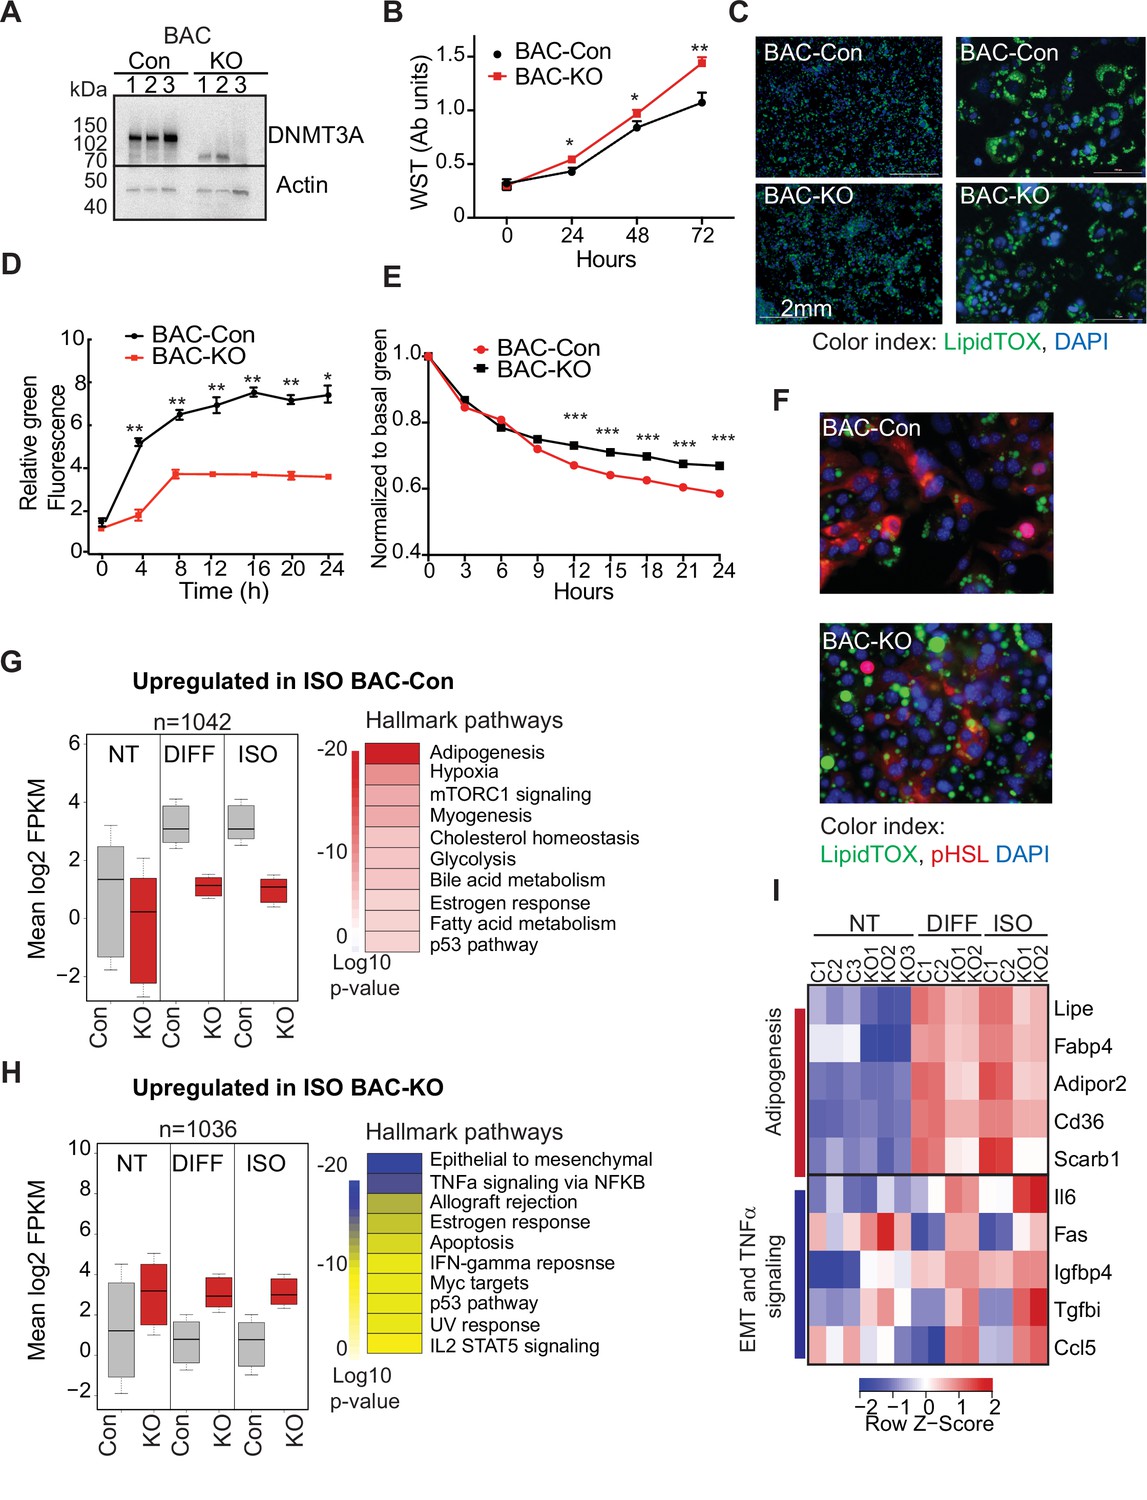
DNMT3A regulates preadipocyte proliferation and differentiation.
(A) Western blot probed with DNMT3A antibody after CRISPR KO in BAC-C4. Three clones of each are shown. (B) Proliferation of three WT and KO clones of BAC-C4 cells; assay based on water-soluble tetrazolium (MTT). (C) Representative staining of lipid droplets (LipidTOX (green)) following 6 days of differentiation of BAC-C4 control and KO cells. Scale 2 mm. (D) Incorporation of fluorescent fatty acid (BODIPY FL C12 (green)) relative to red nuclear fluorescent staining quantified during live cell imaging at day 5 of differentiation. Statistical analysis two-way ANOVA. *** p<0.0001 (E) Quantification of green, fluorescent fatty acid in control and KO cells following treatment with isoproterenol. Data shown is relative to the abundance of green fluorescence at baseline. Statistical analysis two-way ANOVA. *** p<0.0001 (F) Representative immunostaining of cells with the indicated antibodies. Cells were differentiated for 5 days and then treated with isoproterenol for 24 hr (G) RNAseq analysis at baseline (average of three clones from each genotype, non-treated, NT), at day 6 of differentiation (DIFF, two clones each genotype), and following 24 hr treatment of cells after 5 days of differentiation with isoproterenol (ISO, two clones each). Left panel: For genes defined as upregulated in BAC-control compared to KO following ISO, we plotted log transformed mean expression for all conditions. Right panel: Heatmap of MsigDB enrichment of genes upregulated in BAC-control (fold >2, p ≤ 0.05) compared to BAC-KO (Fold >2, p ≤ 0.005). (H) Using RNAseq data from (E): Left panel: log transformed mean expression for all conditions for genes defined as upregulated in BAC- KO compared to control following ISO. Right panel: Heatmap of MsigDB enrichment of genes upregulated in BAC-KO (fold >2, p ≤ 0.05) compared to BAC-Control (Fold >2, p ≤ 0.005). (I) Heatmap of top 5 genes differentially expressed between control and KO and annotated to the hallmarks adipogenesis or Epithelial to mesenchymal transition (EMT) and TNFa signaling pathways.
-
Figure 5—source data 1
RNAseq data from control and Dnmt3a-KO BAC-C4.
- https://cdn.elifesciences.org/articles/72359/elife-72359-fig5-data1-v1.xlsx
-
Figure 5—source data 2
List of differentially expressed genes overlapping with BAC-C4 and 3T3L1.
- https://cdn.elifesciences.org/articles/72359/elife-72359-fig5-data2-v1.xlsx
-
Figure 5—source data 3
Western blot probed with DNMT3A antibody after CRISPR KO in BAC-C4 cells. Three clones each of WT and DNMT3A-KO cells are shown.
- https://cdn.elifesciences.org/articles/72359/elife-72359-fig5-data3-v1.zip
Figure 5—figure supplement 1
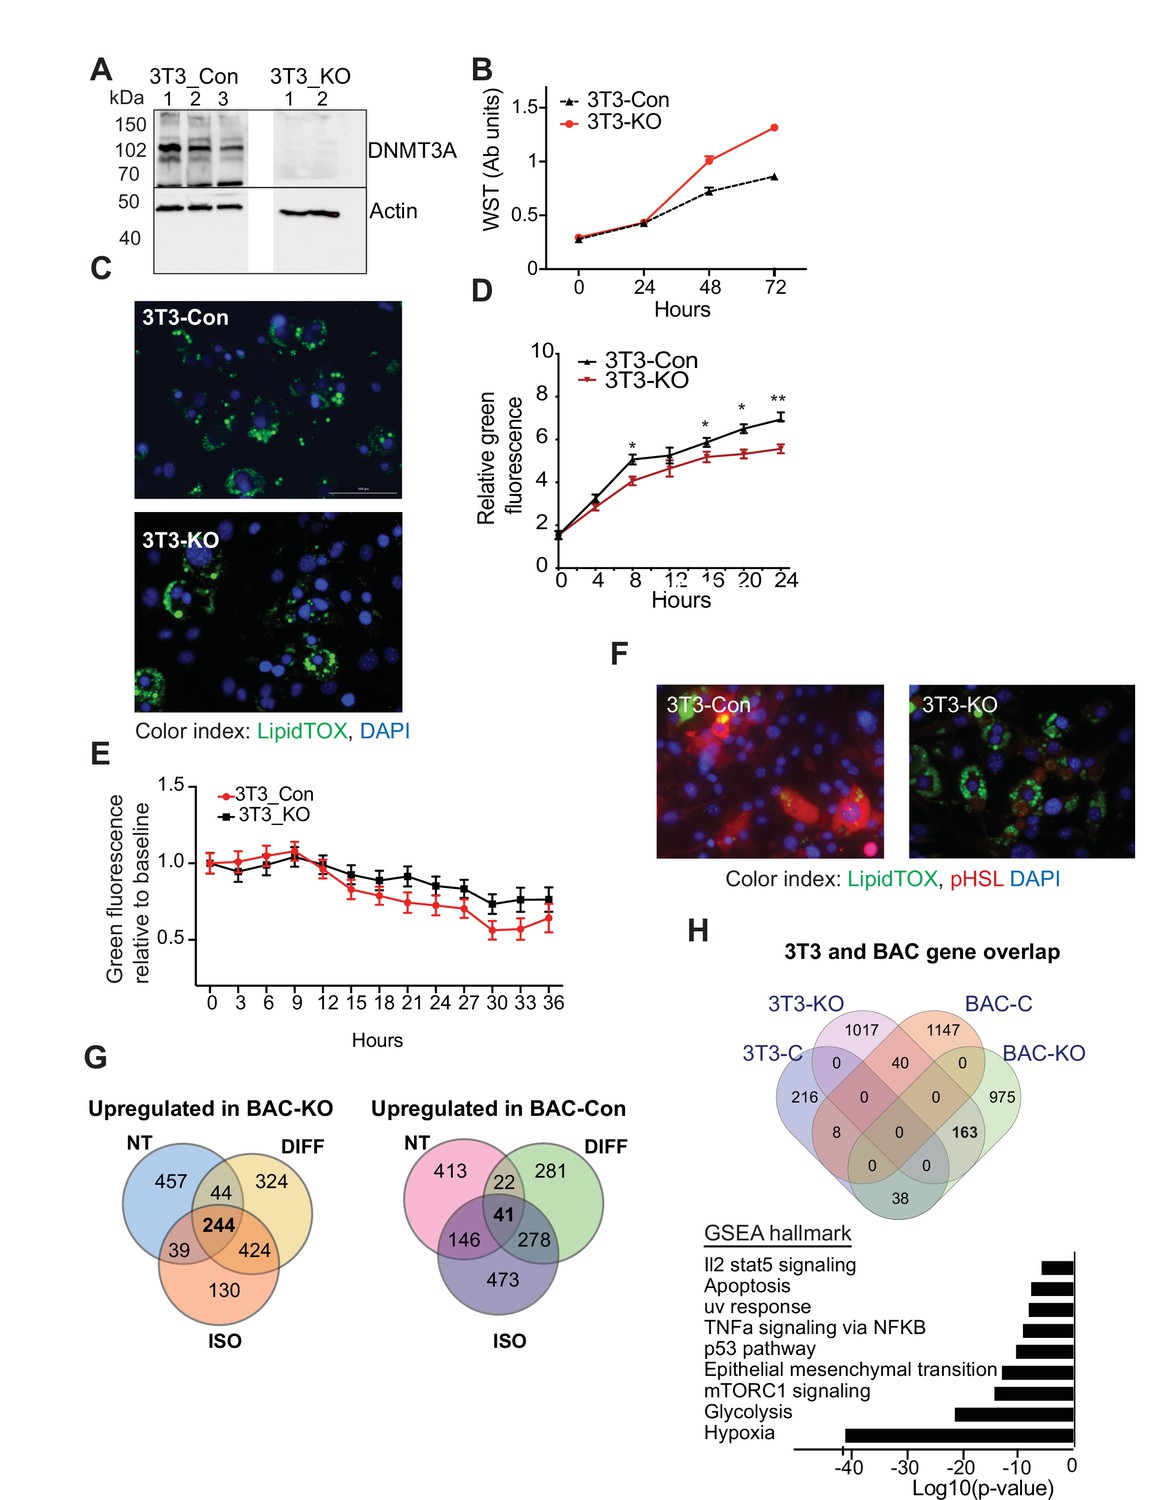
DNMT3A is needed for proper lipogenesis and lipolysis.
(A) Western blot performed to validate Dnmt3a knockout (KO) following CRISPR in 3T3-L1 cell line (three clones for control (3T3_Con) and two clones for Dnmt3a-KO (3T3_KO)). Actin antibody was used as loading control. (B) Proliferation assay of 3T3-L1 control and Dnmt3a-KO cells. Assay was based on water-soluble tetrazolium (MTT) assay. (C) Staining of differentiating 3T3-L1 control and Dnmt3a-KO cells. Shown representative LipidTOX (green) staining of lipid droplets following 6 days of differentiation (×20 magnification). (D) Live cell imaging was used at day 5 of differentiation to plot measurement of incorporation of fluorescent fatty acid (BODIPY FL C12 (green)) relative to red nuclear fluorescent staining of KO and control 3T3-L1 proliferating cells. (E) Quantification of lipid release control and 3T3L1 Dnmt3a-KO cells following treatment with isoproterenol. Quantification of green fluorescence from fatty acids was normalized to the level of green fluorescence at baseline. (F) Staining of differentiating 3T3-L1 control and Dnmt3a-KO cells following induction of lipolysis. 3T3-L1 control and Dnmt3a-KO cells were differentiated for 5 days and following treated with isoproterenol for an additional 24 hr. Displayed representative immunostaining of the cells with the indicated antibodies. (G) Venn diagram disapplying overlap of differentially expressed genes in control and KO cells at baseline (non-treated, NT), at day 6 of differentiation (DIFF), and following 24 hours treatment of 5 days differentiated cells with isoproterenol (ISO). (H) Top: Venn diagram disapplying overlap of differentially expressed genes in control and KO following differentiation compared to published RNAseq data performed on differentiated 3T3L1 cells following downregulation of Dnmt3a with siRNA. Bottom: GSEA pathway enrichment analysis of genes upregulated in BAC-KO (fold >2, p ≤ 0.05) and 3T3L1 si-Dnmt3a. Presented as log transformed p-value.
-
Figure 5—figure supplement 1—source data 1
Western Blot of DNMT3A; source data.
- https://cdn.elifesciences.org/articles/72359/elife-72359-fig5-figsupp1-data1-v1.zip
Figure 6 with 1 supplement

DNMT3A regulates lipolysis and inflammatory gene pathways.
(A) Overlap of normalized enrichment score (NES) of GSEA hallmark pathway overlap between the scRNAseq data for the primed preadipocytes and BAC RNAseq at the nontreated (NT) state. For each dataset, we performed GSEA analysis and calculated NES score. Positive values are pathways enriched for WT adipose and BAC control cells. Negative values are pathways enriched for HET adipose and BAC KO cells. (B) Overlap of normalized enrichment score (NES) of GSEA hallmark pathway overlap between the scRNAseq data for the committed preadipocytes and BAC RNAseq at day 6 of induced differentiation. For each dataset, we performed GSEA analysis and calculated NES score. Positive values are pathways enriched for WT adipose and BAC control cells. Negative values are pathways enriched for HET adipose and BAC KO cells. (C) Quantification of free fatty acid in the plasma of 12 hr fasted mice. (D) Quantification of glycerol in the plasma of 12 hr fasted mice. (E) Quantification of free fatty acid release from gonadal fat (gWAT) from WT and 3A-HE mice fat was isolated from mice fasted for 6 hr and treated with 1 μm isoproterenol for 3 hr. (F) Quantification of glycerol at the end of the experiments described in e.
-
Figure 6—source data 1
fGSEA analysis of NT BAC and primed preadipocytes pathway NES.
- https://cdn.elifesciences.org/articles/72359/elife-72359-fig6-data1-v1.xlsx
-
Figure 6—source data 2
fGSEA analysis of BAC cell following differentiation and committed preadipocytes pathway NES.
- https://cdn.elifesciences.org/articles/72359/elife-72359-fig6-data2-v1.xlsx
Figure 6—figure supplement 1
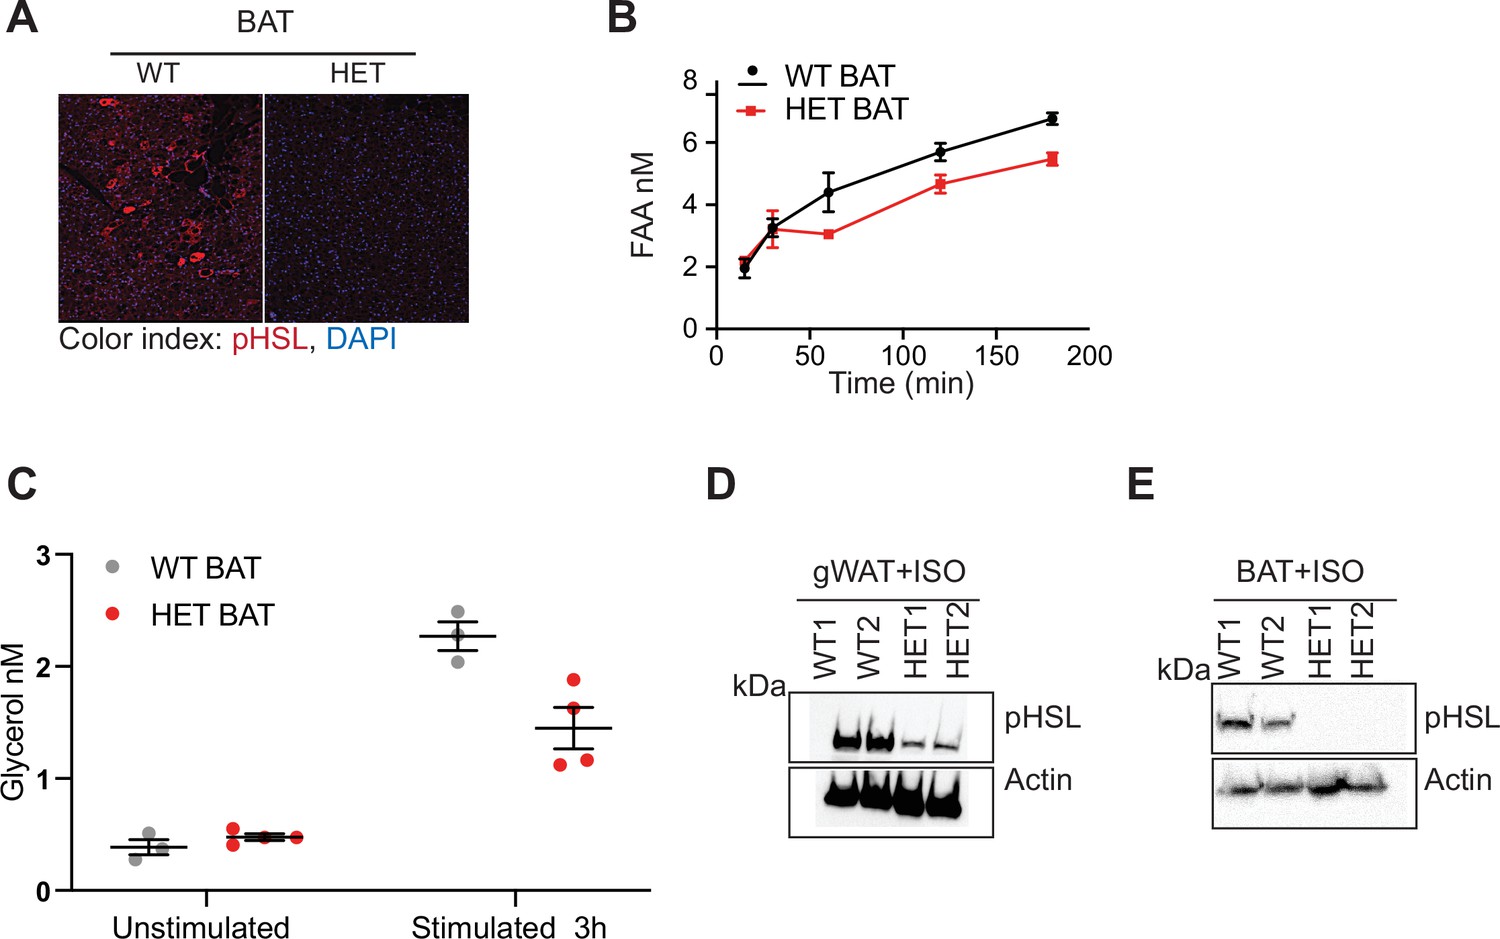
DNMT3A is needed for in vivo lipolysis.
(A) Immunostaining of pHSL in BAT following 12 hr fasting. (B) Quantification of free fatty acid release from BAT from WT and 3A-HE mice. Fat tissue was isolated from mice fasted for 6 hr and treated with 1 μm isoproterenol for 3 hr. (C) Quantification of glycerol at the end of the experiments described in b. (D) Western blot analysis of gonadal fat (gWAT) from WT and HET mice following ex vivo treatment with 1 μm isoproterenol for 3 hr. Western blot was probed with phospho- hormone-sensitive lipase (pHSL) and actin which was used to as loading control. (E) Western blot analysis of BAT from WT and HET mice following ex vivo treatment with 1 μm isoproterenol for 3 hr. Western blot was probed with phospho- hormone-sensitive lipase (pHSL) and actin which was used to as loading control.
-
Figure 6—figure supplement 1—source data 1
Western Blot for pHSL in gonadal white adipose tissue.
- https://cdn.elifesciences.org/articles/72359/elife-72359-fig6-figsupp1-data1-v1.zip
-
Figure 6—figure supplement 1—source data 2
Western Blot for pHSL in brown adipose tissue.
- https://cdn.elifesciences.org/articles/72359/elife-72359-fig6-figsupp1-data2-v1.zip
Figure 7 with 1 supplement
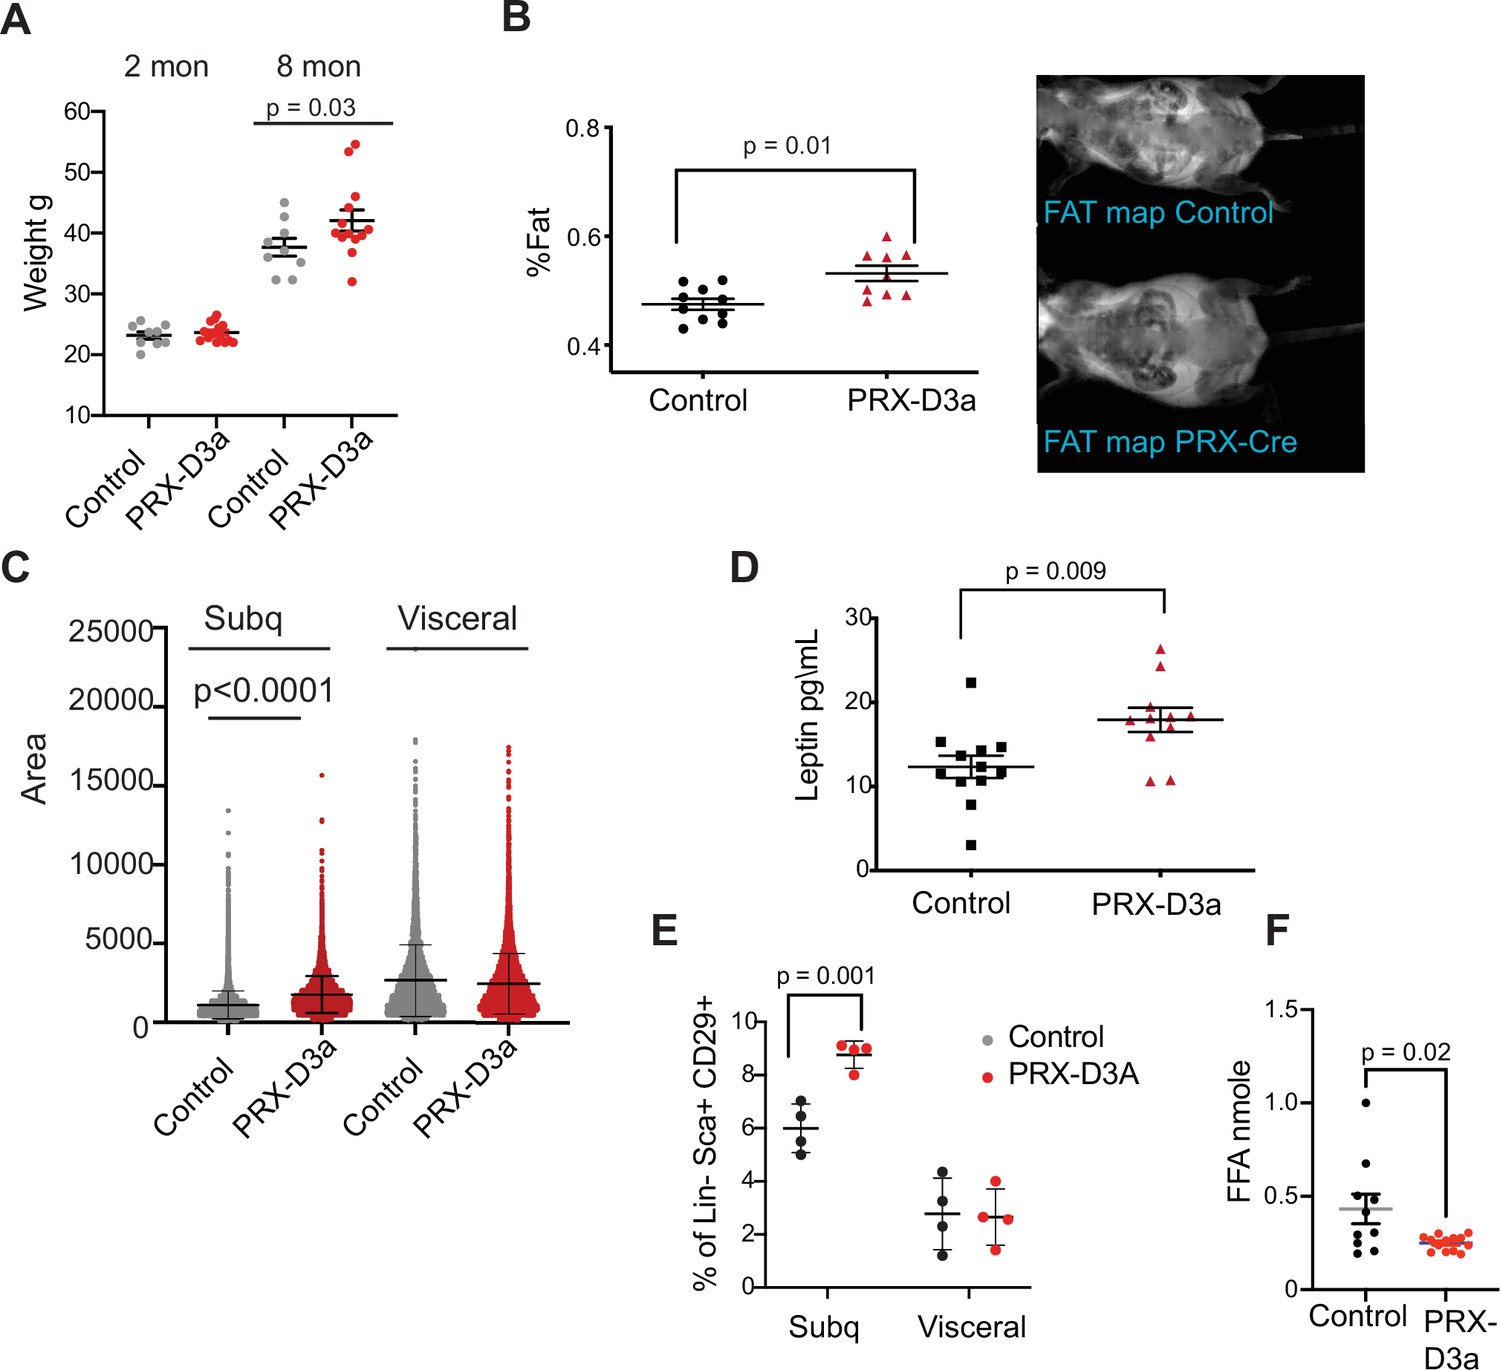
Loss of Dnmt3a in inguinal subcutaneous adipose progenitors leads to fat expansion.
(A) Weight of male Prx-Cre Dnmt3a mice (PRX-D3A) mice at 8 months of age in compared to controls (Dnmt3a flox\flox) (n=8–10). Student T-test was done for statistical analysis. (B) Dual energy X-ray absorptiometry (DEXA) analysis of PRX-D3A mice compared to control mice. Left: Quantification of fat mass (n=10–12) from DEXA. Statistical analysis one-way ANOVA. Right: Representative image from DEXA. (C) Adipocyte area as measured in histological sections of inguinal WAT in Prx-Cre Dnmt3a compared to controls. (D) Plasma leptin from Prx-Cre Dnmt3a mice compared to controls. (E) Quantification of preadipocytes in stromal vascular cells (SVC) cells from subcutaneous (Prx-Cre is expressed) and visceral (Prx-Cre not expressed) by flow cytometry using the following strategy: cells were selected as lineage negative (lacking Cd45, Cd31, and Ter119) and positively expressing Cd34, Sca1, and Cd29 cell in Prx-Cre Dnmt3a mice compared to control. Two-way Anova was done for statistical analysis. (F) Quantification of free fatty acids (FAA) release from subcutaneous fat of Prx-Cre Dnmt3a mice compared to control. Fat pad was isolated from mice fasted for 12 hr and treated with 1 μm isoproterenol for 3 hr.
Figure 7—figure supplement 1
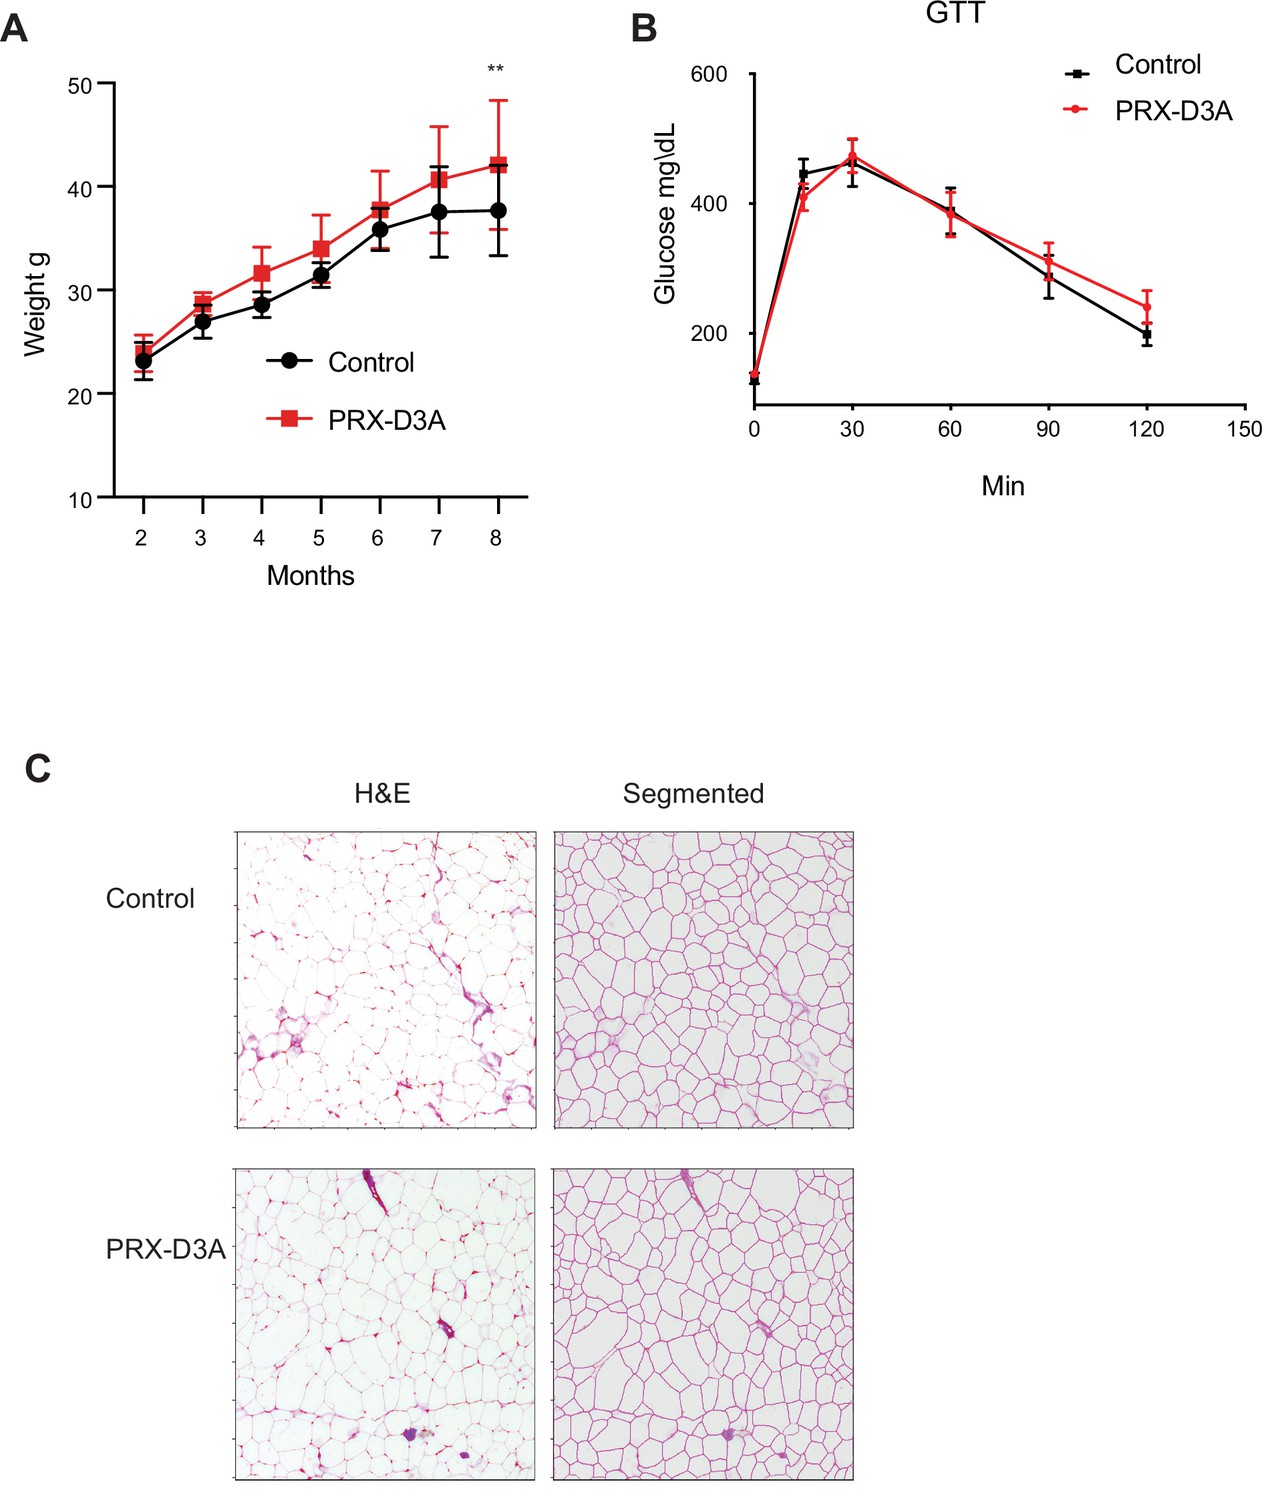
Ablation of Dnmt3a from subcutaneous fat contributes to weight gain.
(A) Weight curve of Dnm3a-Prx compared to controls over 8 months. (B) Glucose tolerance test on 8 months old Dnm3a-Prx compared to control mice. (C) Histological sections of inguinal adipose tissue from Prx-Cre Dnmt3a compared to control mice. Left: Hematoxylin Eosin (H&E), Right: sectional view of the adipocyte area as analyzed in ImageJ.
Figure 8 with 1 supplement
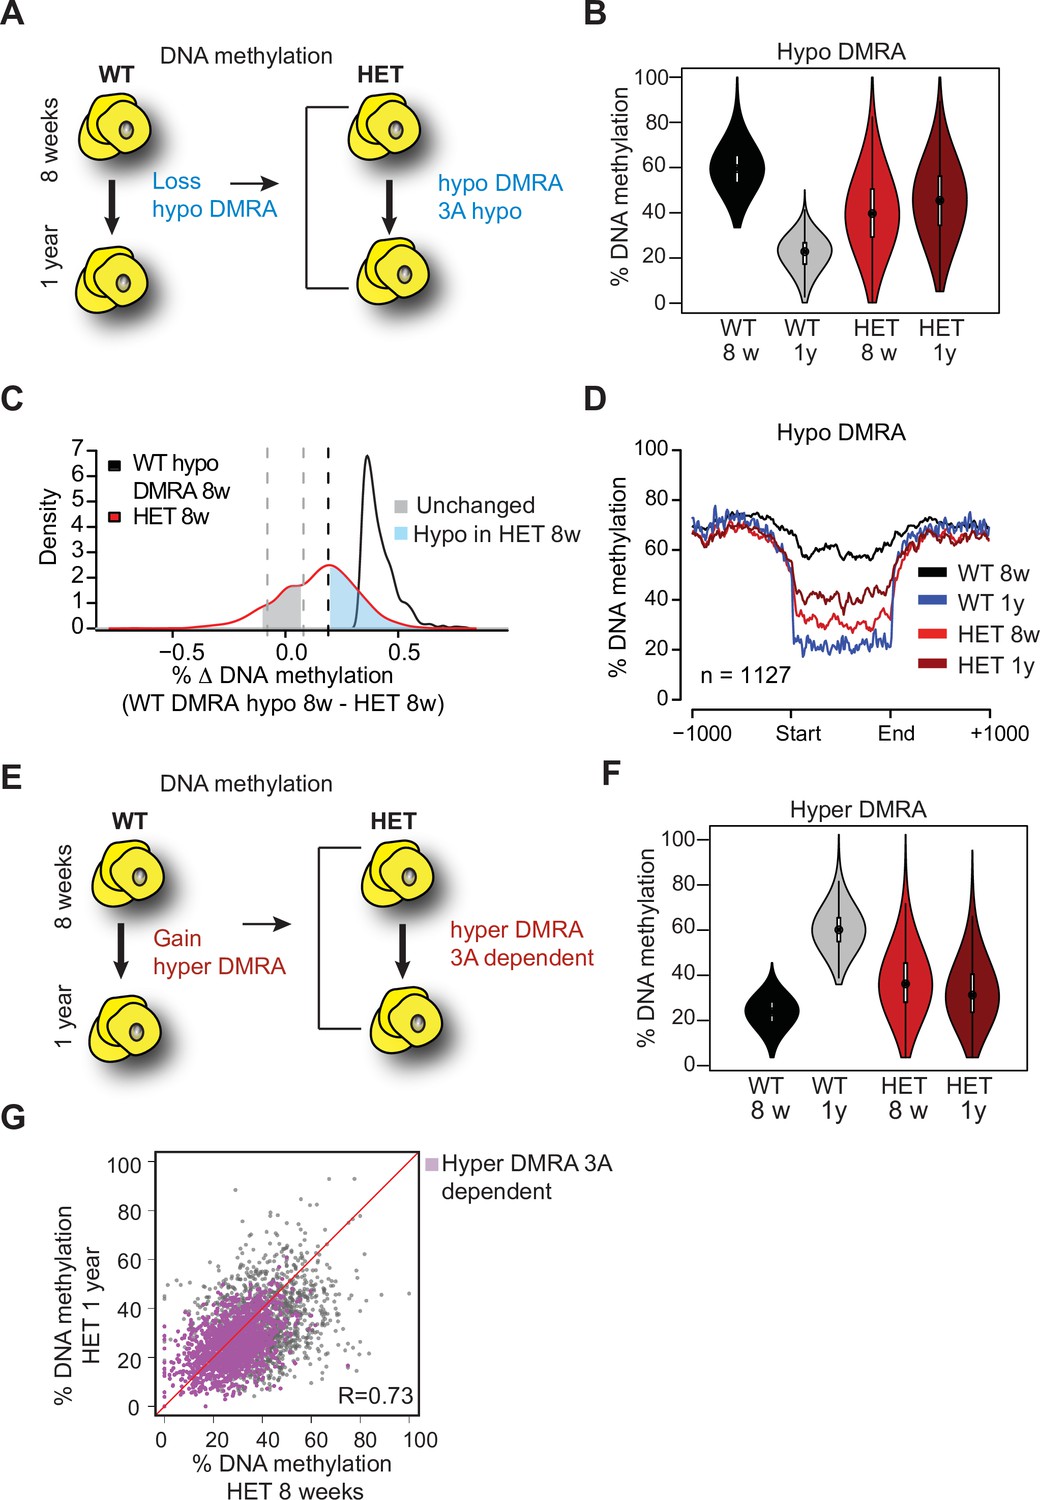
Loss of Dnmt3a alters DNA methylation landscape during adipocyte development and ageing.
(A) Schematic for strategy to define regions hypomethylated with age (WT hypo-DMRA). (B) Violin plot of mean methylation for WT hypo-DMRA and their mean methylation in 3A-HET. (C) For the regions defined as WT hypo-DMRA we subtracted the methylation value for the same loci in 8 weeks HET cells. In this histogram representation, we identified two peaks: in blue are regions that are hypomethylated in HET cells (20% difference or greater) and in grey regions which share similar levels in methylation in WT ad HET cells and determined as unchanged regions. (D) Mean methylation +/1 1 Kb from the DMR for regions defined as WT DMRA-hypo. (E) Schematic of definition of regions hypermethylated in WT ageing (WT hyper-DMRA). (F) Violin plot of mean methylation for WT hyper-DMRA in HET cells (8 weeks and 1 year). (G) Scatter plot of methylation levels for WT hyper-DMRA and the same loci in HET at 8 weeks and at 1 year. Quantification of the correlation between the regions that remain hypomethylated (20% or larger) in HET cells in 8 weeks and in 1 year (purple) indicates high probability score of them being hypomethylated in HET cells regardless of age.
-
Figure 8—source data 1
List of hypo-DMRA.
- https://cdn.elifesciences.org/articles/72359/elife-72359-fig8-data1-v1.xlsx
-
Figure 8—source data 2
List of hyper-DMRA.
- https://cdn.elifesciences.org/articles/72359/elife-72359-fig8-data2-v1.xlsx
Figure 8—figure supplement 1
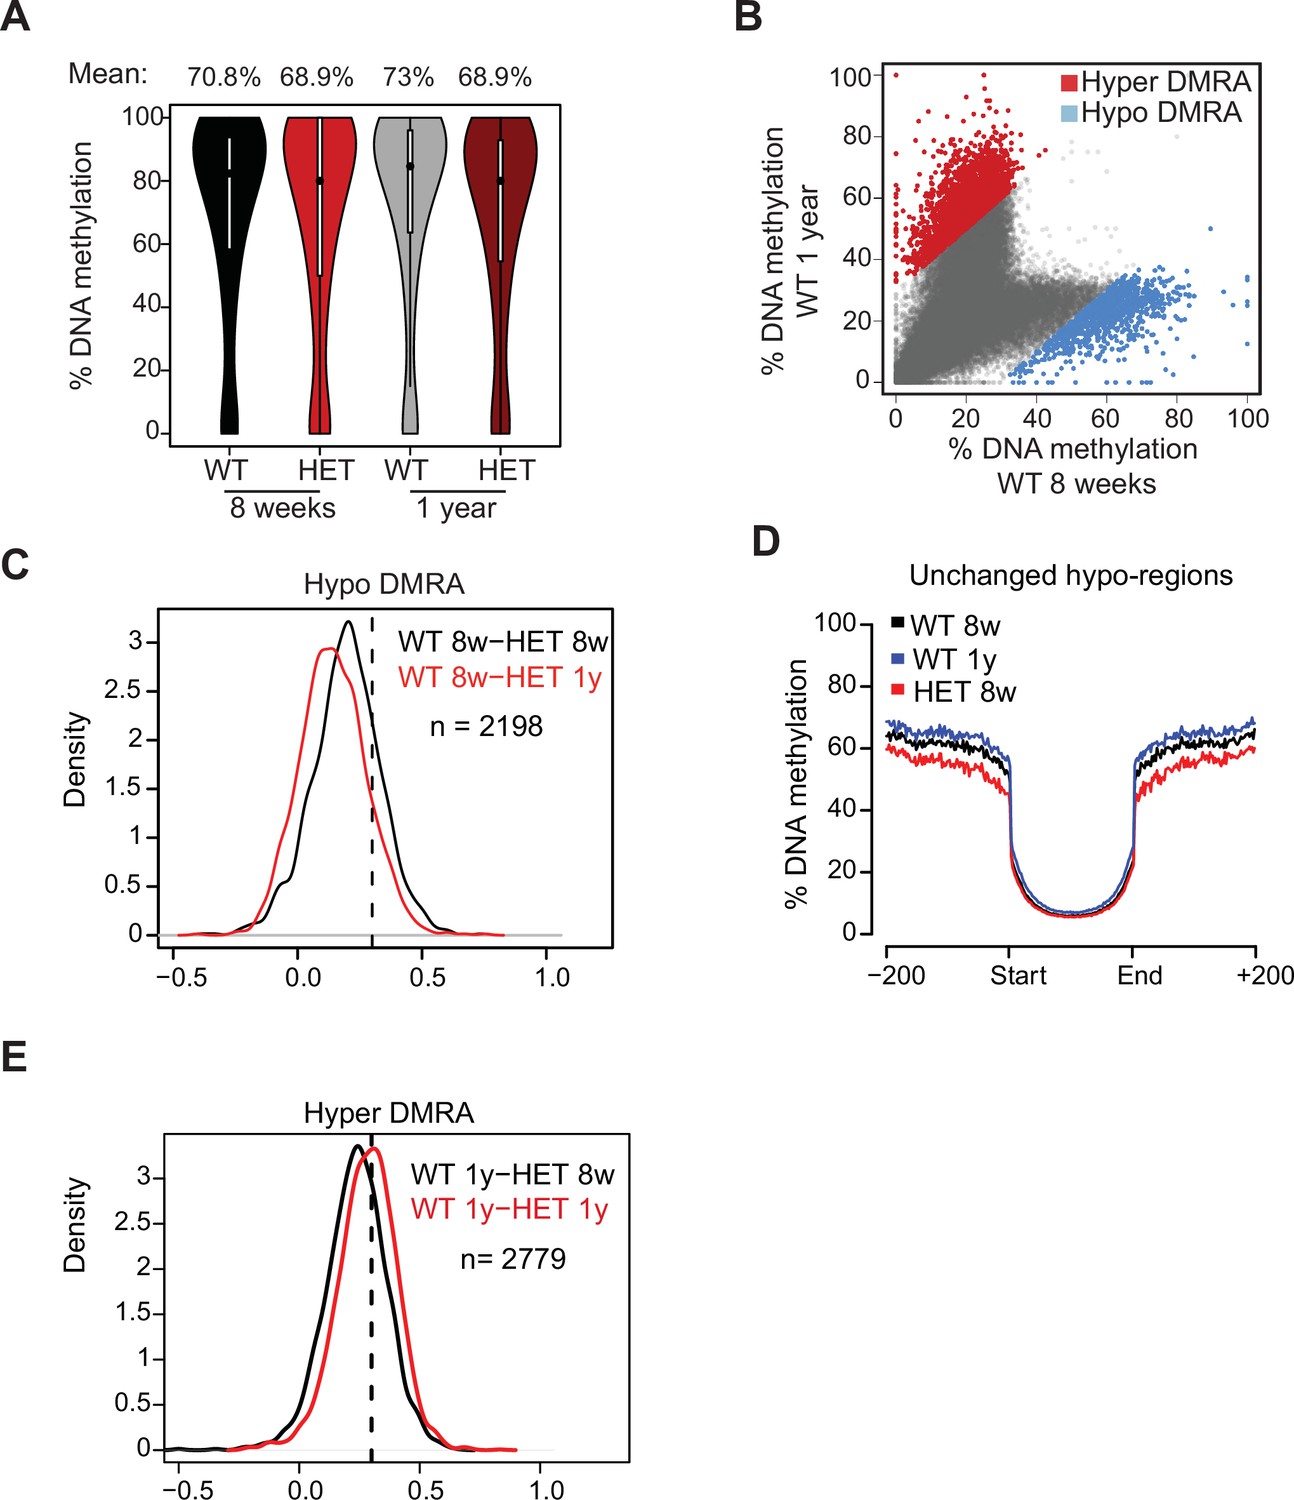
DNA methylation in adipocytes across ageing.
(A) Violin plot of mean global DNA methylation for WT and HET cells (8 weeks and 1 year). (B) Scatter plot of mean DNA methylation of WT preadipocytes at 8 weeks compared to 1 year. In blue are regions that lose methylation during WT aging (>30%). In red are regions that gain methylation during WT aging (>30%). (C) The distribution of the change in hypo DMRA DNA methylation between WT 8 week and HET cells across aging. Plotted is a density plots of the values of WT hypo-DMRA following subtraction of mean methylation value for the same loci at 8 weeks (black line) or in 1 year (red line) HET cells. (D) The mean methylation of the regions defined as unchanged (grey from C). For these regions we show mean methylation spanning the DMR up to 1 kilobase (Kb) from each side. (E) The distribution of the change in hyper DMRA DNA methylation between WT 8 week and HET cells across aging. Plotted is a density plots of the values of WT hyper-DMRA following subtraction of mean methylation value for the same loci at 8 weeks (black line) or in 1 year (red line) HET cells.
Figure 9 with 1 supplement
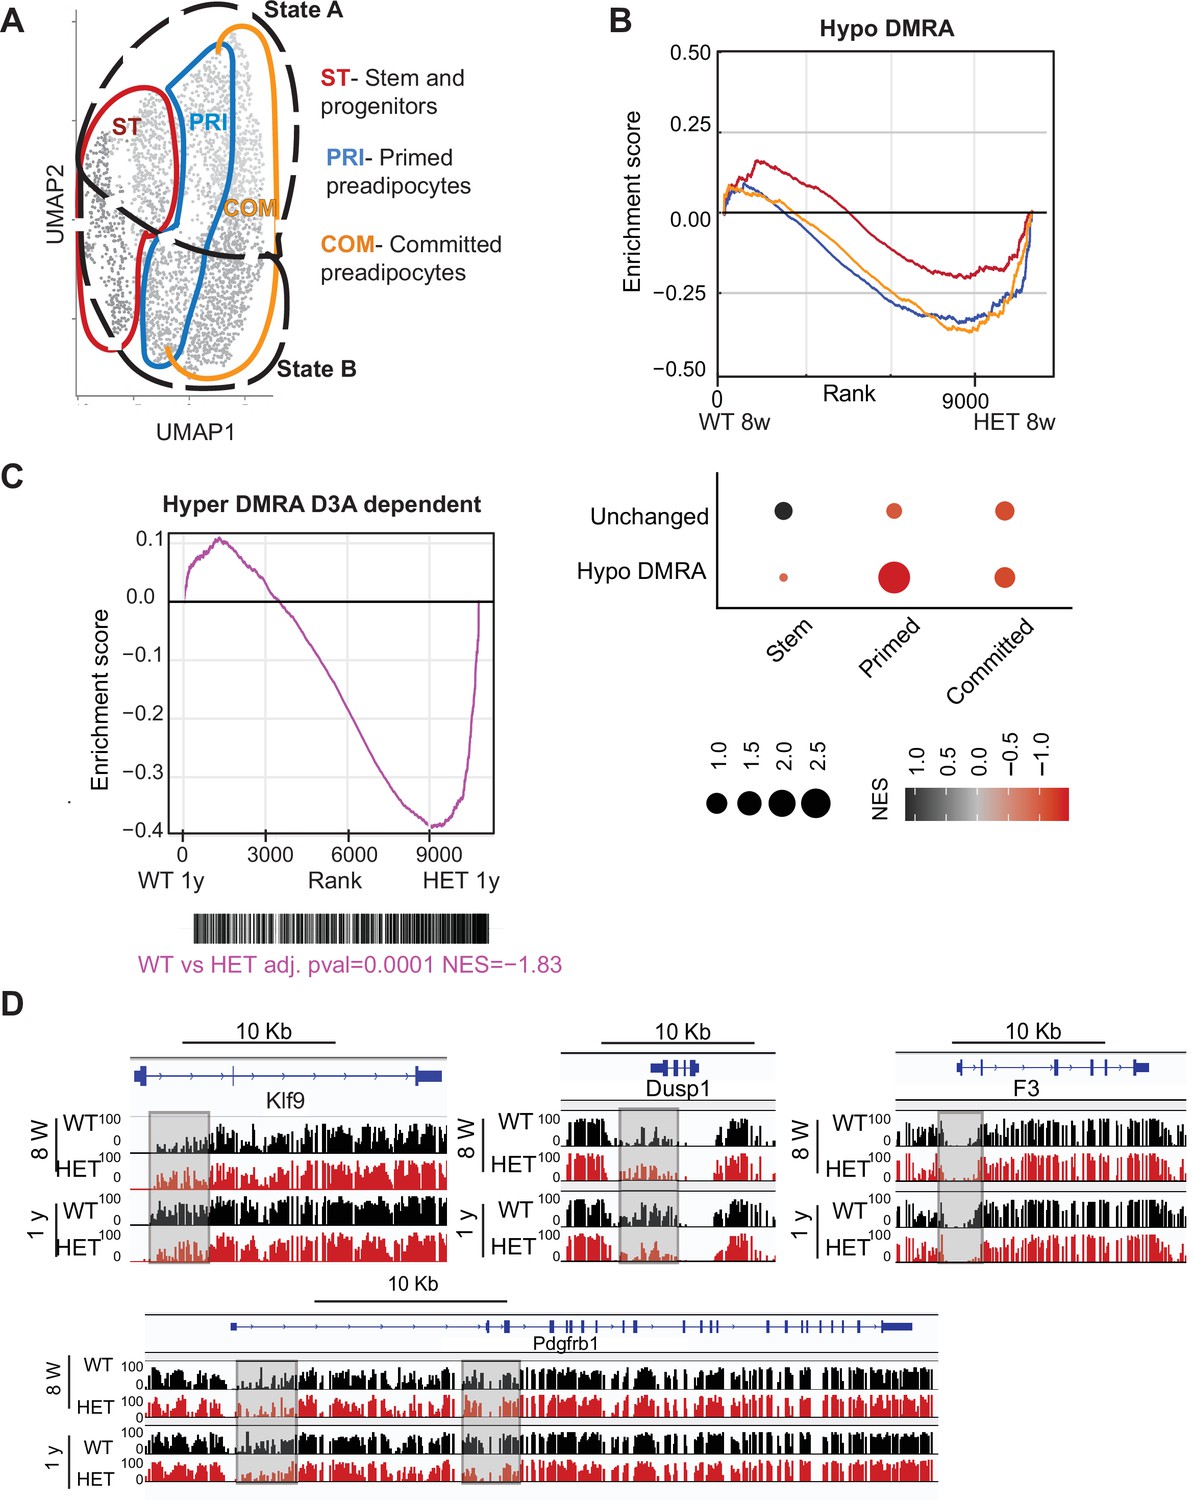
Loss of DNA methylation in HET cells is associated with activation of the pro-inflammatory cell state B.
(A) Illustration of the cell clusters used for the gene enrichment analysis based on the clusters and cellular states identified in Figure 5. (B) Displayed is the enrichment score and the Bonferroni adjusted p-value for genes associated with WT hypo and HET hypo DMRA based on their enrichment within cell cluster groups and cellular sates as described in A. Bottom: Negative normalized enrichment score (NES) indicates more contribution of HET cells to the genes associated with the WT hypo DMRA regions, while positive NES indicates more contribution of WT cells to the genes associated the described regions in DMRA and in unchanged regions. (C) Displayed is the enrichment score and the Bonferroni adjusted p-value for genes associated with WT hyper and HET (8 weeks and 1 year) hypo DMRA based on their enrichment within cell cluster groups and cellular sates as described in A. Negative normalized enticement score (NES) indicates more contribution of HET cells to the genes associated with the WT hyper DMRA regions, while positive NES indicates more contribution of WT cells to the genes associated the described regions. (D) For regions defined as WT hyper-DMRA and HET 8 weeks and 1 year hypomethylated (purple regions from Figure 6G), we performed gene enrichment analysis based on the cell clusters groups and cellular sates illustrated in A. Displayed is the enrichment score and the Bonferroni adjusted p-value in WT and HET cells. (E) DNA methylation at the Klf9, F3, Dusp1, and Pdgfrb loci in WT (black) and HET (red) cells at 8 weeks and at 1 year. Highlighted are the regions which gain methylation in WT cells but lose methylation in the HET.
Figure 9—figure supplement 1
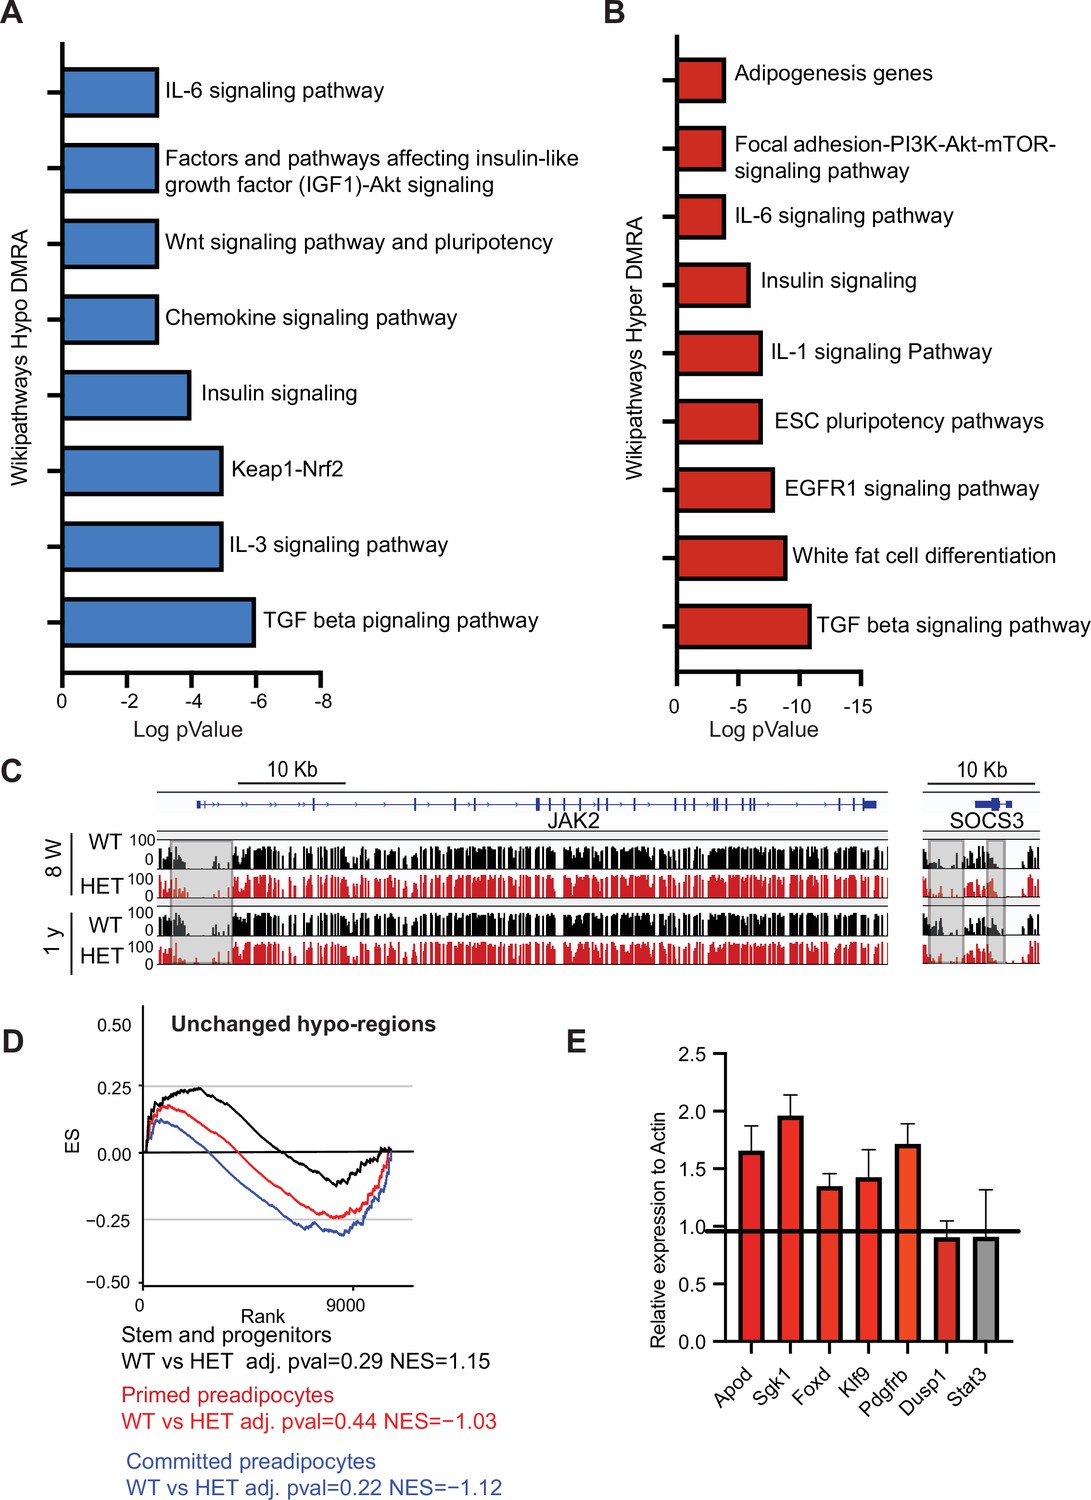
DNA methylation alterations in HET cells are associated with adipogenesis and inflammation gene networks.
(A) WikiPathways of biological pathways enriched for hypo-DMRA. We used HOMER to annotate the genes located within the WT hypo-DMRA regions. Plotted is log transformed p-value of the WikiPathways. (B) WikiPathways of biological pathways enriched for hypo-DMRA. We used HOMER to annotate the genes located within the WT hyper-DMRA regions. Plotted is log transformed p-value of the WikiPathways. (C) DNA methylation examples of Jak2 and Socs3 loci at the WT (black) and HET (red) cells at 8 weeks and at 1 year. Highlighted are the regions which gain methylation in WT cells but lose methylation in the HET. (D) For regions defined as unchanged (grey regions from Figure 6C) we performed GSEA analysis based on the cell clusters groups and cellular sates illustrated in A. Displayed is the enrichment score and the Bonferroni adjusted p-value in WT and HET cells. Negative normalized enticement score (NES) indicates more contribution of HET cells to the genes associated with these regions, while positive NES indicates more contribution of WT cells to the described regions. (E) qRT analysis of gene expression in adipose tissue SVCs following depletion of Cd45 and Cd31. Shown are representative genes which were upregulated in HET adipose as revealed by scRNAseq and were also hypomethylated.
Additional files
Download links
A two-part list of links to download the article, or parts of the article, in various formats.
Downloads (link to download the article as PDF)
Open citations (links to open the citations from this article in various online reference manager services)
Cite this article (links to download the citations from this article in formats compatible with various reference manager tools)
Constitutive loss of DNMT3A causes morbid obesity through misregulation of adipogenesis
eLife 11:e72359.
https://doi.org/10.7554/eLife.72359


