Evolutionary conservation of centriole rotational asymmetry in the human centrosome
- Université Paris Cité, CNRS, Institut Jacques Monod, France
- Image Analysis Hub, C2RT, Institut Pasteur, France
- Hub de Bioinformatique et Biostatistique – Département Biologie Computationnelle, Institut Pasteur, France
- Institut de Génétique et de Biologie Moléculaire et Cellulaire (IGBMC), France
- Institut National de la Santé et de la Recherche Médicale (INSERM), France
- Centre National de la Recherche Scientifique (CNRS), France
- Université de Strasbourg, France
Figures
Figure 1 with 2 supplements
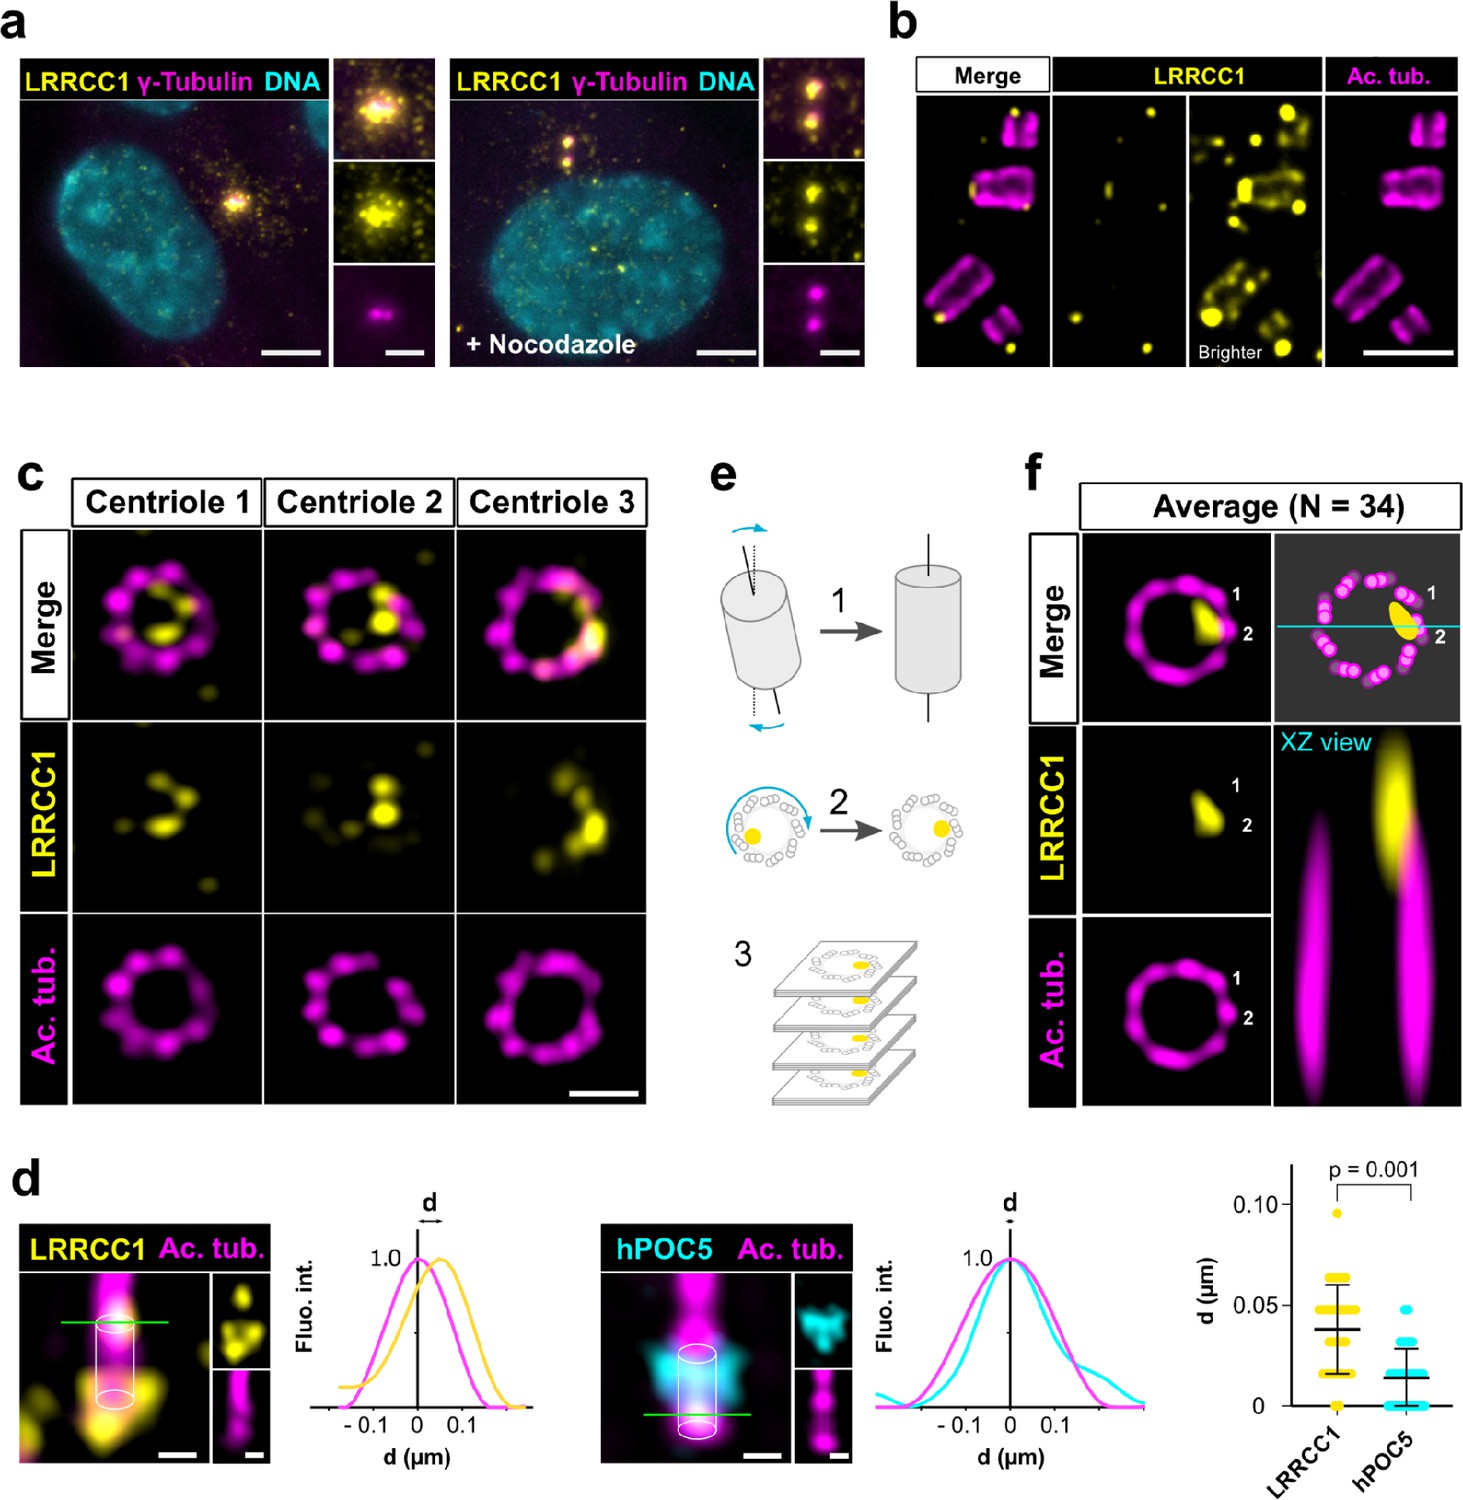
LRRCC1 is localized in a rotationally asymmetric manner at the distal end of centrioles in the human centrosome.
(a) LRRCC1 localization in non-treated RPE1 cells (left) or in cells treated with nocodazole to disperse the pericentriolar satellites (right). LRRCC1 (Ab2, yellow), γ-tubulin (PCM, magenta), and DNA (cyan). Bar, 5 µm (insets, 2 µm). (b) Longitudinal view of centrioles and procentrioles in the duplicating centrosome of an RPE1 cell analyzed by ultrastructure expansion microscopy (U-ExM). LRRCC1 (Ab2, yellow), acetylated tubulin (magenta). Bar, 0.5 µm. (c) Centrioles from WT RPE1 cells as seen from the distal end. LRRCC1 (Ab2, yellow), acetylated tubulin (magenta). Images are maximum intensity projections of individual z-sections encompassing the LRRCC1 signal. Note that an apparent shift between channels occurs when centrioles are slightly angled with respect to the imaging axis. Bar, 0.2 µm. (d) Lateral distance between LRRCC1 (left, yellow) or hPOC5 (middle, cyan) signal intensity peaks and the centriole center (given by the position of acetylated tubulin intensity peak, magenta) in ciliated RPE1 cells. Individual intensity profiles were measured along the green lines. The approximate position of the centriole is shown (white cylinders). Note that LRRCC1 and hPOC5 were also detected at the periphery of the centriole, towards the proximal end for LRRCC1 and in the appendage region for hPOC5. Bar, 0.2 µm. Right: interpeak distance (d). Bars, mean ± SD, 31 cells from two different experiments (Kolmogorov–Smirnov test). (e) Workflow for calculating the average staining from 3D-reconstructed individual centrioles generated from confocal z-stacks. The brightest part of LRRCC1 signal was used as a reference point to align the centrioles. (f) Average LRRCC1 staining obtained from 34 individual centrioles viewed from the distal end, in transverse and longitudinal views. A diagram representing the average pattern in transverse view is also shown.
Figure 1—figure supplement 1
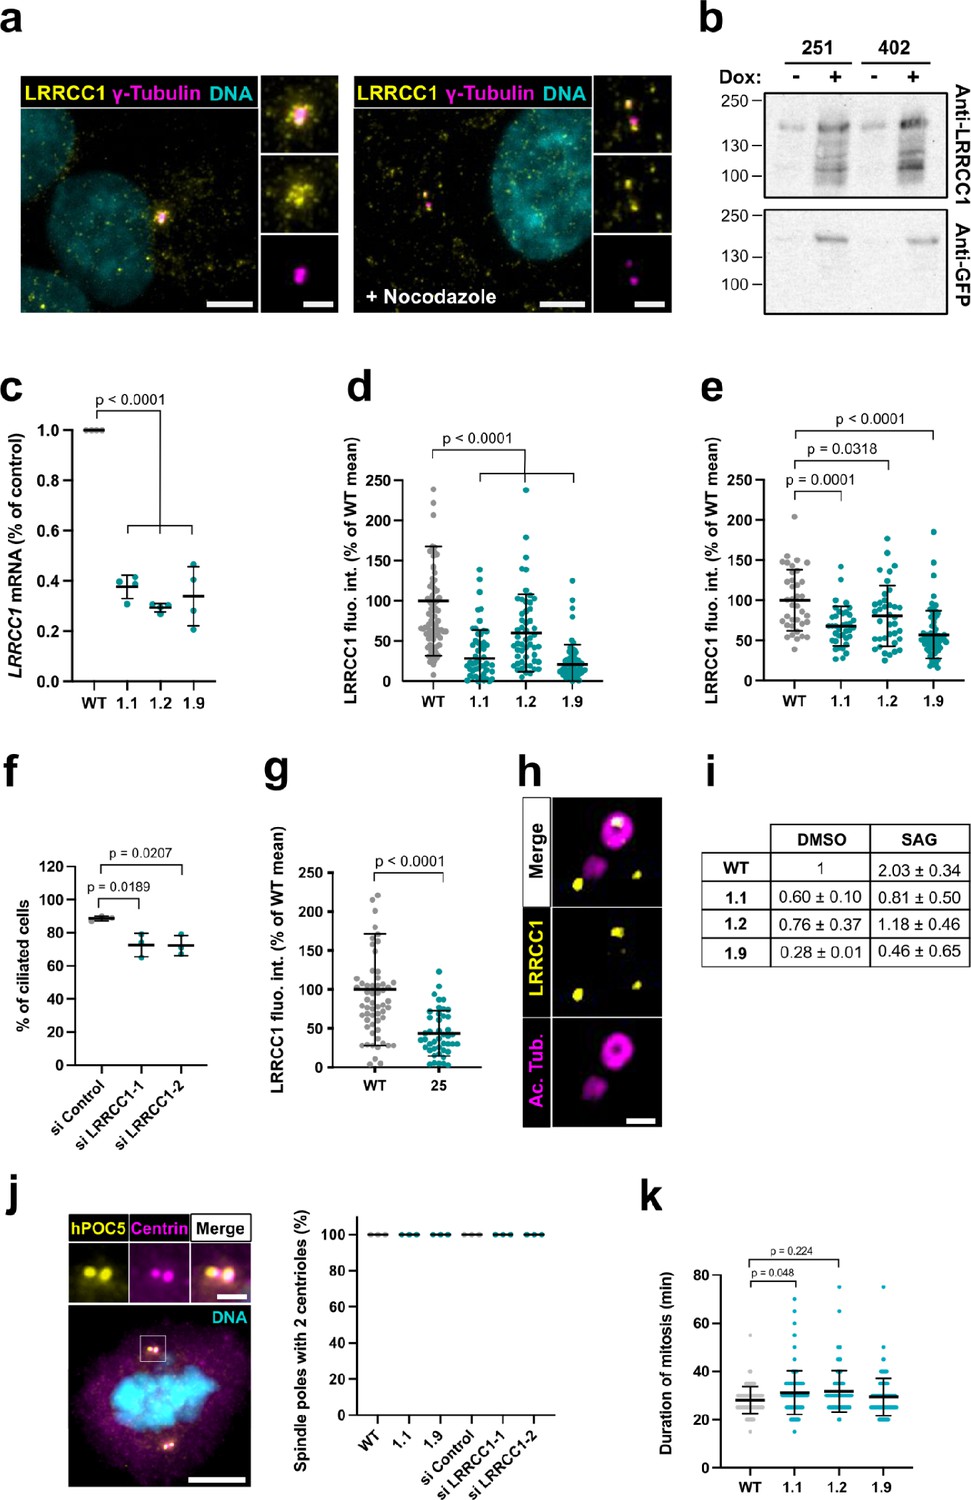
Characterization of LRRCC1 expression in CRISPR or RNAi-treated cells.
(a) LRRCC1 localization in non-treated RPE1 cells (left), or in cells treated with nocodazole to disperse pericentriolar satellites (right). Anti-LRRCC1 (Ab1, yellow), γ-tubulin (magenta), and DNA (cyan). Bar, 5 µm (insets, 2 µm). (b) Western blot analysis of overexpressed GFP-LRRCC1 fusions using anti-LRRCC1 (Ab2) or anti-GFP antibodies. Cell lysates were obtained from HEK 293 cells induced (+Dox) or not (-Dox) to express GFP-LRRCC1 fusions in which the GFP is inserted either after aa 251 or 402. The load represents the same number of cells for all conditions. The different samples were deposited in duplicate and the labeling with the two antibodies was performed in parallel and exposed in the same way. Note that GFP fusions are already detected in the noninduced samples, whereas the endogenous protein (expected size ~120 kDa) is not. (c) qRT-PCR analysis of LRRCC1 expression in the CRISPR clones. mRNA levels are expressed as percentages of RPE1 control values. Bars, mean ± SD, three independent experiments. p-Values are provided when statistically significant from the corresponding control (one-way ANOVA). (d) LRRCC1 centrosomal levels in CRISPR mutant cells stained with Ab1. Bars, mean ± SD, three independent experiments. p-Values are provided when statistically significant from the corresponding control (one-way ANOVA). (e) LRRCC1 centrosomal levels in nocodazole-treated control or CRISPR mutant RPE1 cells stained with Ab2. Bars, mean ± SD, three independent experiments. p-Values are provided when statistically significant from the corresponding control (one-way ANOVA). (f) Percentage of ciliated cells in serum-deprived RPE1 cells treated with control or LRRCC1 siRNAs. Bars, mean ± SD, ≥83 cells from three independent experiments for each condition. p-Values are provided when statistically significant from the corresponding control (one-way ANOVA). (g) LRRCC1 centrosomal levels in control or CRISPR-edited (clone 25) HEK 293 cells stained with Ab1. Bars, mean ± SD, three independent experiments. p-Values are provided when statistically significant from the corresponding control (one-way ANOVA). (h) Centriole and procentriole in an RPE1 cell processed for ultrastructure expansion microscopy (U-ExM) and stained with anti-LRRCC1 (Ab1, yellow) and acetylated tubulin (magenta). Bar, 0.2 µm. (i) qRT-PCR analysis of PTCH1 expression in serum-deprived WT or CRISPR RPE1 cells treated with SMO-agonist (SAG) or DMSO during 24 hr, expressed as percentages of the DMSO-treated control. Mean ± SD, two independent experiments. (j) Number of centrioles per spindle pole in WT mitotic RPE1 cells, CRISPR clones 1.1 and 1.9, or WT cells treated with control or LRRCC1 siRNAs during 48 hr. Left: centrioles were labeled with antibodies against hPOC5 (yellow) and centrin (magenta). DNA is in cyan. Bar, 5 µm (inset, 2 µm). Right: quantification. Bars, mean ± SD, 50 cells from three independent experiments per condition. (k) Duration of mitosis in WT RPE1 cells and in LRRCC1-deficient CRISPR clones. Bars, mean ± SD, 100 cells from three independent experiments. p-Values are provided when statistically significant from the corresponding control (one-way ANOVA).
-
Figure 1—figure supplement 1—source data 1
Western blot analysis of LRRCC1 in Figure 1—figure supplement 1b.
- https://cdn.elifesciences.org/articles/72382/elife-72382-fig1-figsupp1-data1-v2.zip
Figure 1—figure supplement 2
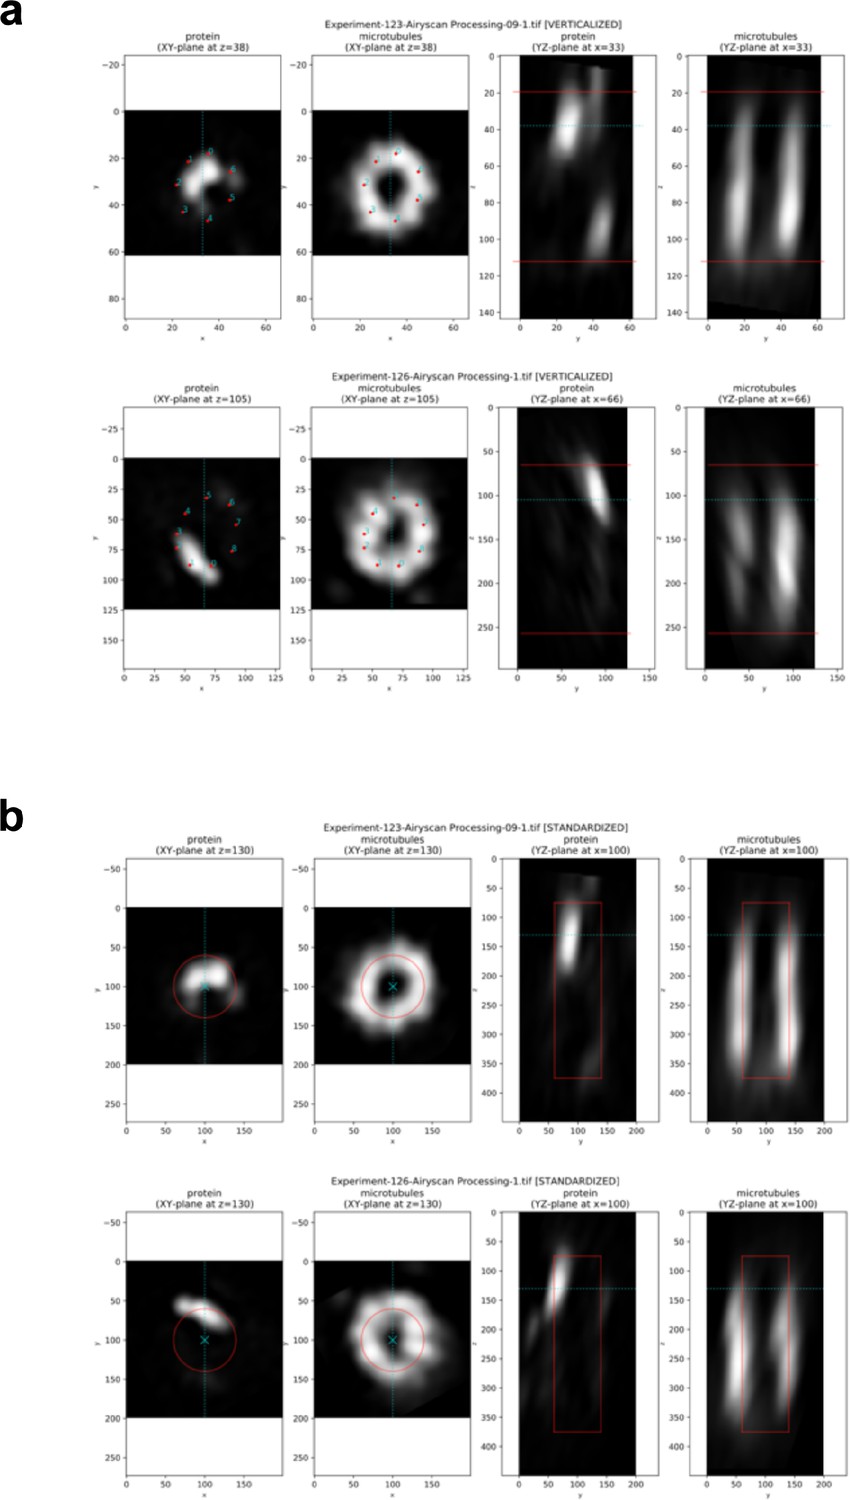
Pipeline for generating average protein maps.
(a) Examples of verticalized and annotated centrioles (one centriole per row). (A, B) XY cross section taken at z-position, at which the XY reference points have been provided. (C, D) YZ cross section taken at x-position, at which the centriole center has been calculated (from XY reference points). The mentioned z-position and x-position are shown with blue lines; red lines in the right columns show the Z reference points: the top and the bottom of the provided rectangular frame. Note that the centrioles significantly differ in their diameters and lengths (in pixels), and that the protein of interest is not always positioned in the same manner. (b) Examples of standardized images. (A, B) XY cross section taken at a fixed z-position slightly under the top of the Z reference rectangle (note that this position is slightly different from that at which the XY reference points were provided). (C, D) YZ cross section taken in the middle of the XY plane (the standardized centrioles are always placed with their centers in the middle of the image). The mentioned z-position and x-position are shown with blue lines; red shapes outline a cylinder with the target standard sizes: diameter 0.8 µm (4× expanded 0.2 µm), length 3 µm; image calibration 0.01 µm/pixel (all three parameters are tunable). Note that in contrast to the centrioles in (a), the diameter and the length of the standardized centrioles and the position of the protein of interest in the XY plane are very similar.
Figure 2
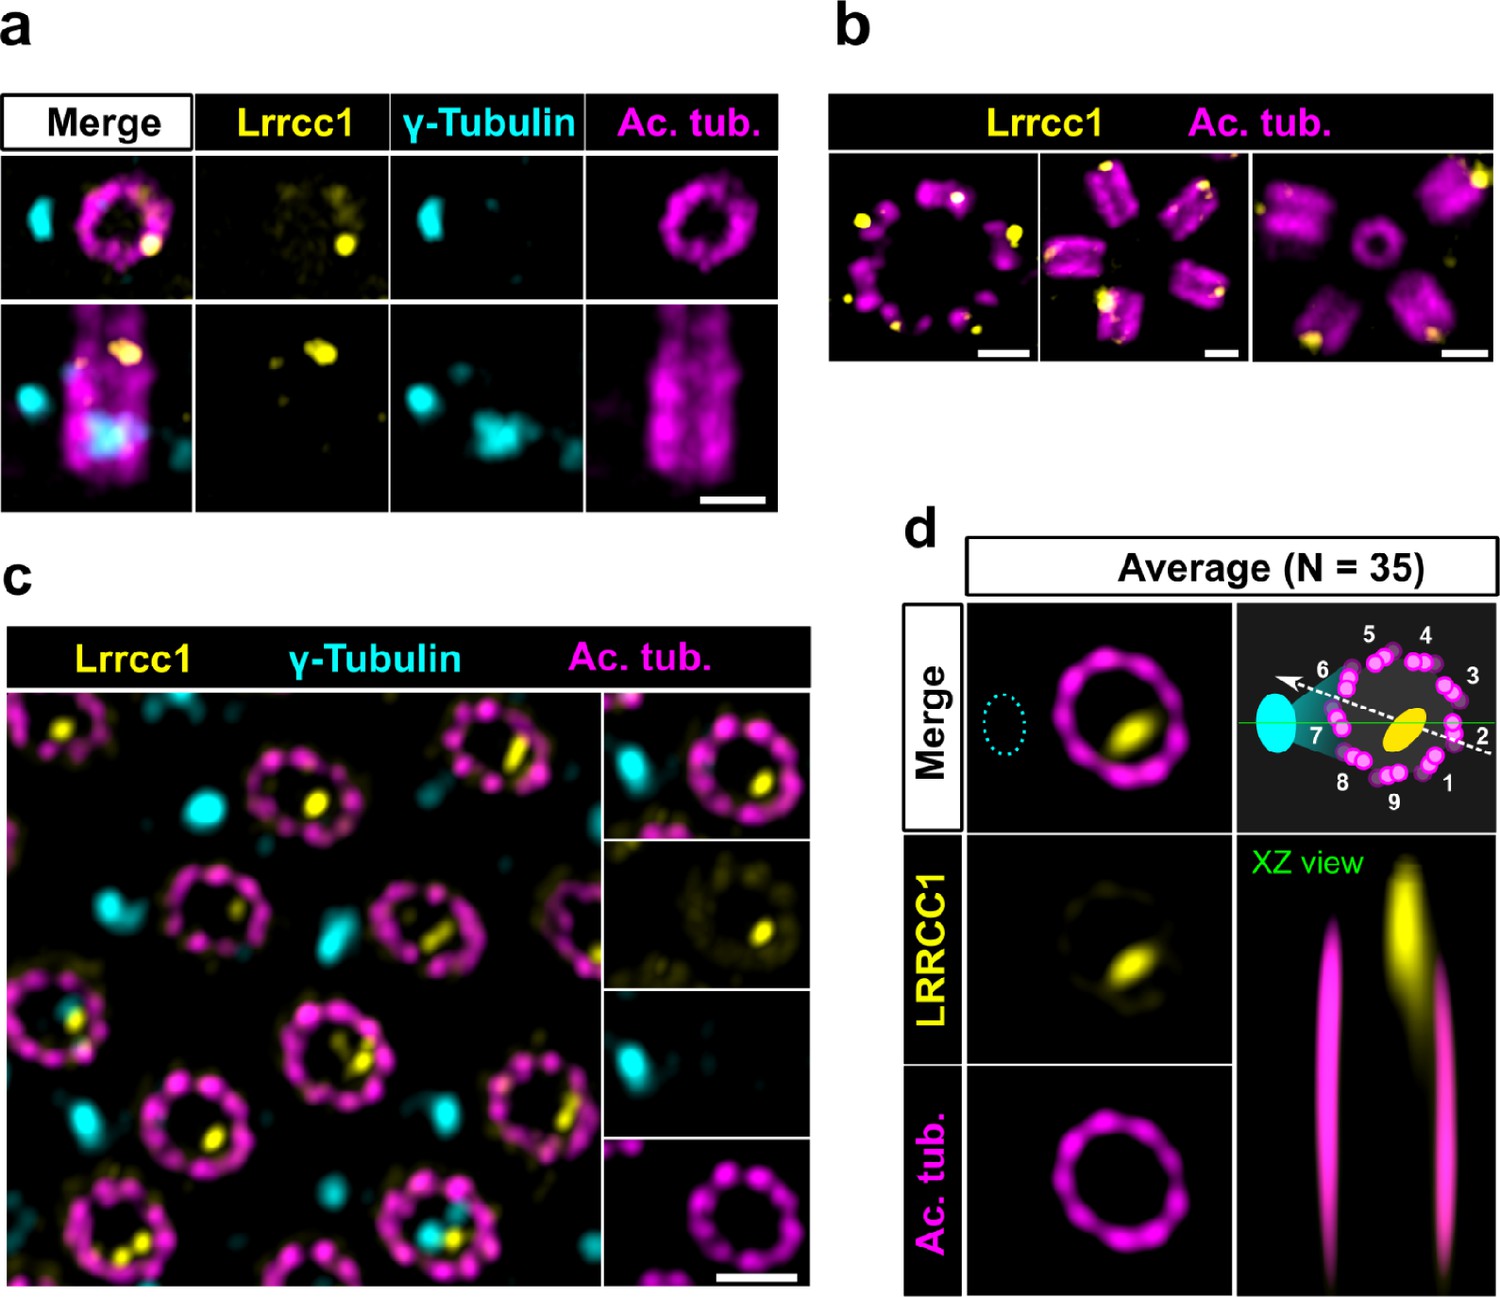
The LRRCC1 rotationally asymmetric pattern is conserved in mouse multiciliated cells (MCCs).
(a) Centrioles in the cytoplasm of mouse ependymal cells differentiating in vitro analyzed by ultrastructure expansion microscopy (U-ExM), in longitudinal and transverse view. Lrrcc1 (Ab2, yellow), γ-tubulin (basal foot cap, cyan), and acetylated tubulin (magenta). Of note, γ-tubulin was also detected in the proximal lumen of centrioles. Bar, 0.2 µm. (b) Procentrioles assembling via the centriolar (right) or the deuterosome pathway (left and center) in ependymal cells. Lrrcc1 (Ab2, yellow), acetylated tubulin (magenta). Bar, 0.2 µm. (c) Transverse view of centrioles docked at the apical membrane in fully differentiated mouse tracheal cells, viewed from the distal end. Lrrcc1 (Ab2, yellow), γ-tubulin (cyan), and acetylated tubulin (magenta). Bar, 0.2 µm. (d) Average image generated from 35 individual centrioles from mouse trachea, viewed from the distal end, shown in transverse and longitudinal views. The position of the basal foot (cyan dotted line) stained with γ-tubulin was used as a reference point to align the centrioles. A diagram of the average pattern in transverse view is shown, in which the direction of ciliary beat (Schneiter et al., 2021) is represented by a dotted arrow and the basal foot axis by a green line. Triplets are numbered counterclockwise from the LRRCC1 signal.
Figure 3
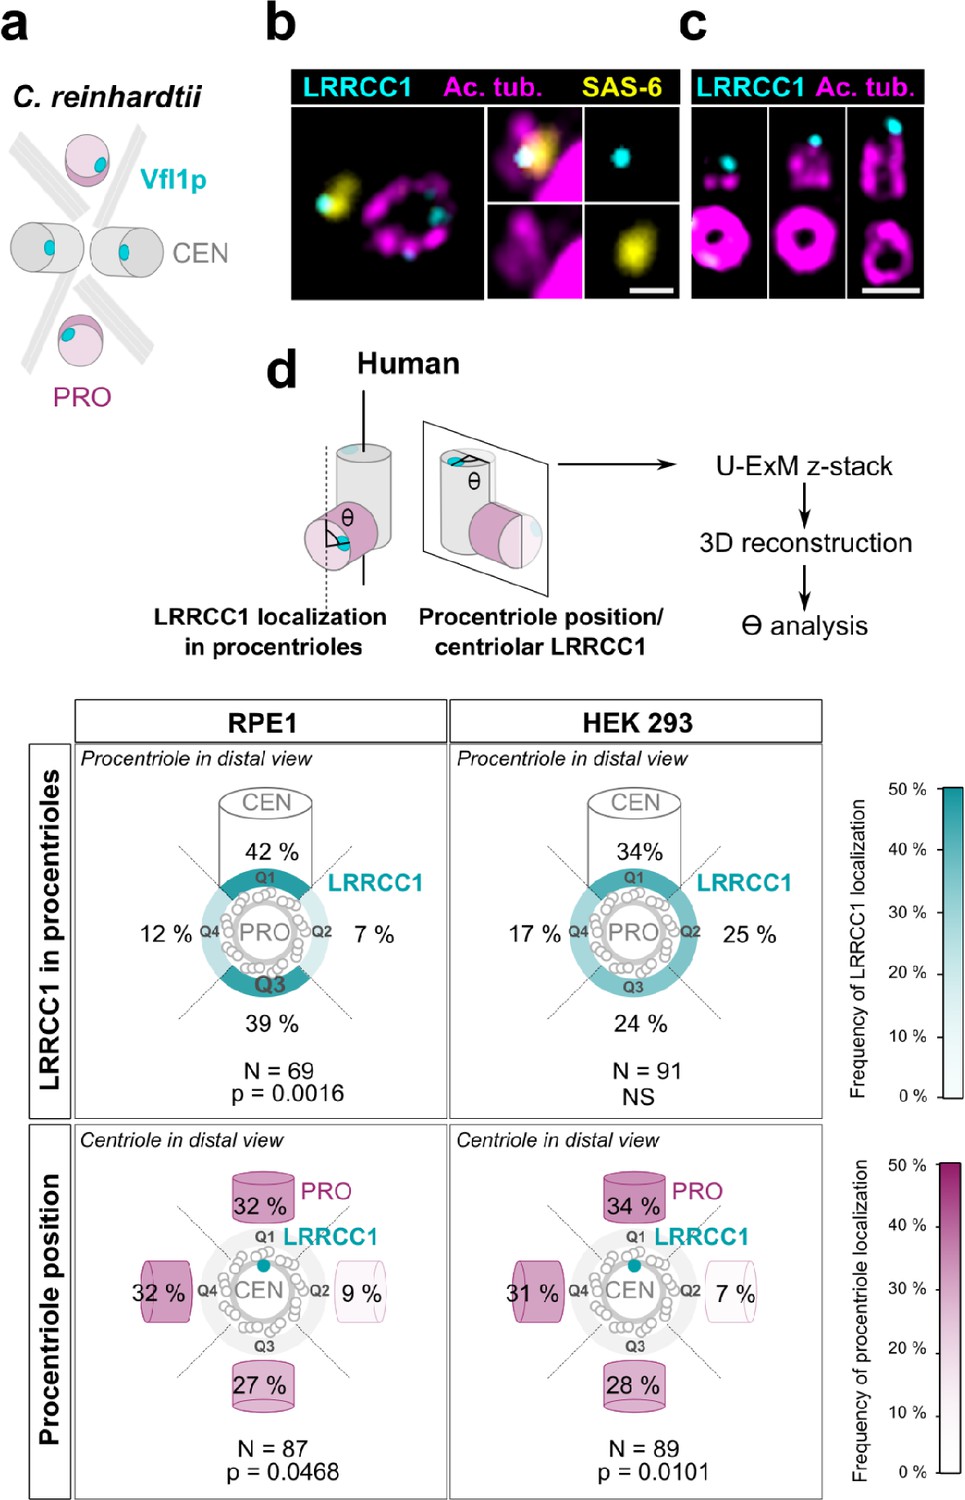
Procentriole assembly site is partly correlated with centriole rotational polarity.
(a) Diagram showing the localization of Vfl1p (cyan) in the centrioles/basal bodies (gray) and procentrioles/probasal bodies (pink) of C. reinhardtii. The microtubule roots are also shown. (b) Early stage of procentriole assembly stained for LRRCC1 (Ab2, cyan), SAS-6 (yellow), and acetylated tubulin (magenta) in a HEK 293 cell. The brightness of the acetylated tubulin labeling was increased in the insets. Bar, 0.1 µm. (c) Successive stages of centriole elongation in HEK 293 cells stained for LRRCC1 (Ab2, cyan) and acetylated tubulin (magenta). Bar, 0.1 µm. (d) Location of LRRCC1 in the procentrioles (top panels) and position of the procentriole relative to its parent centriole polarity (bottom panels), in RPE1 and HEK 293 centrioles analyzed by ultrastructure expansion microscopy (U-ExM). For each diplosome, the angle between LRRCC1 in the procentriole and the centriole long axis (top panels), or between the procentriole and LRRCC1 in the centriole (bottom panels) was measured. The number of diplosomes analyzed is indicated. p-Values are indicated when statistically different from a random distribution (χ2 test).
Figure 4 with 1 supplement
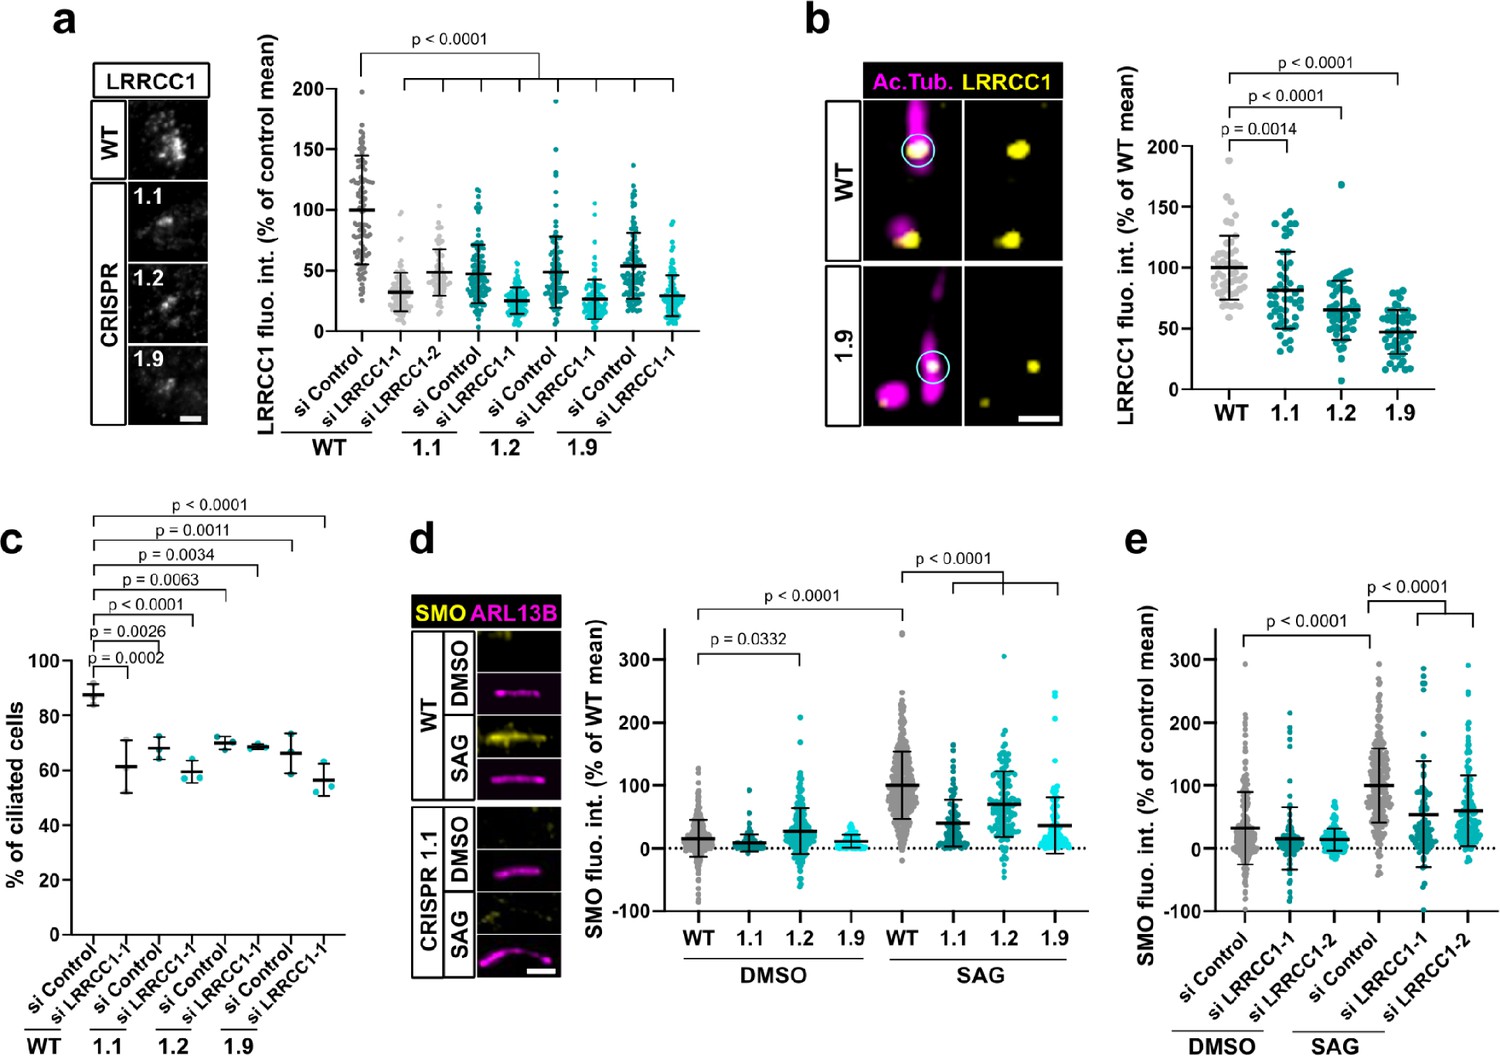
LRRCC1 is required for ciliary assembly and signaling.
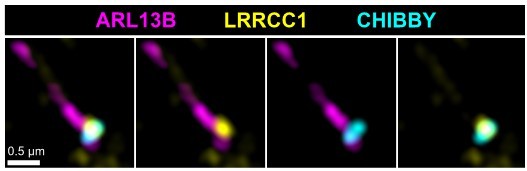
(a) Left: LRRCC1 staining (Ab2) of WT or LRRCC1-defficient RPE1 cells obtained by CRISPR/Cas9 editing (clones 1.1, 1.2, and 1.9). Bar, 2 µm. Right: quantification of fluorescence intensity in WT or CRISPR clones treated with control or LRRCC1 siRNAs. Bars, mean ± SD, three independent experiments. p-Values are provided when statistically significant from the corresponding control (one-way ANOVA). (b) Quantification of LRRCC1 distal pool at the mother centriole of ciliated WT or CRISPR cells. Left: Airyscan images showing the region of interest (circled). LRRCC1 (yellow), acetylated tubulin (magenta). Bar: 0.5 µm. Right: quantification of the corresponding signal. Bars, mean ± SD, ≥47 cells from two independent experiments. p-Values are provided when statistically significant from the corresponding control (one-way ANOVA). (c) Percentage of ciliated cells in WT or CRISPR cells treated with control or LRRCC1 siRNAs and serum-deprived during 24 hr. Bars, mean ± SD, ≥204 cells from three independent experiments for each condition. p-Values are provided when statistically significant from the corresponding control (one-way ANOVA). (d) Left: SMO (yellow) accumulation at primary cilia (ARL13B, magenta) following SMO-agonist (SAG)-induction of the Hedgehog pathway, in WT or CRISPR cells. Bar, 2 µm. Right: quantification of ciliary SMO expressed as a percentage of the SAG-treated WT mean. Bars, mean ± SD, three independent experiments. p-Values are provided when statistically significant from the corresponding control (one-way ANOVA). (e) Ciliary SMO expressed as a percentage of the SAG-induced control mean in RPE1 cells treated with control or LRRCC1 siRNAs. Bars, mean ± SD, three independent experiments. p-Values are provided when statistically significant from the corresponding control (one-way ANOVA).
Figure 4—figure supplement 1
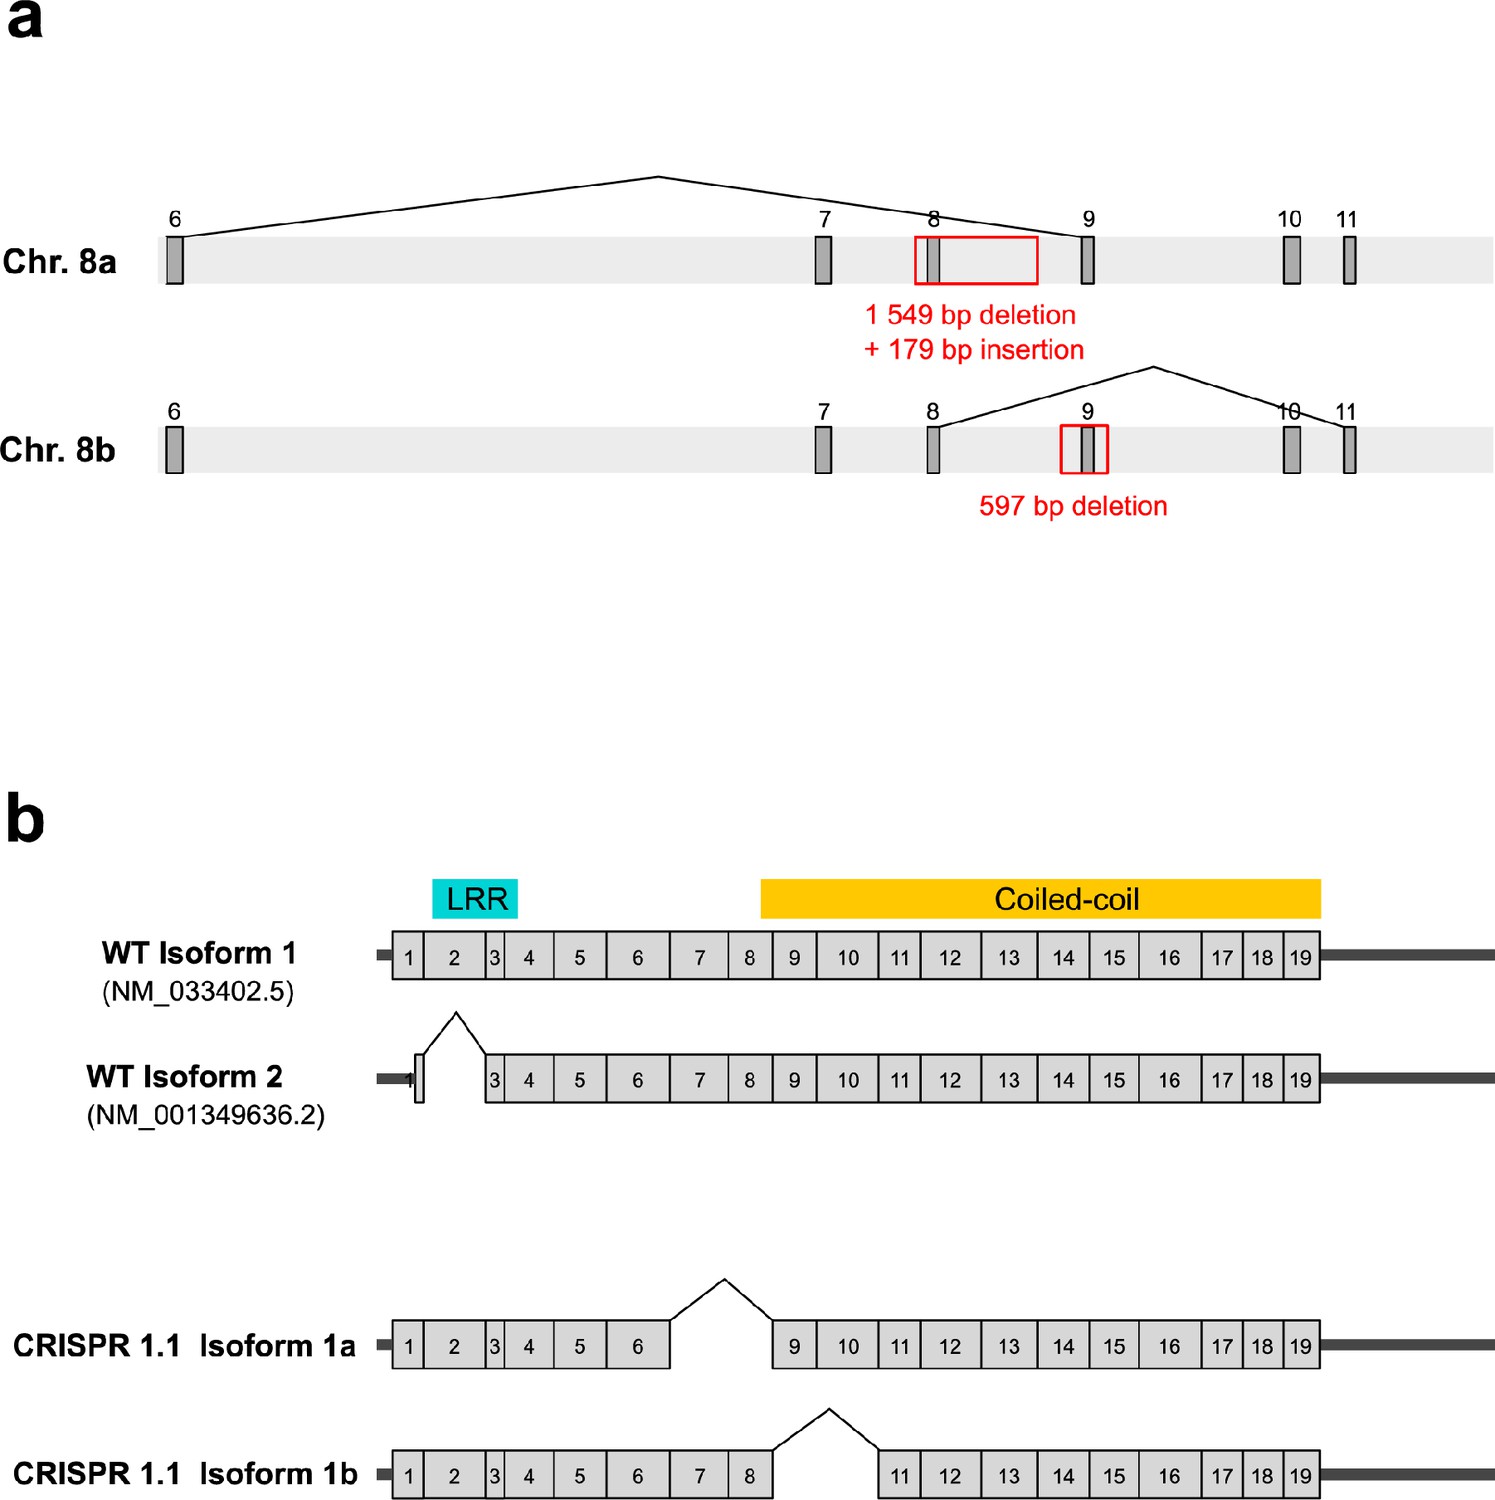
Genomic characterization of the 1.1 CRISPR cell line and analysis of the corresponding transcripts.
(a) Scheme showing the deletions and insertions observed in the genome of the CRISPR 1.1 line. In one copy of the LRRCC1 locus (chromosome 8.a), a 179 bp fragment corresponding to part of the deleted sequence is inserted in antisense orientation. Exons are represented by dark gray boxes and are numbered. (b) Comparison of wildtype and 1.1 transcripts. Top: wildtype LRRCC1 isoforms. Only the splicing of exon 2 is validated by comparison with EST databases. The location of the leucine-rich repeat (LRR) and coiled-coil domains is indicated. Bottom: two transcripts were detected in the CRISPR line 1.1. Isoform 1a exhibits splicing of exons 7–8 and is thus transcribed from chromosomes 8.a, and isoform 1b exhibits splicing of exons 9–10 and thus transcribed from chromosomes 8.b. Both transcripts are in frame but carry deletions compared to wildtype isoforms. Note that a fraction of these transcripts could also have a deletion of exon 2, as in wildtype cells.
Figure 5 with 1 supplement
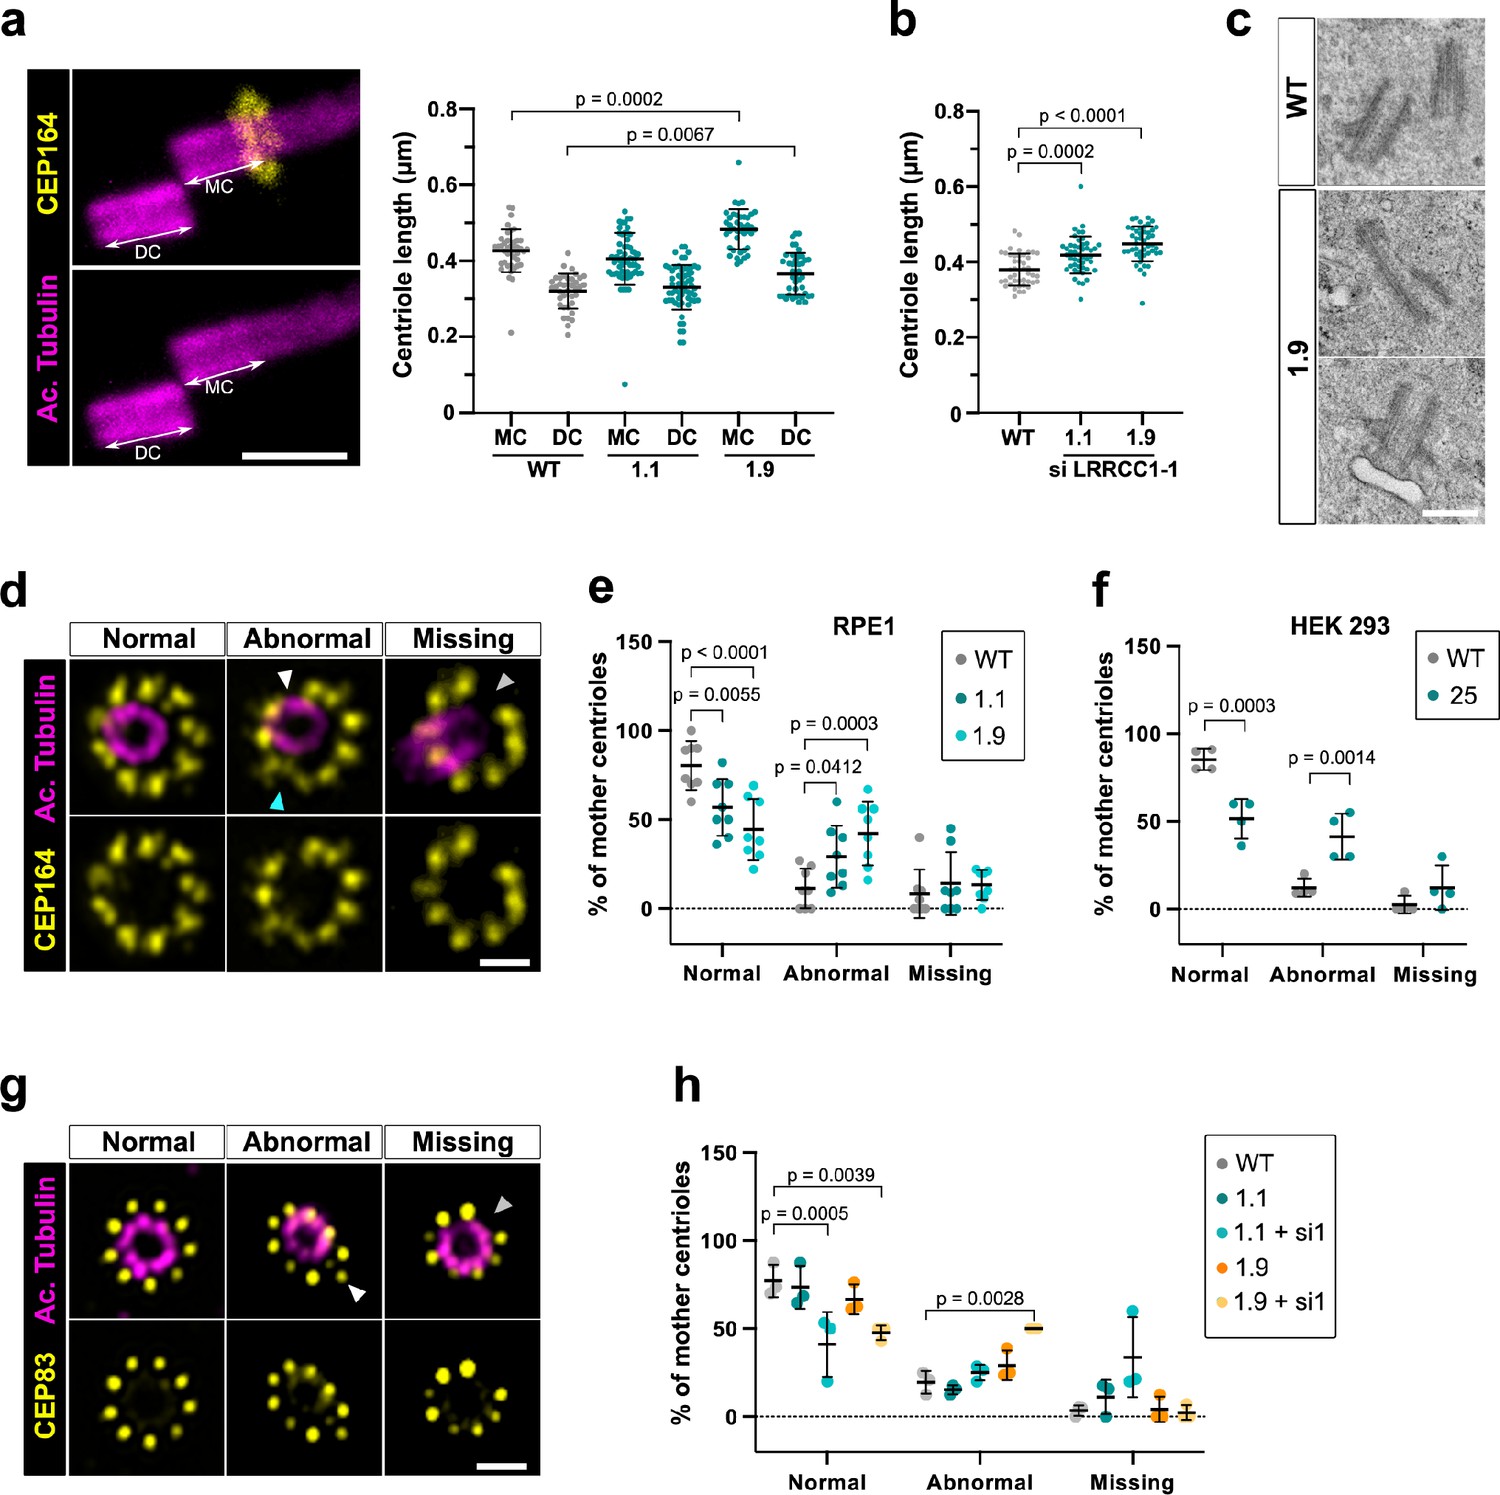
Depleting LRRCC1 induces defects in centriole structure.
(a) Centriole length in mother (MC) and daughter (DC) centrioles analyzed by ultrastructure expansion microscopy (U-ExM) in WT or LRRCC1-deficient clones (1.1 and 1.9). Left: centrioles were stained for acetylated tubulin (magenta) and CEP164 (yellow) to measure centriole length (arrows). Bar, 0.5 µm. Right: quantification. Bars, mean ± SD, ≥38 centrioles from three independent experiments. p-Values are provided when statistically significant from the corresponding control (one-way ANOVA). (b) Centriole length in control cells or CRISPR cells treated with LRRCC1 siRNA-1 and stained for acetylated tubulin and CEP83. Bars, mean ± SD, ≥43 centrioles from three independent experiments. p-Values are provided when statistically significant from the corresponding control (one-way ANOVA). (c) Transmission electron microscopy view of centrioles in WT and CRISPR (clone 1.9) RPE1 cells. Note that the 1.9 centrioles are from the same cell. N = 9 centrioles from eight different cells for clone 1.9, 3 centrioles from two different cells for WT. Bar, 0.5 µm. (d) Examples of normal distal appendages (DAs), DAs with abnormal morphology (white arrowhead: abnormal spacing between consecutive DAs; cyan arrowhead: abnormal DA shape) or missing DAs (gray arrowhead) in RPE1 cells stained with CEP164 (yellow) and analyzed by U-ExM. Images are maximum intensity projections of individual z-sections encompassing the CEP164 signal. Note that an apparent shift between channels occurs when centrioles are slightly angled with respect to the imaging axis. Bar, 1 µm. (e) Percentages of centrioles presenting anomalies in CEP164 staining in WT or CRISPR RPE1 cells. ≥87 centrioles from eight independent experiments for each condition. p-Values are provided when statistically significant from the corresponding control (two-way ANOVA). (f) Percentages of centrioles presenting anomalies in CEP164 staining in WT or CRISPR HEK 293 (clone 25) cells. ≥40 centrioles from four independent experiments for each condition. p-Values are provided when statistically significant from the corresponding control (two-way ANOVA). (g) Examples of normal DAs, DAs with abnormal morphology (white arrowhead) or missing DAs (gray arrowhead) in RPE1 cells stained with CEP83 (yellow) and analyzed by U-ExM. Images are maximum intensity projections of individual z-sections encompassing the CEP83 signal. Note that apparent shift between channels and decreased circularity occurs when centrioles are slightly angled with respect to the imaging axis. Bar, 1 µm. (h) Percentages of centrioles presenting anomalies in CEP83 staining in WT RPE1 cells and CRISPR clones with or without RNAi treatment. ≥56 centrioles from three independent experiments for each condition. p-Values are provided when statistically significant from the corresponding control (two-way ANOVA).
Figure 5—figure supplement 1
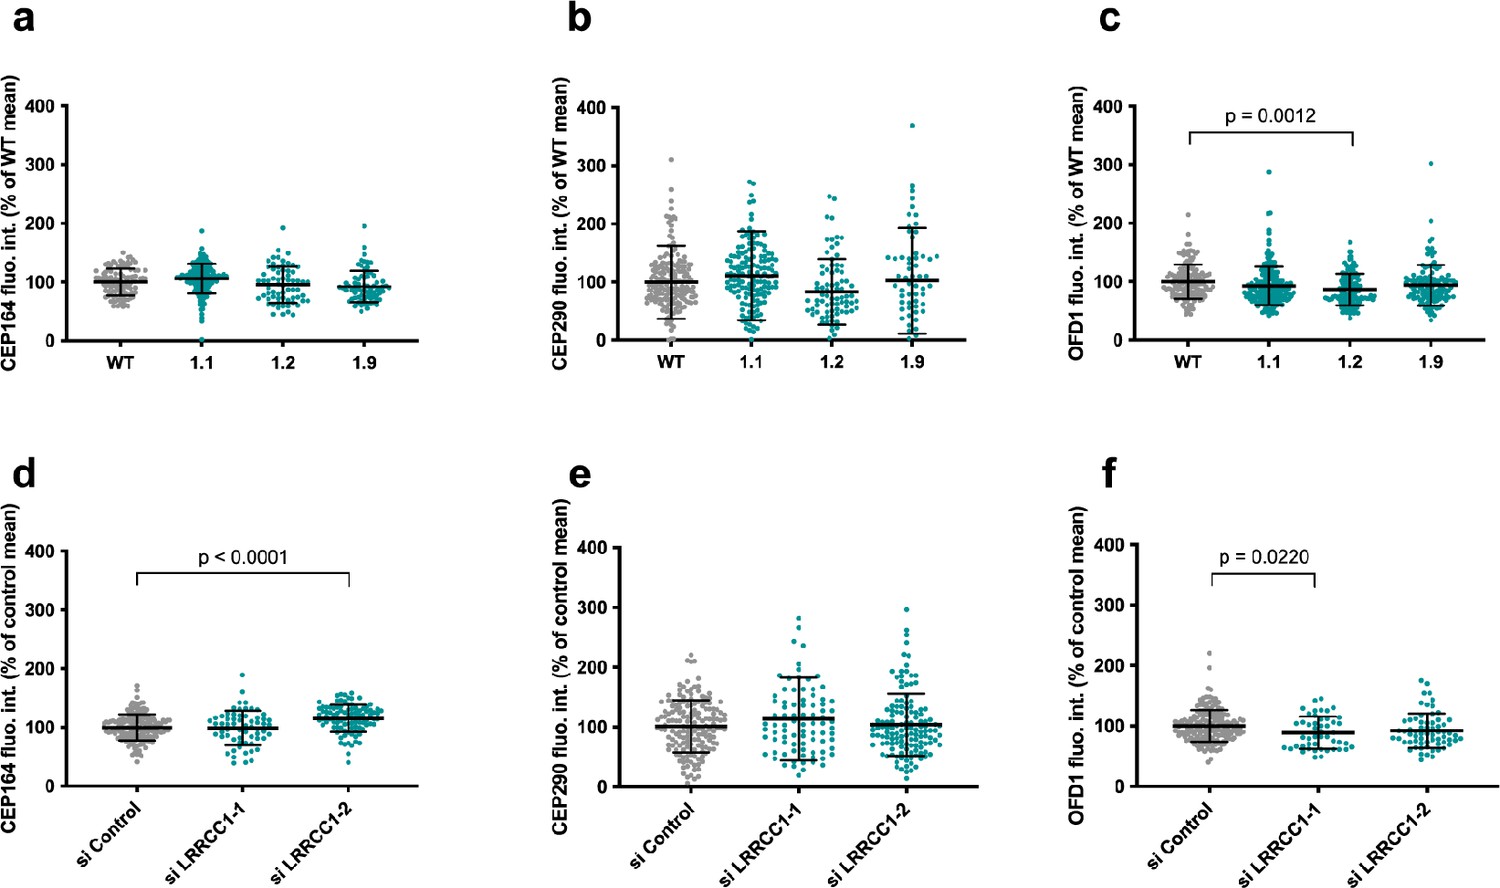
Quantification of distal appendage (DA) or distal centriole components in LRRCC1-deficient cells.
Centrosomal levels of CEP164 (a, d), CEP290 (b, e), and OFD1 (c, f) in RPE1 CRISPR clones (a–c) and RNAi-treated RPE1 cells (d–f). Bars, mean ± SD, three independent experiments. p-Values are provided when statistically significant from the corresponding control (one-way ANOVA).
Figure 6
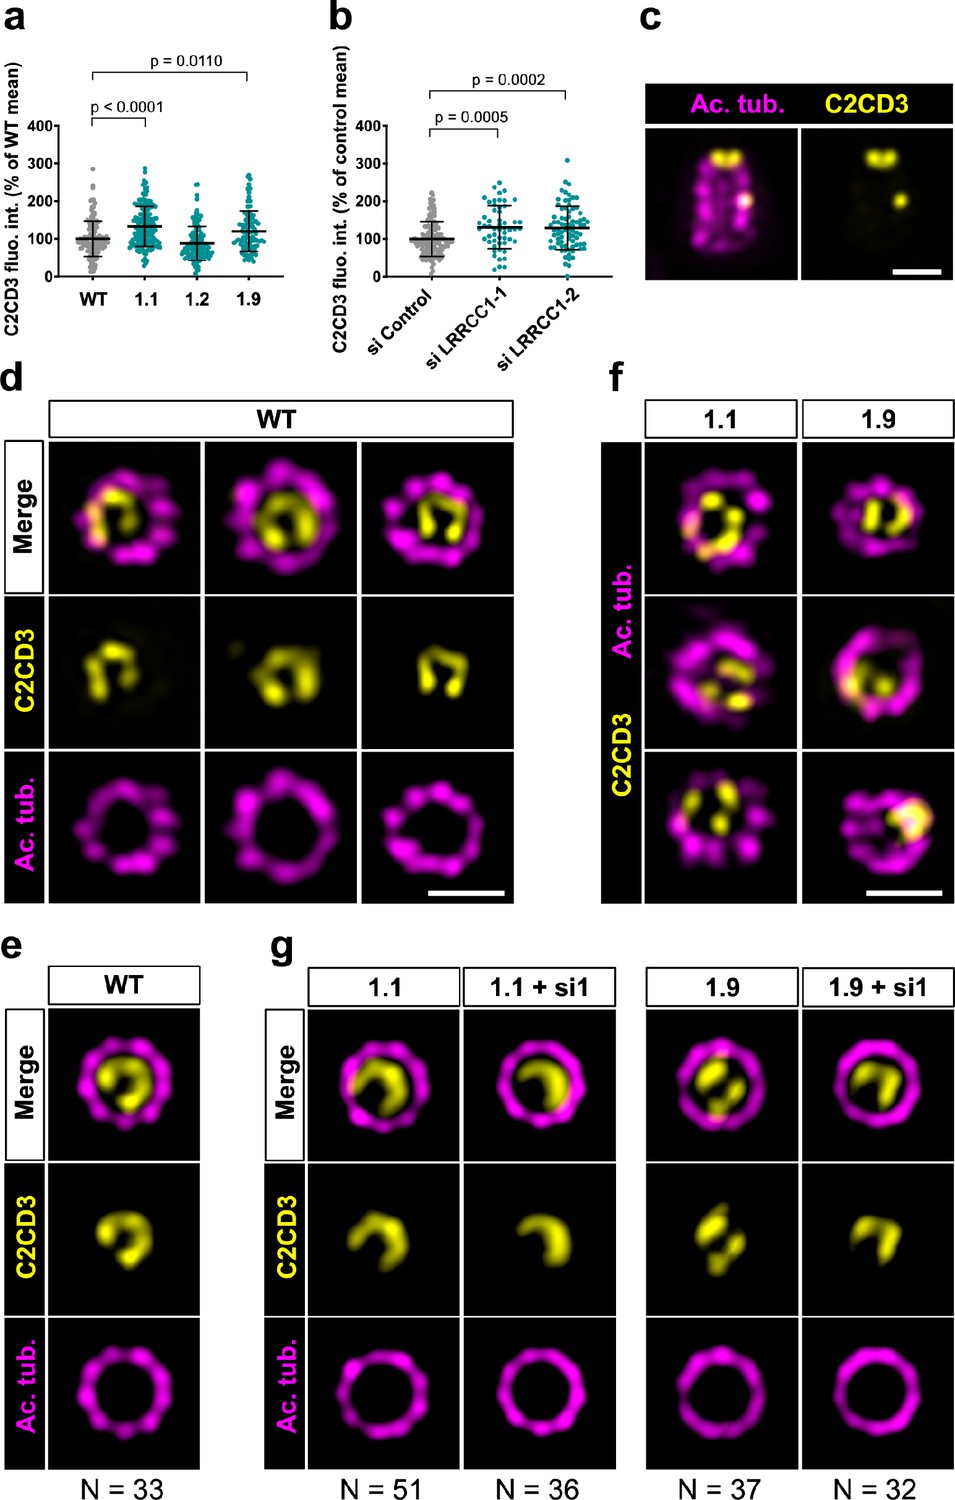
C2CD3 localizes asymmetrically at the distal end of centrioles and is affected by LRRCC1 depletion.
(a) C2CD3 levels at the centrosome of WT or CRISPR RPE1 cells. Bars, mean ± SD, three independent experiments. p-Values are provided when statistically significant from the corresponding control (one-way ANOVA). (b) C2CD3 levels at the centrosome in RPE1 cells treated with control or LRRCC1 siRNAs. Bars, mean ± SD, three independent experiments. p-Values are provided when statistically significant from the corresponding control (one-way ANOVA). (c) Longitudinal view of a centriole analyzed by ultrastructure expansion microscopy (U-ExM) and stained for C2CD3 (yellow) and acetylated tubulin (magenta). Bar, 0.2 µm. (d) Centrioles from WT RPE1 cells as viewed from the distal end. C2CD3 (yellow), acetylated tubulin (magenta). Images are maximum intensity projections of individual z-sections encompassing the C2CD3 signal. Note that an apparent shift between channels occurs when centrioles are slightly angled with respect to the imaging axis. Bar, 0.2 µm. (e) Average C2CD3 images obtained from 33 individual centrioles from WT RPE1 cells viewed from the distal end, in transverse views. One end of the C-pattern was used as a reference point to align individual centrioles. (f) Centrioles from untreated CRISPR cells or CRISPR cells treated with LRRCC1 RNAi in transverse section as viewed from the distal end. C2CD3 (yellow), acetylated tubulin (magenta). Images are maximum intensity projections of individual z-sections encompassing the C2CD3 signal. Note that an apparent shift between channels occurs when centrioles are slightly angled with respect to the imaging axis. Bar, 0.2 µm. (g) Average C2CD3 images obtained from untreated or RNAi-treated CRISPR cells viewed from the distal end, in transverse views. The number or individual centrioles used for generating each average is indicated.
Figure 7 with 1 supplement
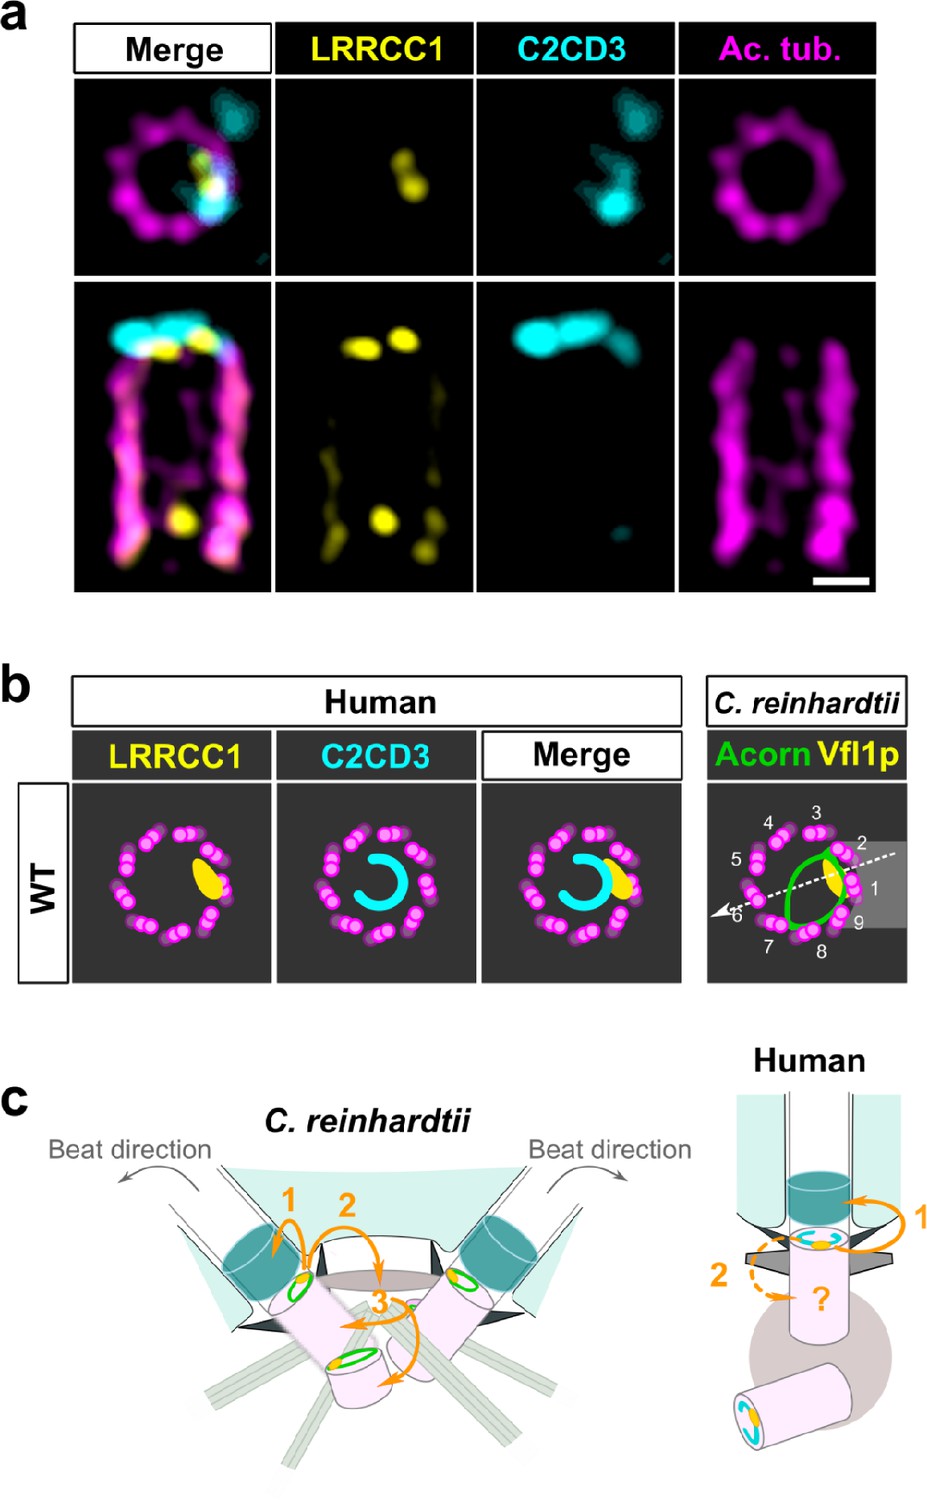
C2CD3 and LRRCC1 partially colocalize at the distal end of centrioles.
(a) RPE1 centrioles processed for ultrastructure expansion microscopy (U-ExM) and stained for LRRCC1 (Ab2, yellow), C2CD3 (cyan), and acetylated tubulin (magenta). Bar, 0.1 µm. (b) Model showing the possible location of LRRCC1 and C2CD3 relative to each other within human centrioles. Right panel: diagram showing the respective positions of the acorn (Geimer and Melkonian, 2004) and Vfl1p (Silflow et al., 2001) in C. reinhardtii. The direction of the flagellar beat is indicated by a dotted arrow, and the distal striated fiber is in gray. (c) Evolution of the roles played by Vfl1p/LRRCC1 proteins and associated rotationally asymmetric centriolar substructures. In C. reinhardtii, Vfl1p is required for proper ciliary assembly (1), as well as for the formation of fibers and microtubular roots (2) that control the position of centrioles and procentrioles (3), and overall cellular organization (Adams et al., 1985; Silflow et al., 2001). In human cells, LRRCC1 and C2CD3 are required for primary cilium assembly (1) – this study and Thauvin-Robinet et al., 2014; Ye et al., 2014 – and a role in asymmetric anchoring of cytoskeletal elements to the centriole may also be conserved (2), which could indirectly affect the determination of procentriole assembly site.
Figure 7—figure supplement 1
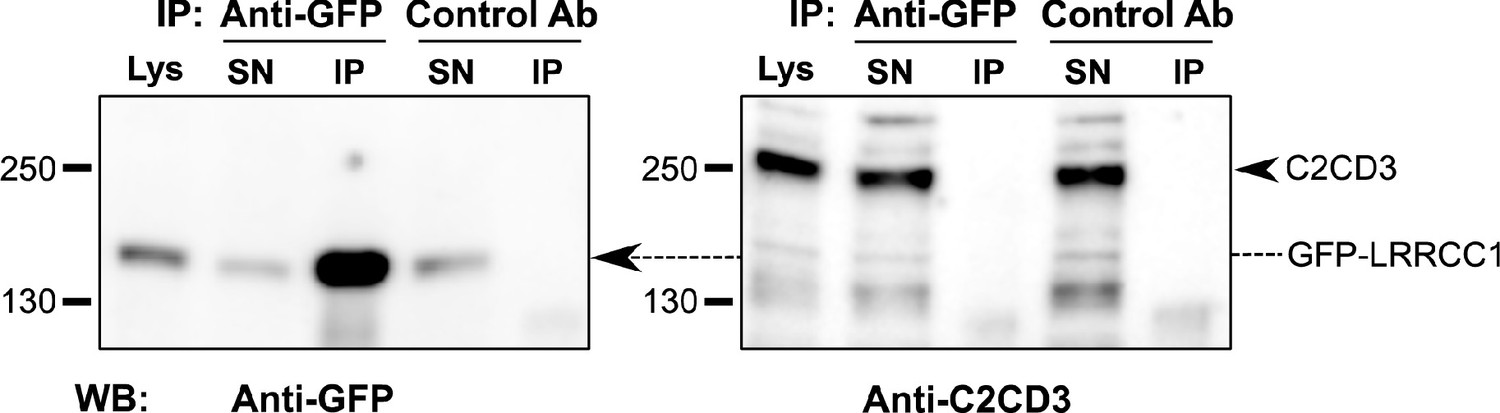
LRRCC1 does not interact directly with C2CD3.
Co-immunoprecipitation experiments from a lysate of HEK 293 cells expressing LRRCC1 with GFP inserted after aa 402. Anti-GFP or control (anti-HA tag) antibodies were used for immunoprecipitation, and Western blot was performed using either anti-GFP or anti-C2CD3 (RRID:AB_2718714) antibodies. Lys: lysate; SN: supernatant; IP: immunoprecipitation. The amount of lysate loaded on the gel represents 4% of the amount used for the immunoprecipitation.
-
Figure 7—figure supplement 1—source data 1
Western blot analysis of LRRCC1/C2CD3 co-immunoprecipitation assay.
- https://cdn.elifesciences.org/articles/72382/elife-72382-fig7-figsupp1-data1-v2.zip
Author response image 1
Author response image 2
Tables
Table 1
Antibodies used in this study.
| Antibody | DilutionIF | DilutionU-ExM | DilutionWB | RRID identifier | Source | Reference |
|---|---|---|---|---|---|---|
| Primary antibodies | ||||||
| Goat anti-ARL13B | 1:100 | / | / | RRID:AB_2058502 | Santa Cruz Biotechnology | sc-102318 |
| Guinea pig anti-alpha tubulin AA344 monobody | / | 1:500 | / | Geneva Antibody Facility | scFv-S11B | |
| Guinea pig anti-beta tubulin AA345 monobody | / | 1:500 | / | Geneva Antibody Facility | scFv-F2C | |
| Mouse anti-acetylated tubulin (6-11B-1) | 1:1000 | 1:500 | / | RRID:AB_628409 | Santa Cruz Biotechnology | sc-23950 |
| Mouse anti-Centrin (20H5) | 1:500 | / | / | RRID:AB_10563501 | Sigma-Aldrich | 04–1624 |
| Mouse anti-CEP290 (B-7) | 1:500 | / | / | RRID:AB_2890036 | Santa Cruz Biotechnology | sc-390462 |
| Mouse anti-gamma tubulin (GTU88) | 1:2000 | 1:200 | / | RRID:AB_532292 | Sigma-Aldrich | T5326 |
| Mouse anti-SAS-6 | / | 1:100 | / | RRID:AB_1128357 | Santa Cruz Biotechnology | sc-81431 |
| Mouse anti-Smoothened | 1:200 | / | / | RRID:AB_1270802 | Abcam | ab72130 |
| Rabbit anti-ARL13B | 1:500 | / | / | RRID:AB_2060867 | Proteintech | 17711–1-AP |
| Rabbit anti-C2CD3 | 1:500 | 1:500 | / | RRID:AB_10669542 | Sigma-Aldrich | HPA038552 |
| Rabbit anti-C2CD3 | / | / | 1:1000 | RRID:AB_2718714 | Thermo Fisher Scientific | PA5-72860 |
| Rabbit anti-CEP83 | / | 1:500 | / | RRID:AB_10674547 | Sigma-Aldrich | HPA038161 |
| Rabbit anti-CEP164 | 1:500 | 1:300 | / | RRID:AB_2651175 | Proteintech | 22227–1-AP |
| Rabbit anti-GFP | / | / | 1:1000 | RRID:AB_591816 | MBL International | 598 |
| Rabbit anti-HA | / | / | 1:1000 | RRID:AB_631618 | Santa Cruz Biotechnology | sc-805 |
| Rabbit anti-hPOC5 | 1:500 | / | / | Azimzadeh et al., 2009 | ||
| Rabbit anti-KI67 | 1:1000 | / | / | RRID:AB_443209 | Abcam | ab15580 |
| Rabbit anti-LRRCC1 Ab1 | 1:500 | 1:200 | / | This study | ||
| Rabbit anti-LRRCC1 Ab2 | 1:500 | 1:300 | 1:1000 | This study | ||
| Rabbit anti-OFD1 | 1:500 | / | / | RRID:AB_2890033. | Sigma-Aldrich | ABC961 |
| Sheep anti-C2CD3 | 1:200 | 1:100 | / | RRID:AB_10997138 | R&D Systems | AF7348 |
| Secondary antibodies | ||||||
| Donkey anti-goat IgG H&L (Alexa Fluor 488) | 1:500 | 1:500 | / | RRID:AB_2687506 | Abcam | ab150129 |
| Donkey anti-goat IgG H&L (Alexa Fluor 568) | 1:500 | 1:500 | / | RRID:AB_2636995 | Abcam | ab175474 |
| Donkey anti-goat IgG H&L (Alexa Fluor 647) | 1:500 | 1:100 | / | RRID:AB_2732857 | Abcam | ab150131 |
| Donkey anti-mouse IgG H&L (Alexa Fluor 488) | 1:500 | 1:500 | / | RRID:AB_2732856 | Abcam | ab150105 |
| Donkey Anti-Mouse IgG H&L (Alexa Fluor 568) | 1:500 | 1:500 | / | RRID:AB_2636996 | Abcam | ab175472 |
| Donkey anti-mouse IgG H&L (Alexa Fluor 647) | 1:500 | 1:100 | / | RRID:AB_2890037 | Abcam | ab150107 |
| Donkey anti-rabbit IgG H&L (Alexa Fluor 488) | 1:500 | 1:500 | / | RRID:AB_2636877 | Abcam | ab150073 |
| Donkey anti-rabbit IgG H&L (Alexa Fluor 647) | 1:500 | 1:500 | / | RRID:AB_2752244 | Abcam | ab150075 |
| Donkey anti-sheep IgG H&L (Alexa Fluor 647) | / | 1:100 | / | RRID:AB_2884038 | Abcam | ab150179 |
| Goat anti-guinea pig IgG (H+L) (Alexa Fluor 568) | / | 1:100 | / | RRID:AB_141954 | Thermo Fisher Scientific | A-11075 |
| Goat anti-rabbit IgG (H+L) horseradish peroxidase conjugate | / | / | 1:1000 | RRID:AB_2536530 | Thermo Fisher Scientific | G-21234 |
-
IF: immunofluorescence; U-ExM: ultrastructure expansion microscopy WB: Western blot.
Table 2
Primers used for quantitative RT-PCR.
| Primer | Sequence |
|---|---|
| LRRCC1-1_Fw | CAA CAA GGA TCT TCT CTA GCC CA |
| LRRCC1-1_Rv | AGT TTG GTC GTC TAT GAT TTT GCA |
| LRRCC1-2_Fw | GCA CAA CAA GGA TCT TCT CTA GC |
| LRRCC1-2_Rv | TCG CAG ACA TTC ATT CTC TCT AGA |
| PTCH1_Fw | CCC CTG TAC GAA GTG GAC ACT CTC |
| PTCH1_Rv | AAG GAA GAT CAC CAC TAC CTT GGC T |
| CHMP2A_Fw | ATG GGC ACC ATG AAC AGA CAG |
| CHMP2A_Rv | TCT CCT CTT CAT CTT CCT CAT CAC |
| EMC7_Fw | GTC AGA CTG CCC TAT CCT CTC C |
| EMC7_Rv | CAT GTC AGG ATC ACT TGT GTT GAC |
Additional files
Download links
A two-part list of links to download the article, or parts of the article, in various formats.
Downloads (link to download the article as PDF)
Open citations (links to open the citations from this article in various online reference manager services)
Cite this article (links to download the citations from this article in formats compatible with various reference manager tools)
Evolutionary conservation of centriole rotational asymmetry in the human centrosome
eLife 11:e72382.
https://doi.org/10.7554/eLife.72382


