Filopodia powered by class x myosin promote fusion of mammalian myoblasts
- Department of Pharmacology & Therapeutics, University of Florida College of Medicine, United States
- University of Florida Myology Institute, United States
- Department of Cell Biology & Physiology and Lineberger Comprehensive Cancer Center, University of North Carolina at Chapel Hill School of Medicine, United States
- Cell Biology and Physiology Center, National Heart, Lung and Blood Institute, United States
Figures
Figure 1 with 1 supplement
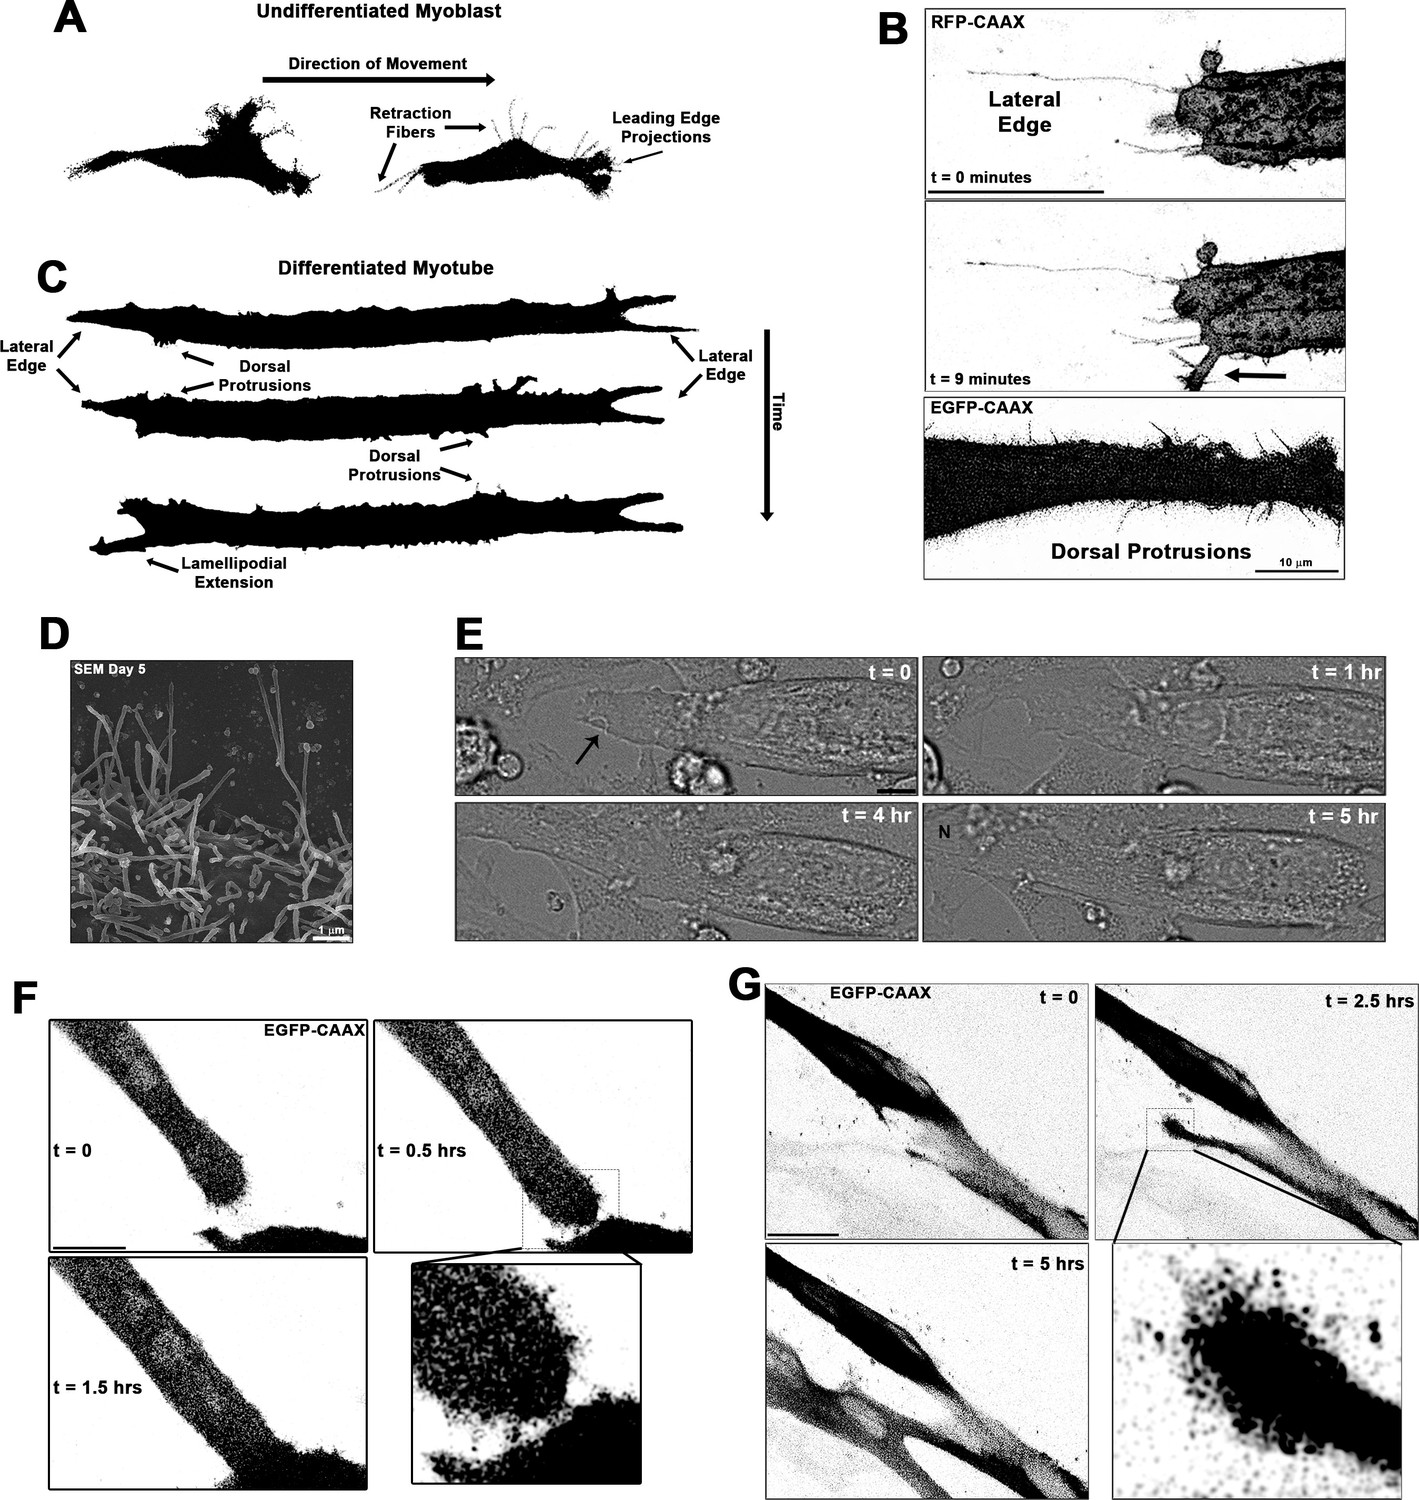
Cellular projections are prominent on differentiating muscle cells and participate in cell fusion.
(A) A summary schematic depicting the cellular protrusions exhibited by undifferentiated myoblasts. (B) Live-cell confocal microscopy of differentiated myotubes (day 5) expressing a membrane-targeted fluorescent protein constructs (RFP-CAAX or GFP-CAAX) reveals myogenic projections are dynamic structures featured across the cell surface, including prominent lateral edge projections, dorsal protrusions, and those emerging from lamellipodial extensions (indicated by arrow). (C) Summary schematic displaying cellular projections associated with differentiated myotubes. (D) Cellular projections visualized on the surface of differentiating myoblasts by scanning electron microscopy (SEM). (E) Differential interference contrast imaging of a myotube exhibiting lateral edge protrusions (indicated by arrow) actively engaged in myoblast fusion (N indicates newly incorporated nucleus; days 4–5). Fluorescently labeled myoblasts utilizing (F) lateral edge protrusions and (G) a lamellipodial extension adorned with fine protrusions to promote fusion with adjacent cells (differentiation days 4–5). EGFP-CAAX in (G) becomes transferred to the non-expressing cell upon fusion, making the newly added cell visible via fluorescence. Unless otherwise noted, scale bars represent 25 µm.
Figure 1—figure supplement 1
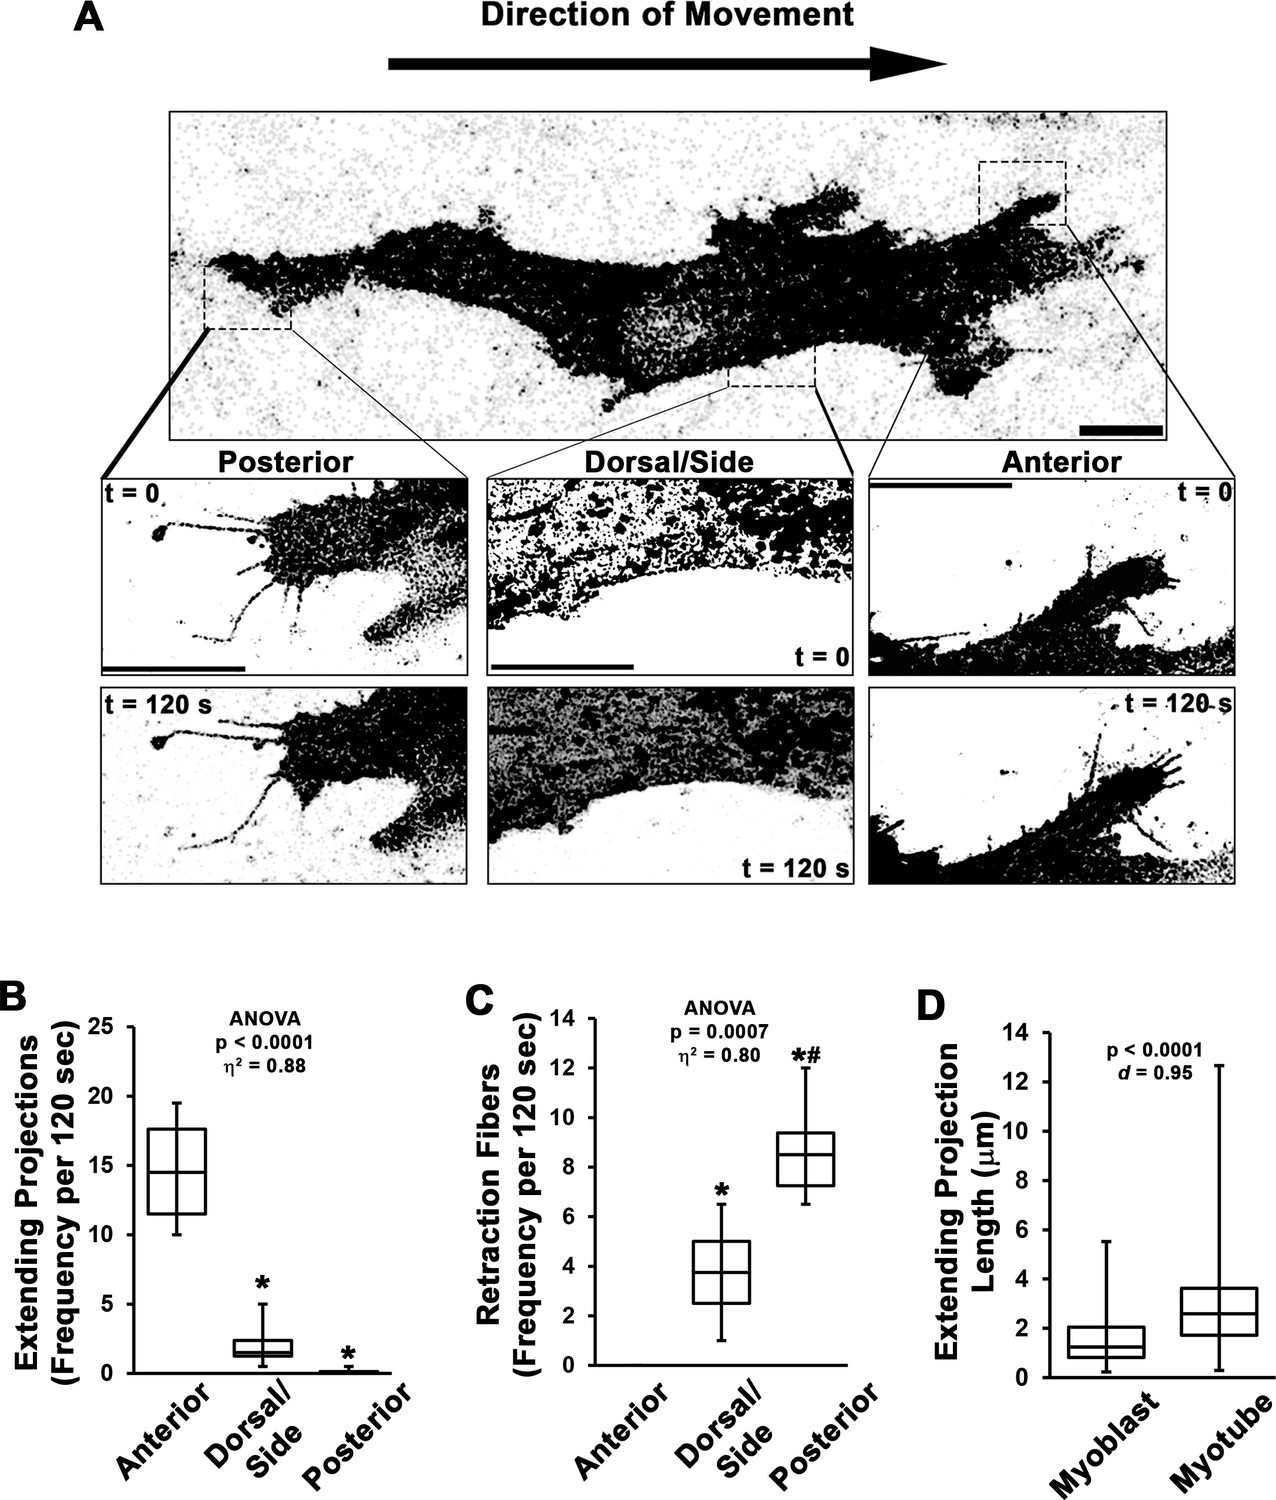
Dynamics of myoblast cellular projections.
(A–C) Analysis of cellular projections in undifferentiated myoblasts expressing RFP-CAAX reveals elongating cellular projections are primarily observed on the anterior leading edge of the cell, whereas retraction fibers are the predominant cellular extensions observed away from the cell anterior (n = 4 independent experiments). (D) Quantification of extending projection length in undifferentiated myoblasts and differentiated myotubes (n = 115–244 projections from three individual cultures). Data are presented as box-and-whisker plots depicting second and third quartiles with minimum and maximum values and were analyzed using (B–C) one-way ANOVA followed by Tukey post hoc tests (α = 0.05; *p < 0.05 vs. anterior values; #p < 0.05 vs. dorsal/side values) or (D) two-tailed Welch’s t-tests with effect size presented as Cohen’s d (d). Scale bars represent 5 µm.
-
Figure 1—figure supplement 1—source data 1
Source data file for Figure 1—figure supplement 1B-C.
- https://cdn.elifesciences.org/articles/72419/elife-72419-fig1-figsupp1-data1-v2.pdf
-
Figure 1—figure supplement 1—source data 2
Source data file for Figure 1—figure supplement 1D.
- https://cdn.elifesciences.org/articles/72419/elife-72419-fig1-figsupp1-data2-v2.pdf
Figure 2 with 1 supplement
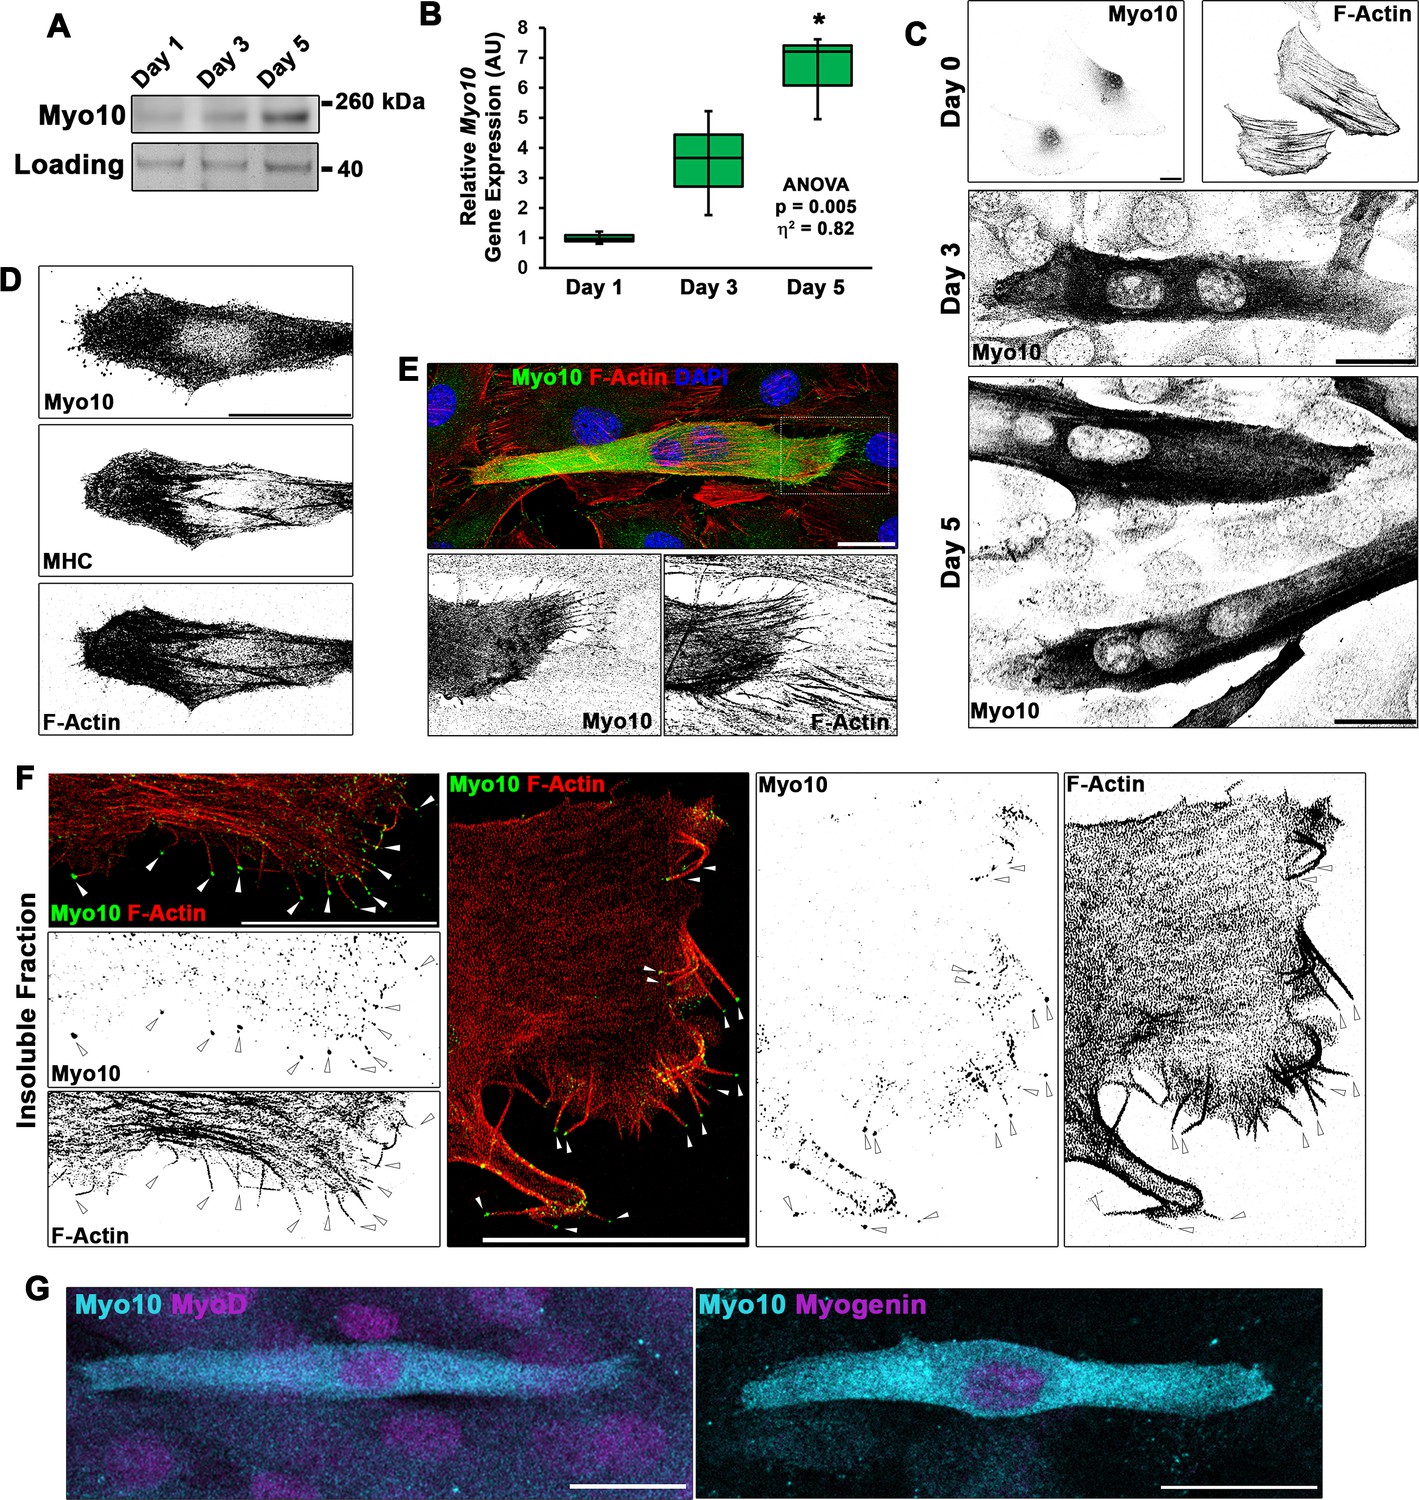
Differentiating myoblast cultures express class X myosin (Myo10).
(A) Myo10 protein content, as shown by immunoblotting, and (B) Myo10 gene expression, as measured by real-time PCR (n = 3 independent cultures for each time point; normalized to Gapdh), is increased during the myoblast differentiation time course. (C) Immunofluorescence (IF) reveals that the increase in Myo10 in differentiating myoblast cultures is localized primarily to differentiated myotubes, which (D) also express the muscle terminal differentiation marker, myosin heavy chain (MHC). (E) The Myo10-positive cellular extensions of differentiated myoblasts contain F-actin. (F) IF of the insoluble fraction of differentiating myoblasts reveals that insoluble Myo10 is found distinctly at the tips of F-actin bundles (indicated by arrows). (G) Myo10-positive myoblasts exhibit nuclear staining for both MyoD and Myogenin muscle regulatory factors, as shown by IF, following 1 day of exposure to differentiation conditions. Gene expression data are presented as box-and-whisker plots depicting second and third quartiles with minimum and maximum values (relative to day 1 values). Data were analyzed using one-way ANOVA followed by Tukey post hoc tests (α = 0.05; *p < 0.05 vs. day 1 values; effect size is presented as eta-squared (η2)). Unless otherwise noted, scale bars represent 25 µm.
-
Figure 2—source data 1
Source data file for Figure 2B.
- https://cdn.elifesciences.org/articles/72419/elife-72419-fig2-data1-v2.pdf
Figure 2—figure supplement 1
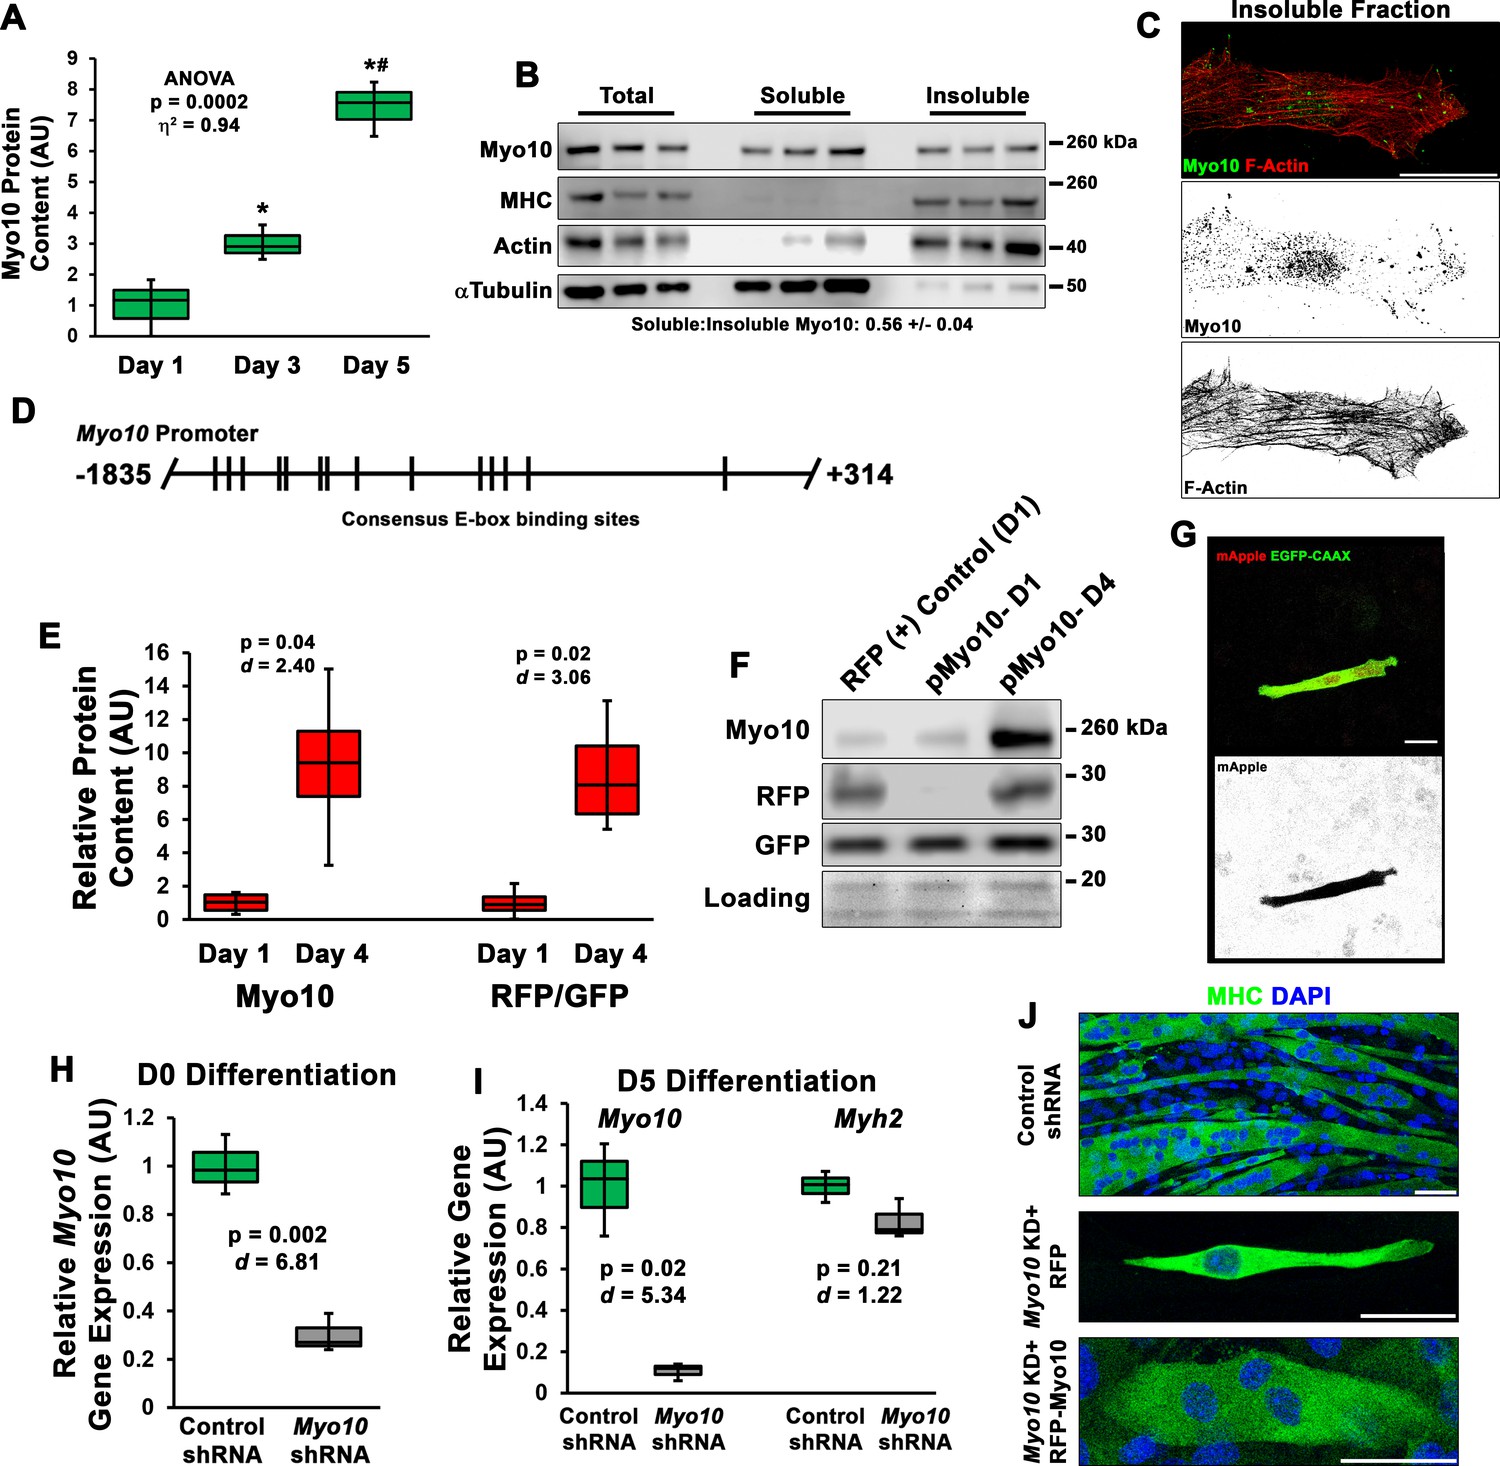
Class X myosin (Myo10) is expressed by myoblasts during muscle differentiation and is required for myoblast fusion.
(A) Myo10 protein content increases during myoblast differentiation, as measured by immunoblotting (n = 3 individual experiments). (B) Fractionation of differentiation day 5 myoblast cultures into soluble and insoluble cellular fractions reveals that the slight majority of Myo10 content exists in the soluble fraction. (C) Immunofluorescence (IF) of differentiated myoblast insoluble fractions shows that Myo10 of the insoluble cellular fraction is associated with the actin cytoskeleton (as shown by phalloidin staining) and can be found at the tips of thin cellular projections. (D) Schematic of the consensus E-box-binding motifs (CANNTG) identified in the Myo10 promoter. (E–F) Activation of the Myo10 promoter reporter plasmid in differentiating myoblasts co-transfected with constitutively expressed GFP-CAAX and mApple (RFP) driven by the Myo10 promoter depicted in (D) (n = 4 individual experiments). (G) Expression of RFP in a differentiating myoblast following 1 day of differentiation. Efficient shRNA-mediated knockdown (KD) of myoblast Myo10 gene expression in (H) undifferentiated and (I) differentiated myoblasts, whereas muscle differentiation is not affected by Myo10 KD, as indicated by Myh2 expression, a gene encoding a mature myosin heavy chain (MHC) expressed by skeletal muscle (n = 3 individual experiments). (J) Representative images of MHC IF of control shRNA cells, Myo10 KD cells expressing a control RFP plasmid after 7 days of differentiation, and Myo10 KD cells expressing an RFP-Myo10 rescue plasmid. Data are presented as box-and-whisker plots depicting second and third quartiles with minimum and maximum values. Data of (A) were analyzed using one-way ANOVA followed by Tukey post hoc tests (α = 0.05; *p < 0.05 vs. day 1 values; #p < 0.05 vs. day 3 values; effect size is presented as eta-squared (η2)). Data of (E) and (H–I) were analyzed using two-tailed Welch’s t-tests with effect size presented as Cohen’s d (d). Scale bars represent (G) 10 or (C, J) 25 µm.
-
Figure 2—figure supplement 1—source data 1
Source data file for Figure 2—figure supplement 1A.
- https://cdn.elifesciences.org/articles/72419/elife-72419-fig2-figsupp1-data1-v2.pdf
-
Figure 2—figure supplement 1—source data 2
Source data file for Figure 2—figure supplement 1B.
- https://cdn.elifesciences.org/articles/72419/elife-72419-fig2-figsupp1-data2-v2.pdf
-
Figure 2—figure supplement 1—source data 3
Source data file for Figure 2—figure supplement 1E.
- https://cdn.elifesciences.org/articles/72419/elife-72419-fig2-figsupp1-data3-v2.pdf
-
Figure 2—figure supplement 1—source data 4
Source data file for Figure 2—figure supplement 1F.
- https://cdn.elifesciences.org/articles/72419/elife-72419-fig2-figsupp1-data4-v2.pdf
-
Figure 2—figure supplement 1—source data 5
Source data file for Figure 2—figure supplement 1H.
- https://cdn.elifesciences.org/articles/72419/elife-72419-fig2-figsupp1-data5-v2.pdf
-
Figure 2—figure supplement 1—source data 6
Source data file for Figure 2—figure supplement 1I.
- https://cdn.elifesciences.org/articles/72419/elife-72419-fig2-figsupp1-data6-v2.pdf
Figure 3 with 2 supplements
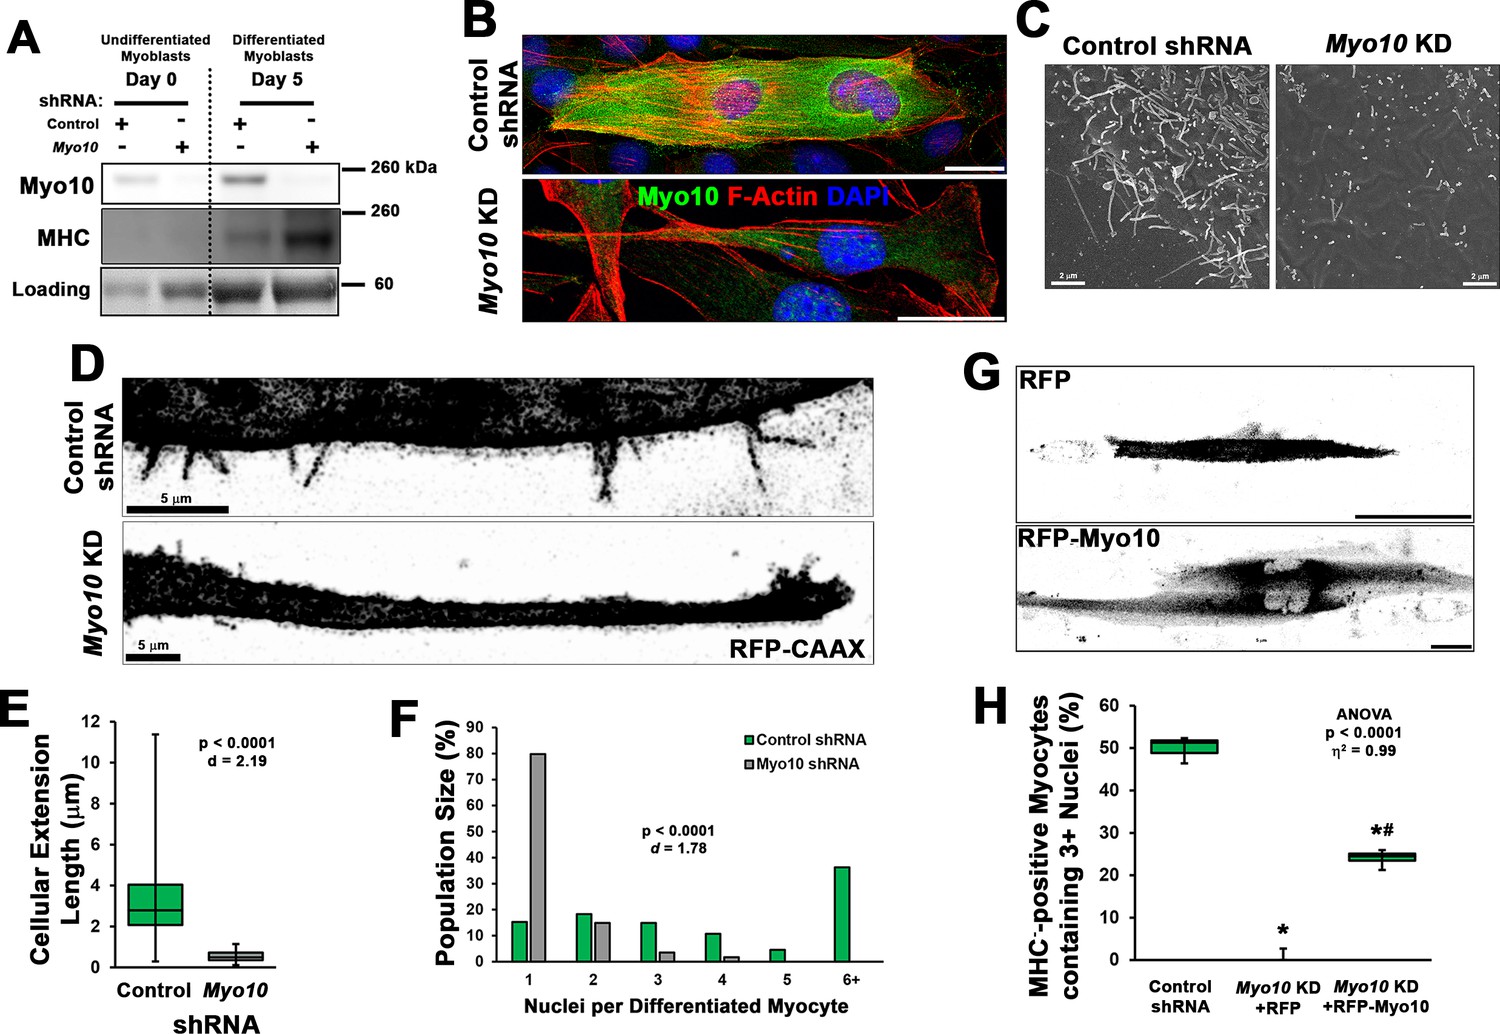
Loss of myoblast class X myosin (Myo10) prevents filopodia formation and cellular fusion.
Clonal lines of C2C12 cells expressing control or Myo10-targeted short-hairpin RNA (shRNA) were validated for efficacy of Myo10 knockdown (KD) and myogenic differentiation potential. (A) Immunoblotting for Myo10 protein and the myogenic differentiation marker, myosin heavy chain (MHC; loading control visualized by Ponceau Red staining). KD of Myo10 myoblasts results in loss of filopodia during differentiation compared to control shRNA cells, as demonstrated by (B) immunofluorescence (day 3), (C) scanning electron microscopy (day 5), and (D) live-cell confocal microscopy (day 5), as well as loss of (E) cellular extension lengths (n = 31–152 cellular extensions). Myoblast differentiation assays (n = 3 individual experiments) reveal loss of multinucleated myotubes formation in Myo10 KD cells after 7 days of differentiation compared to control cells, quantified as (F) population distribution of myotube nuclear content. (G–H) Loss of fusion ability by Myo10 KD cells can be partially rescued by transfection of a full-length Myo10 construct with an N-terminal mApple fluorescent tag (RFP-Myo10; n = 3–6 individual experiments). Data analysis performed using (E–F) Welch’s two-tailed t-test (α = 0.05) with effect size displayed as Cohen’s d (d) or (H) one-way ANOVA followed by Tukey post hoc tests (α = 0.05; *p < 0.05 vs. control values; #p < 0.05 vs. RFP values; effect size is presented as eta-squared (η2)). Unless otherwise noted, scale bars represent 25 µm.
-
Figure 3—source data 1
Source data file for Figure 3E.
- https://cdn.elifesciences.org/articles/72419/elife-72419-fig3-data1-v2.pdf
-
Figure 3—source data 2
Source data file for Figure 3F.
- https://cdn.elifesciences.org/articles/72419/elife-72419-fig3-data2-v2.pdf
-
Figure 3—source data 3
Source data file for Figure 3H.
- https://cdn.elifesciences.org/articles/72419/elife-72419-fig3-data3-v2.pdf
-
Figure 3—source data 4
Source data file for Figure 3A.
- https://cdn.elifesciences.org/articles/72419/elife-72419-fig3-data4-v2.pdf
Figure 3—figure supplement 1
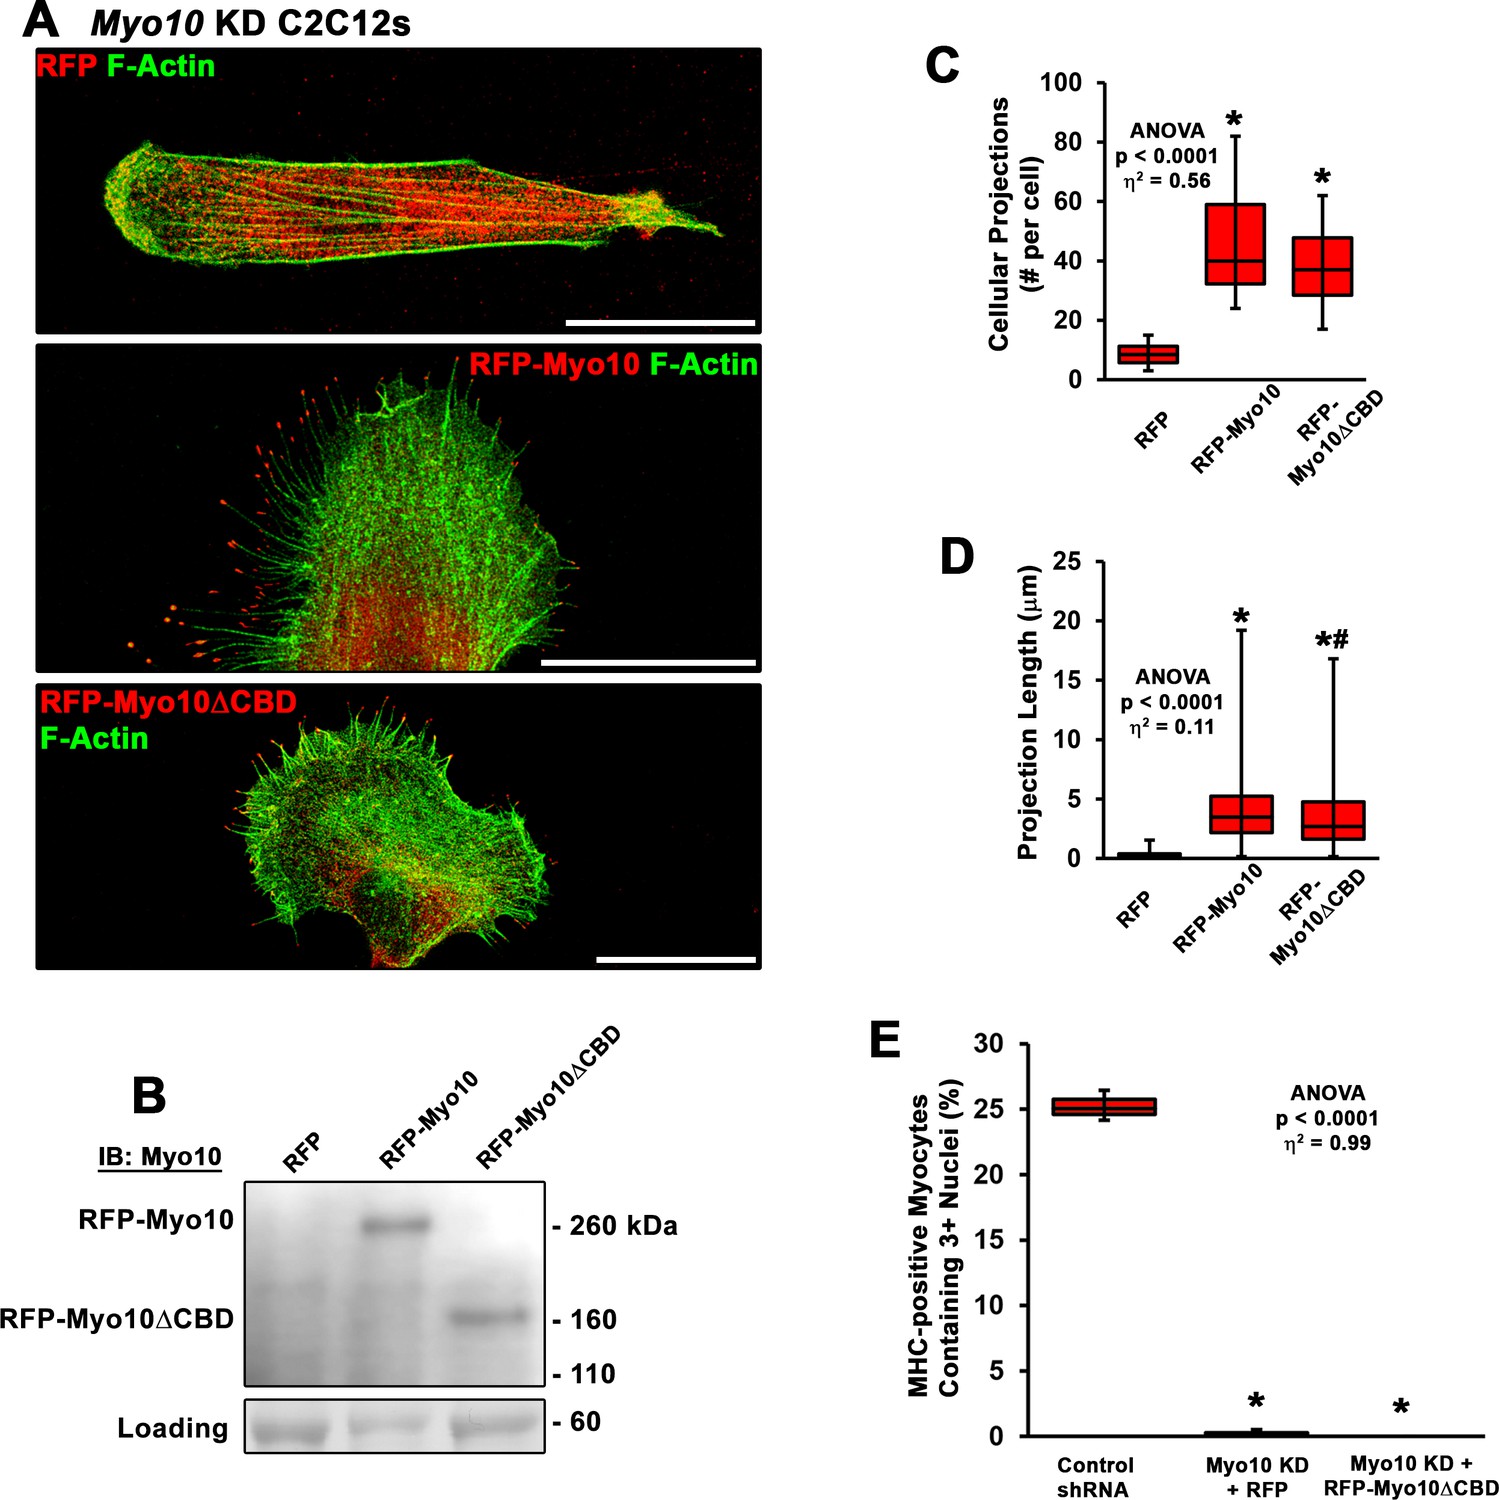
Rescue of myoblast fusion requires the class X myosin (Myo10) cargo-binding domains.
(A) Representative images of Myo10 knockdown (KD) myoblasts following transfection with RFP, RFP-Myo10, or a truncated RFP-Myo10 lacking C-terminal cargo-binding domains (RFP-Myo10ΔCBD). (B) Immunoblotting for Myo10 demonstrates the protein size difference between the RFP-Myo10 and RFP-Myo10ΔCBD constructs (protein loading visualized using Ponceau Red staining). (C) Both RFP-Myo10 and RFP-Myo10ΔCBD expression result in increased filopodia formation, relative to RFP-expressing Myo10 KD myoblasts (n = 20–30 cells across three experiments). (D) The projections/filopodia generated by RFP-Myo10 are slightly, but significantly, longer than those resulting from RFP-Myo10ΔCBD expression (n = 168–1339 projections). (E) Despite rescue of filopodia formation, RFP-Myo10ΔCBD does not rescue fusion ability of Myo10 KD myoblasts (n = 6 independent experiments; 5 days of differentiation). Data were analyzed using one-way ANOVA followed by Tukey post hoc tests (α = 0.05; effect size is presented as eta-squared (η2)) (C–D) *p < 0.05 vs. RFP values; #p < 0.05 vs. RFP-Myo10 values. (E) *p < 0.05 vs. control short-hairpin RNA (shRNA) values. Scale bars represent 25 µm.
-
Figure 3—figure supplement 1—source data 1
Source data file for Figure 3—figure supplement 1B.
- https://cdn.elifesciences.org/articles/72419/elife-72419-fig3-figsupp1-data1-v2.pdf
-
Figure 3—figure supplement 1—source data 2
Source data file for Figure 3—figure supplement 1C-D.
- https://cdn.elifesciences.org/articles/72419/elife-72419-fig3-figsupp1-data2-v2.pdf
-
Figure 3—figure supplement 1—source data 3
Source data file for Figure 3—figure supplement 1E.
- https://cdn.elifesciences.org/articles/72419/elife-72419-fig3-figsupp1-data3-v2.pdf
Figure 3—figure supplement 2
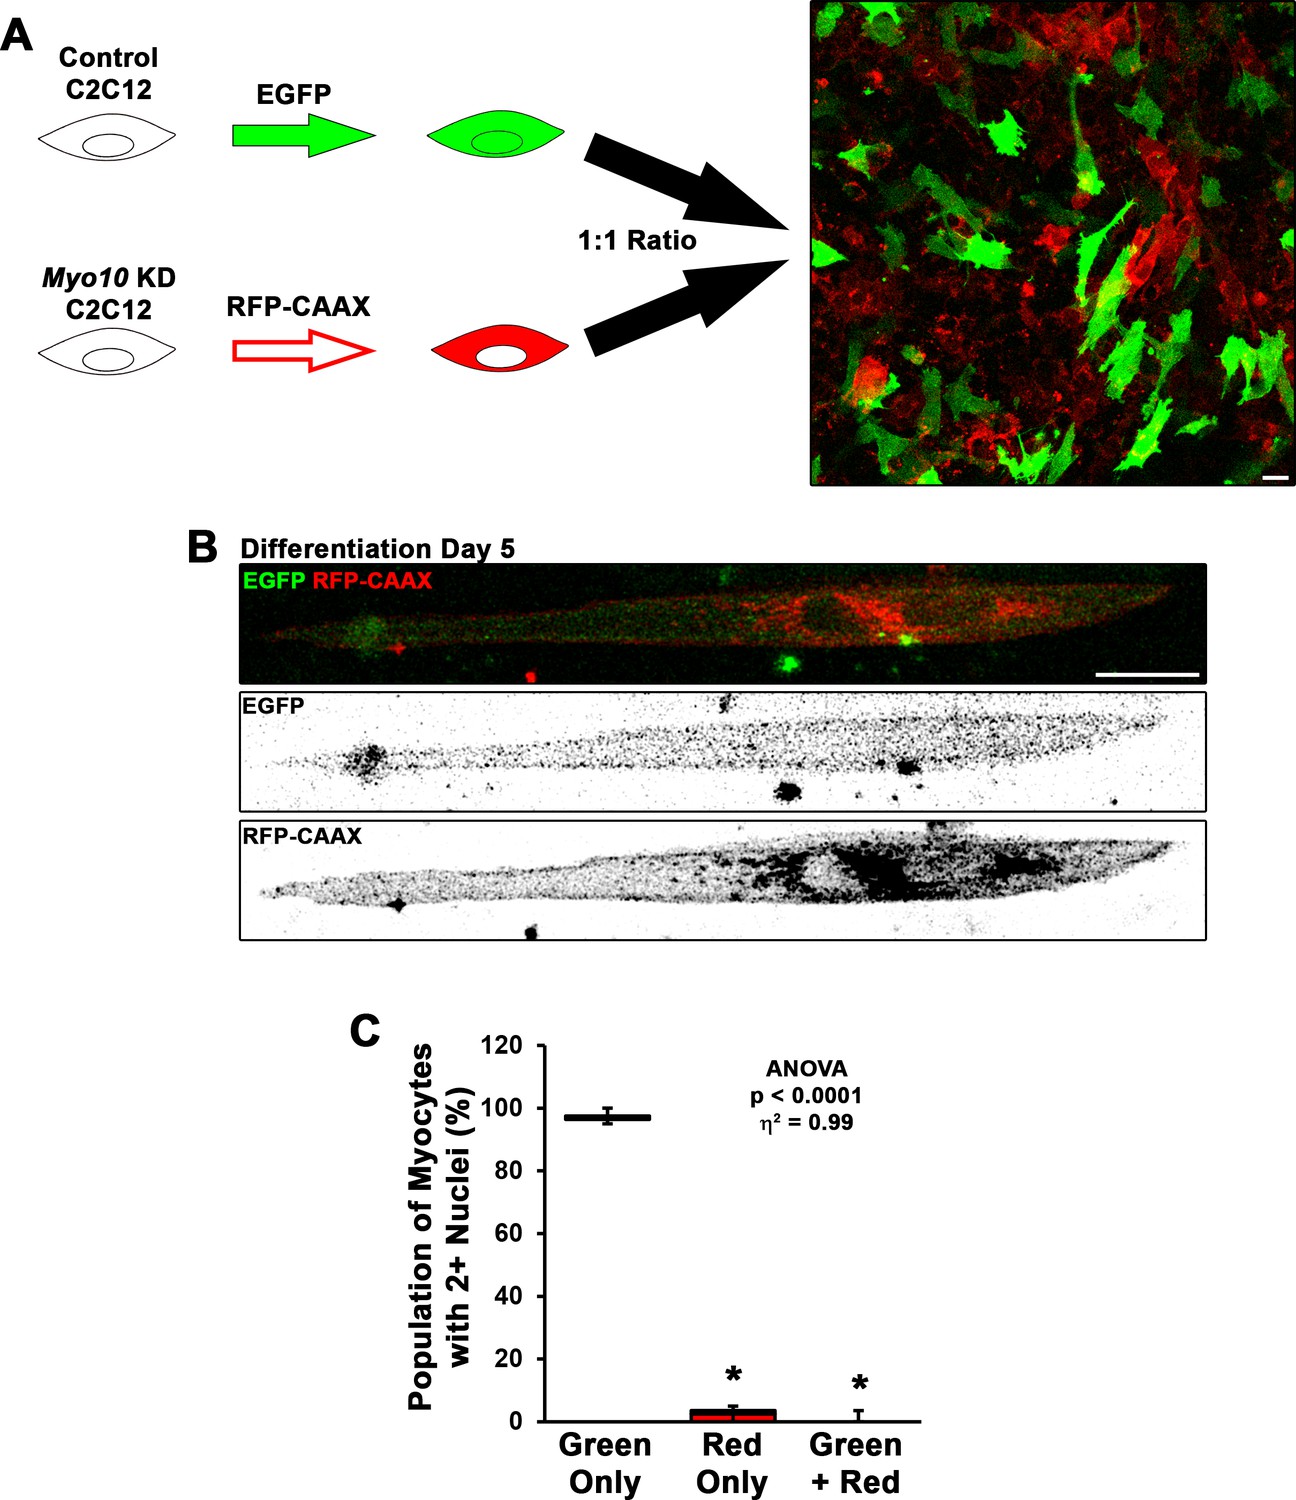
Fusion of myoblasts in vitro requires bilateral class X myosin (Myo10) expression.
(A) To test if Myo10 is required unilaterally or bilaterally for myoblast fusion, control short-hairpin RNA (shRNA) and Myo10 knockdown (KD) C2C12 myoblasts were labeled with different variants of fluorescent proteins (EGFP and RFP-CAAX, respectively), then were mixed in a 1:1 ratio to assess prevalence of EGFP and RFP-CAAX incorporation into bi/multinucleated myocytes (n = 5 independent experiments; 5 days of differentiation; bi-nucleated cells were included in this analysis because the fusion of Myo10 KD cells with control cells will result in Myo10 KD in both nuclei). (B–C) Bi-nucleated cells having both EGFP and RFP-CAAX expression were exceeding rare in this assay, as only one instance was found in during the course of these experiments. Observed bi-nucleated Myo10 KD cells having only RFP-CAAX expression are suspected to result from incomplete cytokinesis. Data were analyzed using one-way ANOVA followed by Tukey post hoc tests (α = 0.05; *p < 0.05 vs. green-only values; effect size is presented as eta-squared (η2)). Scale bars represent 25 µm.
-
Figure 3—figure supplement 2—source data 1
Source data file for Figure 3—figure supplement 2C.
- https://cdn.elifesciences.org/articles/72419/elife-72419-fig3-figsupp2-data1-v2.pdf
Figure 4 with 2 supplements
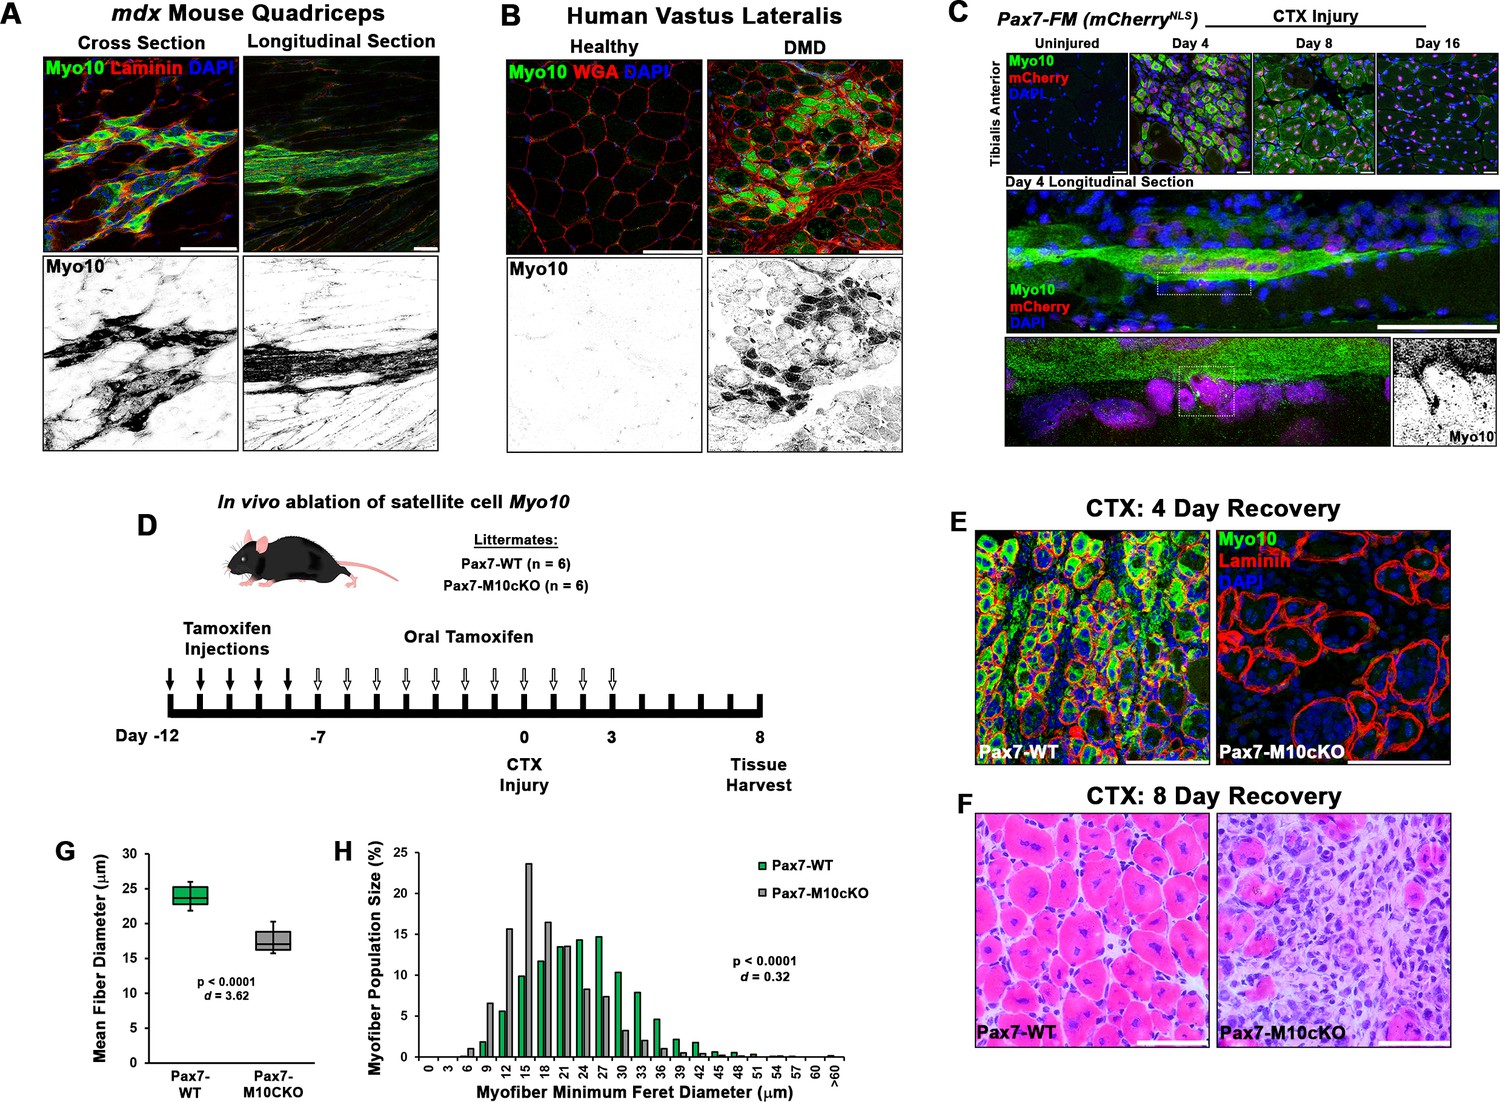
Class X myosin (Myo10) labels regenerating muscle fibers in vivo and is required for efficient muscle regeneration from injury.
Myo10 immunoreactivity in regions of dystrophin-deficient skeletal muscle samples from (A) mdx mice and (B) Duchenne muscular dystrophy (DMD) patients that are undergoing active regeneration. (C) Fate-mapping (FM) of muscle satellite cells using the Pax7Cre-ERT2 allele crossed onto mice harboring a floxed nuclear-localized (NLS) mCherry allele demonstrates that Myo10 expression is found in regenerating muscle fibers of satellite cell origin. The inset shows Myo10-filled filopodia can found extending toward mononuclear myoblasts. (D) The role of Myo10 in postnatal muscle regeneration was investigated using Pax7Cre-ERT2 conditional Myo10 knockout (KO) (Pax7-M10cKO; n = 6) mice and their non-floxed littermates (Pax7-WT; n = 6). Tamoxifen induction was achieved via five consecutive daily intraperitoneal injections of 100 mg/kg tamoxifen (denoted by solid arrows) followed by daily oral treatments with 10 mg/kg tamoxifen (empty arrows) for 7 days preceding cardiotoxin (CTX) injury of the tibialis anterior muscle (TA) and continuing until 3 days after injury. (E) This protocol that results in efficient elimination of Myo10+ myocytes as evidenced in 4-day recovery muscle. Following 8 days of recovery, Pax7-M10cKO mice demonstrate impaired muscle regeneration compared to Pax7-WT muscle, as evidenced by (F) impaired histological recovery and (G–H) reduced muscle fiber size (n = 991–1307 fibers). Data are presented as (G) box-and-whisker plots depicting second and third quartiles with minimum and maximum values or (H) a histogram of entire data set populations, and are analyzed using two-tailed Welch’s t-tests with effect size presented as Cohen’s d (d). Scale bars represent 100 µm.
-
Figure 4—source data 1
Source data file for Figure 3G–H.
- https://cdn.elifesciences.org/articles/72419/elife-72419-fig4-data1-v2.pdf
Figure 4—figure supplement 1
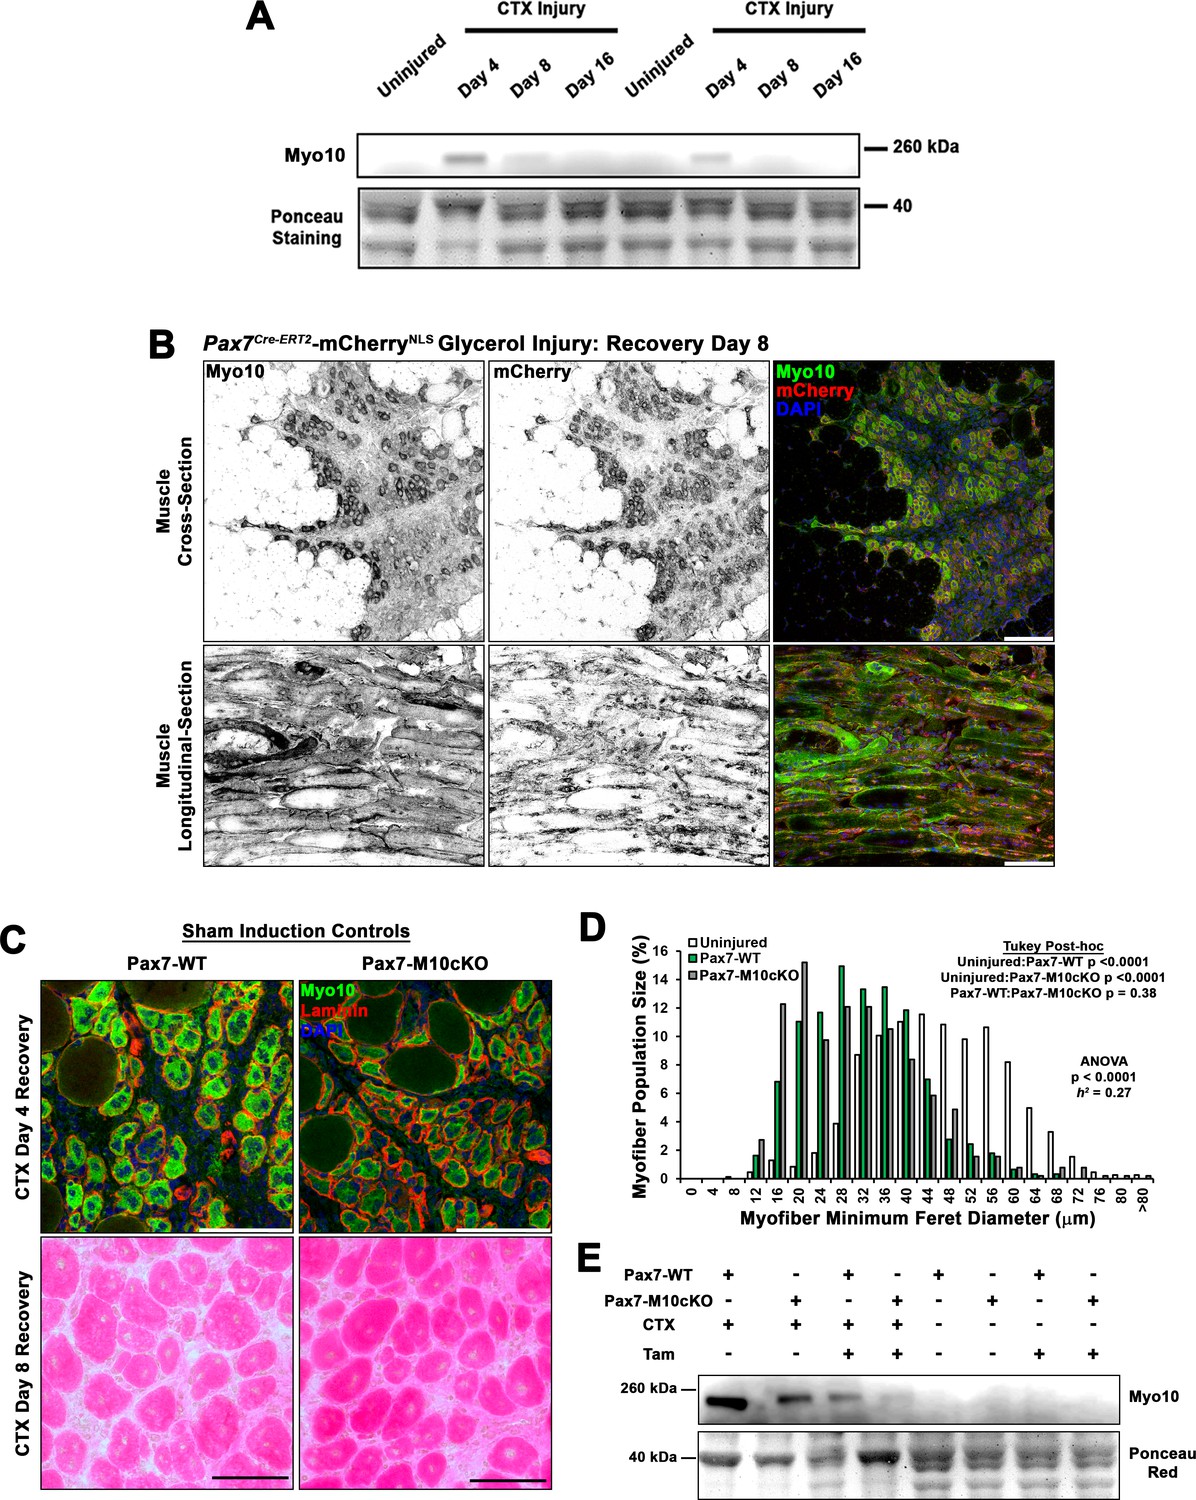
Class X myosin (Myo10) is elevated during muscle regeneration.
(A) Immunoblot for Myo10 content in uninjured and cardiotoxin (CTX)-affected tibialis anterior muscles after 4, 8, and 16 days of regeneration. (B) Myo10 immunoreactivity is high in regenerating muscle of Pax7Cre-ERT2-mCherryNLS mice 8 days following glycerol-induced injury. (C–D) Sham-induced Pax7Cre-ERT2 conditional Myo10 knockout (KO) (Pax7-M10cKO; n = 4) mice and their non-floxed littermates (Pax7-WT; n = 5) do not demonstrate distinguishable Myo10 immunoreactivity or muscle regeneration following cardiotoxin (CTX)-induced injury of the tibialis anterior muscle. (E) Efficient ablation of full-length Myo10 protein in tamoxifen (Tam)-induced Pax7-M10cKO muscle following 4 days of regeneration from CTX injury achieved using the induction protocol depicted in Figure 4D. Data are displayed as a histogram of entire muscle fiber populations and were analyzed using one-way ANOVA followed by Tukey post hoc tests (α = 0.05). Scale bars represent 100 µm.
-
Figure 4—figure supplement 1—source data 1
Source data file for Figure 4—figure supplement 1D.
- https://cdn.elifesciences.org/articles/72419/elife-72419-fig4-figsupp1-data1-v2.pdf
-
Figure 4—figure supplement 1—source data 2
Source data file for Figure 4—figure supplement 1A.
- https://cdn.elifesciences.org/articles/72419/elife-72419-fig4-figsupp1-data2-v2.pdf
-
Figure 4—figure supplement 1—source data 3
Source data file for Figure 4—figure supplement 1E.
- https://cdn.elifesciences.org/articles/72419/elife-72419-fig4-figsupp1-data3-v2.pdf
Figure 4—figure supplement 2
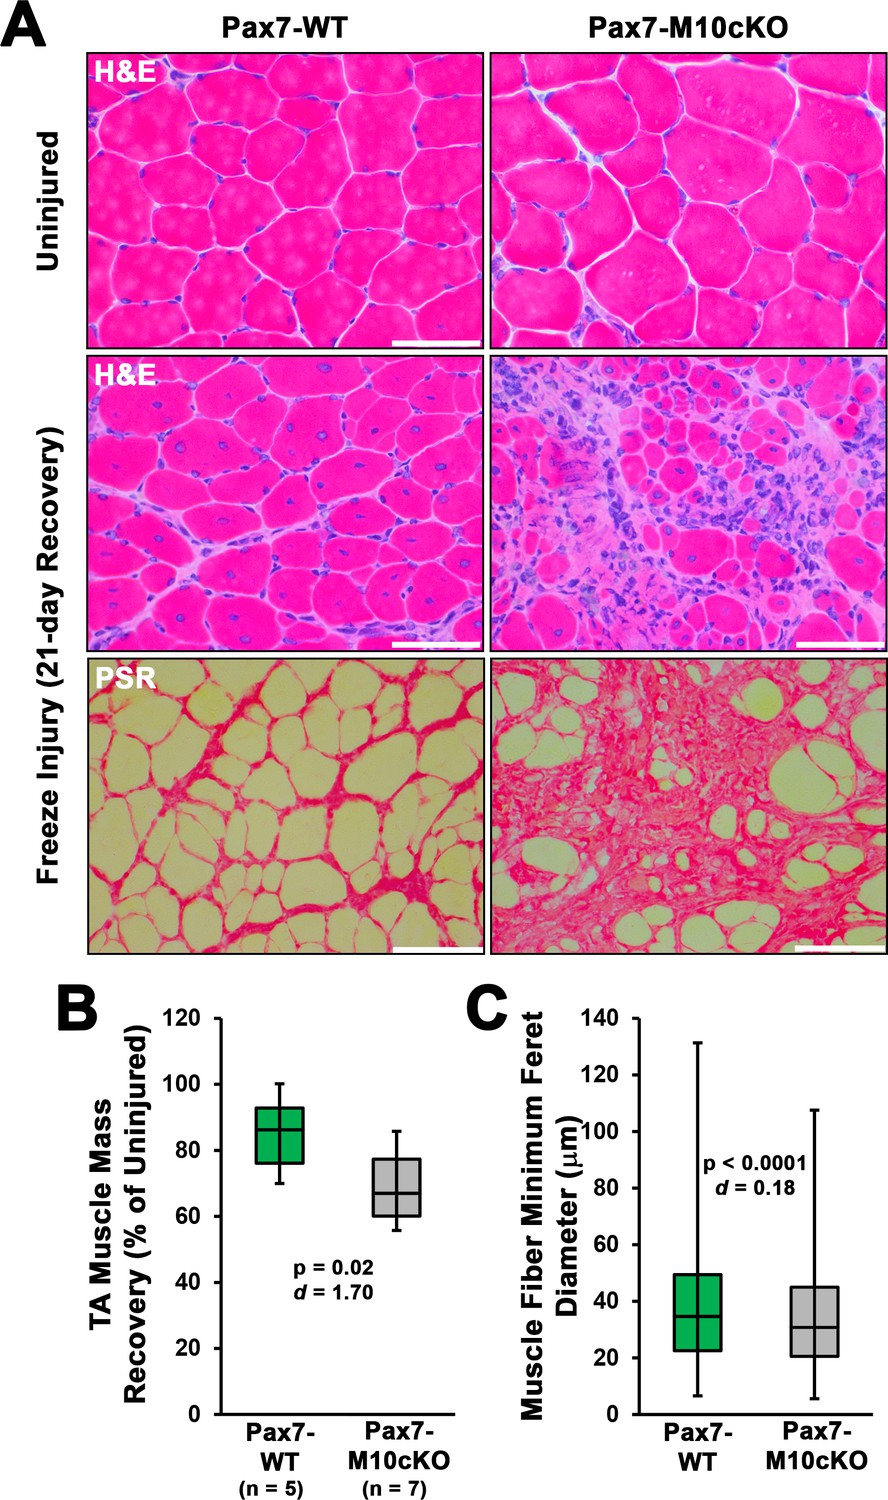
Satellite cell ablation of class X myosin (Myo10) impairs muscle regeneration from freeze injury.
Pax7-WT and Pax7-M10cKO littermate mice were induced with tamoxifen, and subjected to freeze injury of the tibialis anterior (TA) muscle (n = 5–8). (A) Following 21 days of recovery, Pax7-M10cKO (n = 8) mice exhibit impaired regeneration, as shown by Hematoxylin & Eosin (H&E) staining, and increased fibrosis, as shown by picrosirius red (PSR) staining. (B) Muscle mass and (C) muscle fiber size recovery was diminished by loss of satellite cell Myo10 (n = 12065–16707 fibers). Data are presented as box-and-whisker plots depicting second and third quartiles with minimum and maximum values, and are analyzed using two-tailed Welch’s t-tests with effect size presented as Cohen’s d (d). Scale bars represent 100 µm.
-
Figure 4—figure supplement 2—source data 1
Source data file for Figure 4—figure supplement 2B.
- https://cdn.elifesciences.org/articles/72419/elife-72419-fig4-figsupp2-data1-v2.pdf
-
Figure 4—figure supplement 2—source data 2
Source data file for Figure 4—figure supplement 2C.
- https://cdn.elifesciences.org/articles/72419/elife-72419-fig4-figsupp2-data2-v2.pdf
Figure 5 with 2 supplements
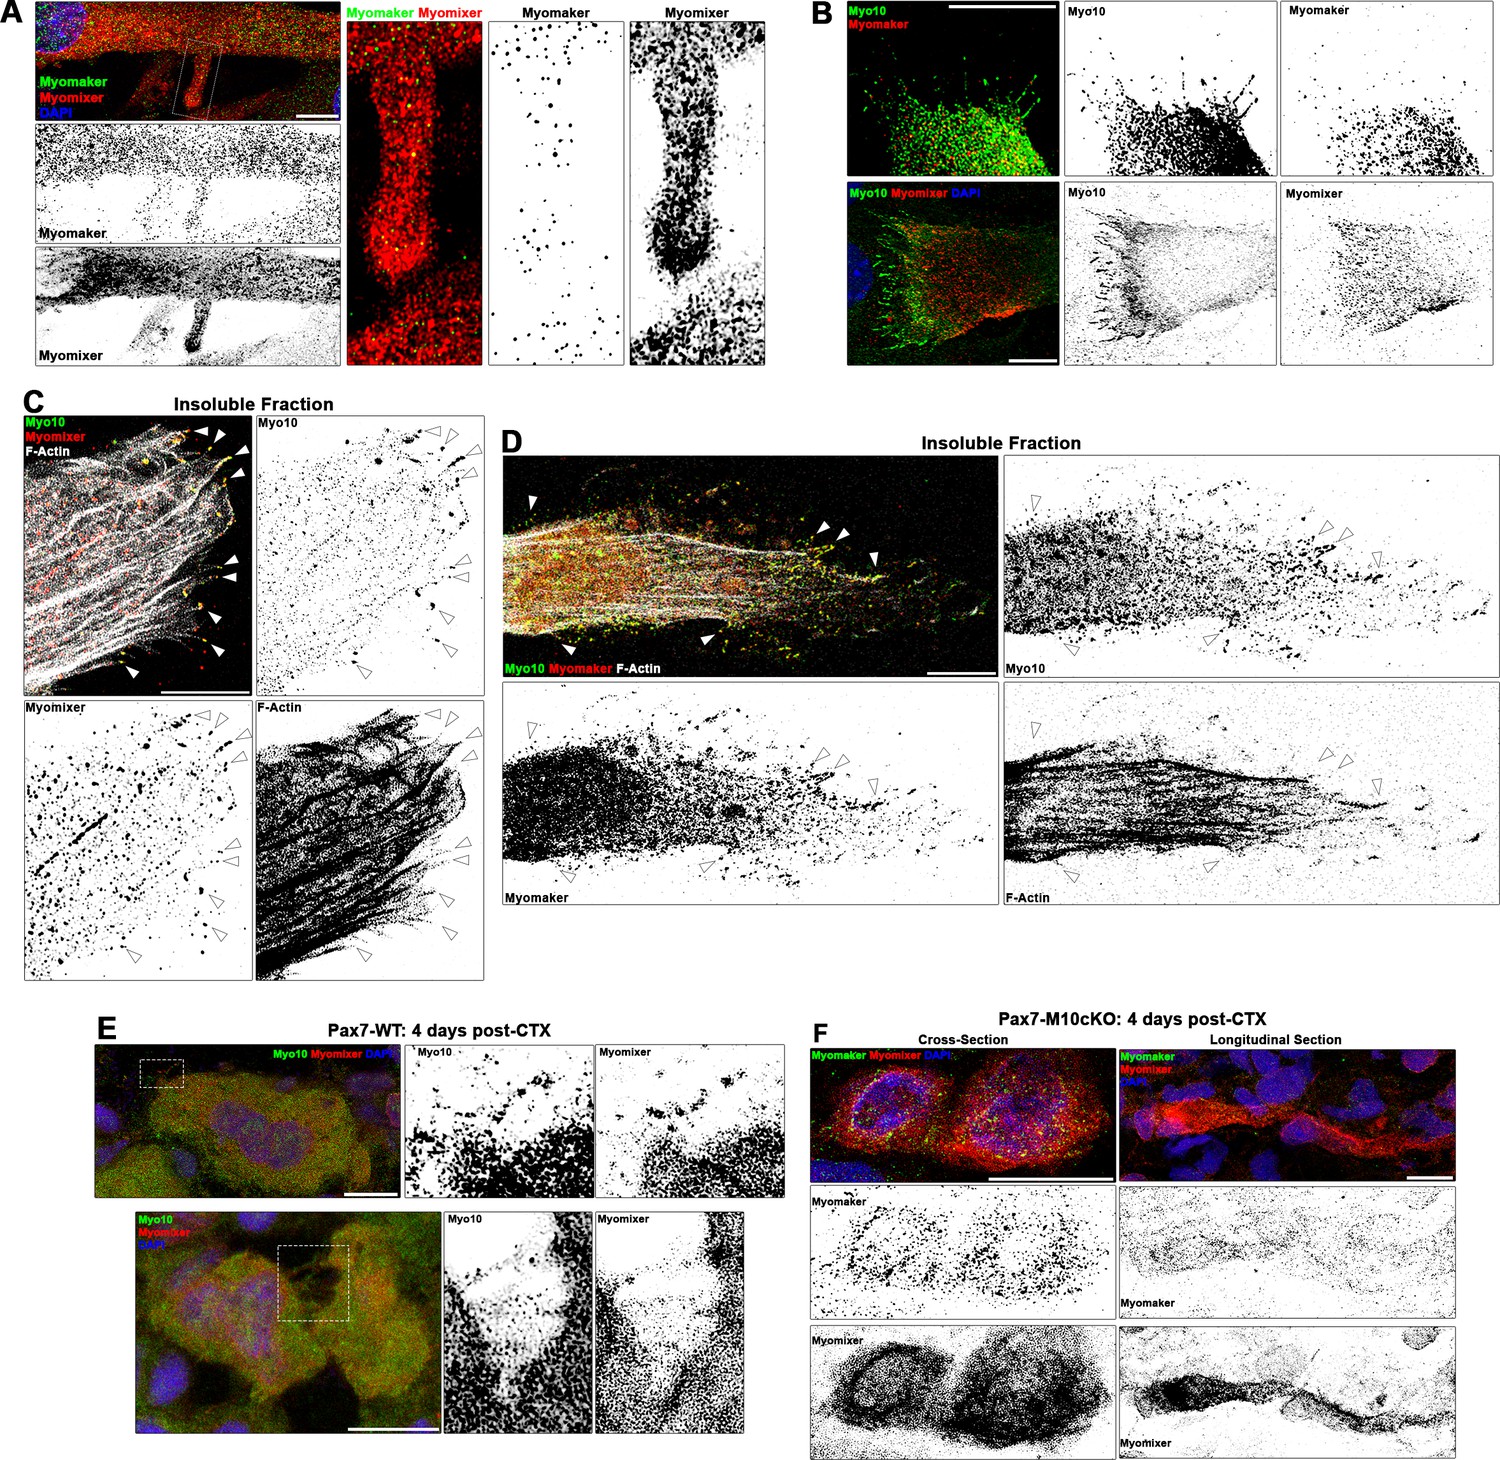
Myogenic fusion proteins are detected along filopodia in differentiating muscle cells.
(A) Immunofluorescent detection of Myomaker and Myomixer in differentiating myoblast cultures. Inset shows Myomixer and Myomaker puncta on the surface of a lamellipodial extension with filopodia. (B) Myomaker and Myomixer puncta are found localized to class X myosin (Myo10)-filled filopodia of differentiating myoblasts (days 4–5). Co-localization of (C) Myomixer and (D) Myomaker with Myo10 in filopodia remnants of the differentiating myoblast insoluble fraction (indicated with arrows). (E) Tibialis anterior (TA) muscle cross-sections of Pax7-WT mice at 4 days following cardiotoxin (CTX)-induced injury. (F) Cross-section (left) and longitudinal section (right) of Pax7-M10cKO TA muscle at 4 days following CTX-induced injury. Scale bars represent 10 µm.
Figure 5—figure supplement 1
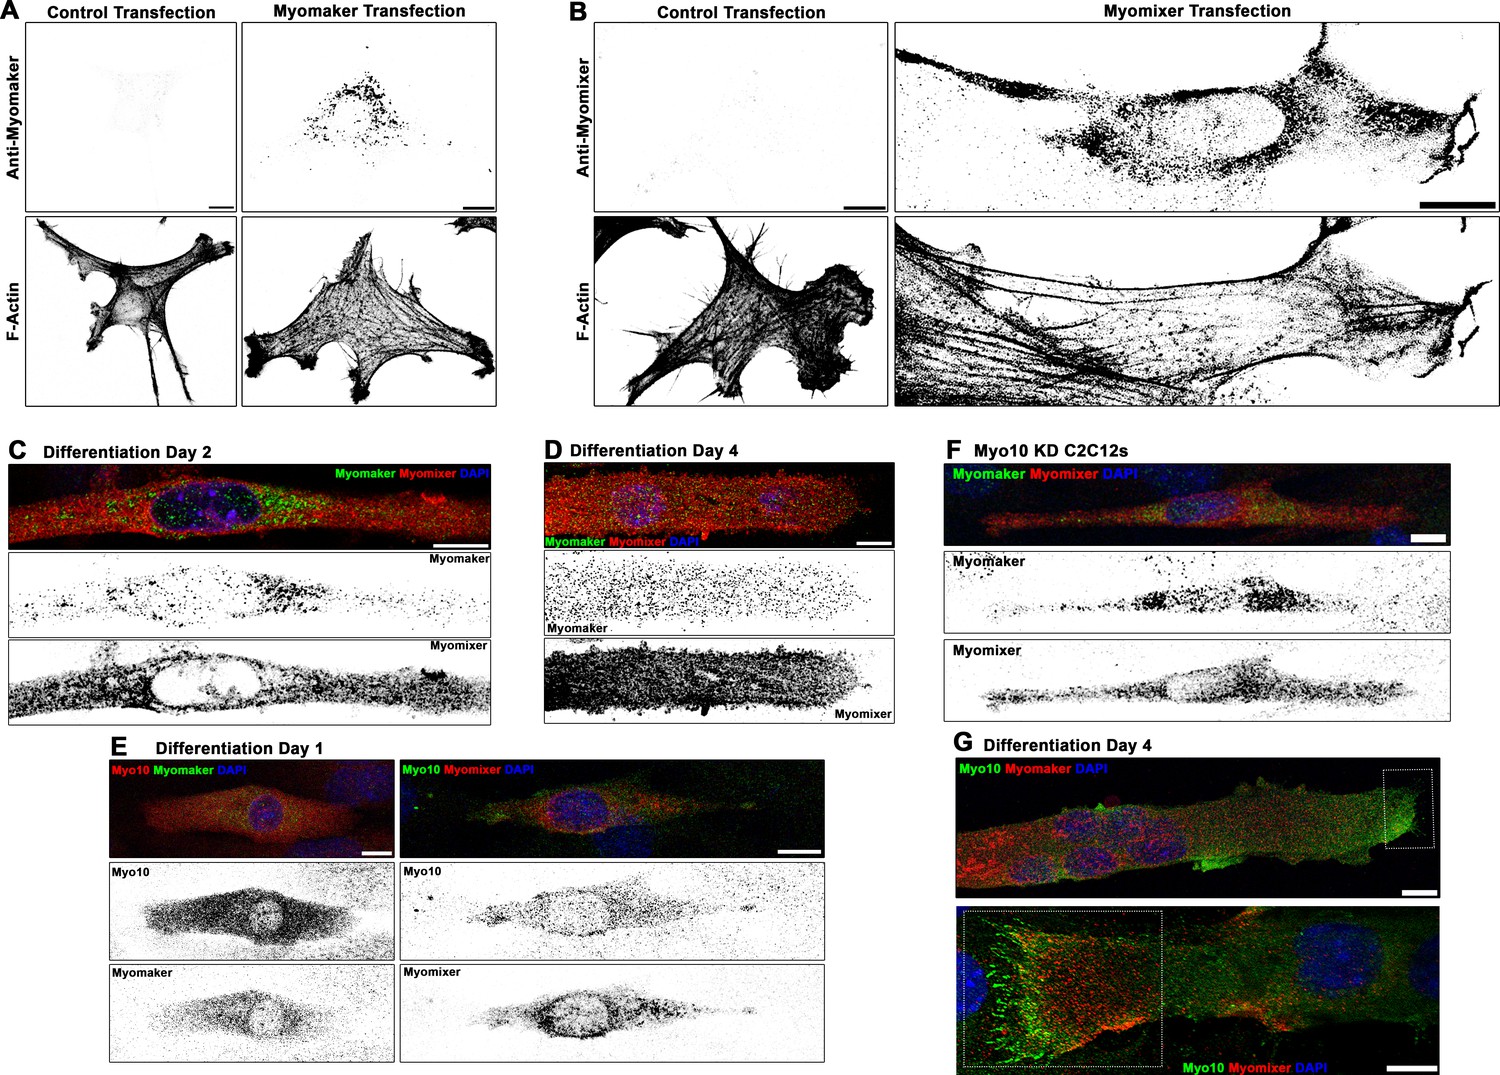
Localization patterns of Myomaker and Myomixer in differentiating myoblasts.
Specificity testing of commercially available (A) Myomaker and (B) Myomixer antibodies for immunofluorescent detection of these proteins following transfection of undifferentiated myoblasts. Immunofluorescence (IF) staining pattern of Myomaker and Myomixer (C) early in myogenic differentiation and (D) in fully differentiated myotubes. Myomixer antibody was applied prior to cell permeabilization. (E) At day 1 of differentiation, myoblasts co-expressing class X myosin (Myo10) with Myomaker and Myomixer are observed. (F) Differentiated Myo10 knockdown (KD) cells express both Myomaker and Myomixer. (G) Localization patterns of Myo10 with Myomaker (top) and Myomixer (bottom) in differentiated myotubes (insets are found in Figure 5B). Scale bars represent 10 µm.
Figure 5—figure supplement 2
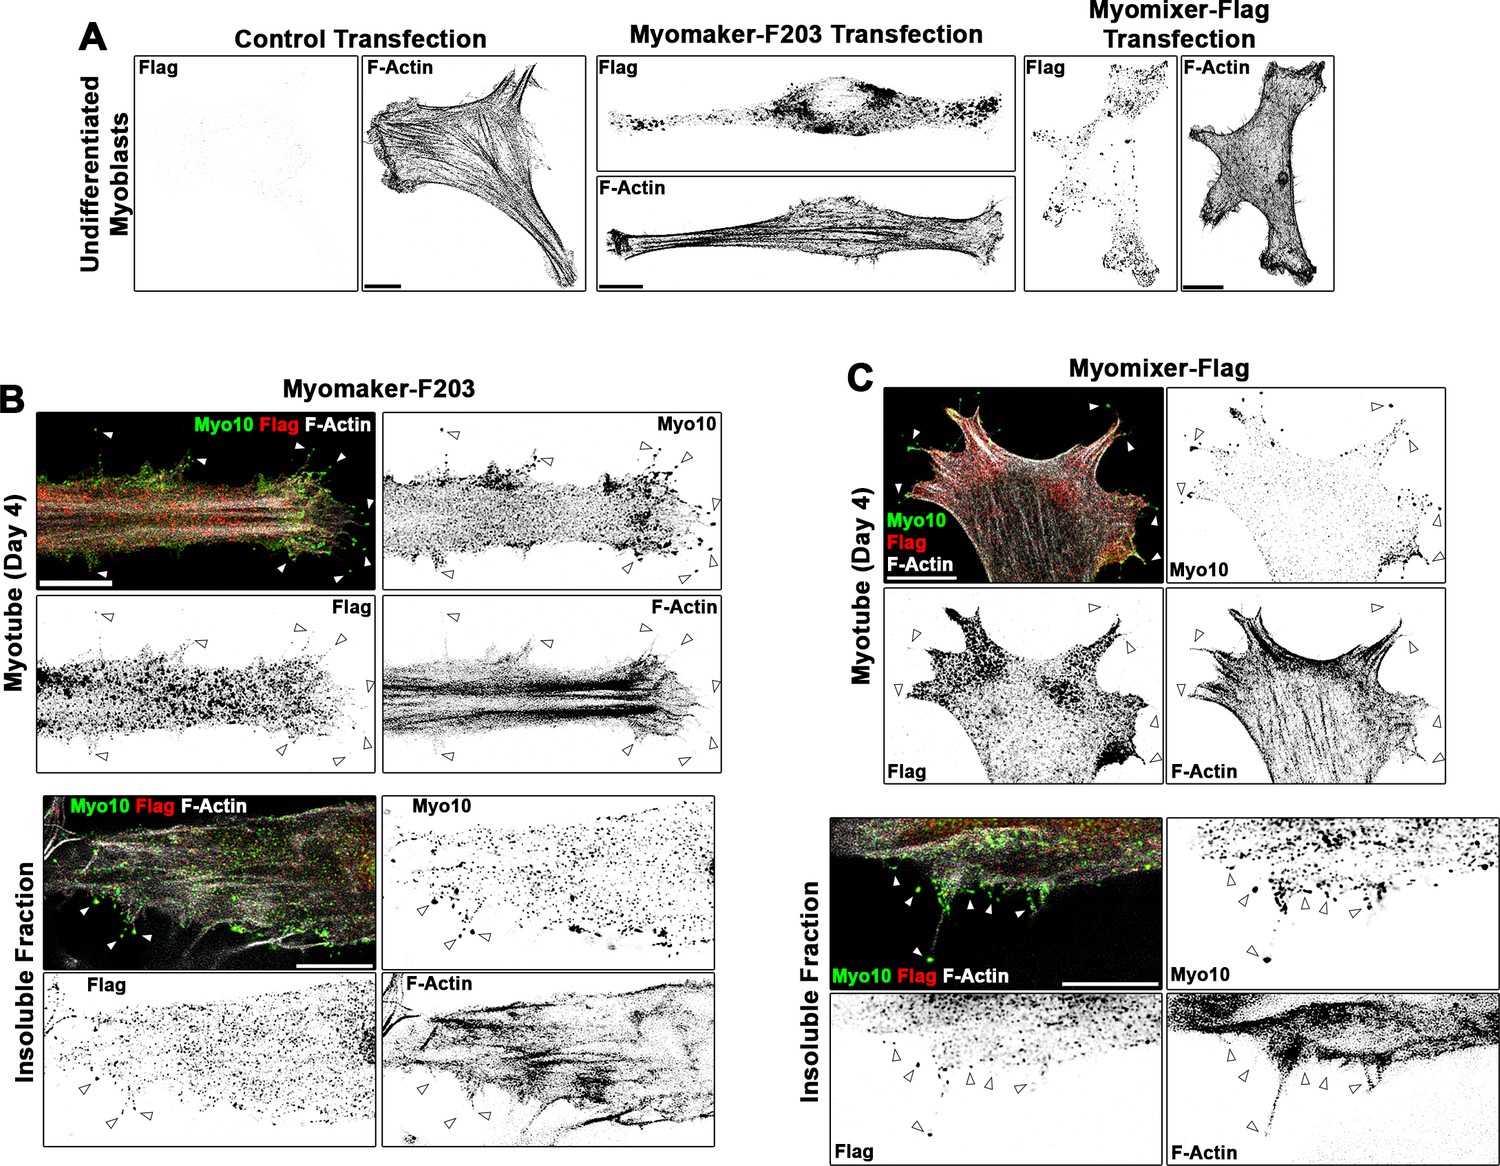
Localization patterns of Flag-tagged Myomaker and Myomixer constructs in differentiating myoblasts.
(A) Anti-Flag staining of undifferentiated myoblasts following transfection of control, Myomaker-F203, or Myomixer-Flag plasmids reveals specificity of the anti-Flag antibody and that these Flag-tagged versions of Myomaker and Myomixer localize similarly to their wild-type counterparts (shown in Figure 5—figure supplement 1). Investigation of the localization of (B) Myomaker-F203 and (C) Myomixer-Flag in differentiated myotubes reveals Flag-positive puncta observed in class X myosin (Myo10)-positive filopodia of both whole cells and the insoluble cellular fraction. Scale bars represent 10 µm.
Videos
Video 1
Movement of undifferentiated myoblasts.
Time-lapse confocal imaging of undifferentiated myoblasts expressing RFP-CAAX. Individual frames were utilized to make Figure 1A. Images were acquired every 15 min. Scale bar represents 25 µm.
Video 2
Cellular projections of undifferentiated myoblasts.
Representative time-lapse movies of cellular projections from the anterior, dorsal, and posterior positions of undifferentiated myoblasts expressing RFP-CAAX. Individual frames are included in Figure 2—figure supplement 1A. Images were acquired every 20 s for a duration of 2 min.
Video 3
Morphology changes of differentiating myoblasts.
Time-lapse movie of differentiating myoblasts expressing RFP-CAAX. Images were acquired every 15 min. Scale bar represents 100 µm.
Video 4
Myotube lateral edge projections.
Time-lapse video of the lateral edge of a differentiated myotube expressing RFP-CAAX. Individual frames are included in Figure 1B. Images were acquired every minute.
Video 5
Non-fluorescent detection of myotube lateral edge projections.
Time-lapse of differential interference contrast imaging showing dynamic cellular projections at the lateral edge of a myotube. The arrow indicates where pronounced projections are clearly visible. Images of this myotube from later time points are also found in Figure 1E. Images were acquired every 30 s.
Video 6
Dynamic myotube dorsal protrusions.
Time-lapse confocal imaging of a GFP-CAAX-expressing myotube exhibiting dynamic dorsal protrusions. Individual frames are included in Figure 1B. Images were acquired every 30 s. Scale bar represents 25 µm.
Video 7
Dynamics of myotube cellular projections.
Time-lapse confocal imaging of diverse cellular projection of differentiating myotubes expressing GFP-CAAX. Individual frames were utilized to make Figure 1C. Images were acquired every 20 min.
Video 8
Cellular fusion at the myotube lateral edge.
Time-lapse confocal images of a GFP-CAAX-expressing myotube initiating fusion with fine protrusions extending from the lateral edge. Individual frames are included in Figure 1F. Images were acquired every 15 min. Scale bar represents 25 µm.
Video 9
Myotube fusion initiated by a lamellipodial extension.
Time-lapse confocal images of a GFP-CAAX-expressing myotube initiating fusion using a lamellipodial extension adorned with fine protrusions. Individual frames are included in Figure 1G. Images were acquired every 15 min. Scale bar represents 25 µm.
Video 10
Cellular fusion initiated by a lamellipodial extension.
Time-lapse confocal images of a GFP-CAAX-expressing myotube initiating fusion using a lamellipodial extension. Images were acquired every 15 min.
Video 11
Activation of the Myo10 promoter in differentiating myoblasts.
Time-lapse confocal images of a myoblast co-expressing GFP-CAAX and a reporter plasmid consisting of mApple driven by the Myo10 promoter at day 1 of differentiation. Individual frames are included in Figure 2—figure supplement 1G. Images were acquired every 20 min. Scale bar represents 10 µm.
Video 12
Loss of class X myosin (Myo10) in myocytes prevents filopodia formation.
Confocal images of cellular projections exhibited by differentiated control and Myo10 short-hairpin RNA (shRNA) knockdown myocytes. Individual frames are included in Figure 3D. Images were acquired every 10 s. Scale bar represents 5 µm.
Video 13
Loss of class X myosin (Myo10) does not prevent lamellipodial extension formation.
Differentiating Myo10 knockdown myoblasts expressing RFP-CAAX produce lamellipodial extensions during differentiation. Images were acquired every 20 min. Scale bar represents 10 µm.
Tables
Key resources table
| Reagent type (species) or resource | Designation | Source or reference | Identifiers | Additional information |
|---|---|---|---|---|
| Strain, strain background (Mus musculus) | H2B-mCherryfl/fl | Jackson Laboratories | JAX:023139RRID:IMSR_JAX:023139 | |
| Strain, strain background (Mus musculus) | Pax7Cre=ERT2 | PMID:26792330 | MGI:4436914 | |
| Strain, strain background (Mus musculus) | Myo10tm1c | PMID:29229982 | MGI:6115837 | |
| Cell line (Mus musculus) | C2C12 | ATCC | ATCC No. CRL-1772RRID:CVCL_0188 | |
| Transfected construct (Homo sapiens) | tagRFPt-HRAS-CAAX(RFP-CAAX) | This paper | Evrogen # FP141NCBI NP_005334 | Membrane-targeted RFP |
| Transfected construct (Homo sapiens) | EGFP-HRAS-CAAX(GFP-CAAX) | This paper | Clontech#632,470NCBI NP_005334 | Membrane-targeted GFP |
| Transfected construct (Homo sapiens) | RFP-Myo10 | This paper | Addgene No. 54,631NCBI No. NP_036466 | Full-length Myo10 |
| Transfected construct (Homo sapiens) | RFP-Myo10ΔCBD | This paper | Addgene No. 54,631NCBI No. NP_036466 | Myo10(aa 1–938) |
| Transfected construct (Mus musculus) | pMyo10-mApple | This paper | Addgene No. 54,631 | Reporter for Myo10 promoter activation |
| Transfected construct (Mus musculus) | Myomaker | PMID:26858401 | NCBI No. NP_079652 | |
| Transfected construct (Mus musculus) | Myomixer | PMID:29581287 | NCBI No. NP_001170939 | |
| Transfected construct (Mus musculus) | Myomaker-F203 | PMID:26858401 | NCBI No. NP_079652 | Flag-tagged Myomaker |
| Transfected construct (Mus musculus) | Myomixer-Flag | PMID:28569745 | NCBI No. NP_001170939 | Flag-tagged Myomixer |
| Genetic reagent (Mus musculus) | Control shRNA lentiviral particles | Sigma-Aldrich | No. SHCLNV shRNA ID- SHC002 | |
| Genetic reagent (Mus musculus) | Myo10 shRNA lentiviral particles | Sigma-Aldrich | No. SHCLNV shRNA IDs- TRCN0000110606 TRCN0000375033 | |
| Antibody | Anti-Myo10 (Rabbit polyclonal) | Sigma-Aldrich | HPA024223 | IF: (0.3 µg/mL)IB: (0.24 µg/mL) |
| Antibody | Anti-Myo10 (Mouse monoclonal) | Santa Cruz | sc166720 | IF: (2 µg/mL) |
| Antibody | Anti-Laminin(Rat monoclonal) | Acris Antibodies | BM6064P | IF: (1.25 µg/mL) |
| Antibody | Anti-Myosin Heavy Chain(Mouse monoclonal) | R&D Systems | MAB4470 | IF: (0.25 µg/mL)IB: (0.125 µg/mL) |
| Antibody | Anti-mCherry(Chicken polyclonal) | Novus | NBP2-25158 | IF: (1:2000) |
| Antibody | Anti-MyoD(Mouse monoclonal) | Thermofisher | MA1-41017 | IF: (5 µg/mL) |
| Antibody | Anti-Myogenin(Mouse monoclonal) | Novus | NB100-56510 | IF: (2 µg/mL) |
| Antibody | Anti-TMEM8C/Myomaker(Rabbit polyclonal) | Thermofisher | PA5-63180 | IF: (1 µg/mL) |
| Antibody | Anti-Myomixer(Sheep polyclonal) | R&D Systems | AF4580 | IF: (0.67 µg/mL) |
| Antibody | Anti-Flag(Mouse monoclonal) | Sigma-Aldrich | F3165 | IF: (1.6 µg/mL) |
| Antibody | Anti-RFP(Rabbit polyclonal) | Abcam | ab62341 | IB: (0.5 µg/mL) |
| Antibody | Anti-GFP(Chicken polyclonal) | Abcam | ab13970 | IB: (2.5 µg/mL) |
| Sequence-based reagent (Mus musculus) | Myo10 Forward Primer | This paper | NCBI No.NM_019472 | TTC CAC CGC ACA TCT TCG CCA TTG |
| Sequence-based reagent (Mus musculus) | Myo10 Reverse Primer | This paper | NCBI No.NM_019472 | CCC CGG GAT TCT GCC TCA CTA CTC |
| Sequence-based reagent (Mus musculus) | Myh2 Forward Primer | This paper | NCBI No.NM_001039545 | AGA ACA TGG AGC AGA CCG TG |
| Sequence-based reagent (Mus musculus) | Myh2 Reverse Primer | This paper | NCBI No.NM_001039545 | TCA TTC CAC AGC ATC GGG AC |
| Sequence-based reagent (Mus musculus) | Gapdh Forward Primer | This paper | NCBI No.BC023196 | AGC AGG CAT CTG AGG GCC CA |
| Sequence-based reagent (Mus musculus) | Gapdh Reverse Primer | This paper | NCBI No.BC023196 | TGT TGG GGG CCG AGT TGG GA |
Additional files
Download links
A two-part list of links to download the article, or parts of the article, in various formats.
Downloads (link to download the article as PDF)
Open citations (links to open the citations from this article in various online reference manager services)
Cite this article (links to download the citations from this article in formats compatible with various reference manager tools)
Filopodia powered by class x myosin promote fusion of mammalian myoblasts
eLife 10:e72419.
https://doi.org/10.7554/eLife.72419


