An intestinally secreted host factor promotes microsporidia invasion of C. elegans
- Department of Molecular Genetics, University of Toronto, Canada
- The Donnelly Centre, University of Toronto, Canada
- Division of Biological Sciences, University of California, San Diego, United States
Figures
Figure 1 with 1 supplement

Mutations in aaim-1 result in resistance to N. parisii infection.
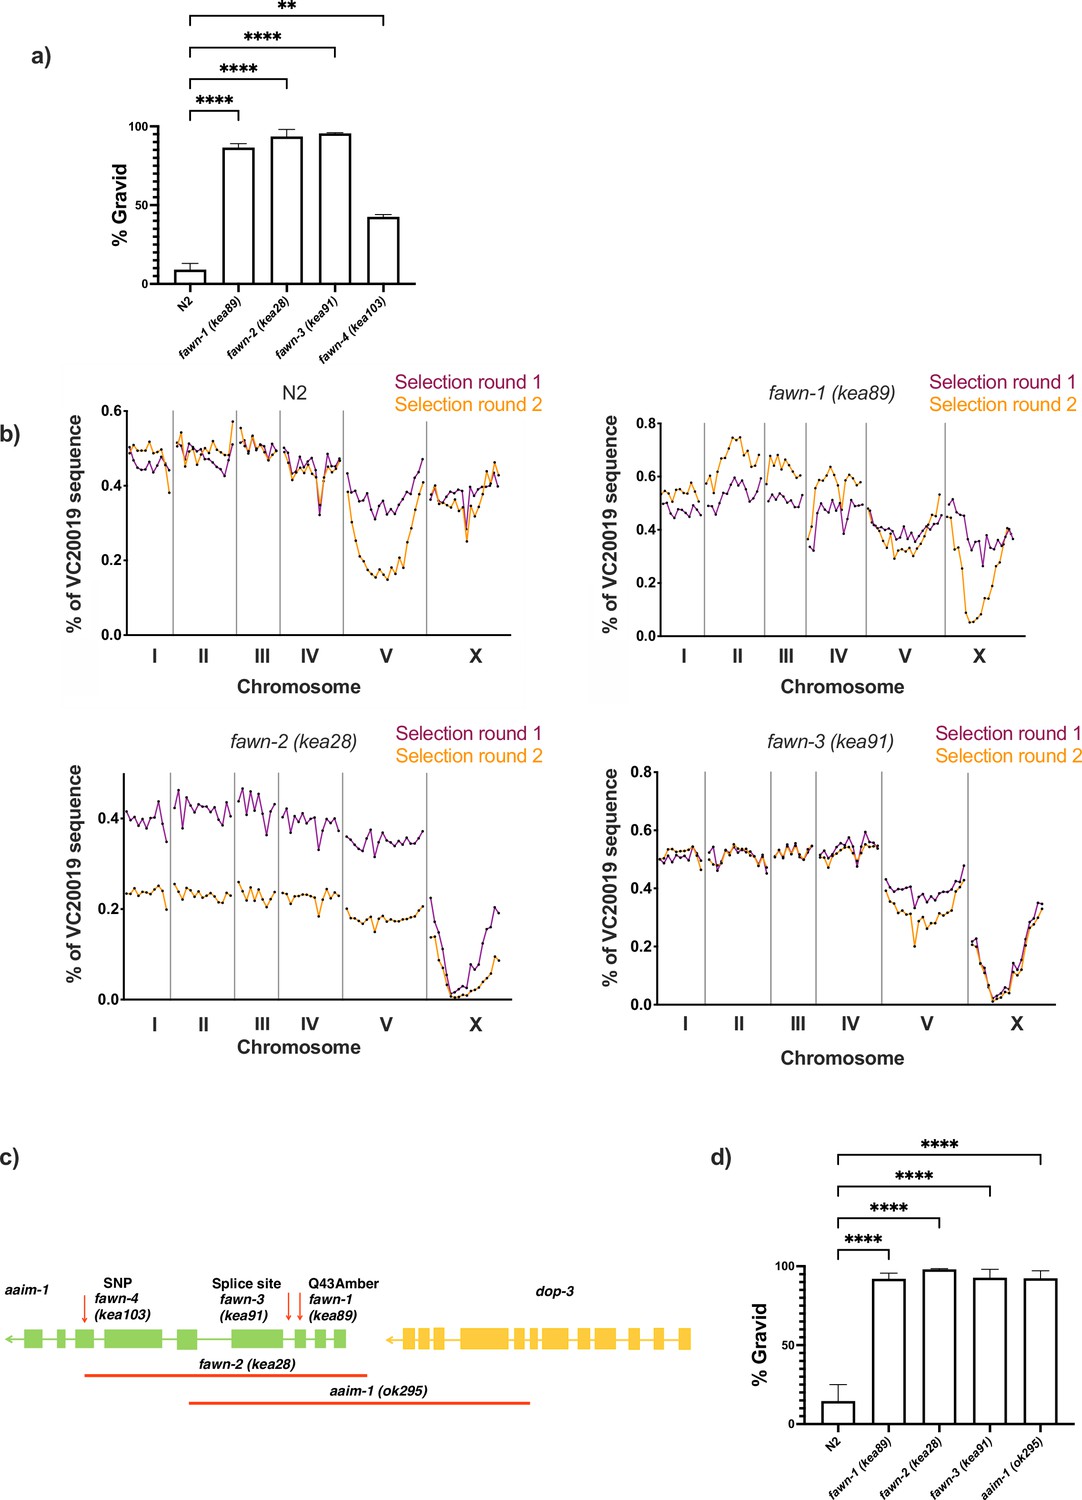
(a-c, and e) L1 stage wild-type (N2) and aaim-1 mutant animals were infected with either a high dose (a, b, and e) or a very lose dose (c) of N. parisii, fixed at 72 hr, and stained with direct-yellow 96 (DY96). (a) Representative images stained with DY96, which stains C. elegans embryos and microsporidia spores. Scale bars, 100 μm. (b and e) Graph displays percentage of gravid worms. (c) Percentage of worms that contain newly formed N. parisii spores. (d) Schematic depicting the nature and location of the different aaim-1 alleles. Boxes represent exons, and connecting lines represent introns. Arrows depict point mutations, and the solid red lines depict deletions. fawn-2 (kea28) has a 2.2 kb deletion and aaim-1 (kea22) has a 2.3 kb deletion. fawn-1 (kea89) carries a C127T, Q43Stop mutation, fawn-3 (kea91) carries a G221A splice site mutation and fawn-4 (kea103) carries a C1286T, A429V mutation in aaim-1. (b,c, and e) Data is from three independent replicates of at least 90 worms each. Mean ± SEM represented by horizontal bars. p-Values determined via one-way ANOVA with post hoc. Significance defined as: * p < 0.05, ** p < 0.01, *** p < 0.001, **** p < 0.0001.
-
Figure 1—source data 1
Mutations in aaim-1 result in resistance to N. parisii infection.
- https://cdn.elifesciences.org/articles/72458/elife-72458-fig1-data1-v2.xlsx
Figure 1—figure supplement 1
Mapping and validation of aaim-1 as the gene associated with resistance to N. parisii.
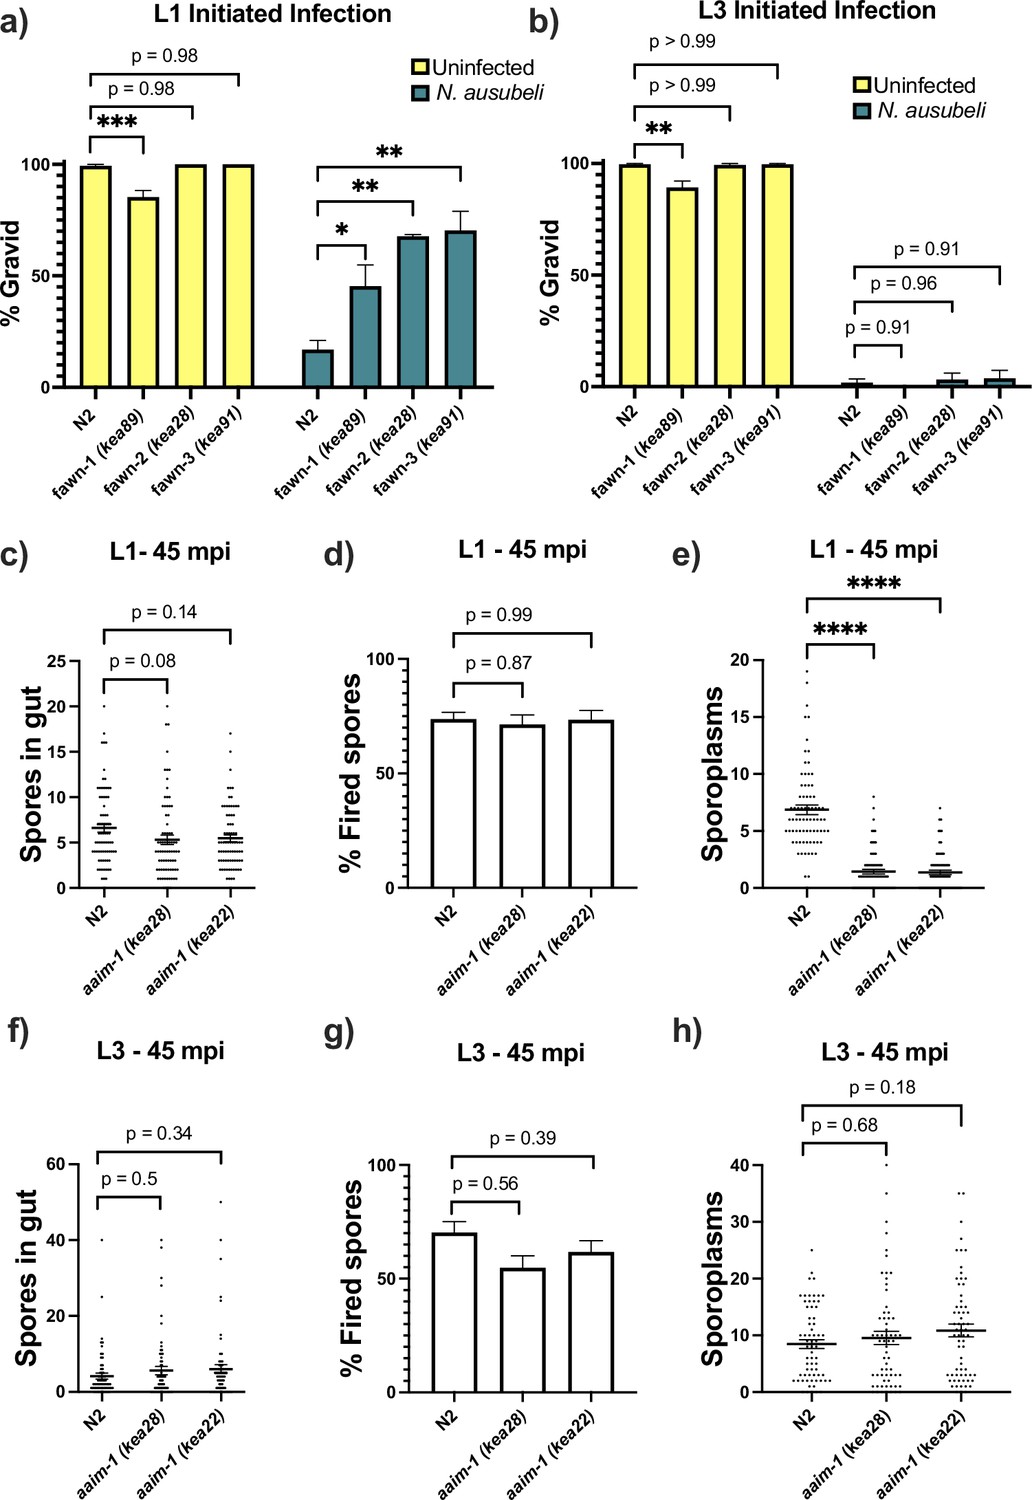
(a) N2 or fawn animals were infected with a medium-3 dose of N. parisii spores on 6-cm plates, fixed at 72 hr, and stained with direct-yellow 96 (DY96). Graph displays percentage of gravid worms. Data is from three independent replicates of 66–300 worms each. (b) F2 recombinants between the mapping strain VC20019 and either N2, fawn-1, fawn-2, or fawn-3 were infected with a medium-2 dose of N. parisii. Two rounds of selection were performed (see Materials and methods). The percentage of sequencing reads mapping to the reference strain VC20019 are depicted on the Y-axis, and the linkage groups are depicted on the X-axis. Sequencing of MIPs resulted in capturing the identity of the genome at 89 distinct regions which are represented as points by their location along the X-axis coordinates. A significantly diminished percentage of VC20019 indicates an enrichment of non-mapping genomic sequence in that region. (c) Schematic representing the location and nature of the different aaim-1 alleles. Boxes represent exons, and connecting lines represent introns. Arrows represent point mutations and solid red lines represent large deletions. fawn-2 (kea28) has a 2.2 kb deletion and aaim-1 (kea22) has a 2.3 kb deletion. aaim-1 (ok295) possesses a large deletion overlapping two different genes, aaim-1 and dop-3, the boundaries of which are unclear (Styer et al., 2008; C. elegans Deletion Mutant Consortium, 2012). (d) L1 stage N2 and aaim-1 mutant animals were infected with a high dose of N. parisii, fixed at 72 hr, and stained with direct-yellow 96 (DY96). Graph displays percentage of gravid worms. Data are from three independent replicates of at least 100 worms each. Mean ± SEM represented by horizontal bars. p-Values determined via one-way Anova with post hoc. Significance defined as ** p < 0.01, **** p < 0.0001.
-
Figure 1—figure supplement 1—source data 1
Mapping and validation of aaim-1 as the gene associated with resistance to N. parisii.
- https://cdn.elifesciences.org/articles/72458/elife-72458-fig1-figsupp1-data1-v2.xlsx
Figure 2 with 2 supplements
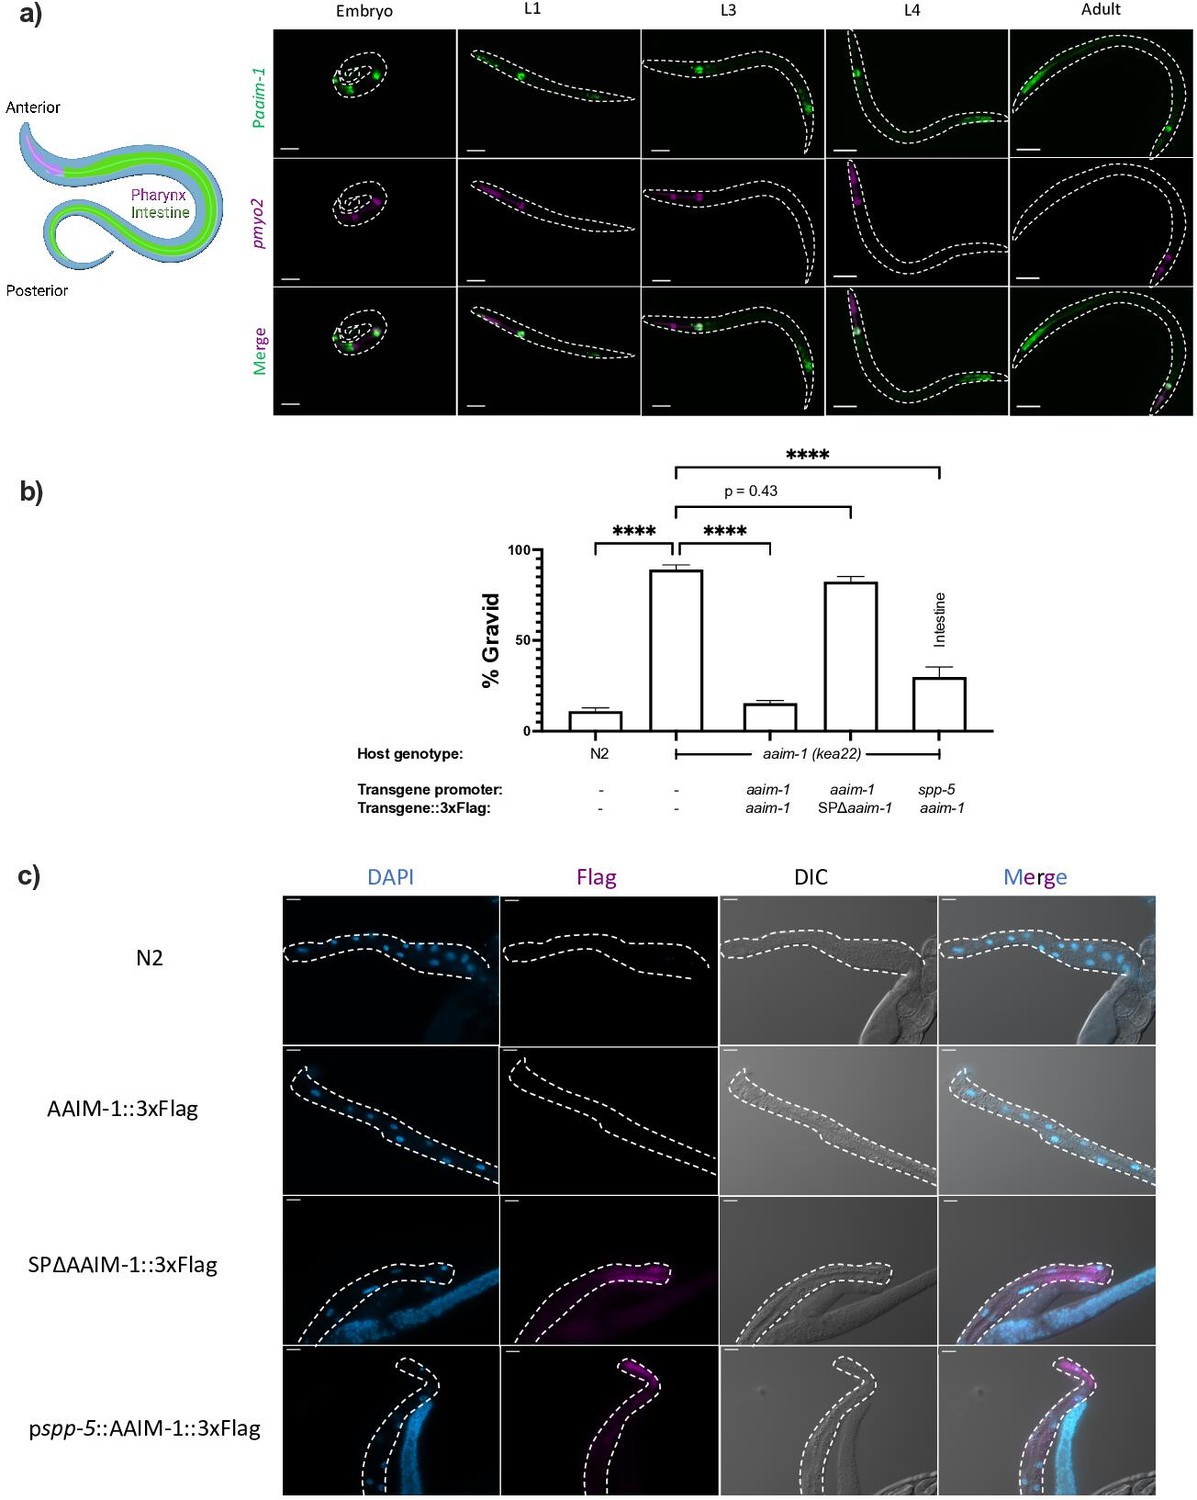
AAIM-1 is secreted from intestinal cells.
(a) Wild-type worms containing an extrachromosomal array expressing GFP from the aaim-1 promoter and mCherry (labelled in magenta) in the pharyngeal muscles were imaged at the embryo, L1, L3, L4, and adult stage. Embryo, L1, and L3 animals were imaged at 40 x, scale bar 20 μm and L4 and adult animals were imaged at 20 x, scale bar 50 μm. L1 to L4 animals are oriented anterior to posterior and the adult animal is oriented posterior to anterior from left to right. Schematic made with Biorender.com (b) N2, aaim-1, and aaim-1 expressing extrachromosomal arrays were infected with a medium-2 dose of N. parisii. Graph displays percentage of gravid worms. Data is from three independent replicates of at least 90 worms each. Mean ± SEM represented by horizontal bars. p-Values determined via one-way ANOVA with post hoc. Significance defined as **** p < 0.0001 (c) Intestines (denoted by dashed lines) of 72 hr post-L1 adults were dissected and stained using anti-Flag (magenta) and DAPI (blue). Images taken at 40 x, scale bar 20 μm.
-
Figure 2—source data 1
AAIM-1 is secreted from intestinal cells.
- https://cdn.elifesciences.org/articles/72458/elife-72458-fig2-data1-v2.xlsx
Figure 2—figure supplement 1
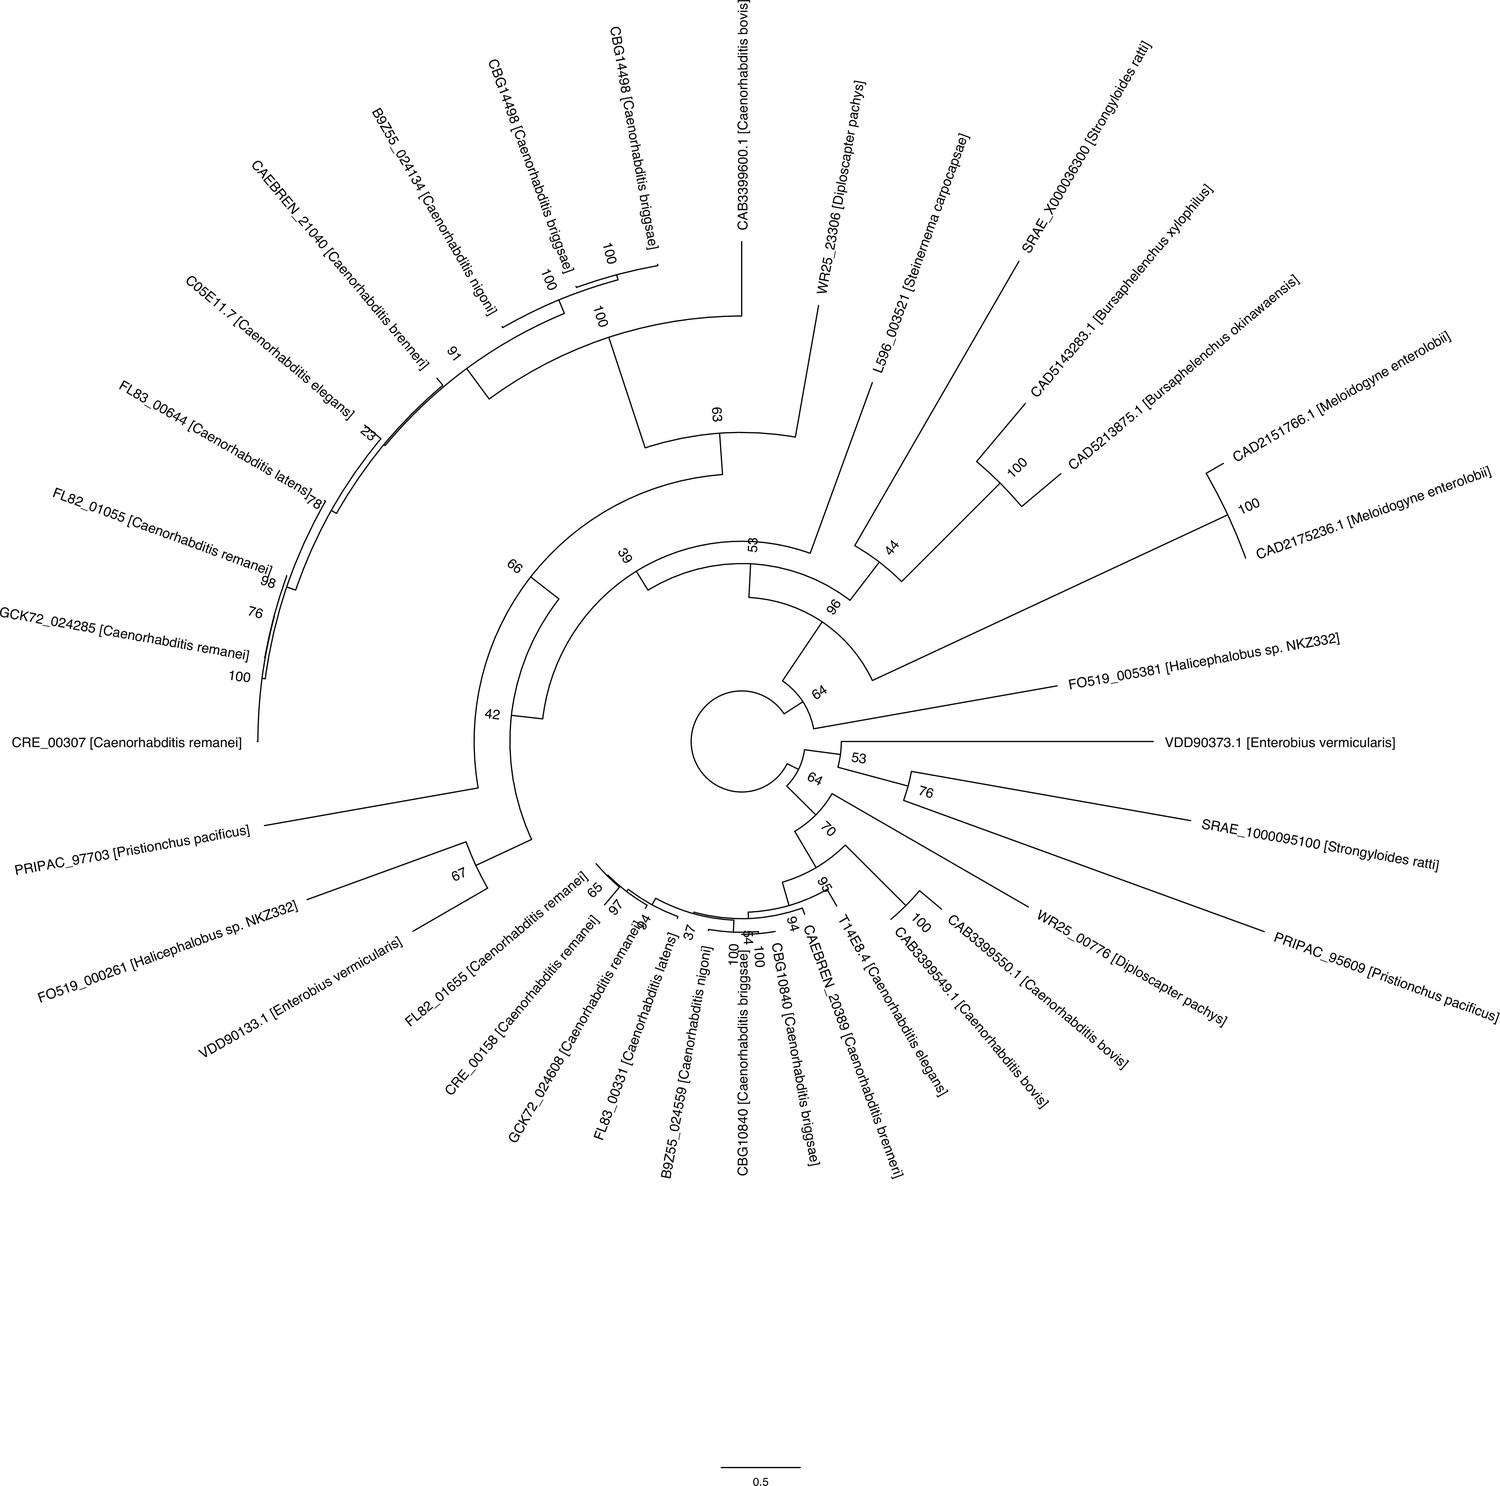
AAIM-1 is conserved in both free-living and parasitic nematodes.
Phylogenetic tree of AAIM-1 homologs. Bootstrap values are shown at the nodes.
Figure 2—figure supplement 2
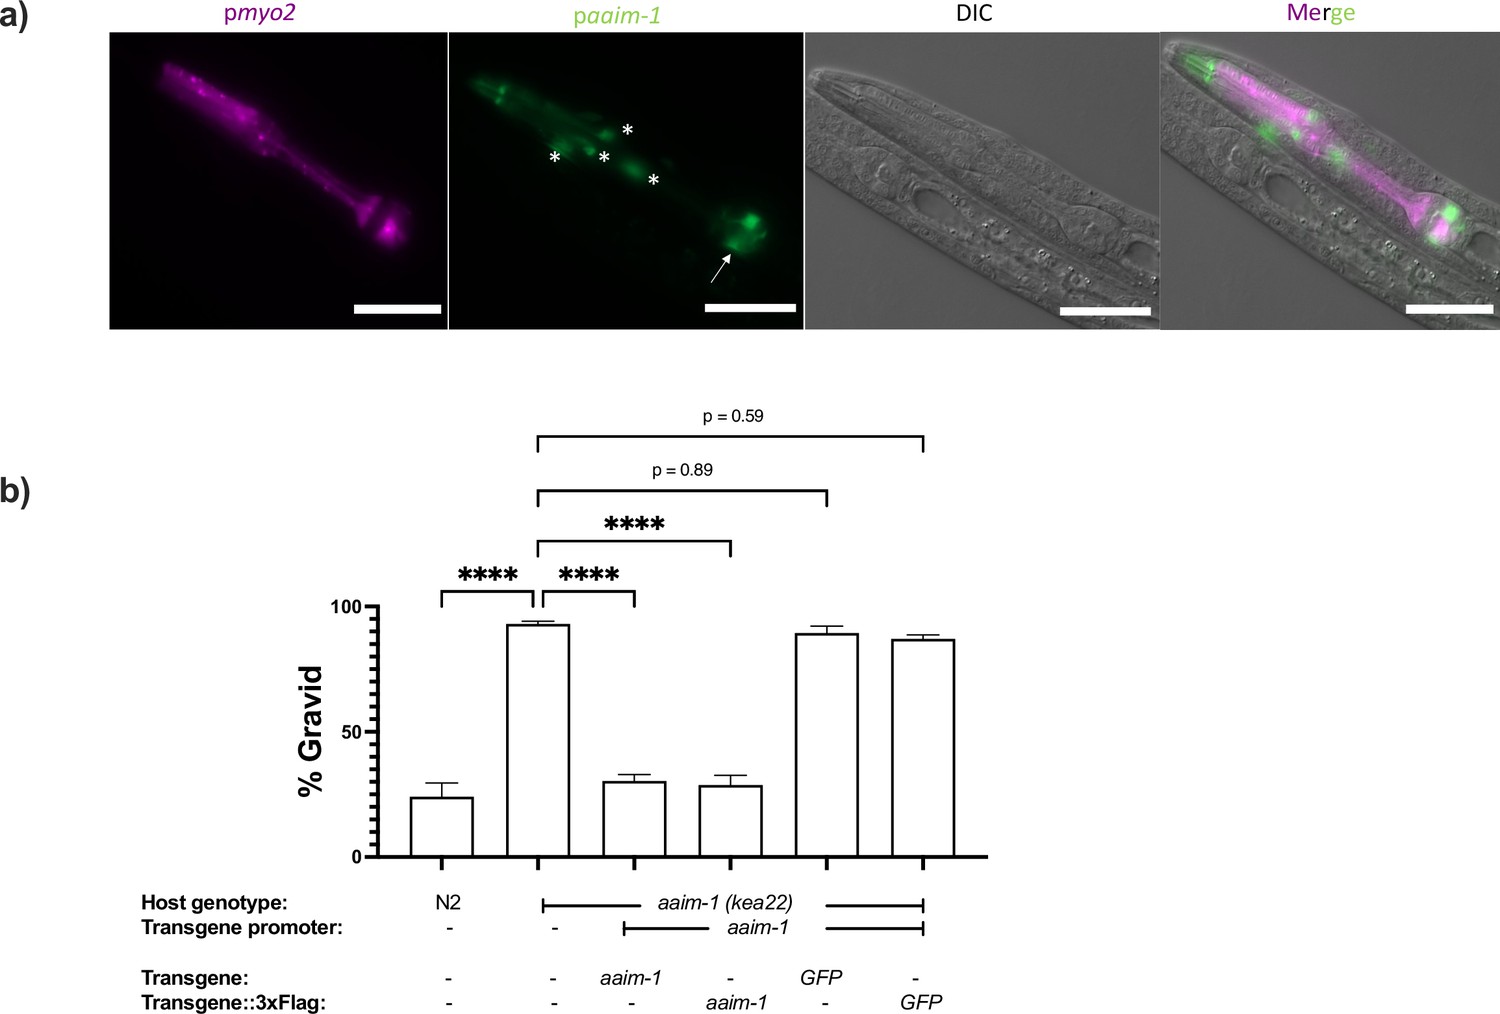
aaim-1 is expressed in arcade cells and presence of C-terminal 3 x Flag tag does not disrupt AAIM-1 function.
(a) N2 containing an extrachromosomal array expressing GFP from the aaim-1 promoter and mCherry (labelled in magenta) in the pharyngeal muscles were imaged at the L1 stage at 40 x. Scale bar 20 μm. Arrow indicates terminal bulb, and asterisks represent arcade cells. (b) N2, aaim-1, and aaim-1 expressing extrachromosomal arrays of wild-type or 3 x Flag tagged constructs were infected with a medium-2 dose of N. parisii, fixed at 72 hr, and stained with direct-yellow 96 (DY96). Graph displays percentage of gravid worms. Data is from three independent replicates of at least 100 worms each. Mean ± SEM represented by horizontal bars. p-Values determined via one-way ANOVA with post hoc. Significance defined as **** p < 0.0001.
-
Figure 2—figure supplement 2—source data 1
aaim-1 is expressed in arcade cells and presence of C-terminal 3 x Flag tag does not disrupt AAIM-1 function.
- https://cdn.elifesciences.org/articles/72458/elife-72458-fig2-figsupp2-data1-v2.xlsx
Figure 3 with 2 supplements
aaim-1 mutants are resistant to microsporidia at the earliest larval stage due to spore misfiring.
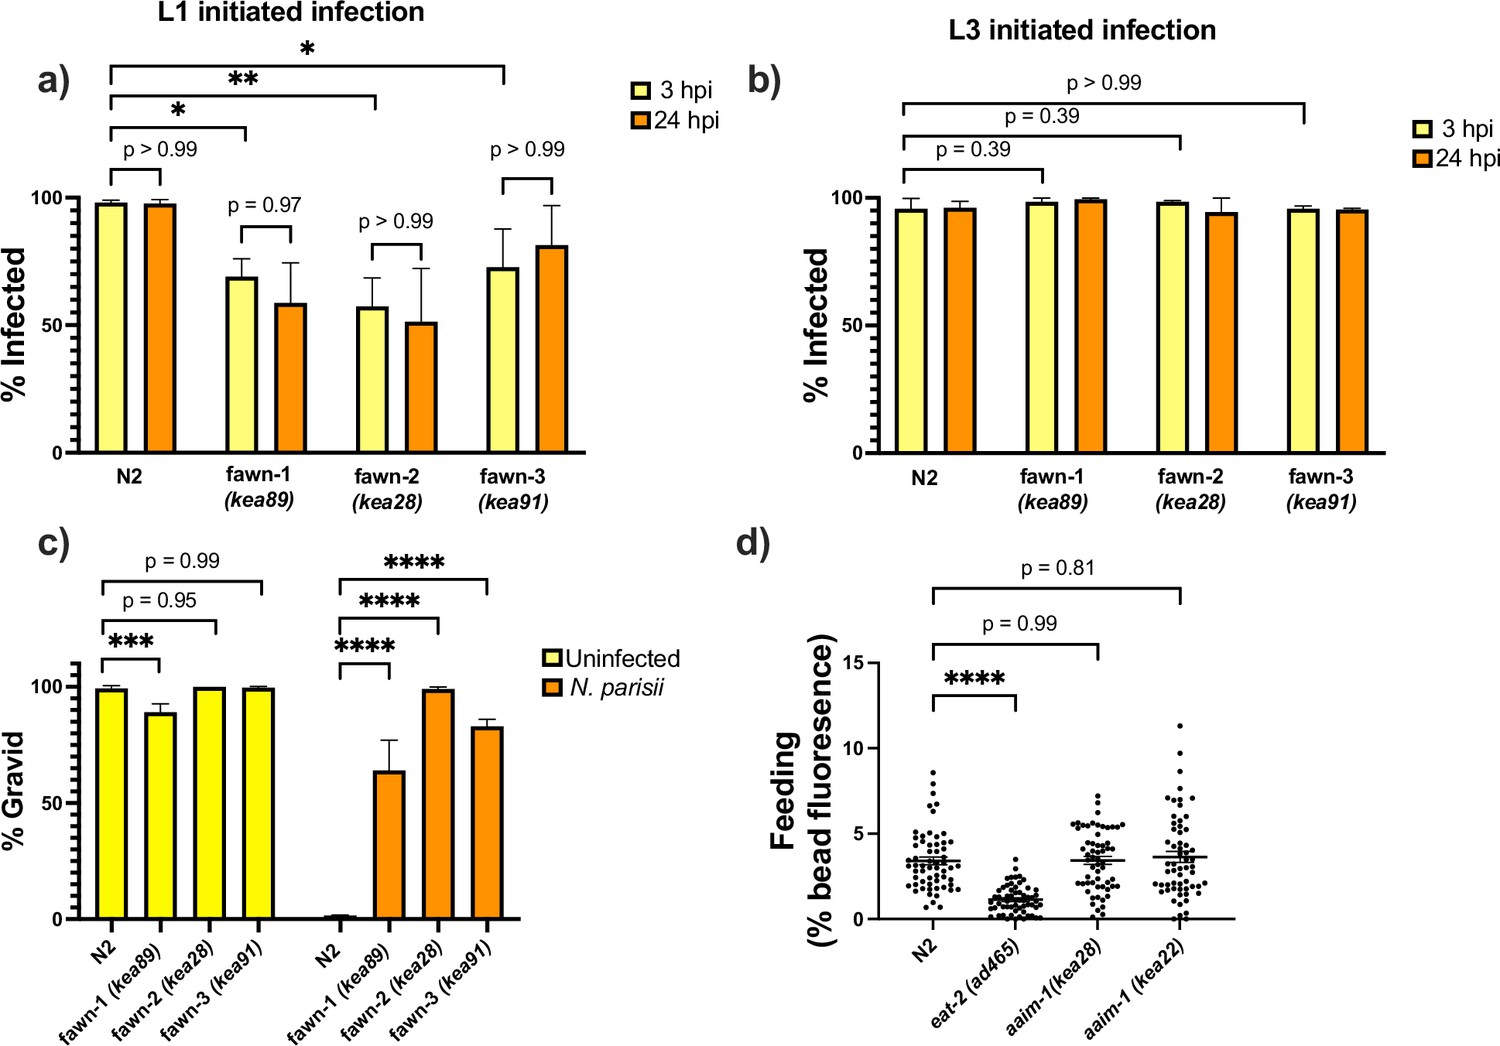
(a–b) N2 and aaim-1 mutants were infected with a medium dose of N. ausubeli at either the L1 stage for 72 hr (a) or a high dose of N. ausubeli at the L3 stage for 48 hr (b) Graph displays percentage of gravid worms. (c–f) N2 and aaim-1 animals were infected with a medium-3 dose of N. parisii for 45 min at L1 (c–e) or L3 (f–h), fixed, and then stained with DY96 and an N. parisii 18 S RNA fish probe. The number of spores per animal (c,f), the percentage of spores fired (d,g), and the number of sporoplasm per worm (e,h) are displayed. Data is from three independent replicates of at least 100 worms each (a–b) or 20–30 worms each (c–h). (a–h) Mean ± SEM represented by horizontal bars. p-values determined via one-way ANOVA with post hoc. Significance defined as: * p < 0.05, ** p < 0.01, *** p < 0.001, **** p < 0.0001.
-
Figure 3—source data 1
aaim-1 mutants are resistant to microsporidia at the earliest larval stage due to spore misfiring.
- https://cdn.elifesciences.org/articles/72458/elife-72458-fig3-data1-v2.xlsx
Figure 3—figure supplement 1
aaim-1 mutants do not clear N. parisii and developmentally restricted N. parisii invasion defect is not due to a feeding defect.
(a–b) N2 and aaim-1 mutants were infected at either the L1 stage (a) or the L3 stage (b) with a medium-1 dose of N. parisii spores for 3 hr. Animals were then washed to remove spores and re-plated for an additional 21 hr. Worms were fixed at both the 3-hr and 24-hr timepoints and stained with an N. parisii 18 S RNA fish probe. Worms containing either sporoplasm or meronts were counted as infected. (c) N2 and aaim-1 adults were allowed to lay embryos on plates. Adults were removed and a low dose of N. parisii was added to the plate. Animals were fixed at 72 hr and stained with direct-yellow 96 (DY96). Graph displays percentage of gravid worms. (d) N2 and aaim-1 mutants were fed fluorescent beads for 3 hr. Quantification of percentage of worm with bead fluorescence. Data is from three independent replicates of at least 100 worms each (a–c) or 20–30 worms each (d). Mean ± SEM represented by horizontal bars. p-Values determined via one-way ANOVA with post hoc. Significance defined as * p < 0.05, ** p < 0.01, *** p < 0.001, **** p < 0.0001.
-
Figure 3—figure supplement 1—source data 1
aaim-1 mutants do not clear N. parisii and developmentally restricted N. parisii invasion defect is not due to a feeding defect.
- https://cdn.elifesciences.org/articles/72458/elife-72458-fig3-figsupp1-data1-v2.xlsx
Figure 3—figure supplement 2
Invasion defects in aaim-1 only occur at the L1 stage of development and a mutation in aaim-1 does not alter the width of the intestinal lumen.
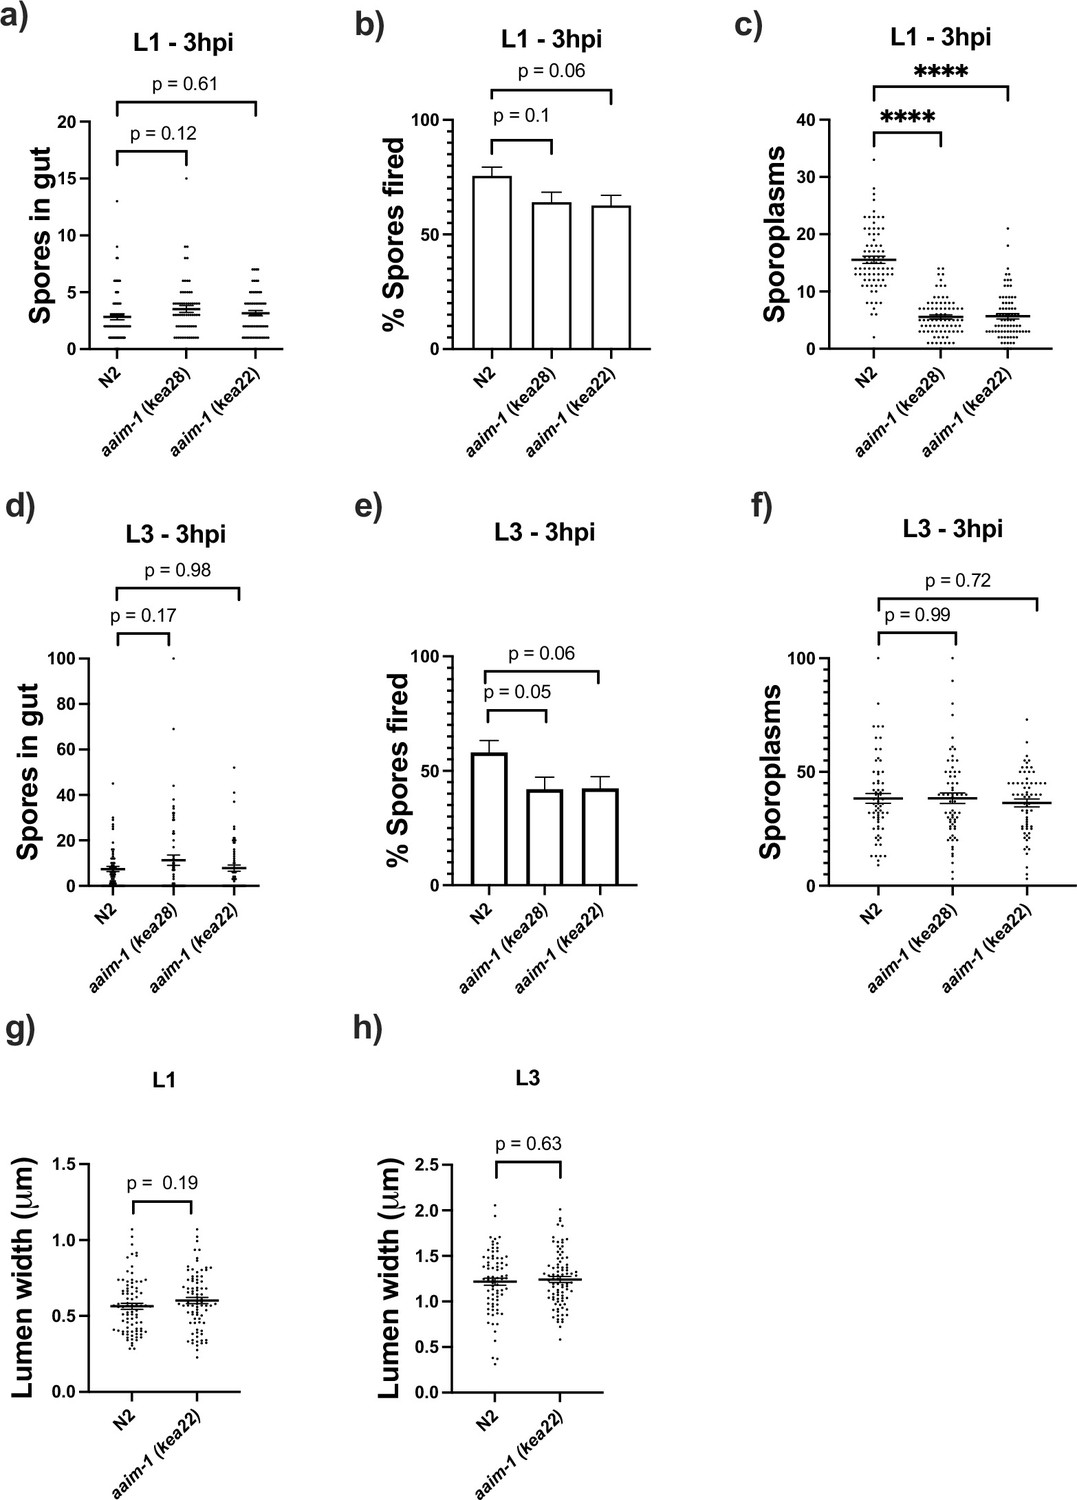
(a–f) N2 and aaim-1 animals were infected for 3 hr at L1 (a–c) or L3 (d-f), fixed, and then stained with DY96 and an N. parisii 18 S RNA fish probe. The number of spores per animal (a,d) the percentage of spores fired (b,e) and the number of sporoplasm per worm (c,f) are displayed. (g,h) The width of the intestinal lumen was measured in L1 (g) or L3 (h) wild-type or aaim-1 animals. (a–h) Data is from three independent replicates of 15–30 worms each. Mean ± SEM represented by horizontal bars. p-Values determined via one-way ANOVA with post hoc (a–f) or Unpaired Student’s t-test (g,h). Significance defined as **** p < 0.0001.
-
Figure 3—figure supplement 2—source data 1
Invasion defects in aaim-1 only occur at the L1 stage of development and a mutation in aaim-1 does not alter the width of the intestinal lumen.
- https://cdn.elifesciences.org/articles/72458/elife-72458-fig3-figsupp2-data1-v2.xlsx
Figure 4

Spores in aaim-1 mutants display improper orientation and distance to the apical intestinal membrane.
(a–e) PGP-1::GFP and aaim-1(kea22); PGP-1::GFP animals were infected with a very high dose of calcofluor white (CFW) pre-stained N. parisii spores for 45 min at either the L1 stage (a–c) or the L3 stage (d-e). (a) Representative images of live animals containing stained spores (blue) relative to the apical intestinal membrane (GFP). Arrow indicates an example of an angled spore and asterisks indicate parallel spores. Images taken at 63 x, scale bar 20 μm. (b, d) Percentage of angled spores. Data is from three independent replicates of at least 90 spores each. (c, e) Distance from the center of each spore to the intestinal apical membrane. Data is from three independent replicates of at least 25 spores each. Mean ± SEM represented by horizontal bars. p-Values determined via unpaired Student’s t-test. Significance defined as ** p < 0.01, *** p < 0.001.
-
Figure 4—source data 1
Spores in aaim-1 mutants display improper orientation and distance to the apical intestinal membrane.
- https://cdn.elifesciences.org/articles/72458/elife-72458-fig4-data1-v2.xlsx
Figure 5 with 2 supplements
aaim-1 is upregulated by N. parisii and P. auerginosa and aaim-1 animals are susceptible to infection by P. aeruginosa.
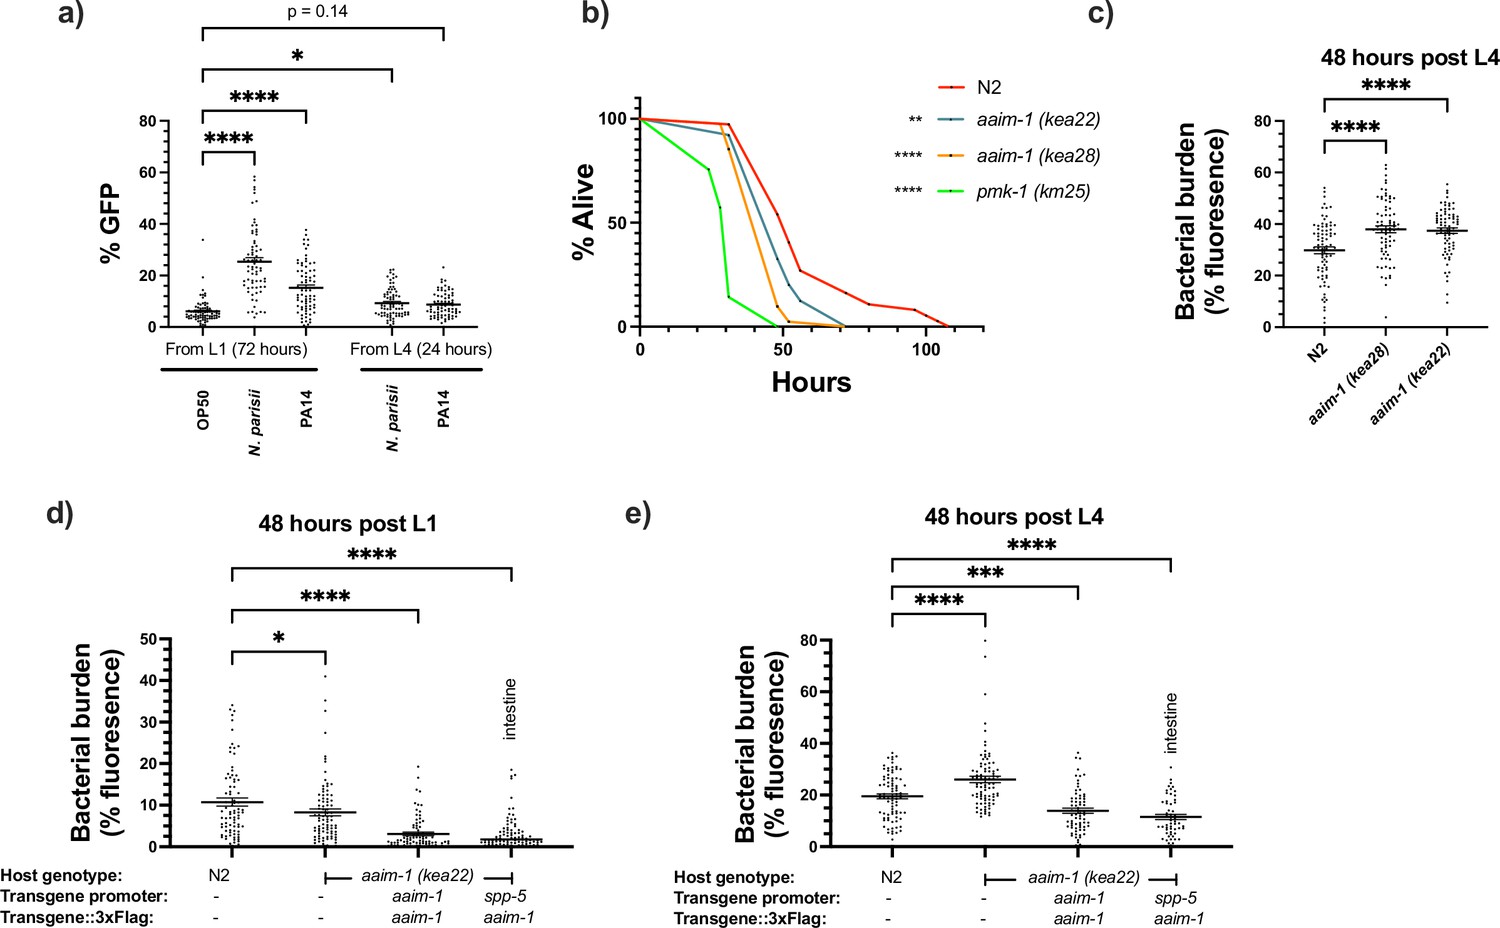
(a) Expression of paaim-1::GFP::3xFlag in response to infection with either PA14 or N. parisii for either 72 hr from L1 or 24 hr from L4. Data is from three independent replicates of at least 18–25 worms each. Every point represents a single worm. Percentage GFP was measured as the percentage of the animal containing GFP via FIJI. (b) L4 stage N2, aaim-1, and pmk-1 (km25) animals were plated on full lawns of P. aeruginosa PA14::DsRed and the percentage of animals alive was counted over the course of 96 hr. TD50: N2 48 hr, aaim-1 (kea28) 44 hr, aaim-1 (kea22) 33 hr, and pmk-1 (km25) 28 hr. Three independent replicates were carried out, and a representative replicate is displayed. At least 37 worms were quantified per strain. p-Values determined via Log-rank (Mantel-Cox) test. Significance defined as * p < 0.05, ** p < 0.01. (c–e) N2, aaim-1, or aaim-1 animals with different extrachromosomal arrays were plated on PA14::DsRed at either the L1 stage (d) or L4 stage (c,e) for 48 hr. Bacterial burden was measured as the percentage of the animal containing PA14::DsRed. Data is from three independent replicates of 20–30 worms each. Every point represents a single worm. Mean ± SEM represented by horizontal bars. p-Values determined via two-way (a) or one-way ANOVA(c-e) with post hoc. Significance defined as * p < 0.05, ** p < 0.01, *** p < 0.001, **** p < 0.0001.
-
Figure 5—source data 1
aaim-1 is upregulated by N. parisii and P. auerginosa and aaim-1 animals are susceptible to infection by P. aeruginosa.
- https://cdn.elifesciences.org/articles/72458/elife-72458-fig5-data1-v2.xlsx
Figure 5—figure supplement 1
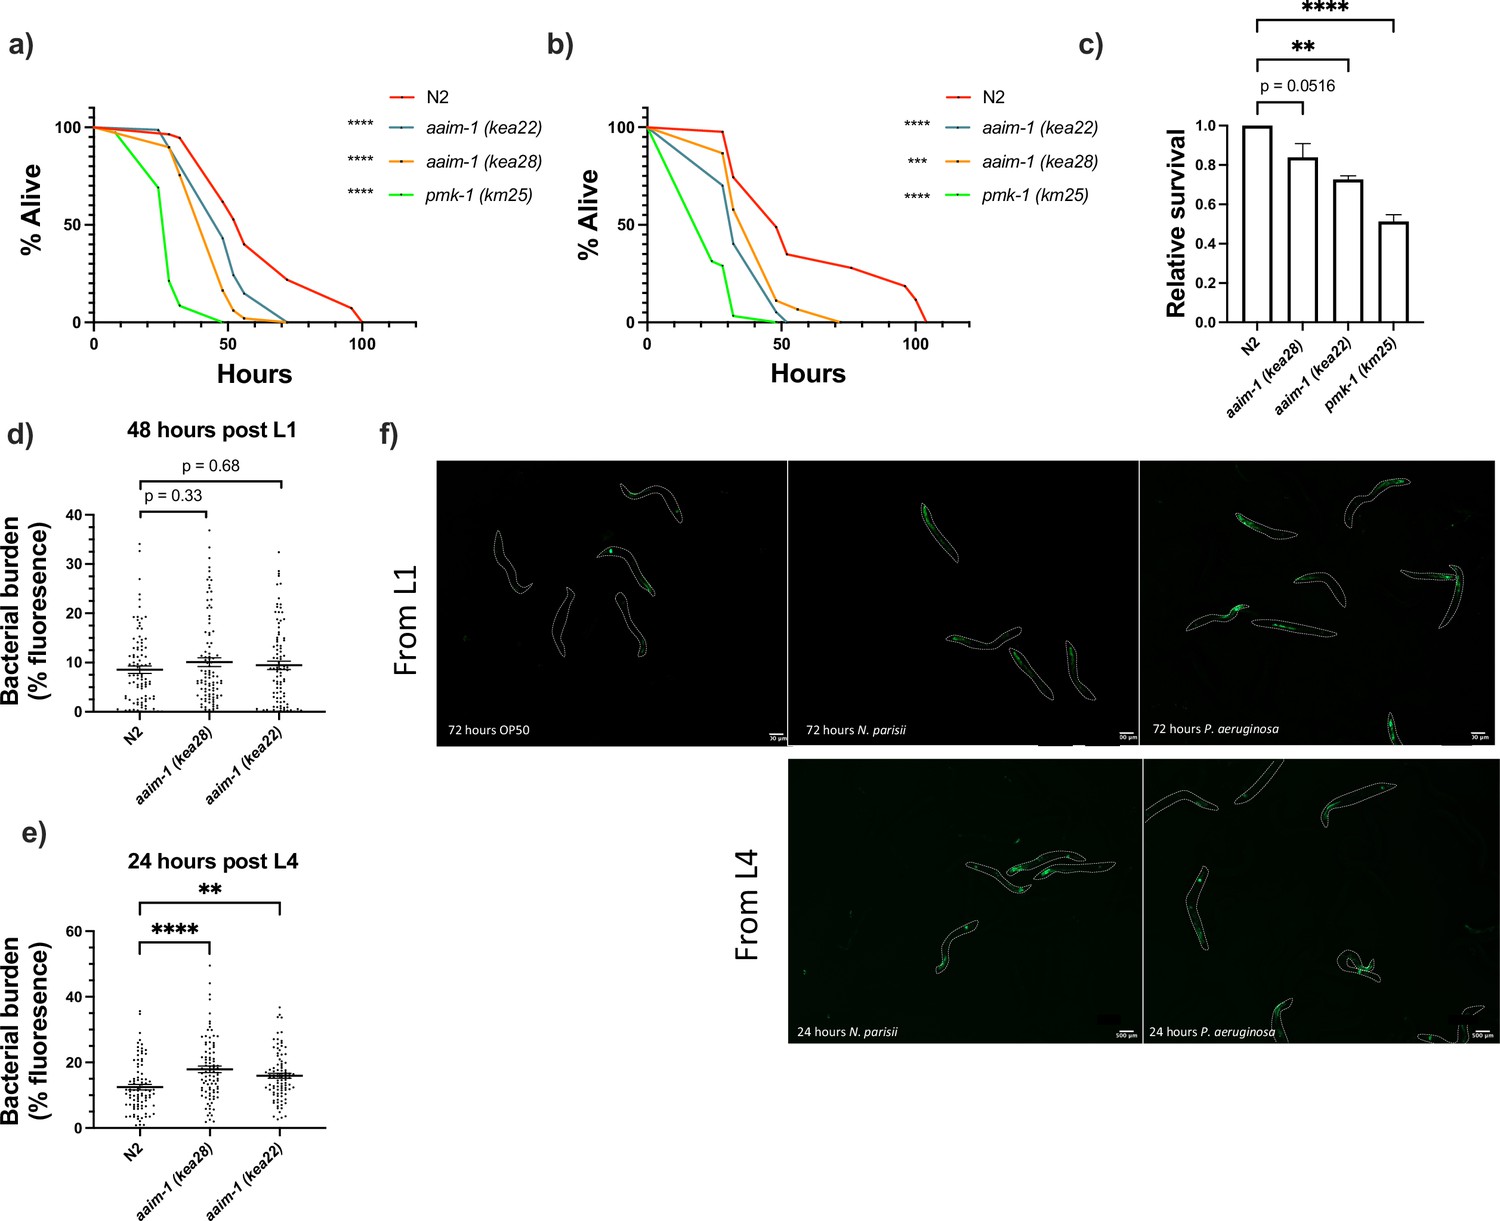
Susceptibility to P. aeruginosa PA14 appears at L4.
(a,b) Additional replicates of survival assays of animals grown on full lawns of PA14::DsRed as in Figure 5a. (a) TD50: N2 51 hr, aaim-1 (kea28) 46 hr, aaim-1 (kea22) 38 hr, and pmk-1 (km25) 25 hr. (b) TD50: N2 43 hr, aaim-1 (kea28) 30 hr, aaim-1 (kea22) 32 hr, and pmk-1 (km25) 20 hr. (c) Relative survival of mutants to N2 as calculated by mean strain TD50/mean N2 TD50. (d-e) N2 and aaim-1 mutants were grown on PA14::DsRed 48 hr post L1 (d) or 24 hr post L4 (e). Data is from three independent replicates of 20–30 worms each. Every point represents a single worm. Bacterial burden was measured as the percentage of the animal containing PA14::DsRed via FIJI. Mean ± SEM represented by horizontal bars. (f) paaim-1::GFP::3xFlag were exposed to either PA14 or N. parisii 72 hr post L1 or 24 hr post L4. Animals were imaged at 45.5 x, scale bar 500 μm. p-Values determined via one-way ANOVA with post hoc. Significance defined as ** p < 0.01, **** p < 0.0001.
-
Figure 5—figure supplement 1—source data 1
Susceptibility to P. aeruginosa PA14 appears at L4.
- https://cdn.elifesciences.org/articles/72458/elife-72458-fig5-figsupp1-data1-v2.xlsx
Figure 5—figure supplement 2
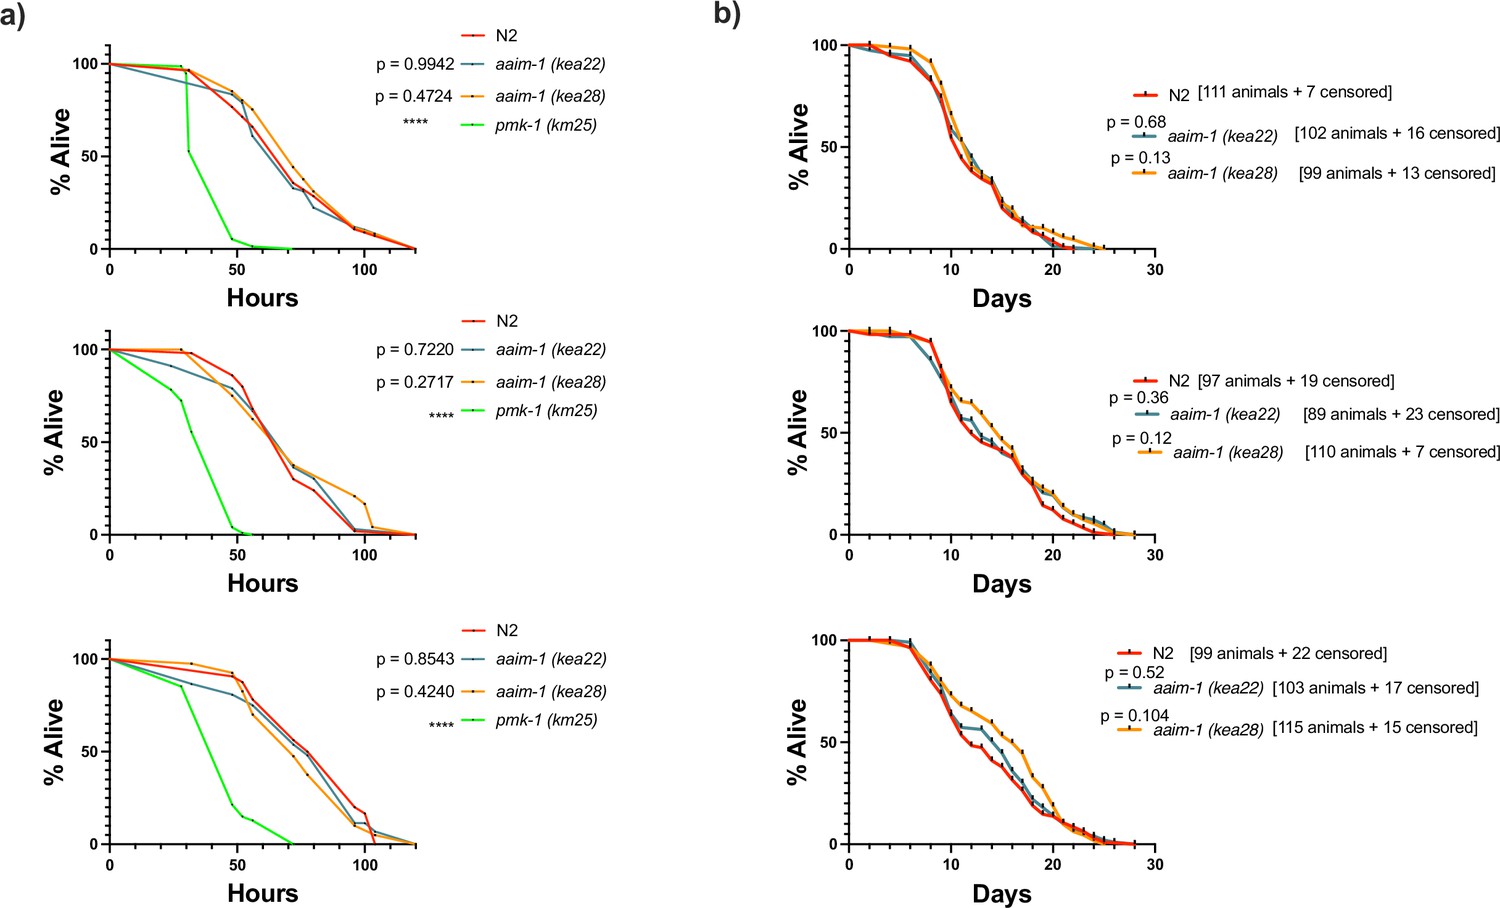
A mutation in aaim-1 does not influence C. elegans defense against S. aureus or lifespan.
(a) L4 stage N2 and aaim-1 were plated on full lawns of S. aureus NCTC8325 and the percentage of animals alive was counted over the course of 120 hr. Three independent replicates are displayed. At least 40 worms were quantified per strain. (b) N2 and aaim-1 mutants were grown on E. coli OP50-1 for 1 month, and survival measured as number of animals responsive to touch. The number of animals quantified, as well as those censored are denoted on the graph. Three independent survival assays are displayed. p-Values determined via Log-rank (Mantel-Cox) test. Significance defined as **** p < 0.0001.
-
Figure 5—figure supplement 2—source data 1
A mutation in aaim-1 does not influence C. elegans defense against S. aureus or lifespan.
- https://cdn.elifesciences.org/articles/72458/elife-72458-fig5-figsupp2-data1-v2.xlsx
Figure 6 with 1 supplement
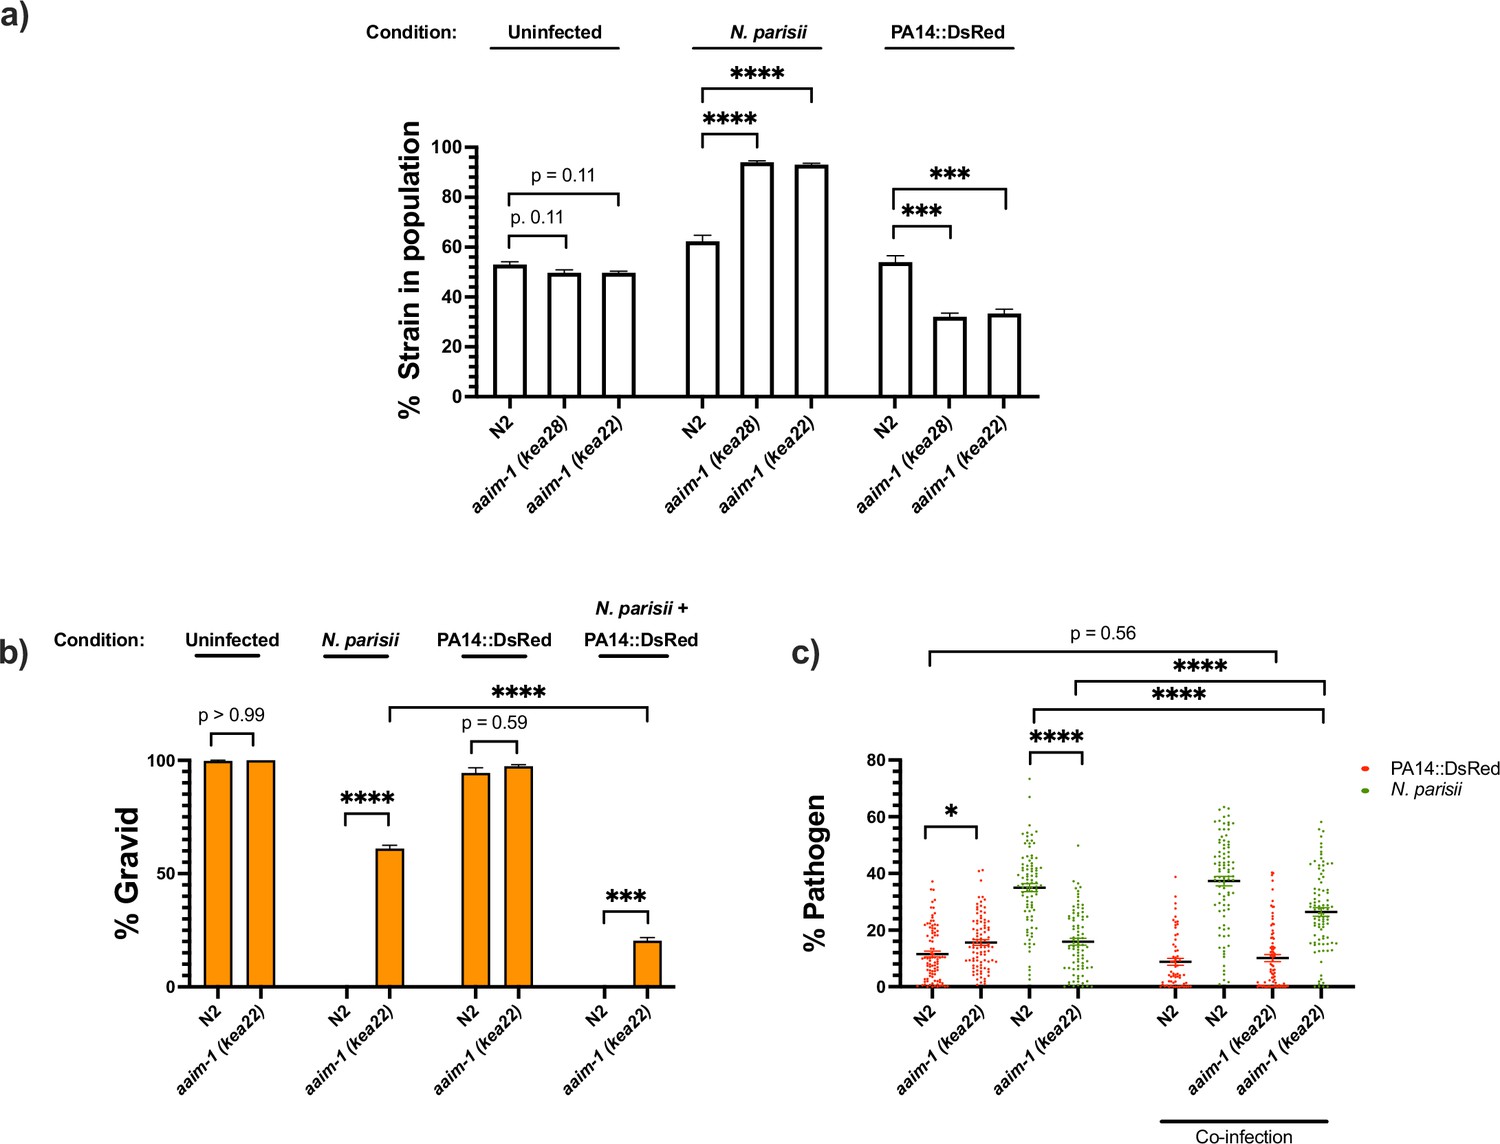
aaim-1 alleles display enhanced fitness on N. parisii, but reduced fitness on P. aeruginosa.
(a) Competitive fitness assays performed with a fluorescently marked strain (RFP::ZNFX1) mixed with either N2 or aaim-1 mutants. These mixed populations of animals were plated at the L1 stage on either E. coli, a medium-2 dose of N. parisii, or on P. aeruginosa. After 8 days, the fraction of animals that did not display fluorescent germ granules was counted. Data is from three independent replicates of 20–270 worms each. (b,c) L1 stage N2 and aaim-1 animals were either uninfected or infected with a maximal dose of N. parisii. These infected and uninfected population of animals were then washed and placed on either E. coli or PA14::DsRed. After 69 hr, animals were fixed and stained with DY96. Data is from three independent replicates of 60–150 worms each. (b) Graph displays percentage of gravid adults. (c) Quantified amount of either N. parisii (DY96) or P. aeruginosa (PA14::DsRed). Twelve to 30 worms were quantified per replicate. Mean ± SEM represented by horizontal bars. p-Values determined via one-way ANOVA with post hoc. Significance defined as ** p < 0.01, *** p < 0.001, **** p < 0.0001.
-
Figure 6—source data 1
aaim-1 alleles display enhanced fitness on N. parisii, but reduced fitness on P. aeruginosa.
- https://cdn.elifesciences.org/articles/72458/elife-72458-fig6-data1-v2.xlsx
Figure 6—figure supplement 1
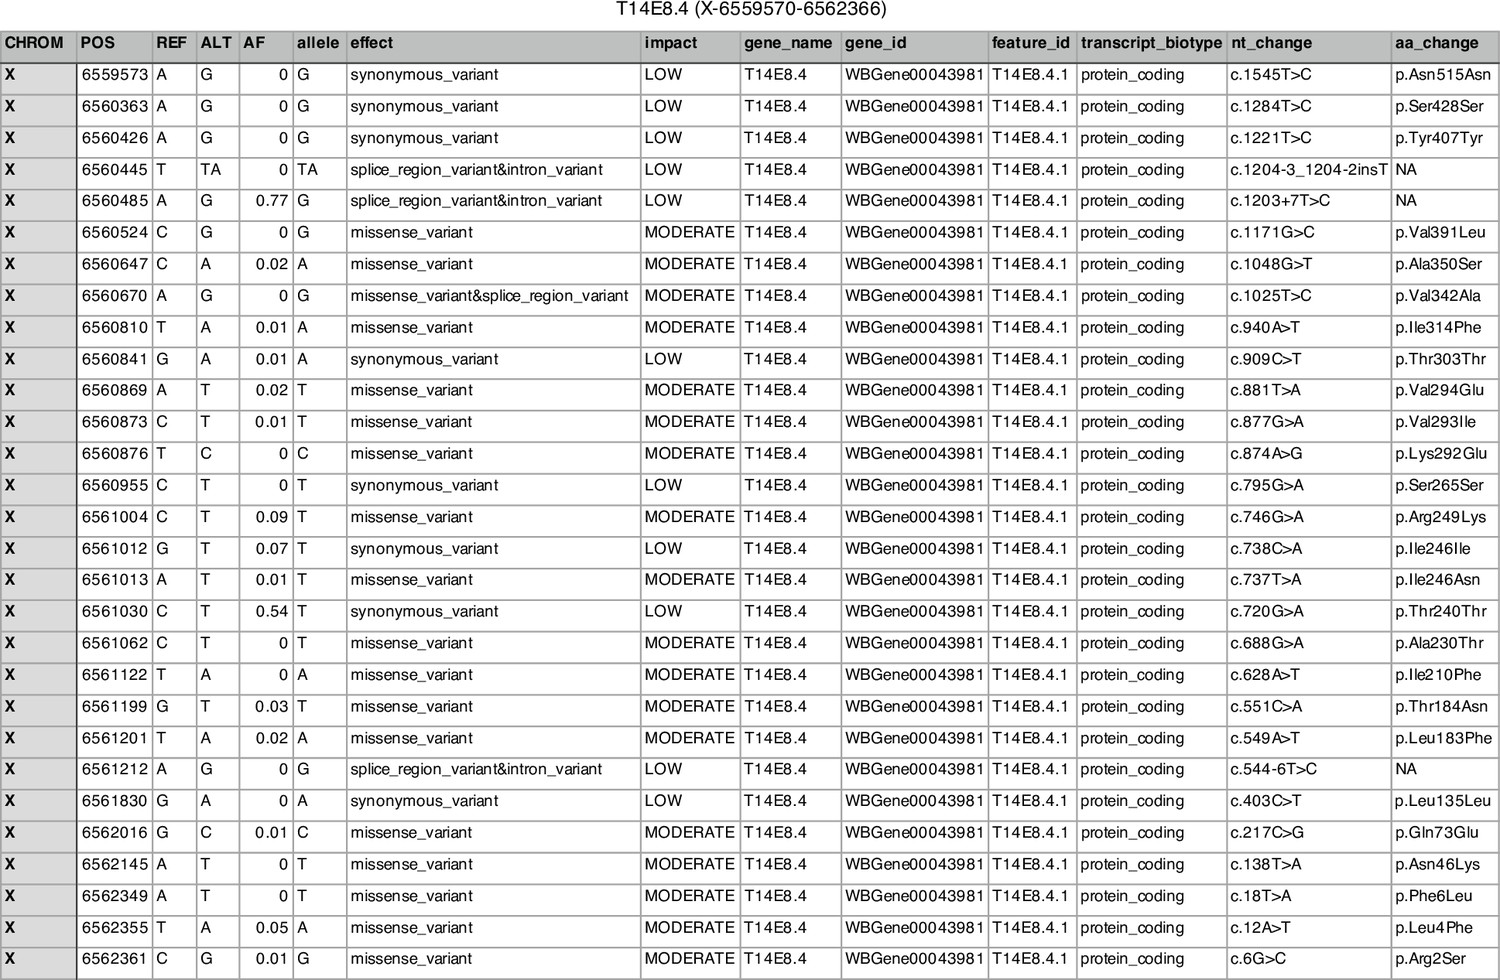
List of naturally occurring aaim-1(T14E8.4) variants in wild isolates of C. elegans.
This table represents a list of aaim-1 coding variants found to naturally occur in wild isolates of C. elegans gnerated by the CeNDR variant browser (Cook et al., 2017). The reference allele (REF) as well as the alternate variant (ALT) and the allele frequecy (AF) are displayed for various sites (POS) across aaim-1. The nature (effect) and impact of these variants are depicted as well as the nucleotide changes (nt_change) and the corresponding amino acid change (aa_change). aaim-1 does not possess any variants predicted to have a high impact, implying that there are no obvious loss of function alleles and that its retention in the wild is advantageous.
-
Figure 6—figure supplement 1—source data 1
Editable version of Figure 6—figure supplement 1.
- https://cdn.elifesciences.org/articles/72458/elife-72458-fig6-figsupp1-data1-v2.pdf
Figure 7

Secreted AAIM-1 functions in the intestinal lumen to limit bacterial colonization but is exploited by microsporidia to ensure successful invasion of intestinal cells.
AAIM-1 is secreted from intestinal cells, where the protein limits bacterial colonization in the lumen. Additionally, AAIM-1 is parasitized by N. parisii spores to ensure successful orientation and firing during intestinal cell invasion. Infection by either of these two pathogens results in the upregulation of AAIM-1. Figure made with Biorender.com.
Additional files
-
Supplementary file 1
Spore doses utilized in this study.
The different species of microsporidia used in the study, and the varying doses (as defined in figure legends) are listed. Plate concentration refers to the number of spores occupied per cm2 of either 3.5, 6, or 10 cm NGM plates (indicated by *, ** or *** in the ‘total spores on assay plate’ column). The total number of spores present on a single assay plate are listed for the various doses in millions of spores.
- https://cdn.elifesciences.org/articles/72458/elife-72458-supp1-v2.xlsx
-
Transparent reporting form
- https://cdn.elifesciences.org/articles/72458/elife-72458-transrepform1-v2.docx
Download links
A two-part list of links to download the article, or parts of the article, in various formats.
Downloads (link to download the article as PDF)
Open citations (links to open the citations from this article in various online reference manager services)
Cite this article (links to download the citations from this article in formats compatible with various reference manager tools)
An intestinally secreted host factor promotes microsporidia invasion of C. elegans
eLife 11:e72458.
https://doi.org/10.7554/eLife.72458


