Development and characterization of new tools for detecting poly(ADP-ribose) in vitro and in vivo
- Laboratory of Signaling and Gene Regulation, Cecil H. and Ida Green Center for Reproductive Biology Sciences, University of Texas Southwestern Medical Center, United States
- Division of Basic Research, Department of Obstetrics and Gynecology, University of Texas Southwestern Medical Center, United States
- Program in Genetics, Development, and Disease, Graduate School of Biomedical Sciences, University of Texas Southwestern Medical Center, United States
Figures
Figure 1 with 1 supplement
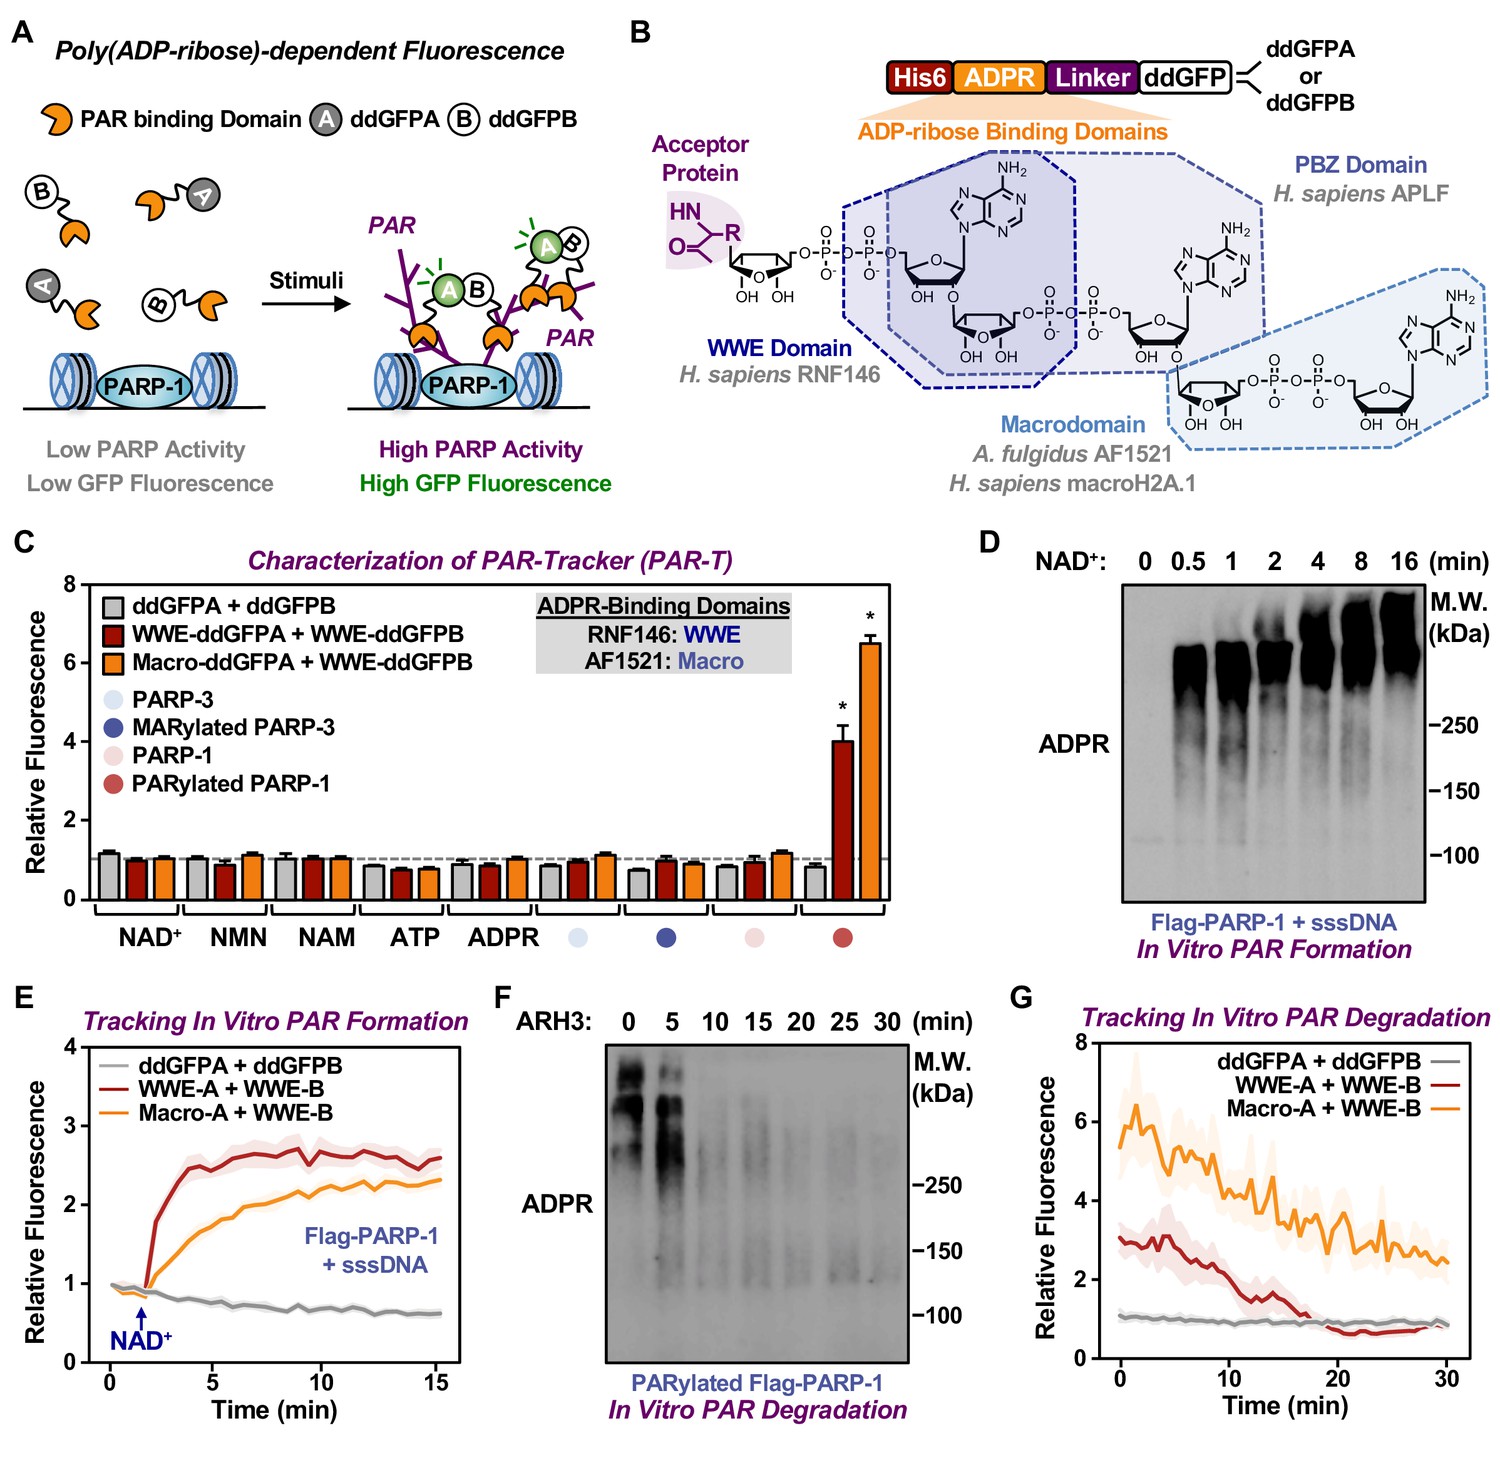
Development of ddGFP-based fluorescent sensors to measure PAR levels.
(A) Schematic diagram of the fluorescent PAR Trackers (PAR-Ts). (B) Schematic diagram of the plasmid constructs used to express the ddGFP PAR-T in bacteria. Chemical structures of a PARylated amino acid, a MARylated amino acid, and the chemical moieties in ADPR that are recognized by the ADPR binding domains. The constructs contain DNA segments encoding (1) His tag (red), (2) ADP-ribose binding domain (yellow), (3) a flexible linker (purple), and (4) ddGFP proteins (white). (C) Verification of substrate specificity. Fluorescence measurements of in vitro ADPRylation assays containing the indicated substrates. Each bar in the graph represents the mean ± SEM of the relative fluorescence intensity (n=3, two-way ANOVA, *p<0.0001). (D, E) Western blot analysis (D) and fluorescence measurements (E) of the time course of in vitro PAR formation using recombinant PARP-1. Each line plot in the graph in (E) represents mean ± SEM of relative fluorescence intensity (n=3). (F, G) Western blot analysis (F) and fluorescence measurements (G) of the time course of in vitro PAR degradation using recombinant ARH3. Each line plot in the graph in (G) represents the mean ± SEM of relative relative fluorescence intensity (n=3).
Figure 1—figure supplement 1
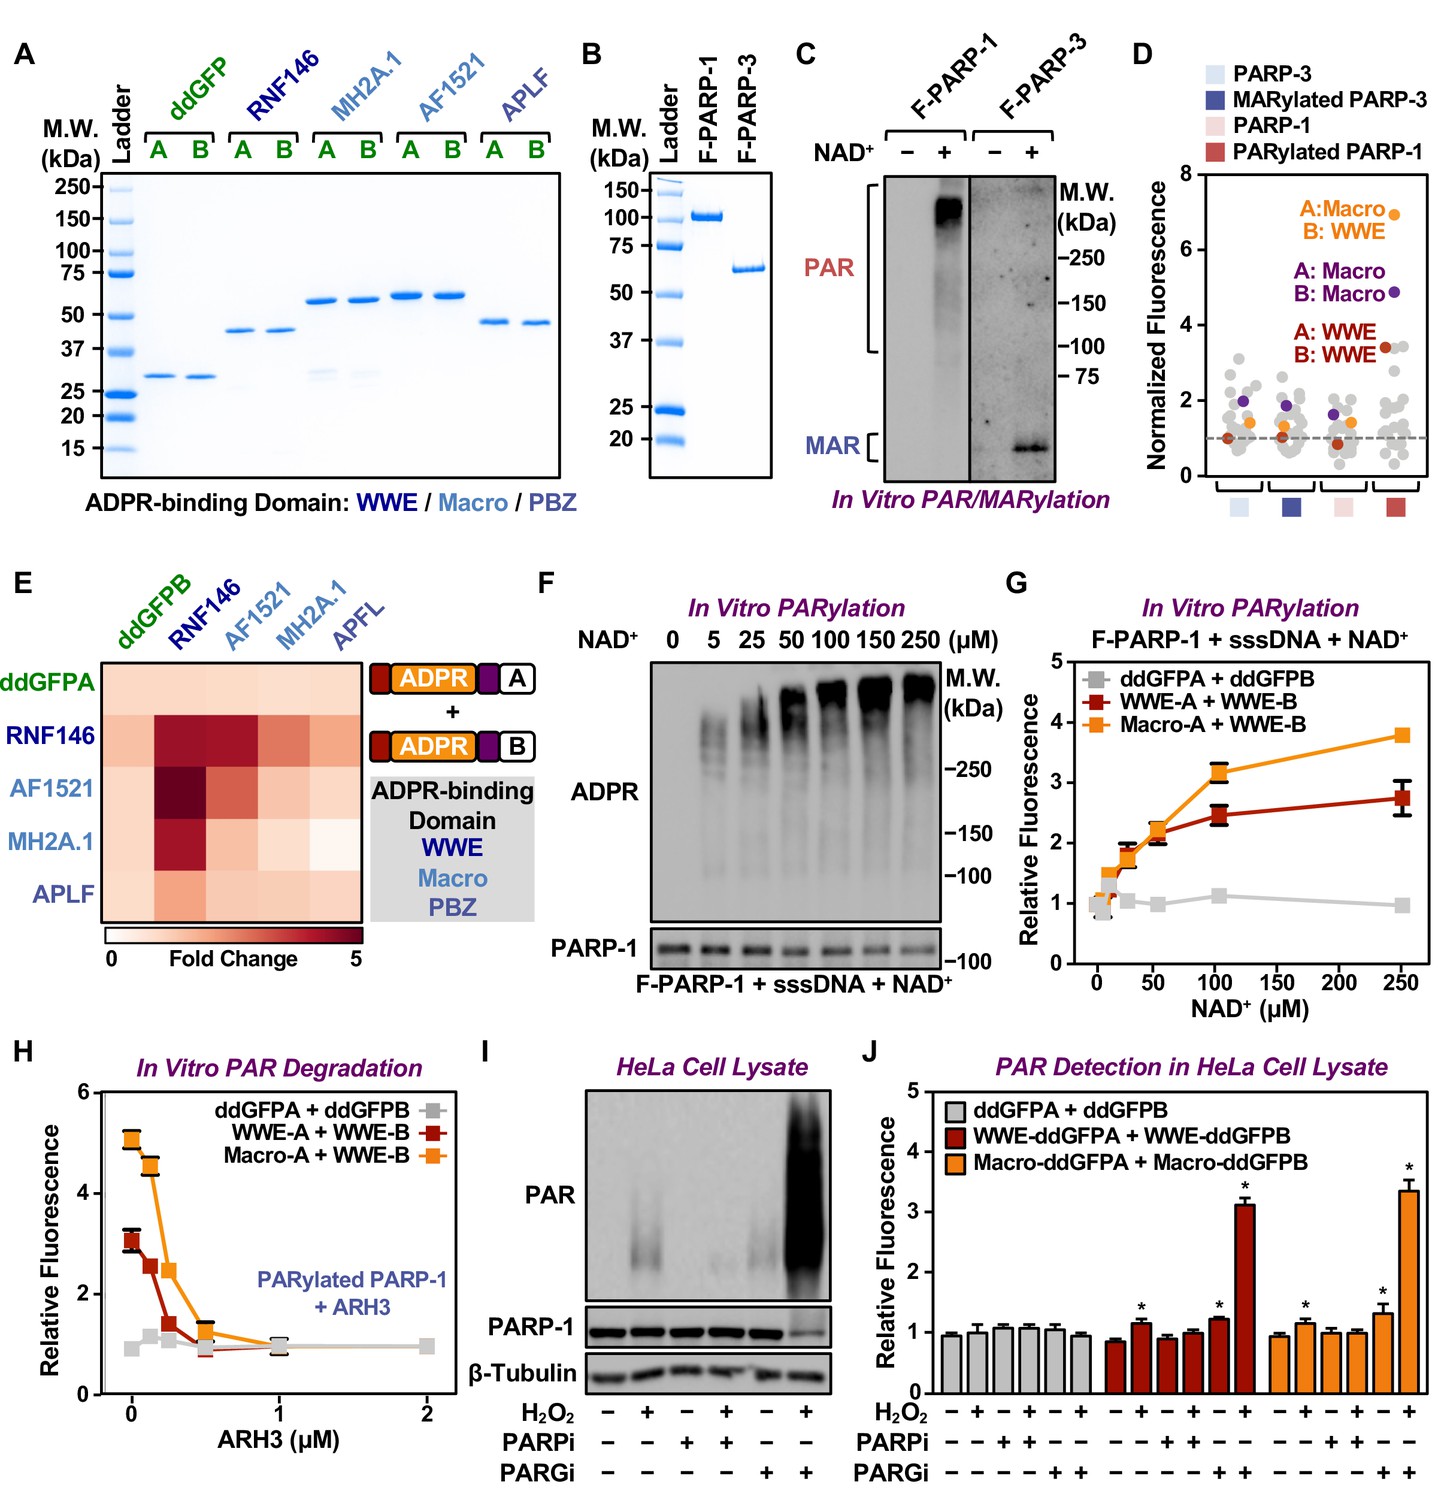
Characterization of fluorescence-based PAR-Trackers using biochemical assays.
(A) SDS-PAGE with Coomassie brilliant blue staining of recombinant ddGFP PAR-Trackers with the indicated ADPR binding domains. (B) SDS-PAGE with Coomassie brilliant blue staining of recombinant Flag-tagged PARP-1 and PARP-3 proteins. (C) In vitro auto(ADP-ribosyl)ation reactions using recombinant PARP-1 and PARP-3 proteins from (B). (D, E) Fluorescence measurements (D) and heatmap (E) of in vitro PARylation detection assays performed using the indicated PAR-binding domains. (F, G) Western blot analysis (F) and fluorescence measurements (G) of in vitro PAR formation using recombinant PARP-1 and the indicated concentrations of NAD+. Each line in the graph in (G) represents the mean ± SEM of the relative fluorescence intensity (n=3). (H) Fluorescence measurements of in vitro PAR degradation using the indicated concentrations of recombinant ARH3. Each line plot in the graph represents the mean ± SEM of the relative fluorescence intensity (n=3). (I, J) Western blot analysis (I) and fluorescence measurements (J) of PAR in HeLa cell extracts using recombinant ddGFP proteins. The cells were treated with 20 µM PJ34 or 20 µM PARGi for 2 hr before lysis. Each bar in the graph in (J) represents the mean ± SEM of the relative fluorescence intensity (n=3, two-way ANOVA, *p<0.05).
Figure 2 with 2 supplements
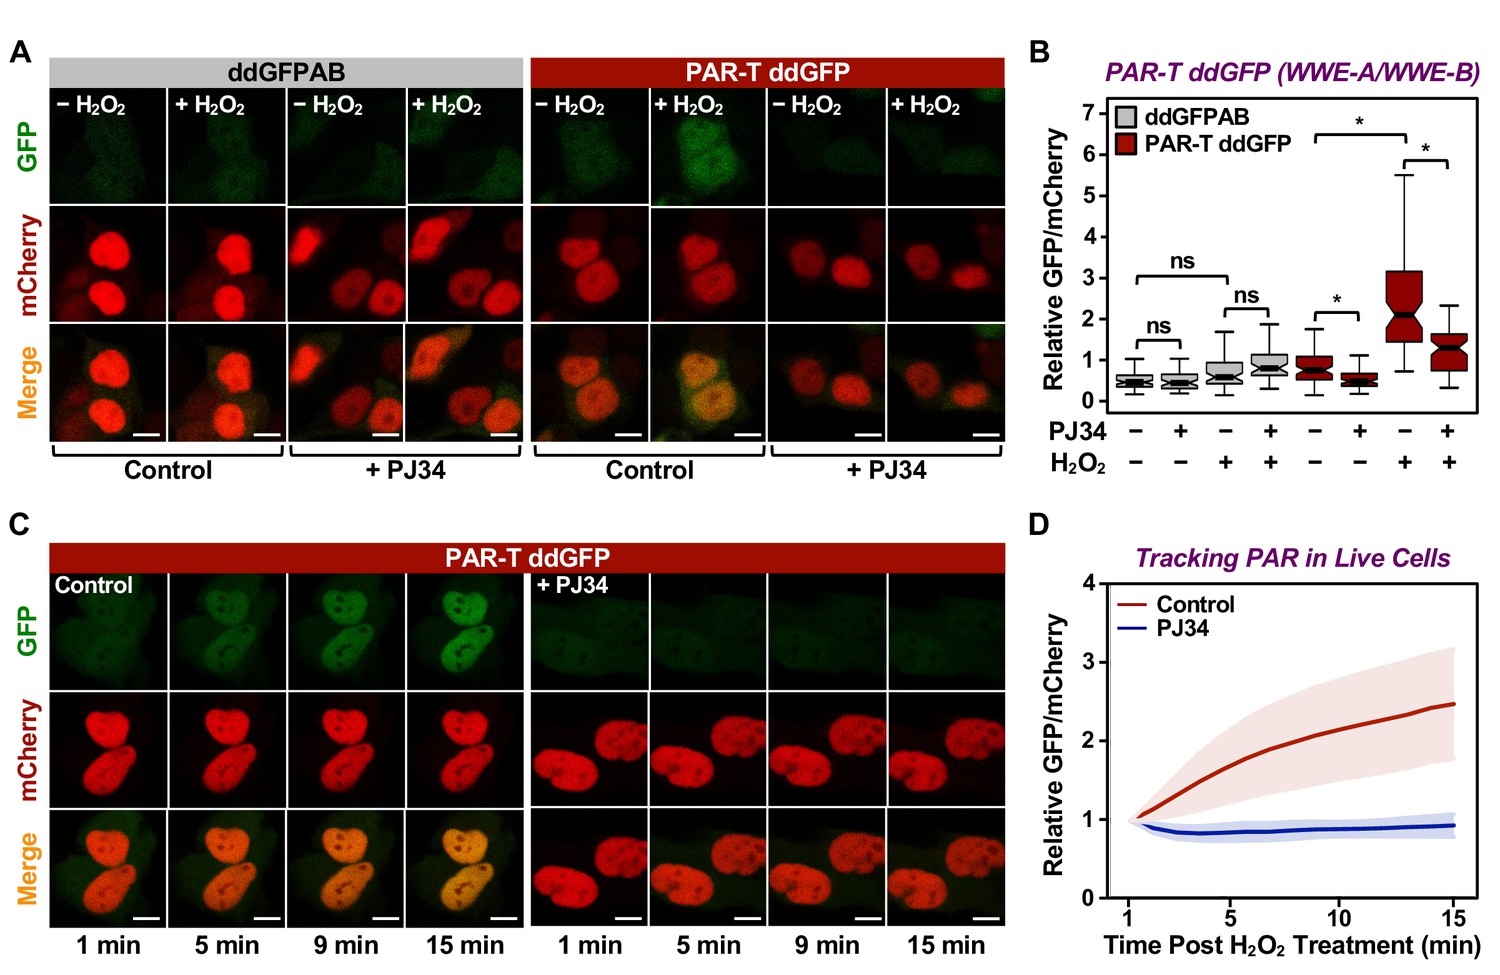
Tracking PAR accumulation in live cells using PAR-T ddGFP.
(A, B) Live-cell imaging assay to track PAR formation in response to H2O2 in 293T cells subjected to Dox-induced PAR-T ddGFP expression. The cells were treated with 20 µM PJ34 for 2 hr prior to treatment with 1 mM H2O2 for 15 min. The scale bar is 10 µm. Each bar in the graph in (B) represents the mean ± SEM of the relative levels of the fluorescence intensity (n=3, one-way ANOVA, *p<0. 01; ns=not significant). (C, D) Live-cell tracking of PAR formation in response to H2O2. HeLa cells subjected to PAR-T ddGFP expression were treated with 20 µM PJ34 for 2 hr prior to treatment with 1 mM H2O2 and live-cell imaging. The scale bar is 10 µm. Each bar in the graph in (D) represents the mean ± SD of the relative levels of the fluorescence intensity (n=20 for control and n=21 for PJ34).
Figure 2—figure supplement 1
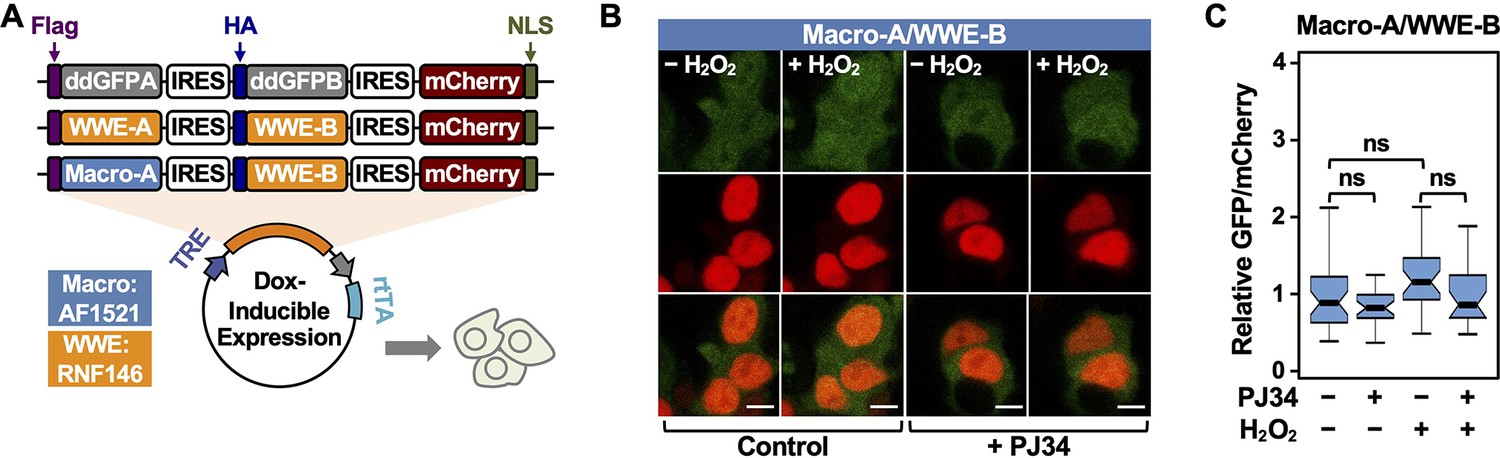
Characterization of fluorescence-based PAR-Trackers using live-cell imaging.
(A) Schematic diagram of plasmid constructs used to express PAR-T ddGFP in mammalian cells. The constructs contain DNA segments encoding (1) Flag (purple) or HA (dark blue) tags to allow detection of the ddGFPA or ddGFPB protein fragments, respectively, (2) ddGFP-conjugated ADP-ribose binding domains, WWE (yellow) or macrodomain (light blue), (3) IRES (white), (4) mCherry (red), and (5) nuclear localization signal (green). (B, C) Live-cell imaging assay to track PAR formation in response to H2O2. 293T cells subjected to Dox-induced expression of the sensors were treated with 20 µM PJ34 for 2 hr prior to H2O2 treatment. (B) Detection by microscopy. The scale bar is 10 µm. (C) Each bar in the graph represents the mean ± SEM of the relative levels of the fluorescence intensities (one-way ANOVA; ns=not significant).
Figure 2—video 1
Tracking the levels of PAR in cells.
Live-cell tracking of PAR formation in response to H2O2. Time course images of the live-cell assay shown in Figure 2C. HeLa cells subjected to PAR-T ddGFP expression were treated with 20 µM PJ34 for 2 hr prior to 15 min of treatment with 1 mM H2O2 and live-cell imaging. The 15-min time course of H2O2 treatment was condensed to the time frame shown in the video (1-min sampling interval, 15 frames total). The scale bar is 5 µm.
Figure 3
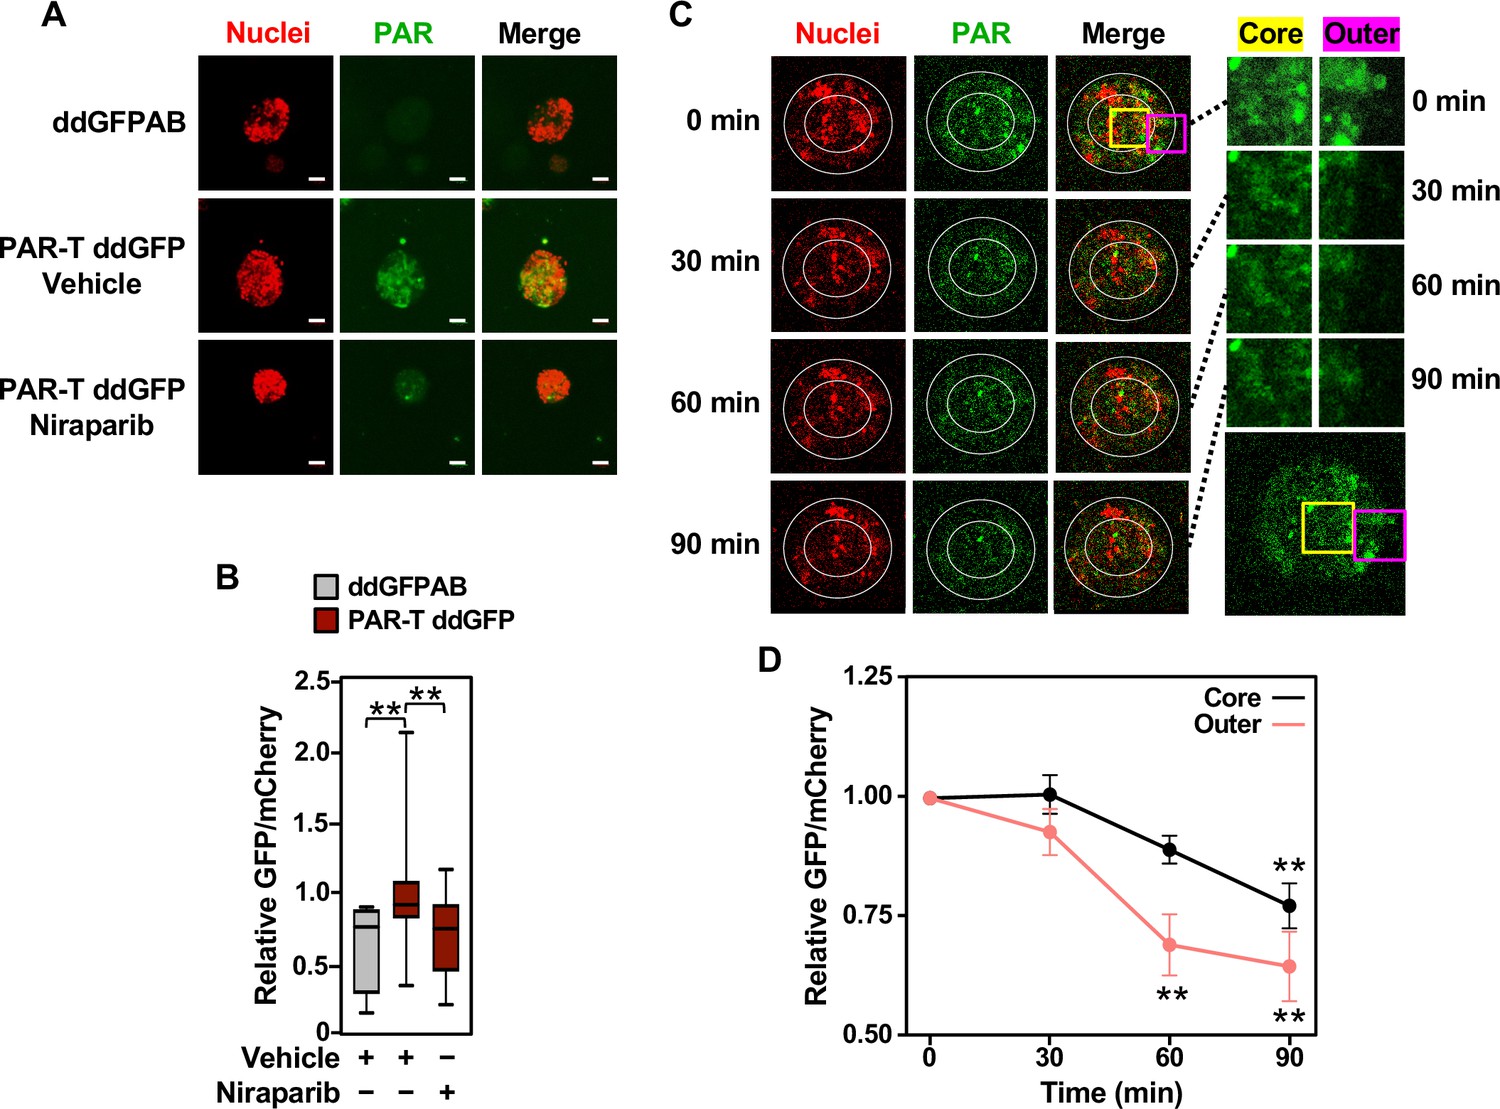
Tracking the spatial accumulation of PAR using PAR-T ddGFP.
(A, B) Representative images and quantitative analysis of Z-projections of cancer spheroids formed using MCF-7 cells subjected to Dox-induced expression of PAR-T ddGFP. The spheroids were treated with 20 µM Niraparib for 24 hr prior to imaging. The scale bar is 50 µm. Each bar in the graph in (B) represents the mean ± SEM of the relative levels of the fluorescence intensity (n=3 biological replicates containing a total of 8 spheroids for the ddGFPAB control and at least 19 spheroids for PAR-T ddGFP, one-way ANOVA, *p<0.05). (C, D) Representative images (C) of Z-projections of cancer spheroids formed using MCF-7 cells subjected to Dox-induced expression of the PAR-T ddGFP. The spheroids were treated with 20 µM Niraparib and live-cell imaging was performed at the indicated times. (Left) The spheroids were divided into ‘outer’ and ‘core’ sections for quantification as indicated by the white circles. (Right) Enlargement of the indicated areas from the left panels (yellow, core; pink, outer) as indicated. Each point in the graph in (D) represents the mean ± SEM of the relative levels of PAR-T ddGFP fluorescence intensity normalized to mCherry (n=5, one-way ANOVA, *p<0.05 and **p<0.01).
Figure 4 with 2 supplements
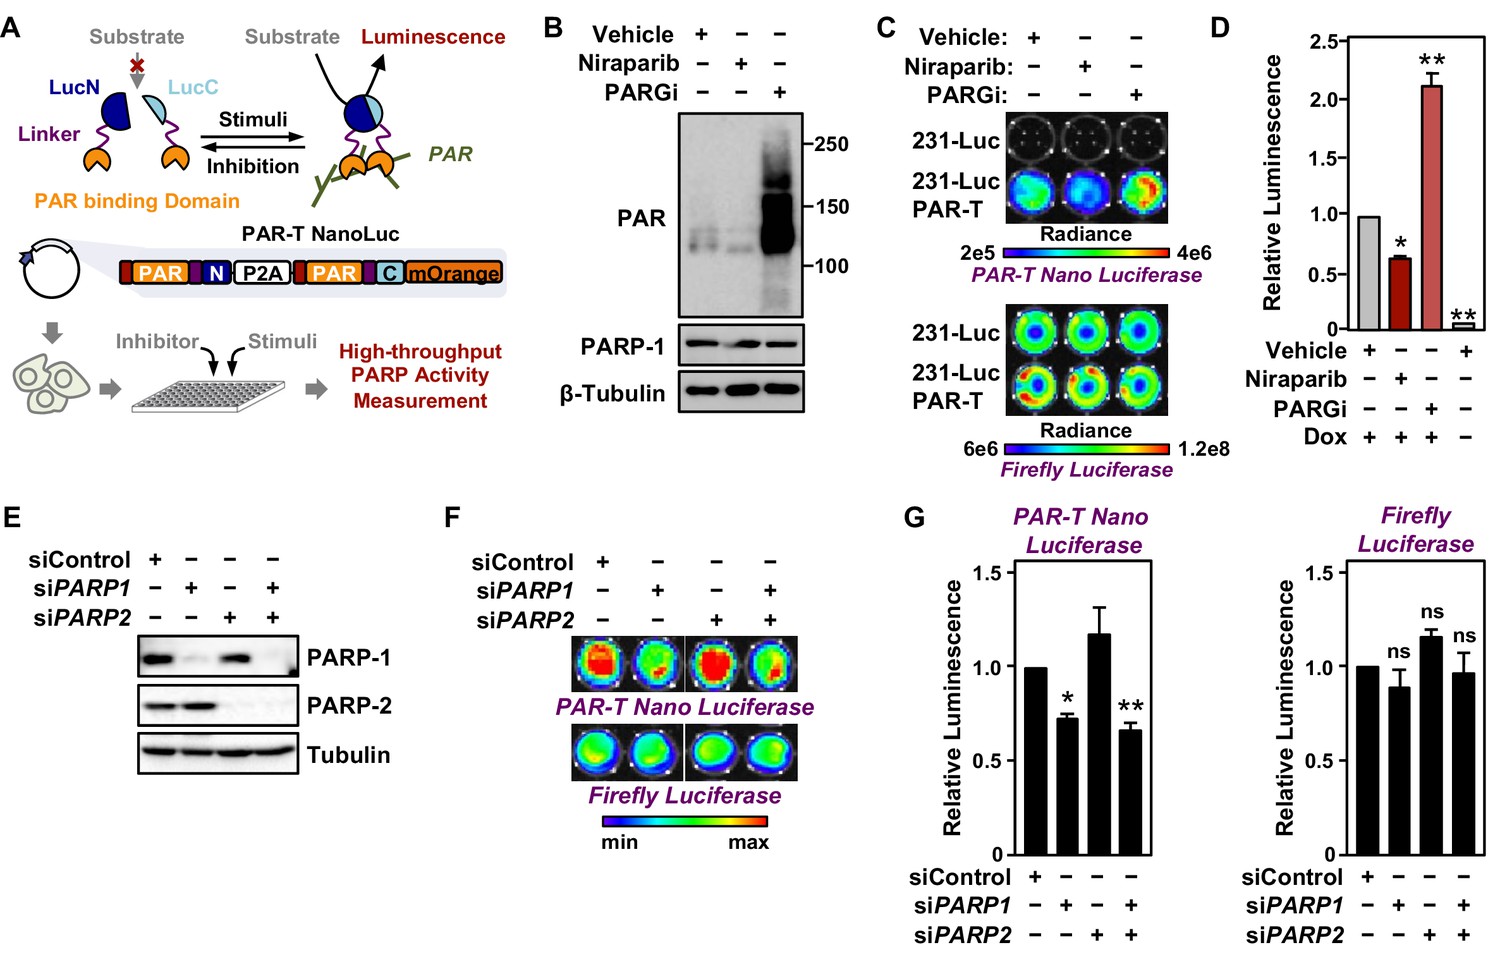
Tracking PAR accumulation in response to PARP or PARG inhibition, or PARP1 or PARP2 knockdown using PAR-T NanoLuc.
(A) Schematic diagram of the plasmid constructs used to express the split Nano luciferase PAR-Tracker (PAR-T NanoLuc) in mammalian cells. The constructs contain DNA segments encoding (1) Flag tag (red), (2) ADP-ribose binding domain (yellow), (3) a flexible linker (purple), and (4) the N-terminal (dark blue) or C-terminal (light blue) fragments of NanoLuc. (B) Western blot analysis of 231-PAR-T NanoLuc cells treated with Niraparib or PARG inhibitor as indicated. (C, D) Bioluminescence imaging (B) of MDA-MB-231-luc cells subjected to Dox-induced expression of PAR-T NanoLuc (231-PAR-T NanoLuc). The cells were treated with 20 µM Niraparib or 20 µM PARG inhibitor (PDD00017273) for 2 hr prior to bioluminescence imaging. Each bar in the graph in (D) represents the mean ± SEM of the relative levels of the ratio of luminescence of NanoLuc to firefly luciferase (n=3, two-way ANOVA, *p<0.01 and **p<0.0001). (E) Western blot analysis of MDA-MB-231-luc cells subjected to siRNA mediated knockdown of PARP1 or PARP2 as indicated. (F, G) Bioluminescence measurement (F) of 231-PAR-T NanoLuc cells subjected to PARP1 or PARP2 knockdown. Each bar in the graph in (G) represents the mean ± SEM of the relative levels of luminescence of NanoLuc (left) or firefly luciferase (right) (n=3, t-test, *p<0.05 and **p<0.01; ns=not significant).
Figure 4—figure supplement 1

Characterization of a luminescence-based PAR-Tracker.
(A) Quantitative bioluminescence imaging of cell extracts isolated from HEK 293T cells subjected to expression of the indicated PAR binding domains conjugated to split firefly luciferase fragments. The cells were treated with 20 µM PJ34 for 2 hr prior to lysis. (B) Western blot analysis of lysates from HEK 293T cells treated with 20 µM Olaparib or 20 µM PARGi. (C) Bioluminescence imaging HEK 293T cells subjected to expression of the indicated split firefly luciferase protein fragments. (D, E) Bioluminescence imaging (D) of HeLa cells subjected to expression of the indicated split firefly luciferase protein fragments. The cells were treated with 20 µM Olaparib or 20 µM PARGi for 2 hr prior to bioluminescence imaging. Each bar in the graph in (E) represents the mean ± SEM of the relative levels of luminescence (n=3, two-way ANOVA, *p<0.01 and **p<0.0001).
Figure 4—figure supplement 2
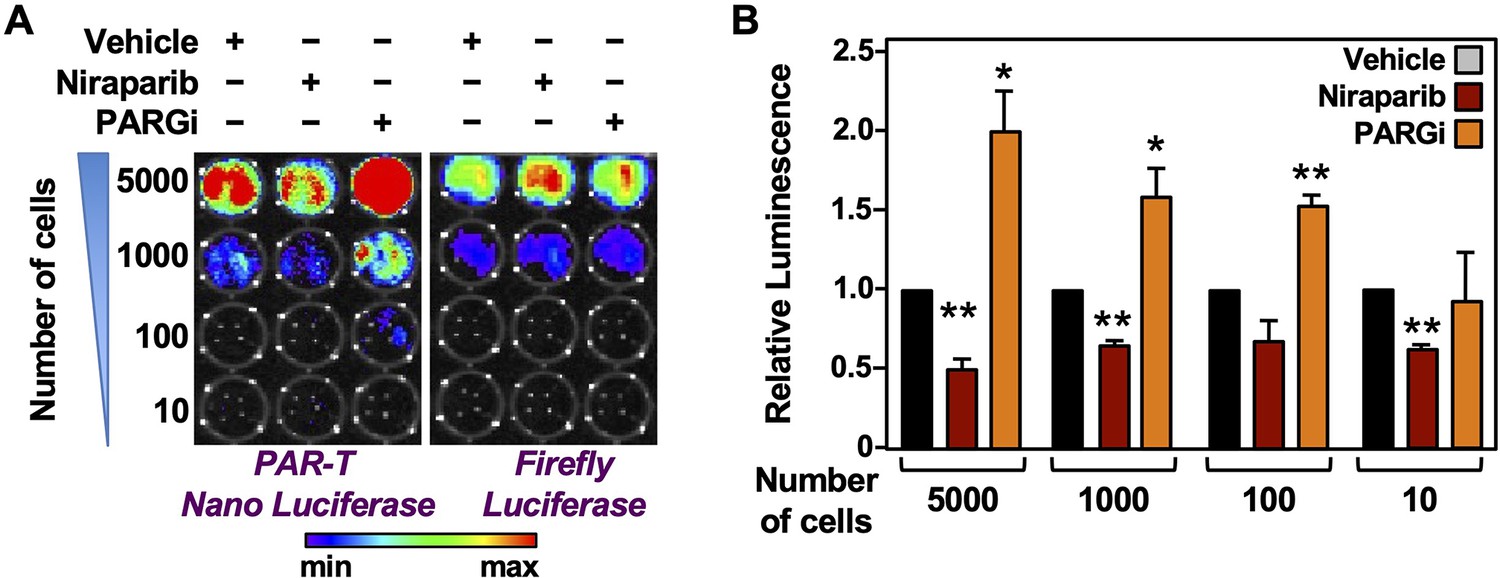
Measuring the levels of PAR in a limited number of cells using PAR-T NanoLuc.
(A and B) Bioluminescence imaging (A) of the indicated number of 231-PAR-T NanoLuc cells. Each bar in the graph in (B) represents the mean ± SEM of the relative levels of the ratio of luminescence of Nano luciferase to firefly luciferase (n = 3, t-test * P < 0.05 and ** P < 0.001).
Figure 5
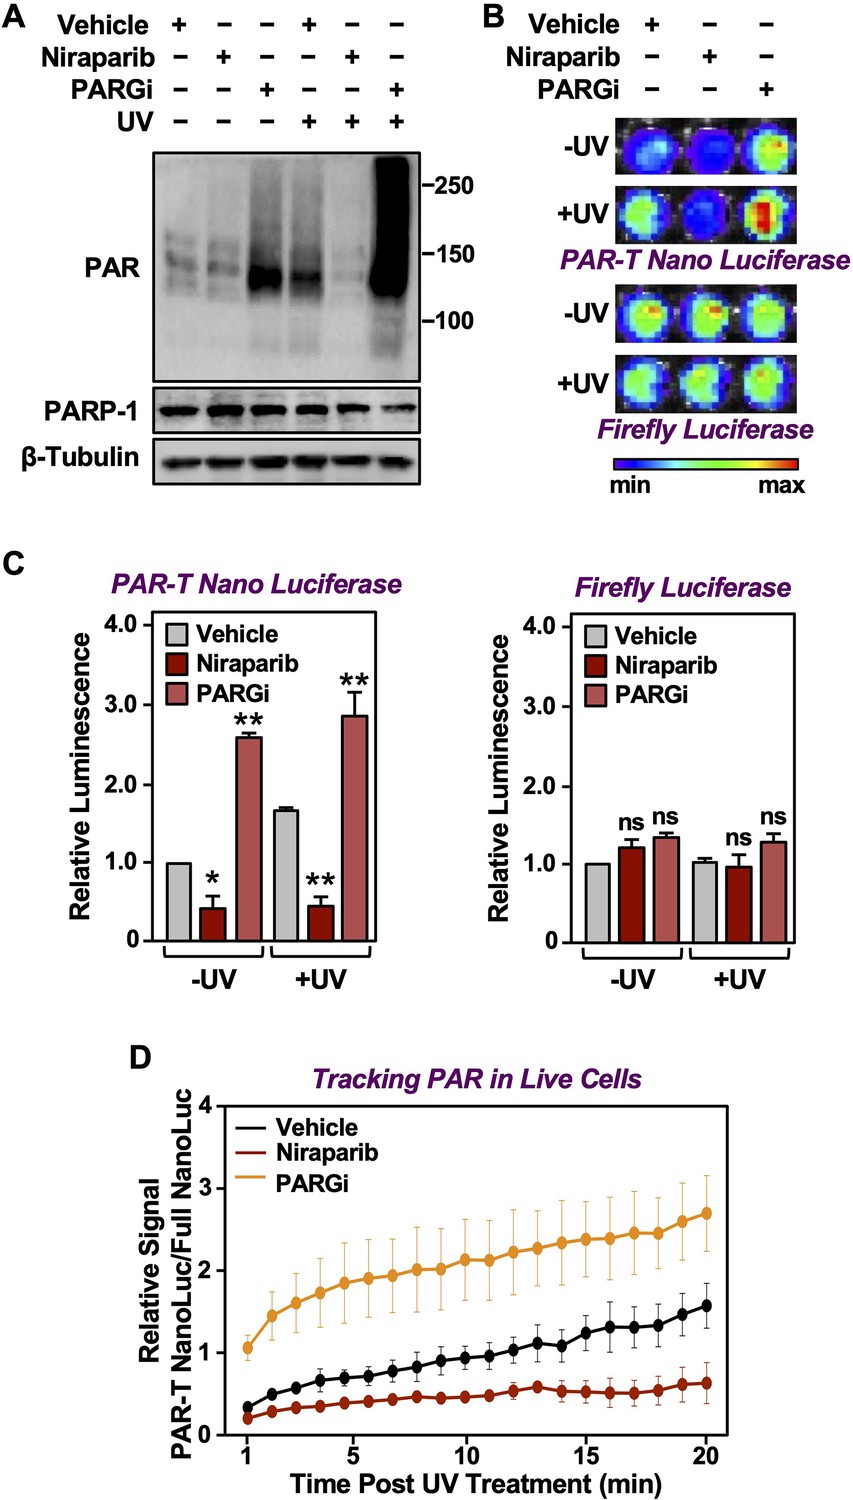
Tracking PAR accumulation in response to UV-induced DNA damage using PAR-T NanoLuc.
(A) Western blot analysis of 231-PAR-T NanoLuc cells treated with Niraparib or PARG inhibitor prior to UV radiation. (B, C) Bioluminescence imaging (B) of 231-PAR-T NanoLuc cells treated with 20 µM Niraparib or 20 µM PARG inhibitor for 2 hr prior to UV radiation. Each bar in the graph in (C) represents the mean ± SEM of the relative levels of luminescence with NanoLuc (left) or firefly luciferase (right) (n=3, one-way ANOVA, *p<0.05, **p<0.001; ns=not significant). (D) Time course of Bioluminescence imaging of 231-PAR-T NanoLuc and 231-Full Nano luciferase cells treated with 20 µM Niraparib or 20 µM PARG inhibitor for 2 hr prior to UV radiation. Each point in the graph represents the mean ± SEM of the relative levels of luminescence from PAR-T NanoLuc normalized to full Nano luciferase (n=3).
Figure 6
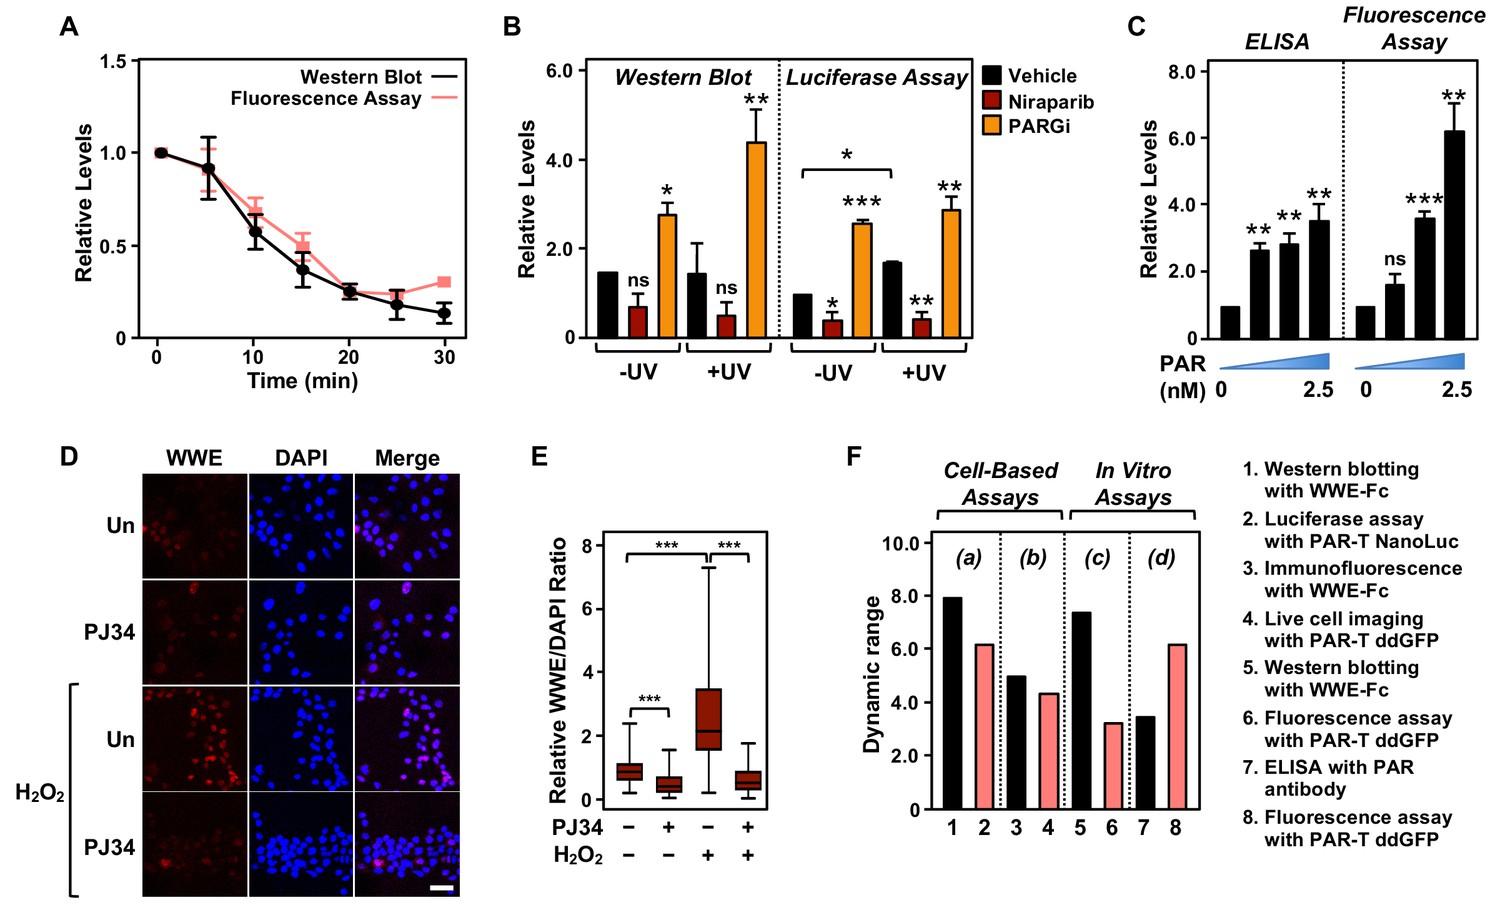
Comparison of assay performance using the PAR-T sensor and conventional PAR detection reagents.
(A) Quantitative analysis of Western blot analysis and fluorescence measurements (shown in Figure 1G) of the time course of in vitro PAR degradation using recombinant ARH3. Each line plot in the graph represents mean ± SEM of relative intensities (n=3). (B) Quantitative analysis of Western blot analysis and bioluminescence imaging (shown in Figure 4B) of 231-PAR-T NanoLuc cells treated with 20 µM Niraparib or 20 µM PARG inhibitor for 2 hr prior to UV radiation. Each bar in the graph represents the mean ± SEM of the relative intensities (n=3, one-way ANOVA, *p<0.05, **p<0.001, and ***p<0.0001; ns=not significant). (C) Measurements of ELISA and fluorescence intensities using 0, 0.625, 1.25, and 2.5 nM concentrations of purified PAR. Each bar in the graph in represents the mean ± SEM of the relative intensities (n=3, paired t-test, *p<0.05, **p<0.01, and ***p<0.001; ns=not significant). (D) Immunofluorescence assay using WWE-Fc to measure PAR formation in response to H2O2 using 293T cells. The cells were treated with 20 µM PJ34 (vs. untreated control, ‘Un’) for 2 hr prior to 15 min of treatment with 1 mM H2O2. The images were collected using a confocal microscope. (E) Quantification of the results in (D). Each bar in the graph represents the mean ± SEM of the relative levels of the fluorescence intensity of PAR normalized to DAPI (n=3 biological replicates with at least 150 cells in total, one-way ANOVA, ***p<0.0001). (F) Representation of the dynamic ranges of PAR-T sensors in comparison to other available PAR detection tools as indicated: (a) Western blotting with WWE-Fc versus live-cell luciferase assay using PAR-T NanoLuc was performed using UV-induced DNA damage in MDA-MB-231 Luc cells (from (B)); (b) Immunofluorescence with WWE-Fc versus live-cell imaging using PAR-T ddGFP was performed using H2O2-mediated PARP-1 activation in 293T cells (from (D)); (c) Western blotting with WWE-Fc versus fluorescence assay with PAR-T ddGFP was performed using ARH3 mediated degradation of PAR in vitro (from (A)); (d) ELISA versus fluorescence assay with PAR-T ddGFP was performed using immobilized PAR (from (C)).
Figure 7
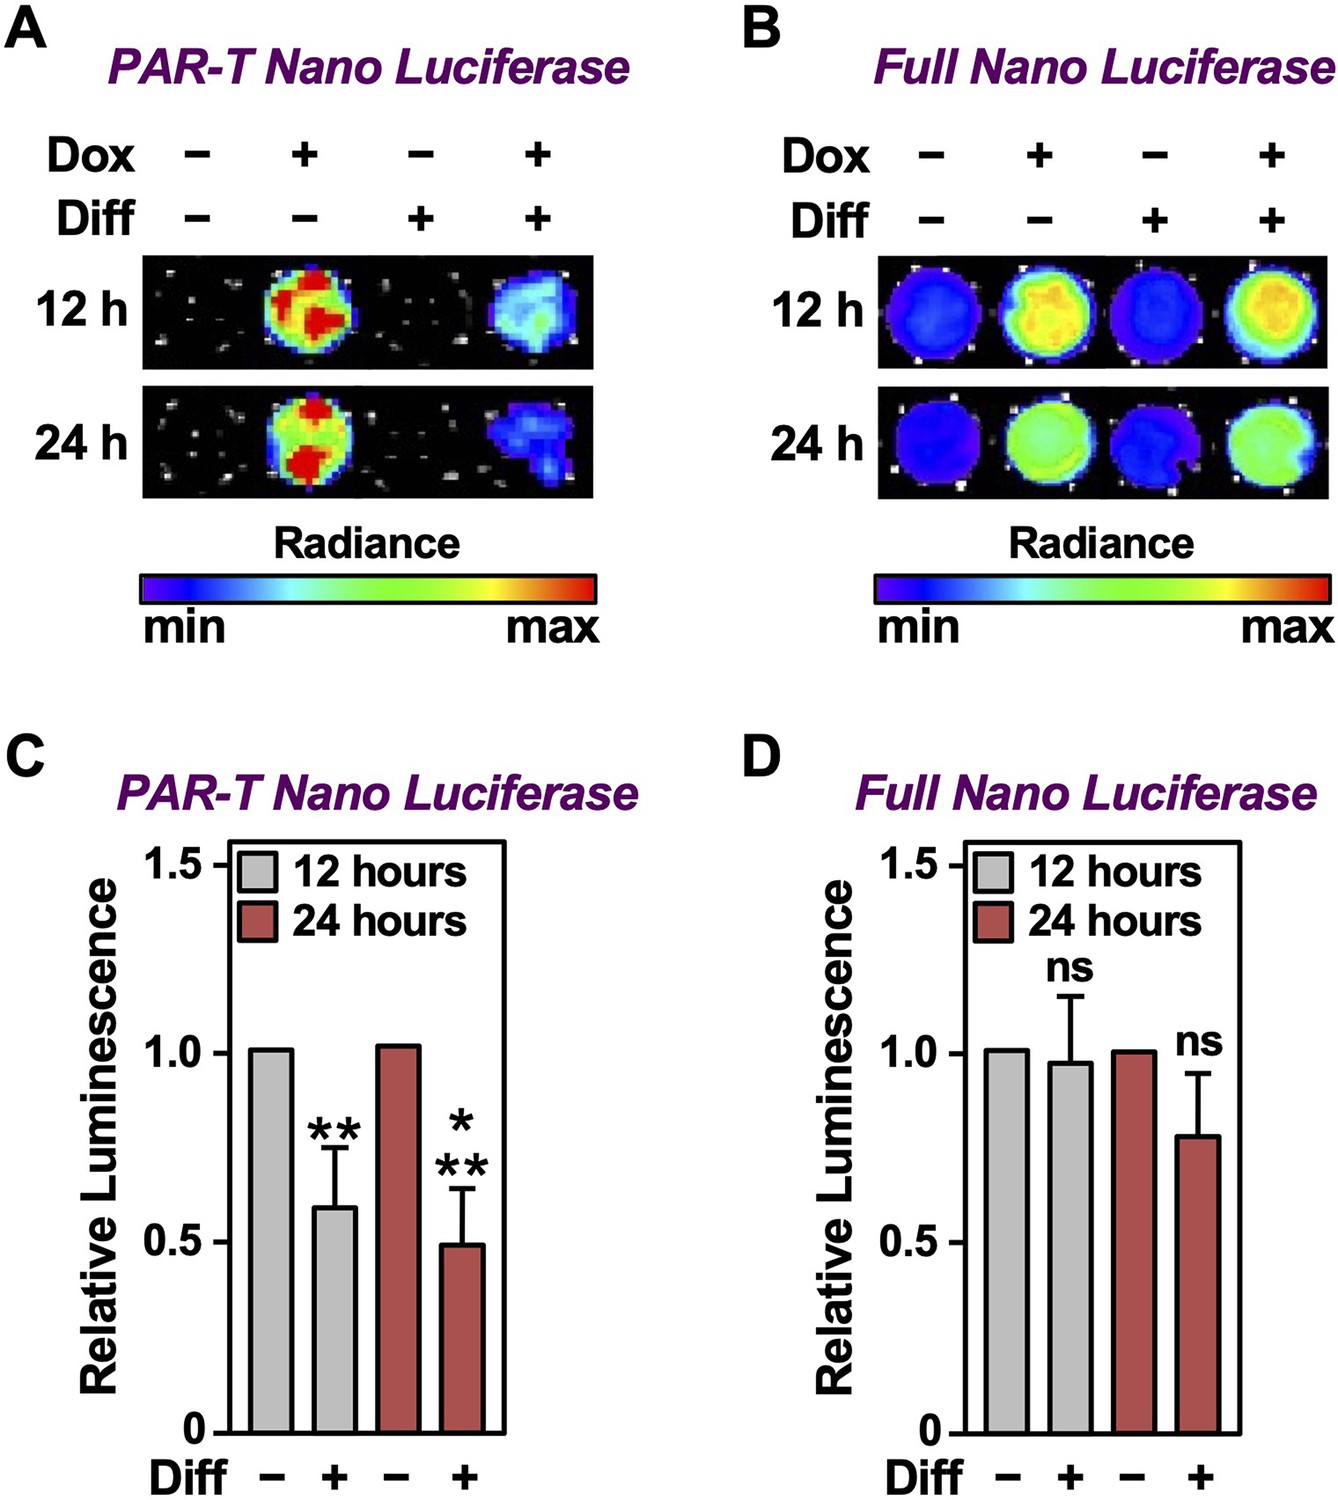
Tracking the levels of PAR during adipogenesis.
(A, B) Bioluminescence imaging of PAR-T NanoLuc (A) and unsplit NanoLuc (B) in 3T3-L1 cells subjected to adipogenic differentiation for 12 or 24 hr. (C, D) Quantification of signals from PAR-T NanoLuc (C) and unsplit NanoLuc (D) during adipogenesis. Each bar in the graph represents the mean ± SEM of the relative levels of the luminescence of NanoLuc (n=4; t-test, **p<0.01 and ***p<0.001). Comparisons between experimental conditions with the intact NanoLuc are not statistically significant (ns).
Figure 8 with 1 supplement

Measuring the levels of PAR in tissues in living animals using PAR-T NanoLuc.
(A) Schematic diagram of the in vivo studies performed using 231-PAR-T NanoLuc cells. (B, C) Bioluminescence imaging (B) of xenograft tumors formed using 231-PAR-T NanoLuc cells. The tumors were subjected to 5 Gy IR radiation and treatment with PARP inhibitor (Niraparib) or PARG inhibitor as indicated prior to BLI imaging. Each bar in the graph in (C) represents the mean ± SEM of the relative levels of the ratio of luminescence of NanoLuc to firefly luciferase (n=6 for the vehicle and PARG inhibitor treatment cohorts and n=7 for the Niraparib treatment cohort; t-test, *p<0.05 and **p<0.01).
Figure 8—figure supplement 1
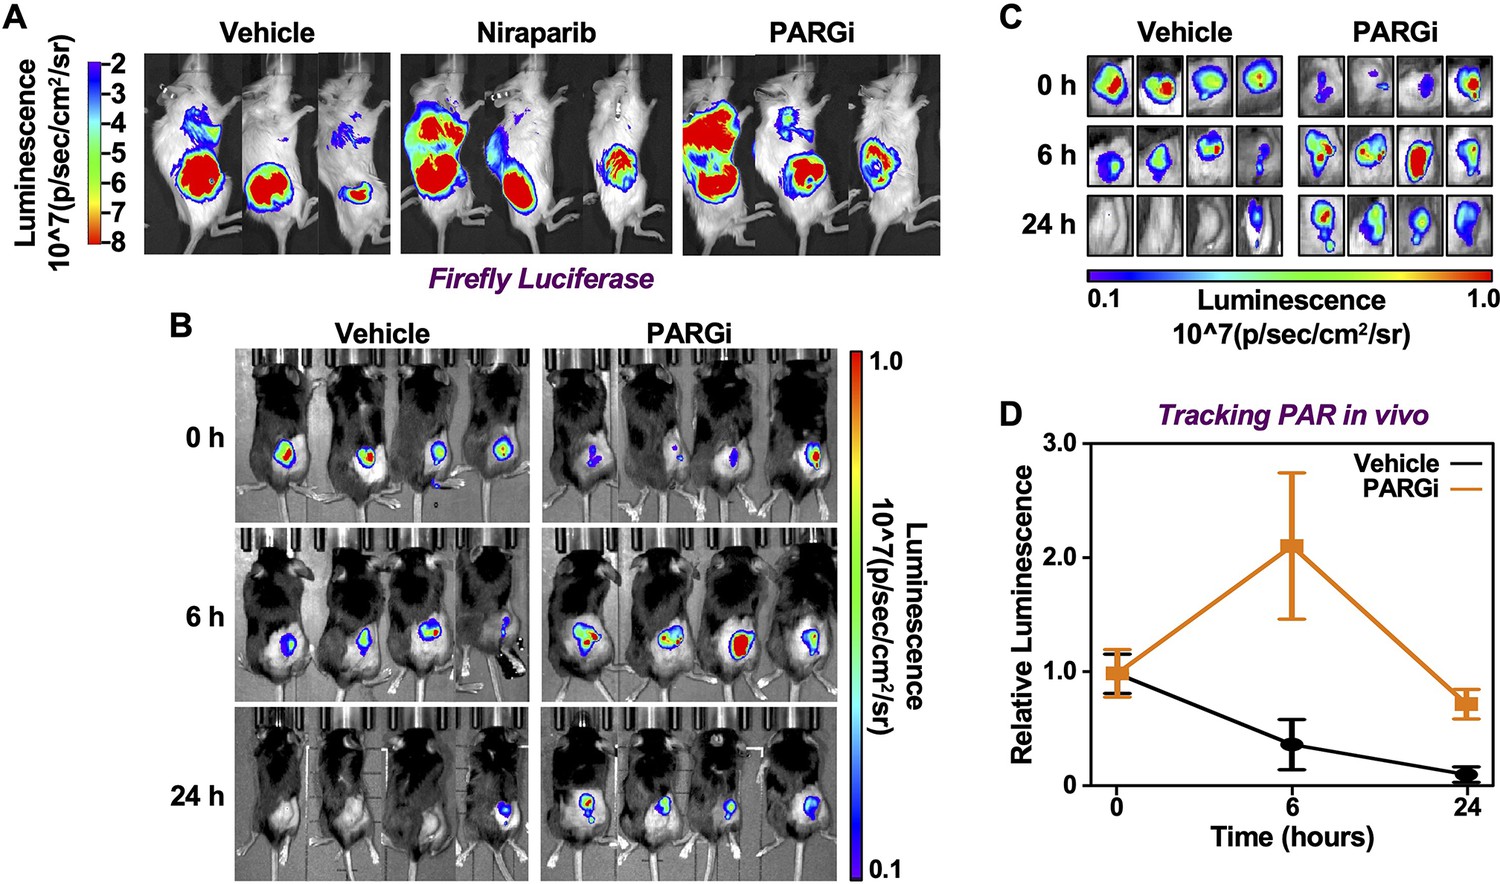
Tracking the levels of PAR in tissues in living animals using PAR-T NanoLuc.
(A) Bioluminescence imaging of firefly luciferase of tumors formed using 231-PAR-T NanoLuc cells as shown in Figure 8B. (B–D) Time course of Bioluminescence imaging of 231-PAR-T NanoLuc cells transplanted into mice and treated with PARG inhibitor. Bioluminescence imaging (B) with the region of interest expanded (C). Each point in the graph in (D) represents the mean ± SEM of the relative levels of luminescence of NanoLuc of PAR-T NanoLuc (n=4).
Tables
Table 1
Nomenclature, composition, and activity of the various PAR-T sensors used in this study.
A summary of the PAR-Tracker sensors generated in this study. The activity of these sensors in vitro and in cells, and the corresponding figures in which the activities are described, are indicated. The activities are described as low (+), medium (++), and high (+++, ++++). N.D. not determined.
| Nomenclature used in the manuscript | ARBDs used with fluorescent or luminescent protein fragments | Activity in vitro | Activity in cells | Figures | |
|---|---|---|---|---|---|
| Fluorescent sensors | ddGFP-A | ddGFP-B | |||
| PAR-T ddGFP | WWE from RNF146 | WWE from RNF146 | +++ | ++++ | Figure 1—figure supplement 1D, E |
| Macrodomain from AF1521 | Macrodomain from AF1521 | ++ | N.D. | Figure 1—figure supplement 1D, E | |
| PBZ from APLF | PBZ from APLF | + | N.D. | Figure 1—figure supplement 1D, E | |
| Macrodomain from MH2A.1 | Macrodomain from MH2A.1 | + | N.D. | Figure 1—figure supplement 1D, E | |
| WWE from RNF146 | Macrodomain from AF1521 | +++ | N.D. | Figure 1—figure supplement 1D, E | |
| Macrodomain from AF1521 | WWE from RNF146 | ++++ | – | Figure 1—figure supplement 1D, E | |
| Firefly luciferase-based sensors | N-terminal of Firefly luciferase (FLucN) | C-terminal of Firefly luciferase (FLucC) | |||
| PAR-T fLuc | WWE from RNF146 | WWE from RNF146 | N.D. | + | Figure 4—figure supplement 1C |
| Macrodomain from AF1521 | Macrodomain from AF1521 | N.D. | – | Figure 4—figure supplement 1C | |
| WWE from RNF146 | Macrodomain from AF1521 | N.D. | – | Figure 4—figure supplement 1C | |
| Macrodomain from AF1521 | WWE from RNF146 | N.D. | – | Figure 4—figure supplement 1C | |
| Nano luciferase-based sensors | N-terminal of Nano luciferase (NanoLucN) | C-terminal of Nano luciferase plus LssmOrange (NanoLucC) | |||
| PAR-T NanoLuc | WWE from RNF146 | WWE from RNF146 | N.D. | ++++ | Figure 4C |
Key resources table
| Reagent type (species) or resource | Designation | Source or reference | Identifiers | Additional information |
|---|---|---|---|---|
| Strain, strain background (Escherichia coli) | BL21(DE3-pLysis) | Thermo Fisher Scientific | Cat. no. C606010 | |
| Cell line (Homo sapiens) | MCF-7 (female adult breast cancer) | ATCC | RRID:CVCL_0031 | |
| Cell line (H. sapiens) | 3T3-L1 (male adult preadipocyte) | ATCC | RRID:CVCL_0123 | |
| Cell line (H. sapiens) | HeLa (female adult cervical cancer) | ATCC | RRID:CVCL_0030 | |
| Cell line (H. sapiens) | MDA-MB-231 Luc (female adult breast cancer) | Obtained from Dr. Srinivas Malladi, UT Southwestern | ||
| Cell line (H. sapiens) | HEK 293T (normal embryonic kidney) | ATCC | RRID:CVCL_0063 | |
| Transfected construct (H. sapiens) | PARP1 siRNA | Sigma-Aldrich | Cat. no. SASI_Hs01_0033277 | |
| Transfected construct (H. sapiens) | PARP2 siRNA | Sigma-Aldrich | Cat. no. SASI_Hs01_0013-1488 | |
| Antibody | Anti-poly-ADP-ribose binding reagent (rabbit monoclonal; IgG Fc) | MilliporeGibson et al., 2017 | Cat. no. MABE1013 | WB (5 µg/ml)IF (1:500) |
| Antibody | PARP-1 (rabbit polyclonal) | Active Motif | Cat. no. 39559 | WB (1:1000) |
| Antibody | β-tubulin (rabbit polyclonal) | Abcam | Cat. no. ab6046RRID: AB_2210370 | WB (1:1000) |
| Antibody | HRP-conjugated anti-rabbit IgG (goat polyclonal) | Pierce | Cat. no. 31460RRID: AB_228341 | WB (1:5000) |
| Antibody | Alexa Fluor 594-conjugated anti-rabbit IgG (donkey polyclonal) | Thermo Fisher Scientific | Cat. no. A-21207RRID: AB_141637 | IF (1:500) |
| Commercial assay or kit | Nano-Glo Live Cell Assay System | Promega | Cat. no. N2011 | |
| Commercial assay or kit | Nano-Glo Luciferase Assay System | Promega | Cat. no. N1110 | |
| Commercial assay or kit | Luciferase Assay System | Promega | Cat. no. E1500 | |
| Commercial assay or kit | PAR ELISA Kit | Cell Biolabs | Cat. no. XDN-5114 | |
| Chemical compound, drug | PJ34 | Enzo | Cat. no. ALX-270 | In cells (20 µM) |
| Chemical compound, drug | Niraparib | MedChem Express | Cat. no. HY-10619 | In cells (20 µM)In vivo (25 mg/kg body weight) |
| Chemical compound, drug | PDD00017273 | MedChem Express | Cat. no. HY-108360 | In cells (20 µM)In vivo (25 mg/kg body weight) |
Additional files
Download links
A two-part list of links to download the article, or parts of the article, in various formats.
Downloads (link to download the article as PDF)
Open citations (links to open the citations from this article in various online reference manager services)
Cite this article (links to download the citations from this article in formats compatible with various reference manager tools)
Development and characterization of new tools for detecting poly(ADP-ribose) in vitro and in vivo
eLife 11:e72464.
https://doi.org/10.7554/eLife.72464


