The pupillary light response as a physiological index of aphantasia, sensory and phenomenological imagery strength
- School of Psychology, University of New South Wales, Australia
- School of Psychological Sciences, Macquarie University, Australia
- Sorbonne Université, Institut du Cerveau - Paris Brain Institute - ICM, Inserm, CNRS, France
Figures
Figure 1 with 3 supplements
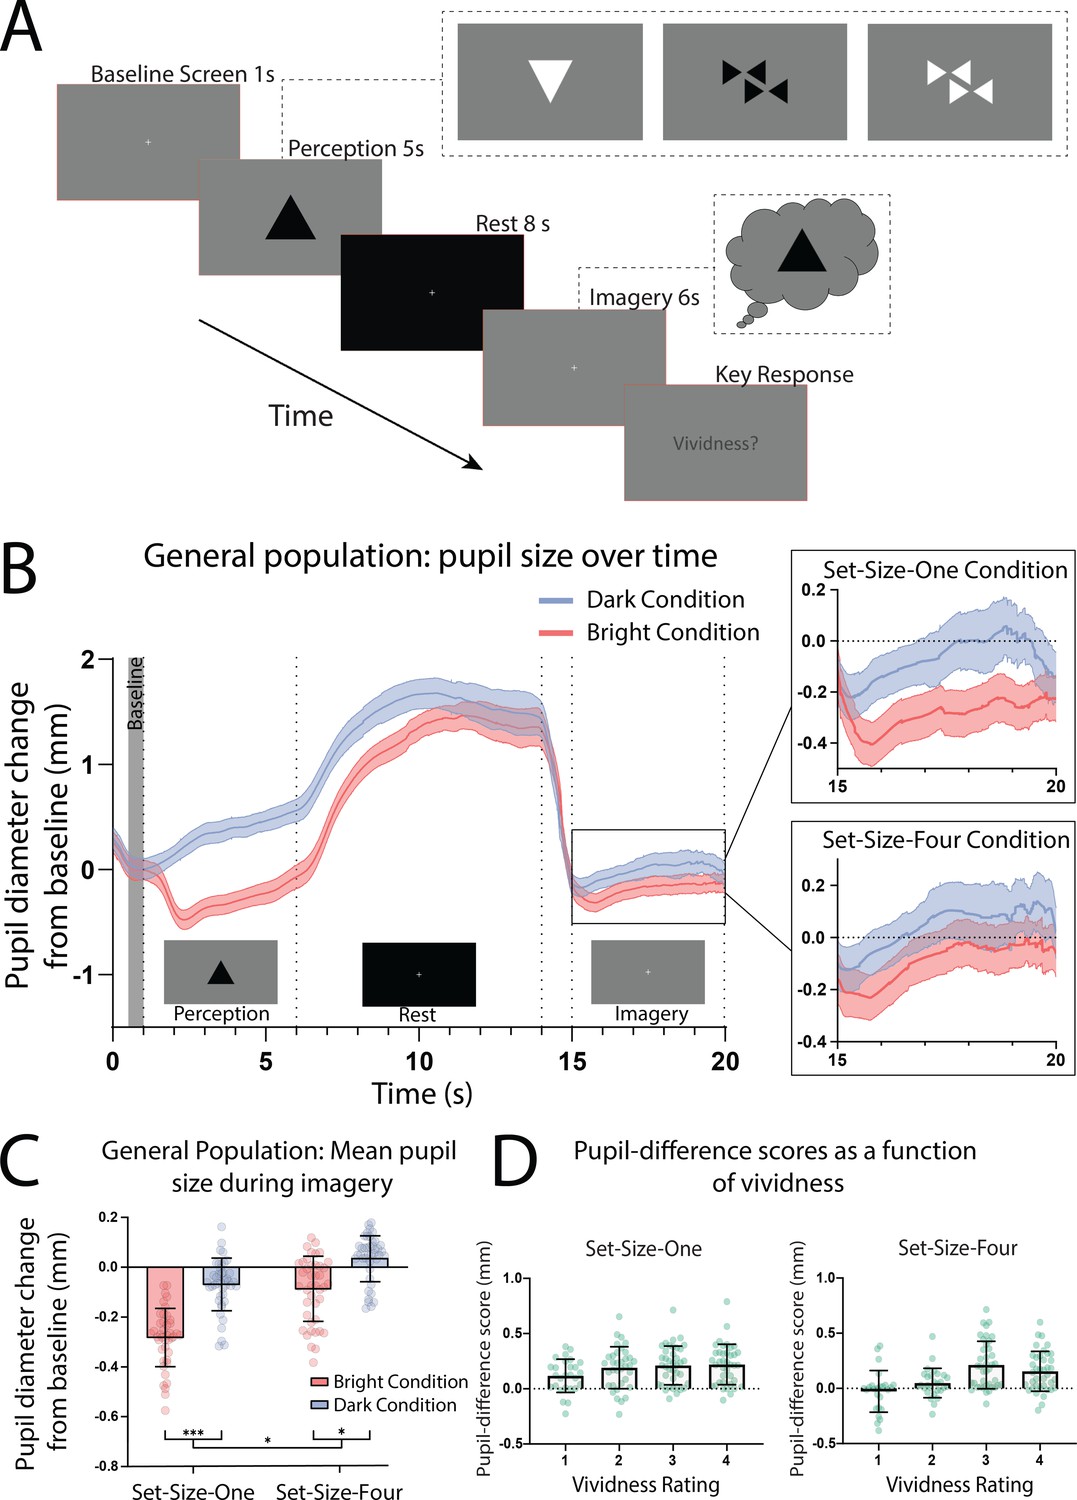
Pupillary response task schematic and eye-tracker results for the general population.
(A) Pupillometry imagery experiment timeline. Each trial began with the presentation of a white fixation cross at the centre of a grey screen (baseline screen) for 1 s. An image was then presented at the centre of this grey screen for 5 s (either one or four triangles of varying brightness, see Figure 1—figure supplement 1 for illustrations of all stimuli). Participants were instructed to focus on the stimuli during this time and memorize its size, orientation, and level of brightness. Next, a black screen with a white fixation cross was presented for 8 s, allowing the perceived after-image to completely fade and pupils to dilate back to equivalent resting levels. The grey baseline screen was then presented again for 6 s. During this time, participants were cued (via two auditory beeps) to actively start imagining the stimuli observed previously during that trial, while maintaining focus on the fixation cross. These beeps were presented 1 s into the grey screen period leaving 5 s of imagery time. Lastly, participants were prompted to report the vividness of their imagery during those previous 5 s on a scale of 1–4 (1 being ‘not vivid at all – no shape appeared in imagery’; 4 being ‘very vivid – almost like seeing it’) via key response. (B) Mean pupil size waveforms for the general population, presented as mm change from baseline. Left panel: data averaged across the course of a trial for Bright (red lines) and Dark (blue lines) conditions for the general population. Right panels: Set-Size-One and Set-Size-Four conditions are shown separately during the imagery period (i.e. pupil size from seconds 15 to 20). Shaded error bands represent the standard error of the mean (± standard error of the mean [SEM]). (C) Mean pupil size change from baseline during imagery (i.e. averaged from seconds 15 to 20 of trials) of Bright (red bars) and Dark stimuli (blue bars). (D) Pupil-difference scores (difference in pupil size during imagery between bright and dark conditions) as a function of subjective vividness ratings for Set-Size-One and Set-Size-Four conditions. Data points represent one participant. Error bars indicate ± SEM, calculated across participants. *p < 0.05, ***p < 0.0001.
-
Figure 1—source code 1
r Code for LME analysis of vividness ratings.
Source code file 1 provides the r code for the LME used to analyse the vividness data in Figure 1D.
- https://cdn.elifesciences.org/articles/72484/elife-72484-fig1-code1-v2.zip
-
Figure 1—source data 1
Source data for Figure 1C.
- https://cdn.elifesciences.org/articles/72484/elife-72484-fig1-data1-v2.csv
-
Figure 1—source data 2
Source data for Figure 1D.
- https://cdn.elifesciences.org/articles/72484/elife-72484-fig1-data2-v2.csv
Figure 1—figure supplement 1
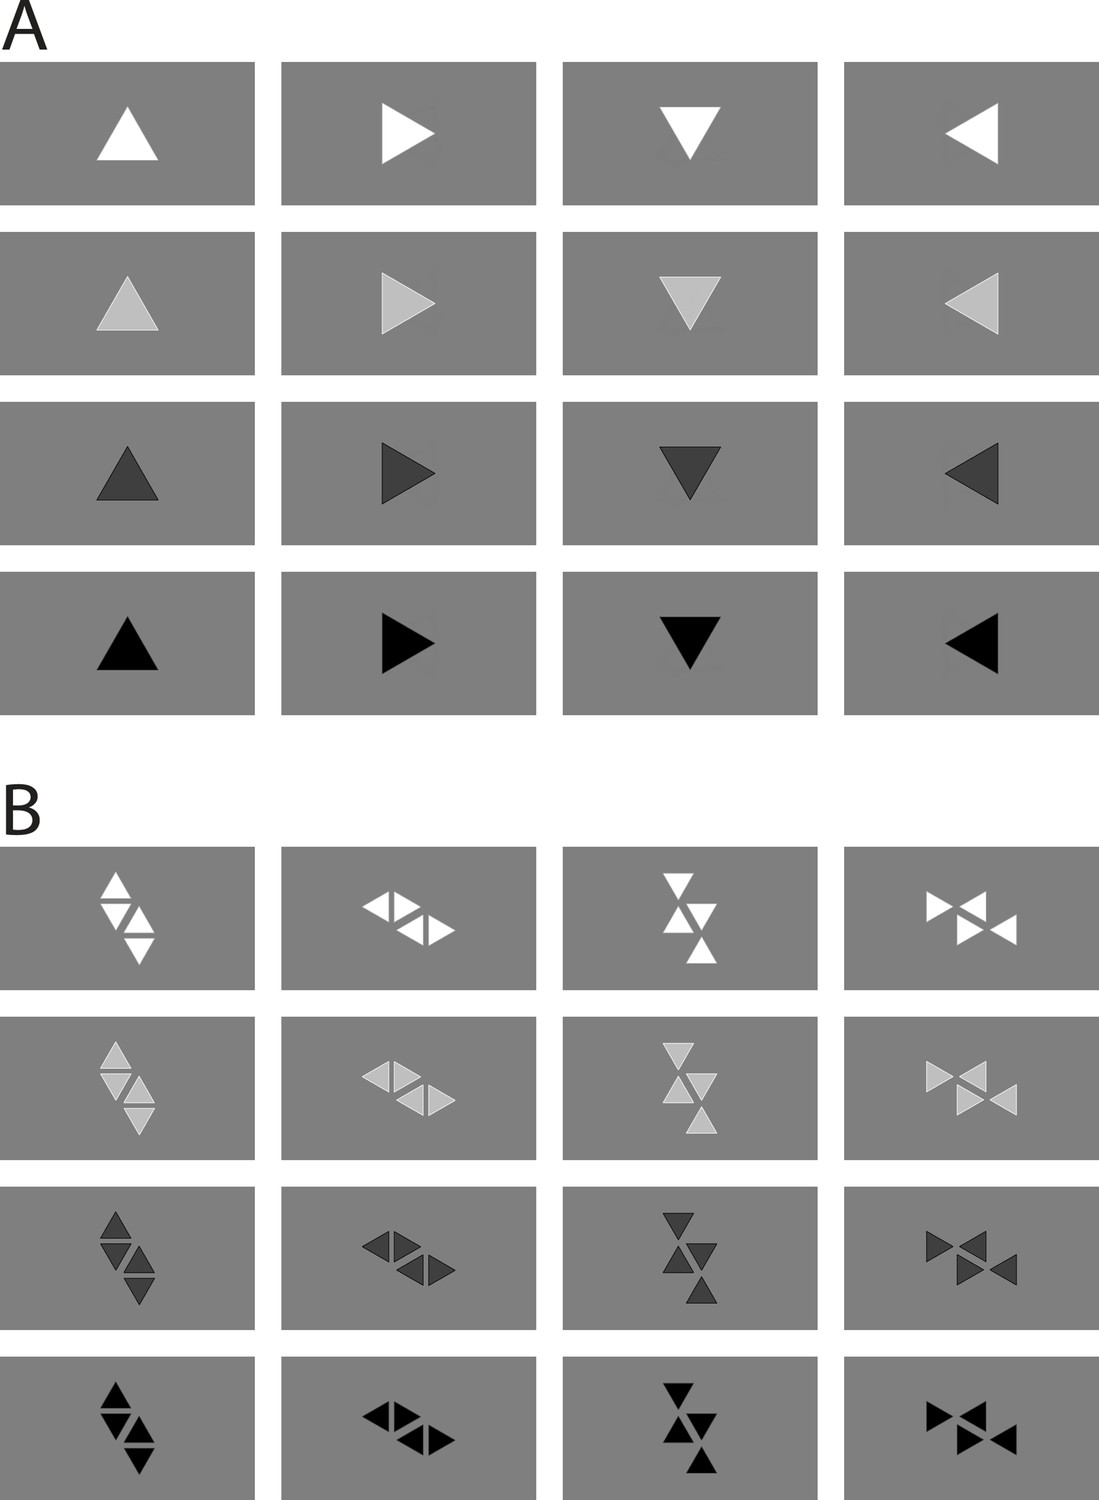
Stimuli used in the experiment.
(A) Illustrations of all Set-Size-One stimuli used in the pupillary response task. (B) Illustrations of all Set-Size-Four stimuli used in the pupillary response task.
Figure 1—figure supplement 2
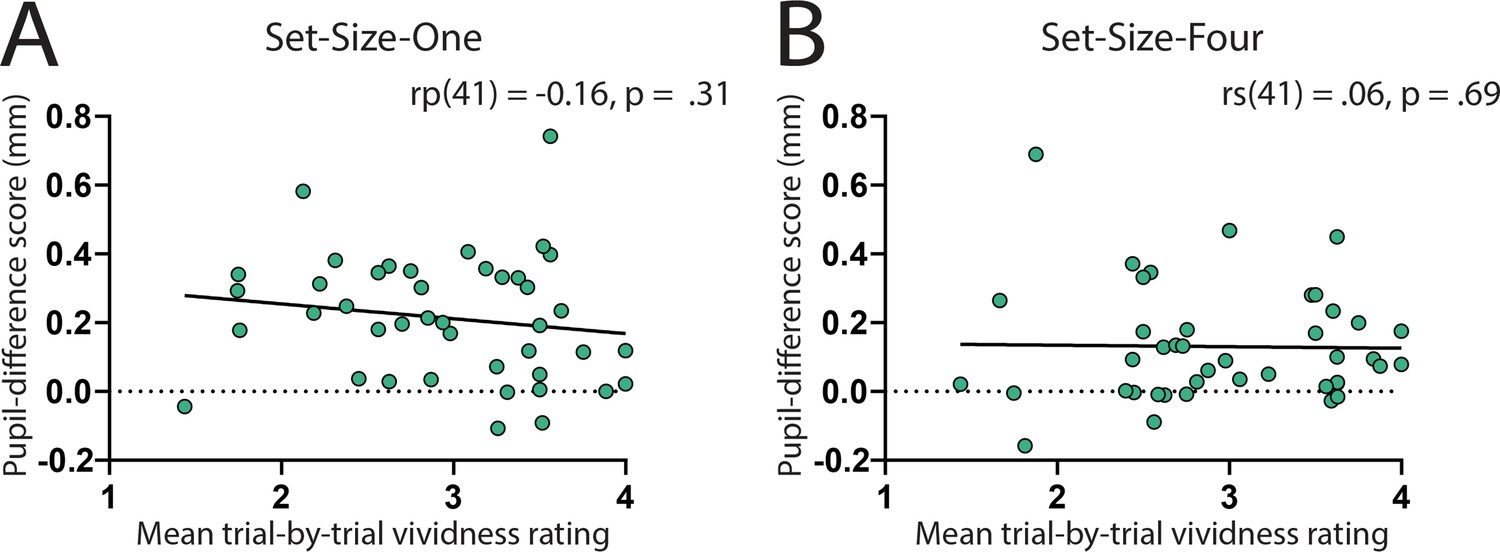
Correlations between pupil-difference scores and mean trial vividness.
Correlation between visual imagery strength, as measured by the pupillary reflex task (pupil-difference score: difference between bright and dark conditions) and visual imagery strength as measured by mean trial-by-trial vividness ratings. (A) For Set-Size-One there was no significant correlation between these two variables, rp(41) = −0.16, p = 0.31. (B) Due to the Set-Size-Four data set violating normality, Spearman’s correlational coefficient was used to analyse the relationship between Set-Size-Four pupil-difference scores and vividness ratings, with no significant correlation observed, rs(41) = 0.06, p = 0.69. Scatterplots show the general population (green circles and black trendline) data only. All data points represent one participant.
Figure 1—figure supplement 3

Correlations between pupil-difference scores and Vividness of Visual Imagery Questionnaire (VVIQ).
Correlation between visual imagery strength, as measured by the pupillary reflex task (pupil-difference score: difference between bright and dark conditions) and visual imagery strength as measured by the VVIQ. (A) Set-Size-One shows there was no significant correlation between difference scores and the VVIQ rp(41) = 0.02, p = 0.88. (B) For Set-Size-Four Spearman’s correlational coefficient indicated no significant correlation between Set-Size-Four difference scores and mean vividness ratings, rs(41) = 0.20, p = 0.19. Scatterplots show the general population (green circles and black trendline) data only. All data points represent one participant.
Figure 2 with 8 supplements
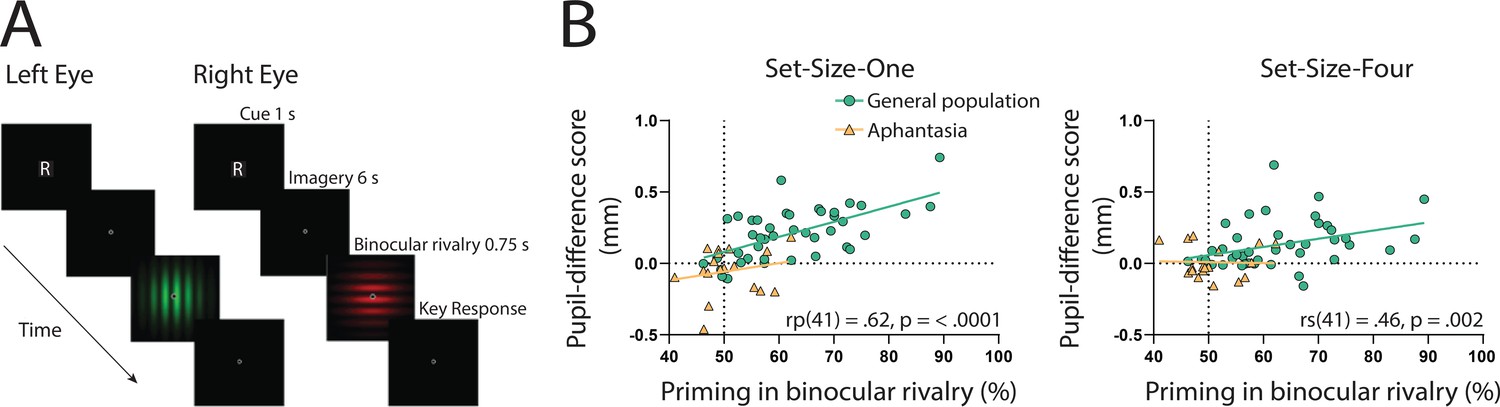
Binocular rivalry task schematic and correlational results.
(A) Example of an imagery trial for the binocular rivalry paradigm. Participants were cued to imagine either a red or green Gabor pattern prior to binocular rivalry with the letter ‘R’ or ‘G’ (750 ms). Participants then imagined the image for 6 s, after which they were presented with the binocular rivalry display (750 ms) and were asked to indicate which image was dominant. Trials where participants reported seeing the pattern they were cued to imagine as dominant were denoted as ‘primed’ trials. The number of primed trials divided by the total number of trials (excluding mock trials and mixed percepts) was used to calculate a percent primed score for each participant. (B) Correlation between visual imagery strength, as measured by the pupillary response task (pupil-difference score: difference between bright and dark conditions) and visual imagery strength as measured by the binocular rivalry task. Set-Size-One (left) and Set-Size-Four (right) conditions are shown. Scatterplots show the general population (green circles and green trendline) and aphantasic individuals (yellow triangles and yellow trendline) data. Correlation coefficients refer to the general population only (green trendline). All data points represent one participant.
-
Figure 2—source data 1
Source date for Figure 2B.
- https://cdn.elifesciences.org/articles/72484/elife-72484-fig2-data1-v2.csv
Figure 2—figure supplement 1
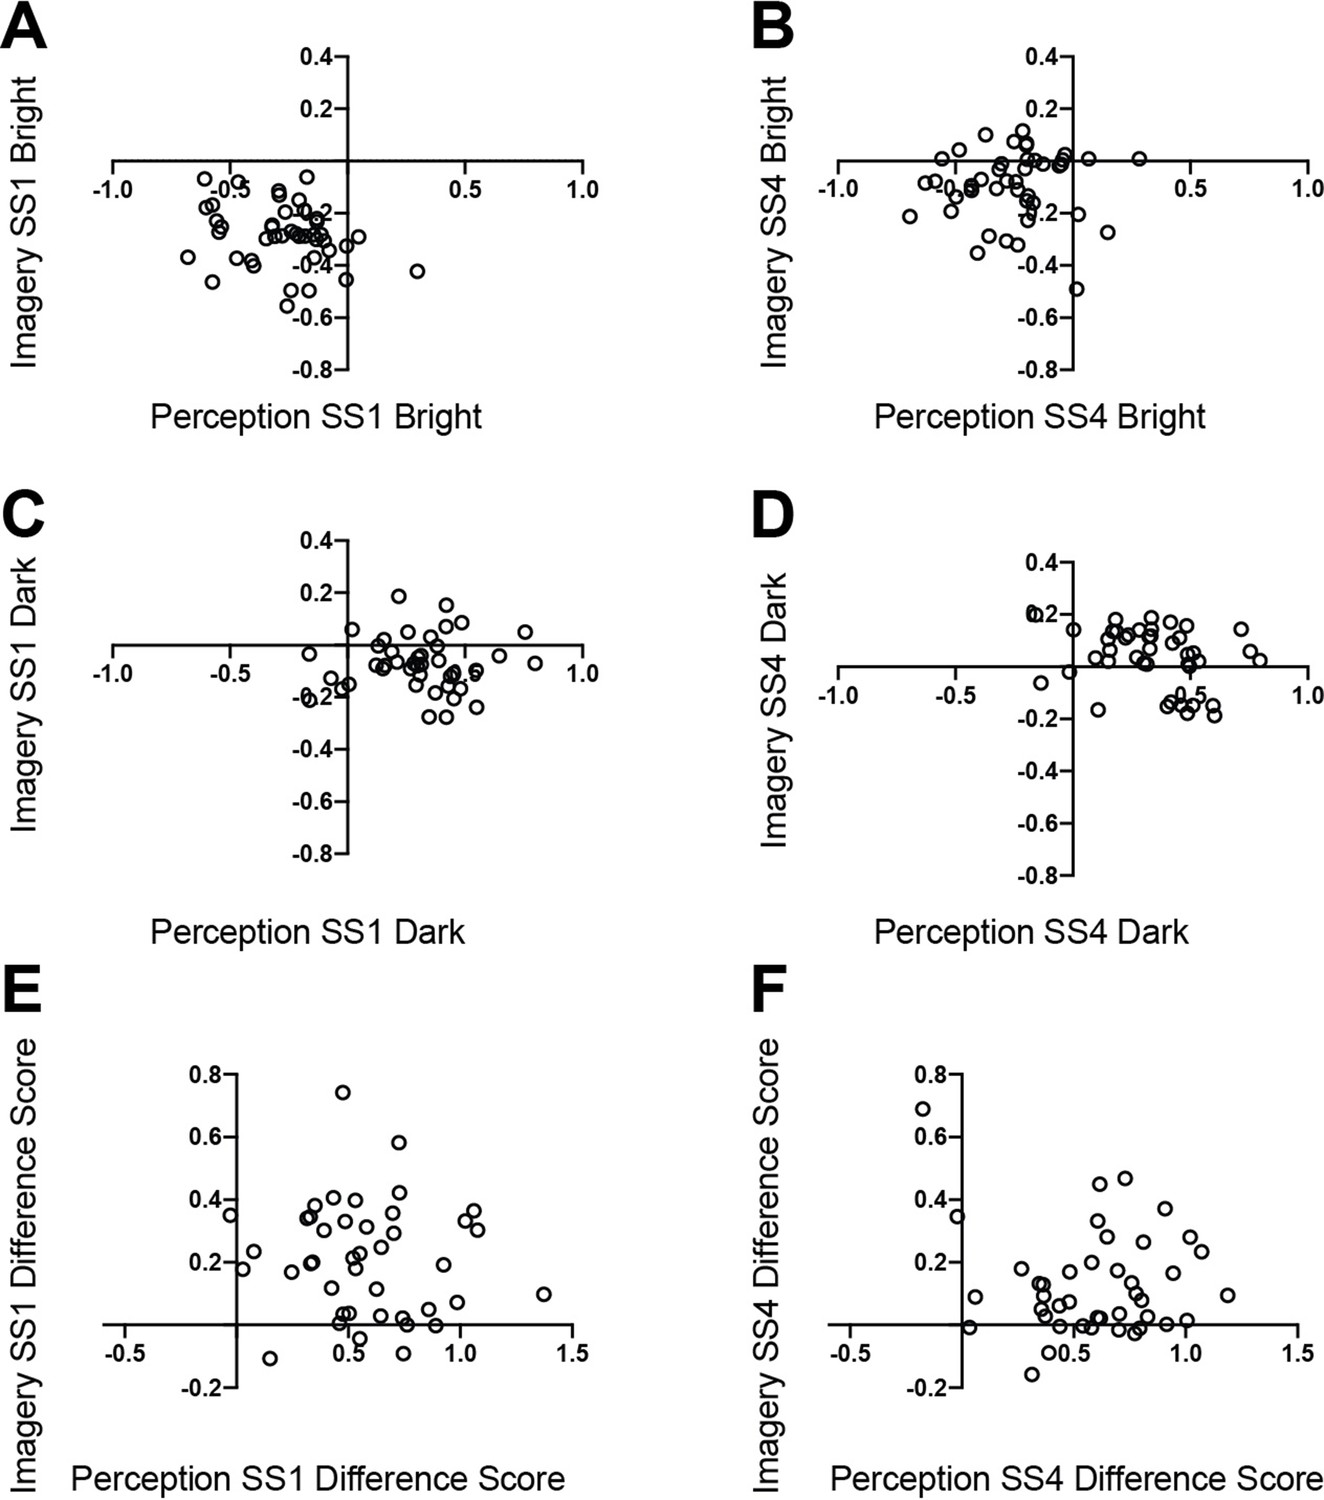
Correlations between pupil-difference scores and VVIQ.
The correlations between baselined pupil sizes during perceptually viewing images and imagining them for SS1 bright images (A, rs = −0.13, p = 0.40), SS4 bright images (B, rs = 0.11, p = 0.49), SS1 dark images (C, rs = 0.13, p = 0.40), and SS4 dark images (D, rs = 0.01, p = 0.97), plus difference scores for SS1 (E, rs = −0.25, p = 0.11) and SS4 (F, rs = −0.15, p = 0.36), all correlation values are Spearman’s rho.
Figure 2—figure supplement 2
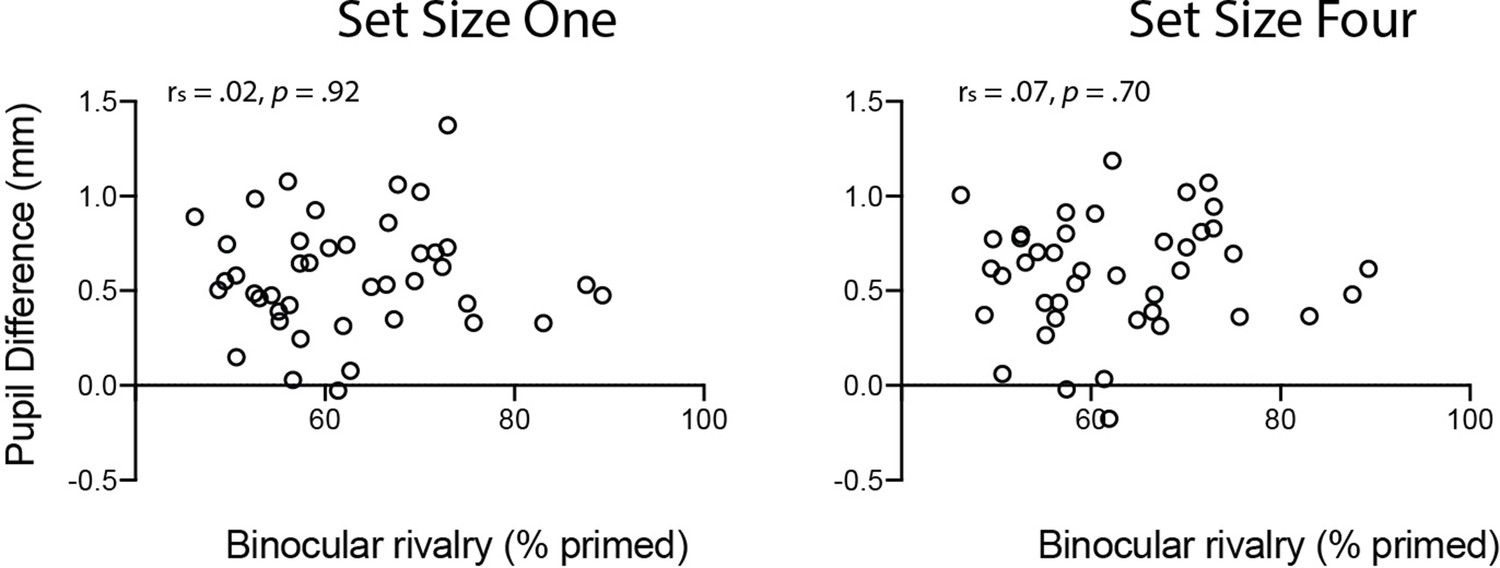
Correlations between pupil-difference scores and binocular rivalry priming during perception.
The relationship between participants pupil size difference scores during perception and priming in the binocular rivalry task for Set-Size-One (left panel: rs = −0.11, p = 0.475) and Set-Size-Four (right panel: rs = 0.08, p = 0.607).
Figure 2—figure supplement 3
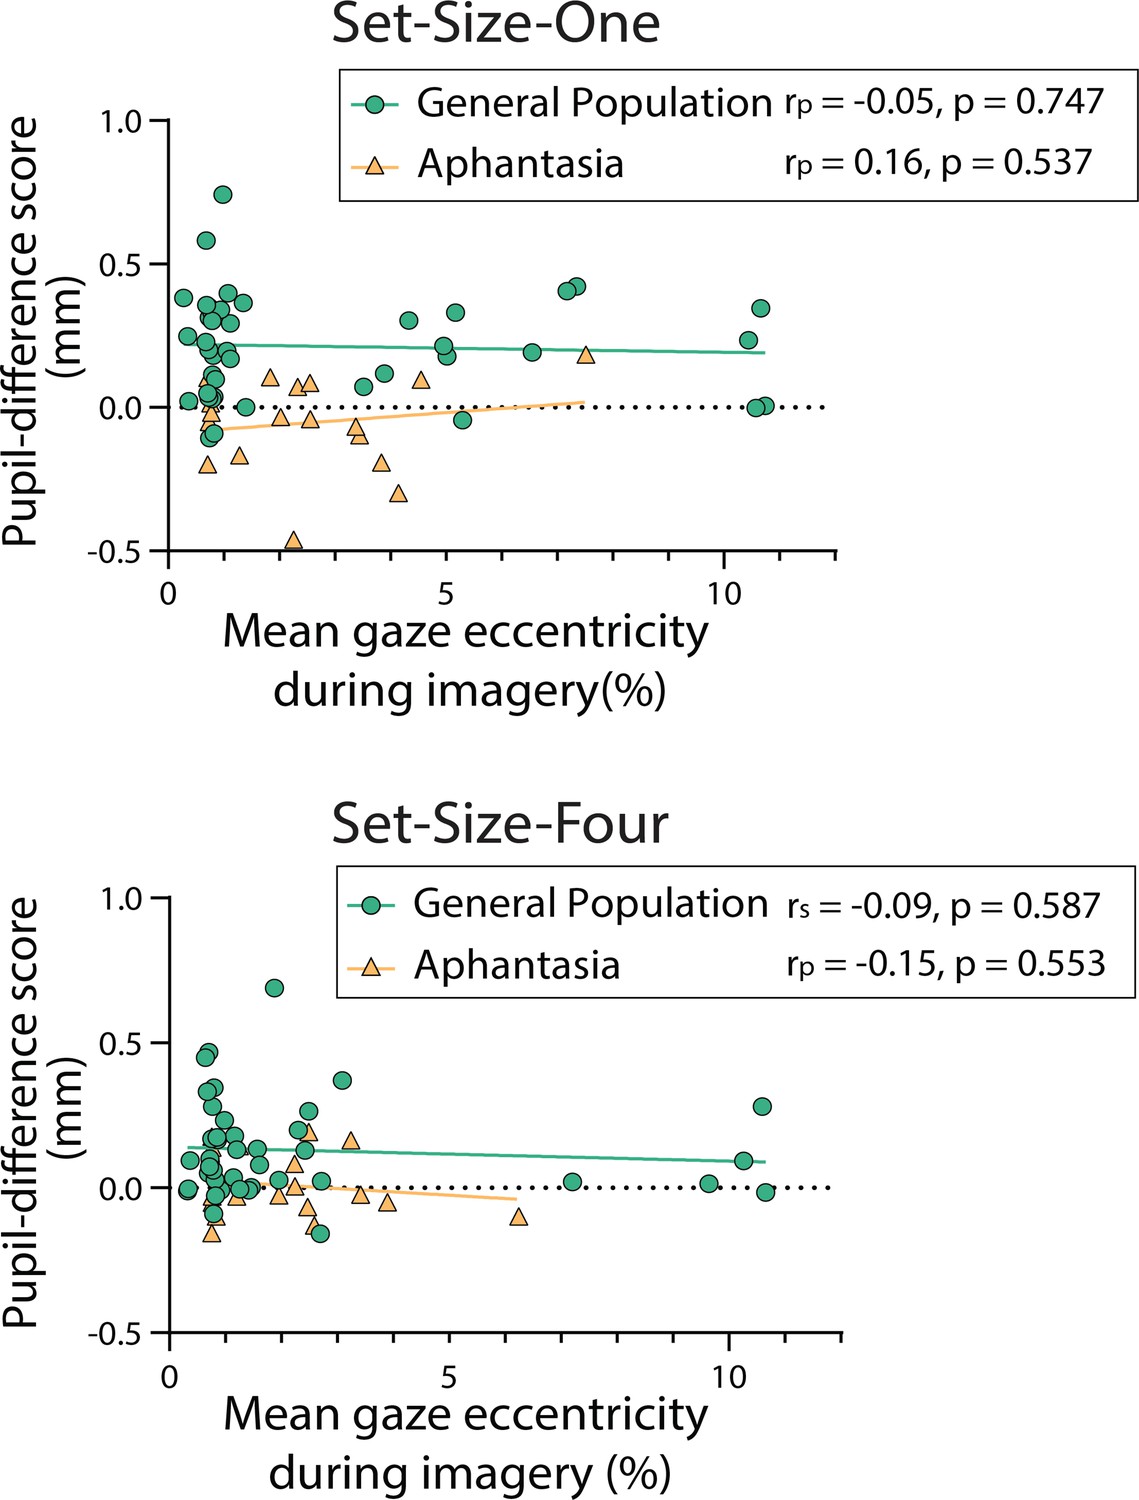
Correlations between mean eccentricity and pupil-difference scores during imagery for control and aphantasic groups.
The relationship between mean gaze eccentricity during imagery and pupil-difference scores during imagery from the general population (green circles) and aphantasic individuals (orange triangles) for Set-Size-One (top panel) and Set-Size-Four (bottom panel). Assumptions of normality and sphericity were met for all data sets except for the general population Set-Size-Four data set (Shapiro–Wilk test, p = 0.003). On examining participants’ Set-Size-One pupil-difference scores and mean eccentricity during Set-Size-One trials, using the Pearson’s correlational coefficient, no significant correlation was found for the general population, rp(41) = −0.05, p = 0.747 or aphantasic individuals, rp(17) = 0.16, p = 0.537 (see top panel). Spearman’s correlational coefficient indicated no significant correlation between Set-Size-Four pupil-difference scores and mean eccentricity for the general population, rs(41) = −0.09, p = 0.587. Pearson’s correlational coefficient also indicated no significant correlation between Set-Size-Four difference scores and mean eccentricity for aphantasic individuals, rp(17) = −0.15, p = 0.553 (see bottom panel).
Figure 2—figure supplement 4
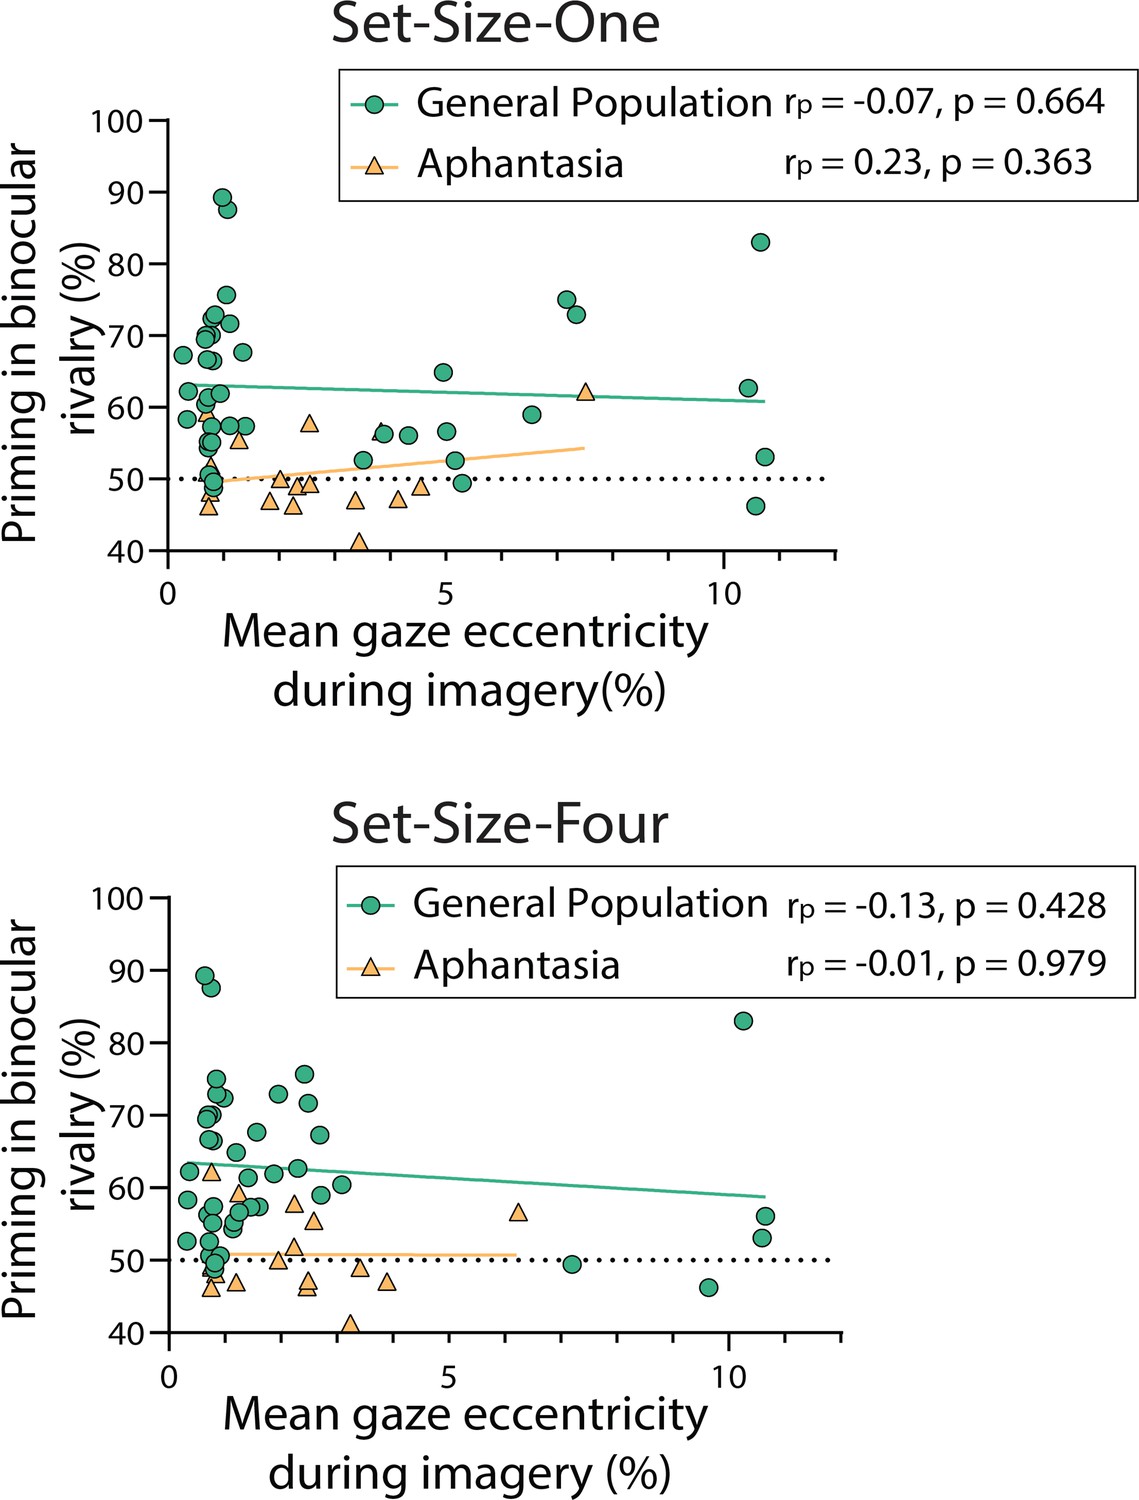
Correlations between mean eccentricity during imagery and binocular rivalry priming for control and aphantasic groups.
The relationship between mean gaze eccentricity during imagery and priming in the binocular rivalry task from the general population (green circles) and aphantasic individuals (orange triangles). Set-Size-One (top panel) and Set-Size-Four (bottom panel) conditions are shown. Assumptions of normality and sphericity were met for all data sets. On examining participants’ binocular rivalry priming scores and mean gaze eccentricity during imagery of Set-Size-One stimuli, using the Pearson’s correlational coefficient, no significant correlation was found for the general population, rp(41) = −0.07, p = 0.664, or aphantasic individuals, rp(17) = 0.23, p = 0.363 (see top panel). Pearson’s correlational coefficient also indicated no significant correlation between priming scores and mean gaze eccentricity during imagery of Set-Size-Four stimuli for the general population, rp(41) = −0.13, p = 0.428 or aphantasic individuals, rp(17) = −0.01, p = 0.979 (see bottom panel).
Figure 2—figure supplement 5

Correlations between mean eccentricity during imagery and mean trial-by-trial vividness scores for the control group.
The relationship between participants’ mean gaze eccentricity during imagery and their mean trial-by-trial vividness ratings for Set-Size-One and Set-Size-Four conditions, from the general population. Assumptions of normality and sphericity were met for all data sets. Using Pearson’s correlational coefficient, no significant correlation was found between eccentricity and vividness ratings during Set-Size-One trials, rp(41) = −0.04, p = 0.816 (see top panel). Similarly, no significant correlation was observed between eccentricity and vividness ratings during Set-Size-Four trials, rs(41) < −0.01, p = 0.998 (see bottom panel).
Figure 2—figure supplement 6
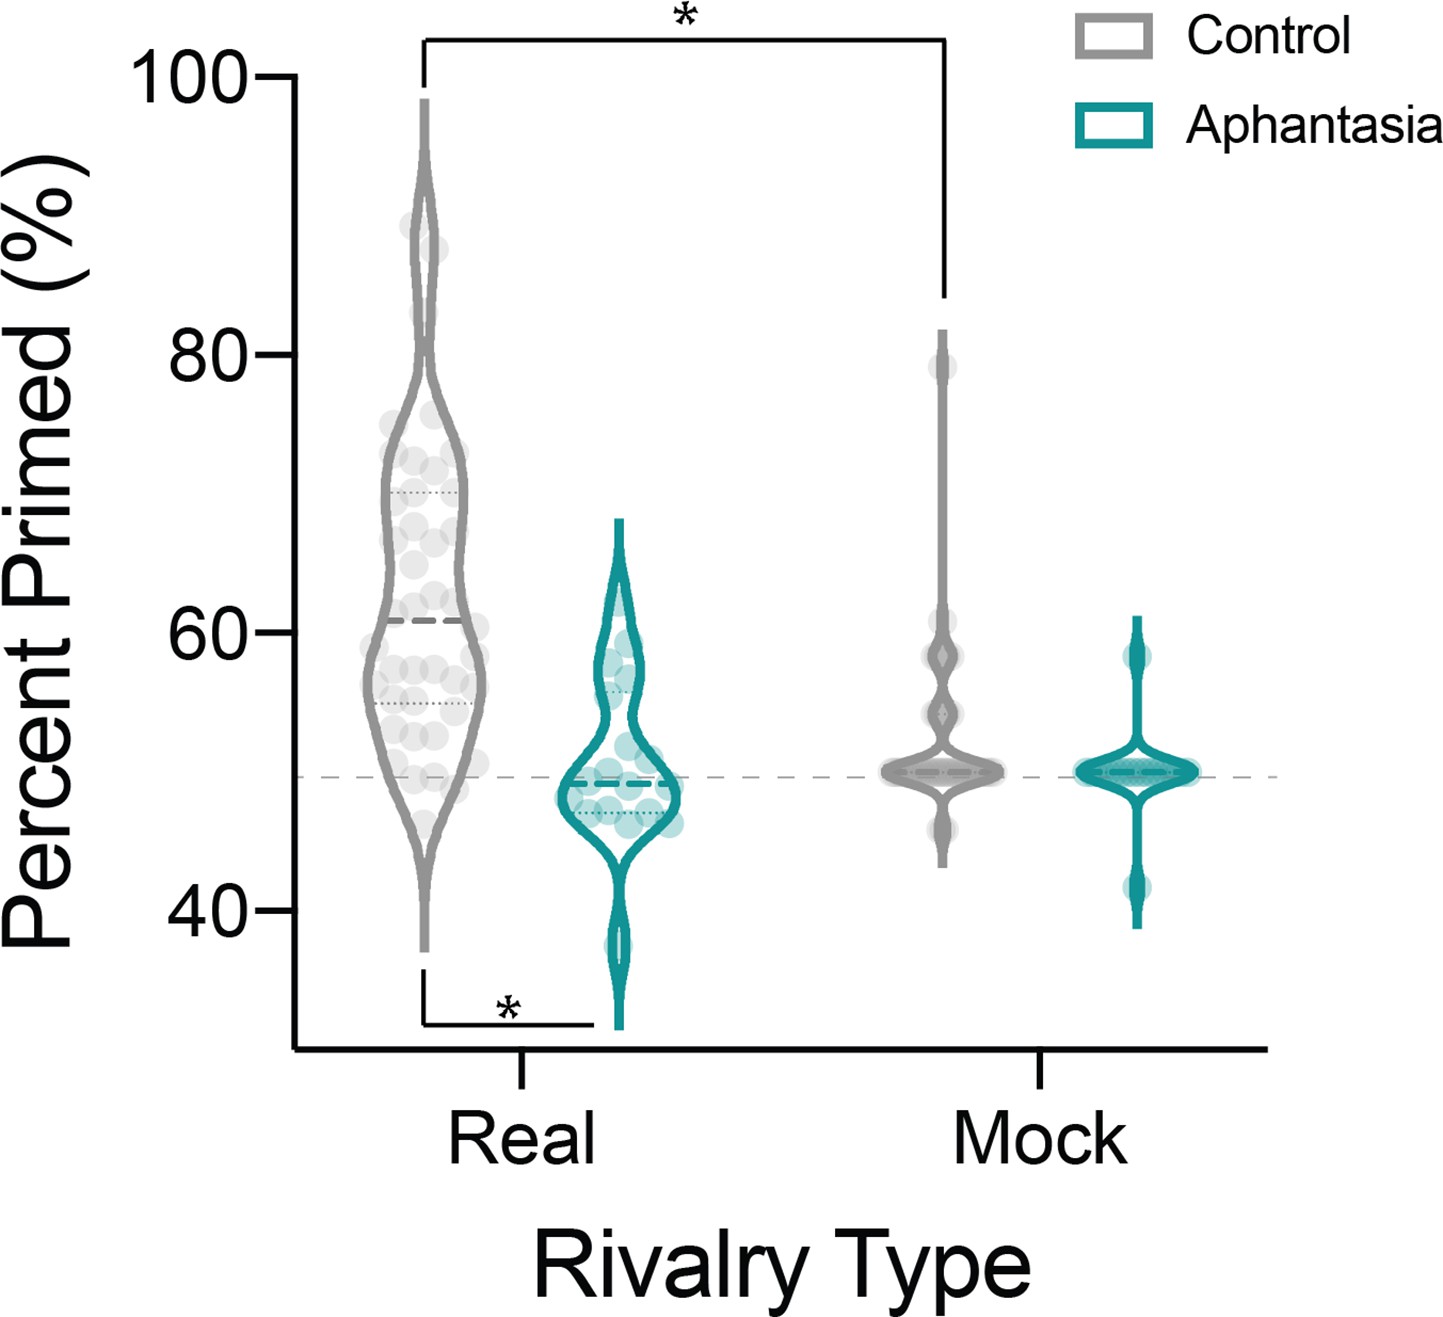
Binocular rivalry and mock rivalry priming scores for control and aphantasic individuals.
Binocular rivalry priming scores on the imagery task for control (grey violin plot) and aphantasic (teal violin plot) participants for real binocular rivalry trials (left) and mock (right). A mixed repeated measures analysis of variance (ANOVA) was run to compare the two groups priming for the real and mock binocular rivalry conditions. There was a significant interaction between condition (real vs. mock) and group (aphantasia vs. control): F(1, 58) = 12.46, p < 0.001. Post hoc analysis using the Bonferroni correction for multiple comparisons found that control participants priming was significantly higher than the aphantasic individuals in the real condition (t = 5.70, p < 0.001) but there was no significant difference between the groups for the mock condition (t = 1.07, p = 0.99). In addition, the control participants priming was higher in the real vs. the mock condition (t = 6.85, p < 0.001) whereas the real and mock conditions were not significantly different for the aphantasic population (t = 0.78, p = 99). Each circle represents an individual. * represent significant differences.
Figure 2—figure supplement 7
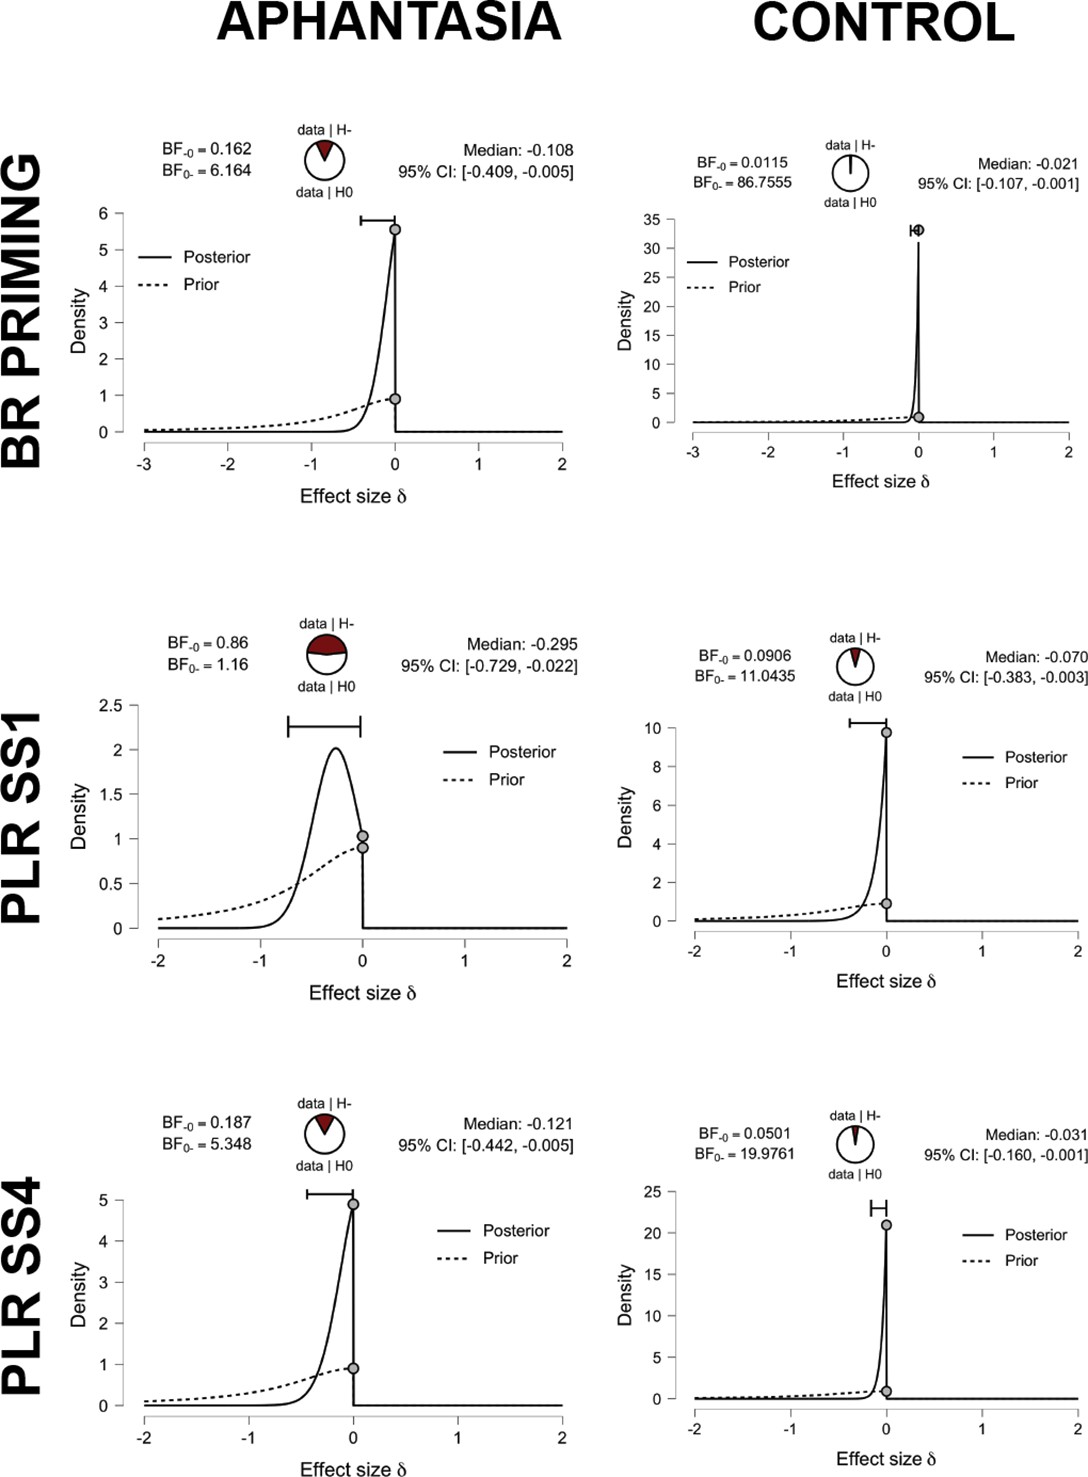
One-sample t-test prior and posterior plots.
The prior and posterior plots for the Bayesian t-tests run to assess the evidence for aphantasic individuals performing significantly worse than chance in both the binocular rivalry task (top row) and imaginary pupillary light response (middle and bottom row). When assessing both groups there was no evidence that their priming scores were significantly lower than chance (comparing scores to 50%: aphantasic individuals BF = 0.162, controls BF = 0.012). Similarly, a one-sample t-test found no evidence that either groups pupil-difference scores were lower than chance (comparing to 0: aphantasic individuals SS1 BF = 0.860, aphantasic individuals SS4 BF = 0.187, controls SS1 BF = 0.091, controls SS4 BF = 0.050). * represent significant differences.
Figure 2—figure supplement 8
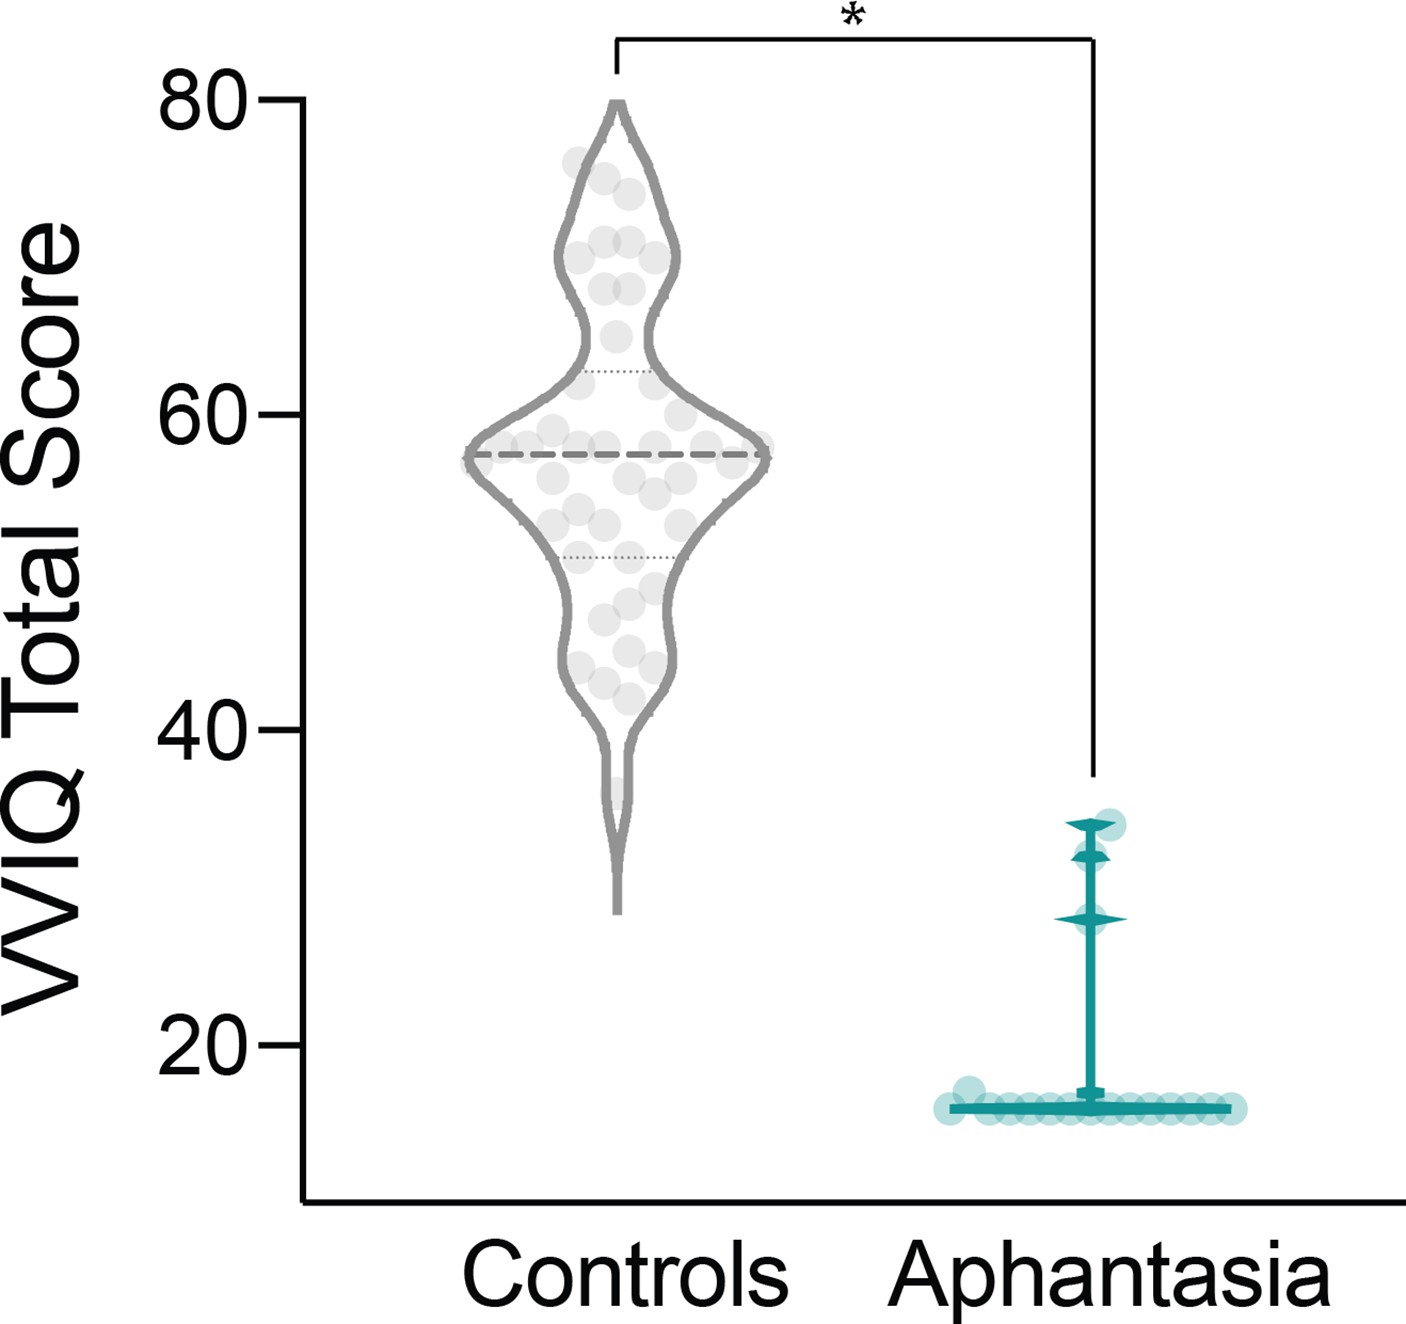
VVIQ scores for control and aphantasic individuals.
Vividness of visual imagery (VVIQ) scores for control (grey violin plot) and aphantasic (teal violin plot) participants. A Mann–Whitney test was run due to compare the VVIQ scores of the two groups due to unequal group sizes, variance, and the aphantasic group being non-normal. The two groups differed significantly (W = 0, p < 0.001) with aphantasic individuals having much lower scores on the VVIQ than the control group.
Figure 3 with 5 supplements
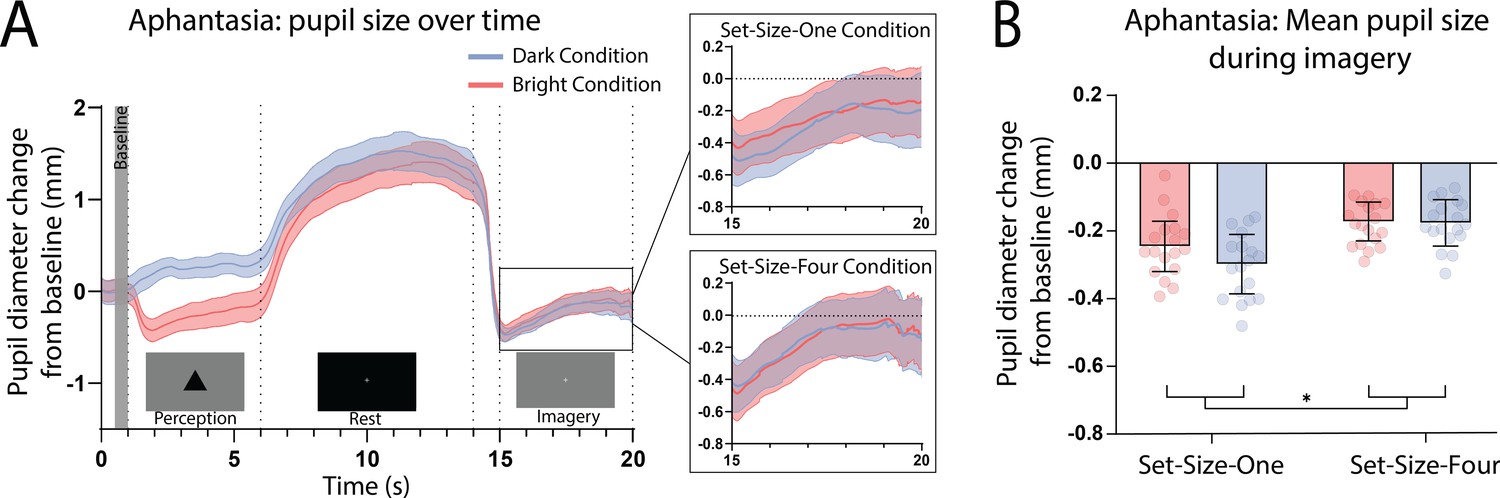
Pupillary response eye-tracker results for the aphantasic population.
(A) Mean pupil size waveforms over time. Left panel: data averaged across the course of a trial for Bright (red lines) and Dark (blue lines) conditions for the aphantasic population. Right panels: Set-Size-One and Set-Size-Four conditions are shown separately during the imagery period. (B) Mean pupil size change from baseline during imagery (i.e. averaged from seconds 15 to 20 of trials) of Bright (red bars) and Dark stimuli (blue bars). Error bars indicate ± standard error of the mean (SEM), calculated across participants. *p < 0.05.
-
Figure 3—source data 1
Source data for Figure 3B.
- https://cdn.elifesciences.org/articles/72484/elife-72484-fig3-data1-v2.csv
Figure 3—figure supplement 1

Mean vividness ratings for set size and group.
The mean vividness ratings for general population (left panel) and aphantasic individuals (right panels) for Set-Size-One (SS1) and Set-Size-Four (SS4) for bright (red) and dark (blue) images. Aphantasic individuals score at floor on vividness ratings, for this reason a repeated measures analysis of variance (ANOVA) was run only on the general population to assess what effect set size and image brightness had on vividness ratings. A 2 (Set-Size: One and Four) × 2 (Stimuli: Bright and Dark) repeated measures ANOVA was run. There was a significant main effect of stimuli F(1,41) = 37.85, p < 0.001, with the general population rating imagery of dark images as being more vivid than bright images. The main effect of set size was also significant F(1,41) = 8.042, p = 0.007, with participants rating imagery for Set-Size-One as being more vivid than Set-Size-Four. There was no significant interaction between the two factors F(1, 41) = 1.28, p = 0.264. Bars show mean values and error bars represent ± standard error of the mean (SEMs). Each circle represents an individual.
Figure 3—figure supplement 2
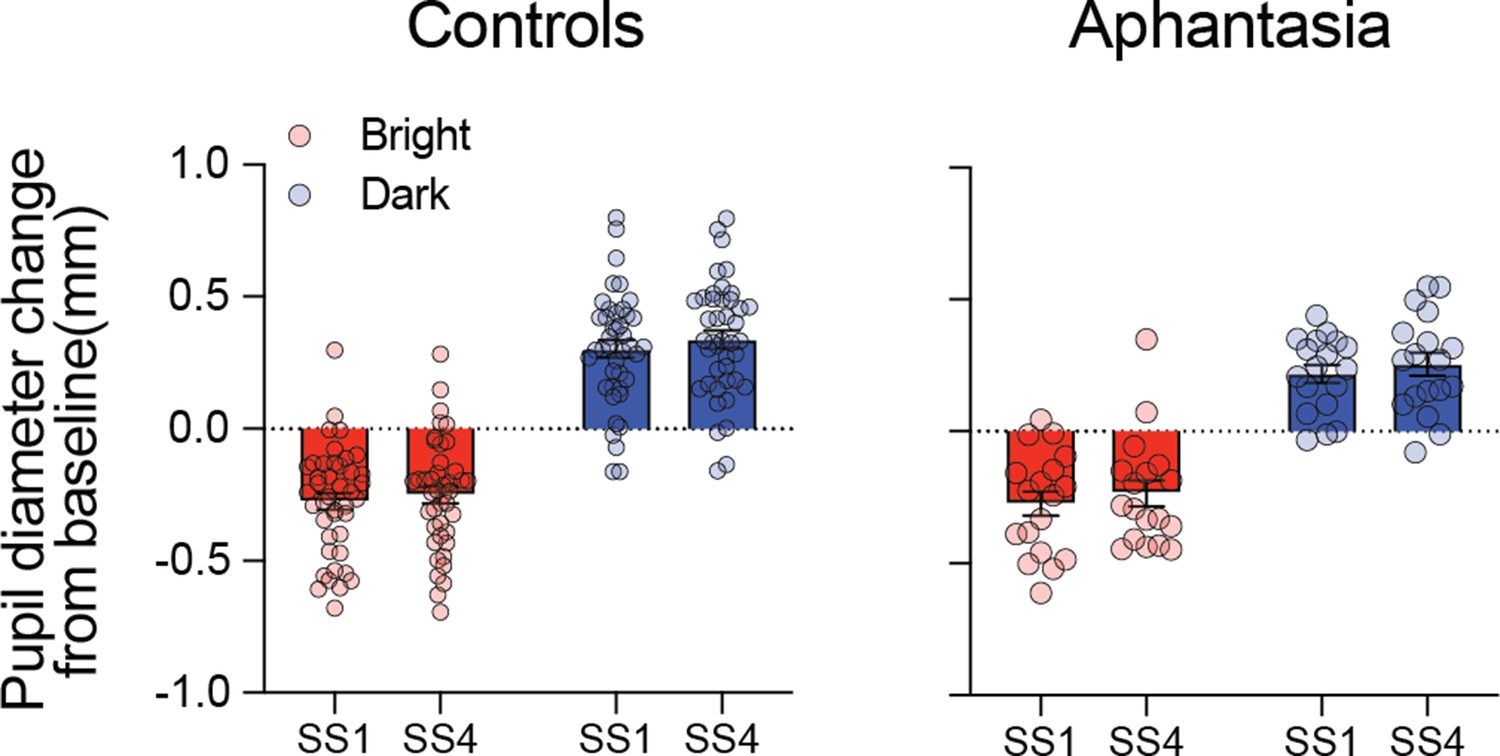
Pupil diameter changes during perception for control and aphantasic participant’s.
Data show the pupil diameter change from baseline during perception for control (left panel) and aphantasic individual’s (right panel) for bright (red) and dark (blue) images for both Set-Size-One (SS1) and Set-Size-Four (SS4). Bars show mean values and error bars represent ± standard error of the mean (SEMs). Each circle represents an individual. A 2 (image: bright × dark) × 2 (set size (SS): 1 × 4) × 2 (group: aphantasic × controls) repeated measures analysis of variance (ANOVA) was run. There was a main effect of image F(1, 58) = 211.24, p < 0.001 and set size F(1, 58) = 4.16, p = 0.046. There was no significant effect of group F(1, 58) = 1.15, p = 0.288 and there were no significant interactions (image × group: F(1, 58) = 1.57, p = 0.216, SS × group: F(1,58) = 0.06, p = 0.816, image × SS × group: F(1, 58) = 0.03, p = 0.875).
Figure 3—figure supplement 3
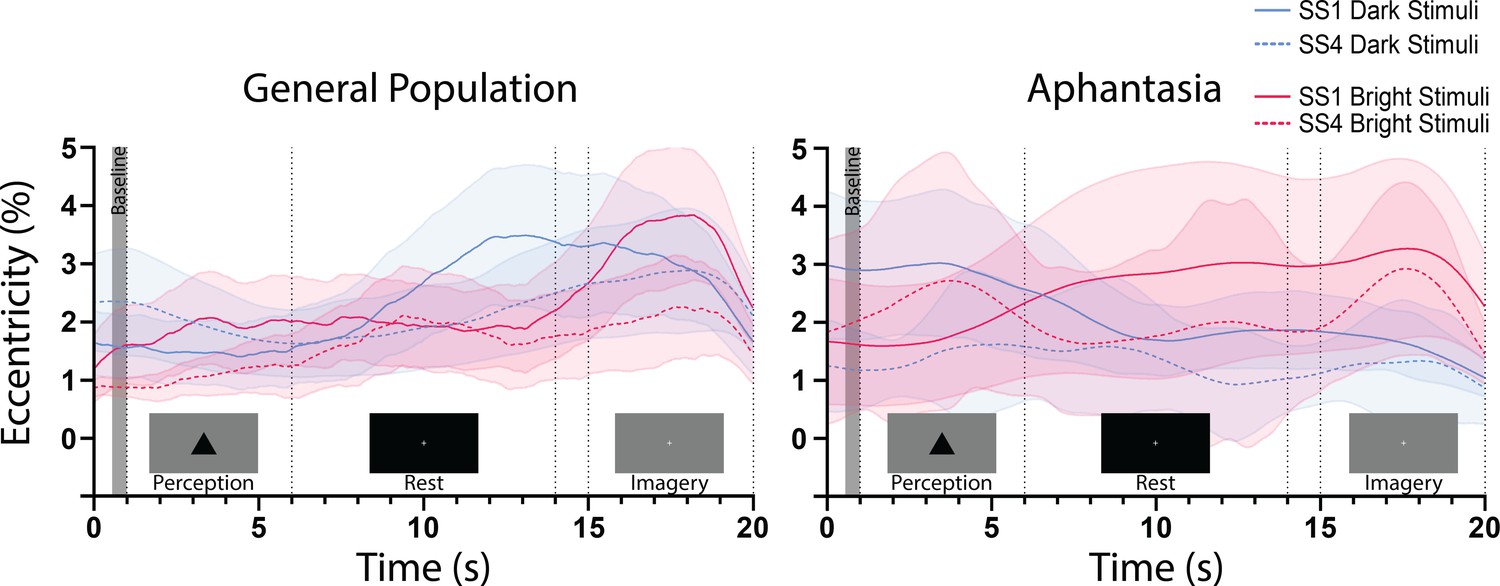
Eccentricity values for control and aphantasic individuals.
Gaze eccentricity waveforms during bright and dark stimuli conditions (for both Set-Size-One and -Four) for control (left panel) and aphantasic (right panel) participants. Data are averaged across the course of a trial for Bright (red lines) and Dark (blue lines) conditions. Solid lines indicate Set-Size-One stimuli and dotted lines indicate Set-Size-Four stimuli. Shaded error bands represent ± standard error of the mean (SEM) calculated across participants. PERCEPTION PERIOD: A 2 (image: bright × dark) × 2 (set size (SS): 1 × 4) × 2 (group: aphantasic × controls) repeated measures analysis of variance (ANOVA) was run for mean eccentricity during the perception phase of trials. There was no significant main effect of image F(1, 58) = 0.46, p = 0.497, set size F(1, 58) <0.001, p = 0.983, or group F(1, 58) = 3.66, p = 0.061. There were also no significant interactions (image × SS: F(1, 58) = 0.07, p = 0.787, image × group: F(1, 58) = 0.33, p = 0.568, SS × group: F(1, 58) = 0.48, p = 0.491, image × SS × group: F(1, 58) = 3.2, p = 0.079). IMAGERY PERIOD: A 2 (image: bright × dark) × 2 (set size (SS): 1 × 4) × 2 (group: aphantasic × controls) repeated measures ANOVA was run for mean eccentricity during the imagery phase of trials. There was a significant main effect of image F(1, 58) = 1.07, p = 0.026. Post hoc analysis using the Bonferroni correction for multiple comparisons found that eccentricity was significantly higher during imagery of bright stimuli than imagery of dark stimuli when averaged across levels of set size and group (t = 2.29, p = 0.026). There was no significant effect of set size (F(1,58) = 2.66, p = 0.108) or group (F(1,58) = 0.41, p = 0.525), and there were no significant interactions (image × SS: F(1, 58) = 1.17, p = 0.283, image × group: F(1, 58) = 3.84, p = 0.055, SS × group: F(1, 58) = .08, p = 0.78, image × SS × group: F(1, 58) = 0.58, p = 0.448).
Figure 3—figure supplement 4
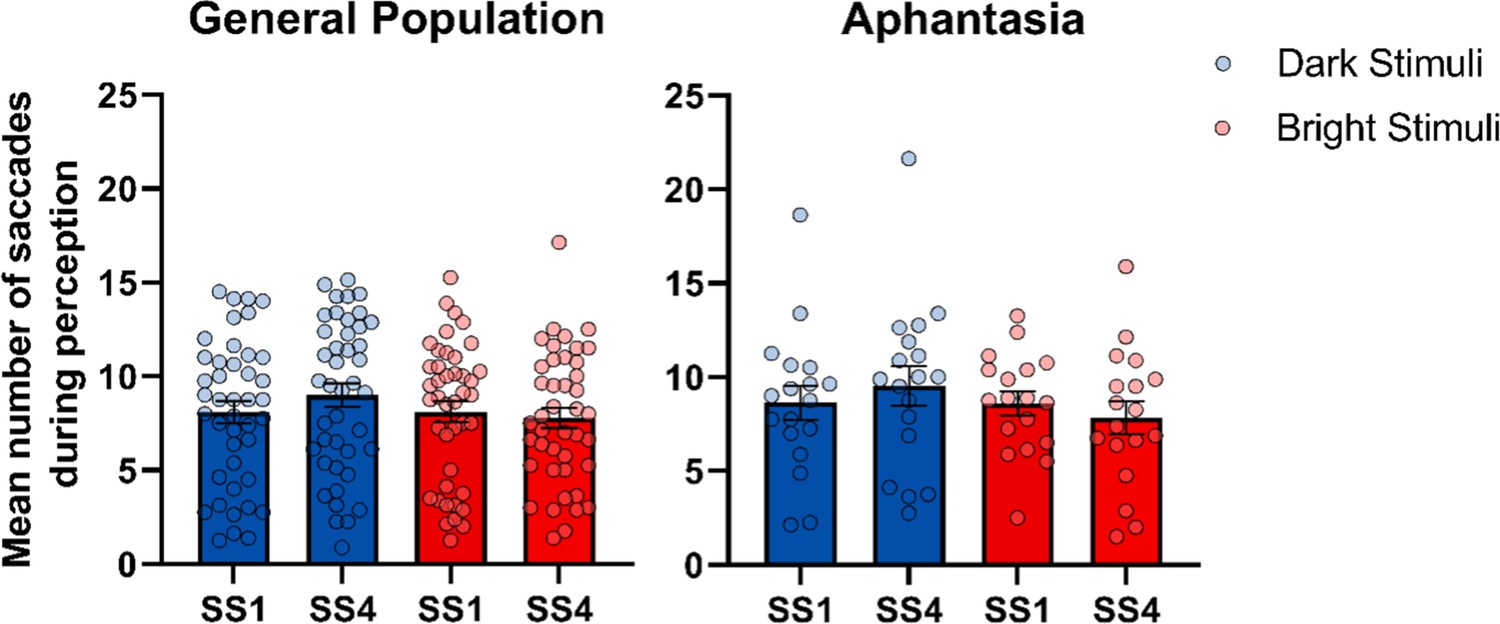
The number of saccades during perception for control and aphantasic participant’s.
The mean number of saccades for general population (left panel) and aphantasic individual’s (right panel) during the perception phase of trials. Bright (red) and dark (blue) stimuli for both Set-Size-One (SS1) and Set-Size-Four (SS4) are depicted. Bars show mean values and error bars represent ± standard error of the mean (SEMs) calculated across participants. Each circle represents an individual. A 2 (image: bright × dark) × 2 (set size (SS): 1 × 4) × 2 (group: aphantasic × controls) repeated measures analysis of variance (ANOVA) was run. There was a main effect of image F(1, 58) = 6.72, p = 0.012 and a significant interaction of image × SS: F(1, 58) = 8.89, p = 0.004. Post hoc analysis using the Bonferroni correction for multiple comparisons found a significantly greater number of saccades during the perception of dark stimuli (M = 9.17, SD = 4.19) compared to bright stimuli (M = 7.8, SD = 3.54) for the Set-Size-Four condition (t = −3.91, p = <0.001) but not the Set-Size-One condition (t = 0.05, p = 1) when averaged across groups. There was no significant effect of set size (F(1, 58) = 0.46, p = .501) or group (F(1, 58) = 0.16, p = 0.688). There were no other significant interactions (image × group: F(1, 58) = 0.21, p = 0.647, SS × group: F(1, 58) = 0.22, p = 0.643, image × SS × group: F(1, 58) = 0.17, p = 0.677).
Figure 3—figure supplement 5
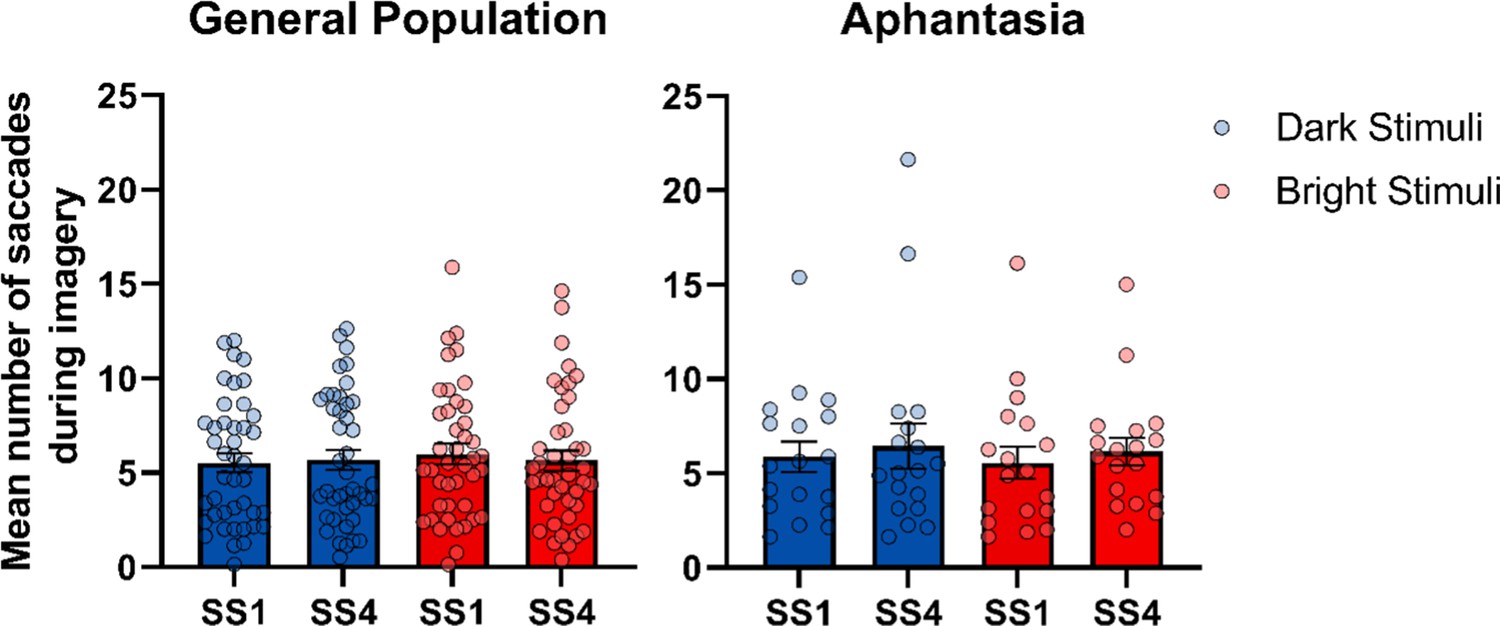
The number of saccades during imagery for control and aphantasic participant’s.
The mean number of saccades for general population (left panel) and aphantasic individual’s (right panel) during the imagery phase of trials. Bright (red) and dark (blue) stimuli for both Set-Size-One (SS1) and Set-Size-Four (SS4) are depicted. Bars show mean values and error bars represent ± standard error of the mean (SEMs) calculated across participants. Each circle represents an individual. A 2 (image: bright × dark) × 2 (set size (SS): 1 × 4) × 2 (group: aphantasic × controls) repeated measures analysis of variance (ANOVA) was run. There were no significant main effects image: F(1, 58) = 0.02, p = 0.885, set size: F(1, 58) = 0.82, p = 0.369, group: F(1, 58) = 0.12, p = 0.735. There were also no significant interactions image × group: F(1, 58) = 0.66, p = 0.419, SS × group: F(1, 58) = 1.41, p = 0.240, image × SS: F(1, 58) = 0.16, p = 0.693, image × SS × group: F(1, 58) = 0.20, p = 0.660.
Additional files
-
Supplementary file 1
Fixed effects estimates for pupil-difference scores as a function of vividness ratings.
This file provides the fixed effects estimates for the LME run on the pupil-difference scores for the general population as a function of vividness ratings and set size.
- https://cdn.elifesciences.org/articles/72484/elife-72484-supp1-v2.docx
-
Transparent reporting form
- https://cdn.elifesciences.org/articles/72484/elife-72484-transrepform1-v2.pdf
Download links
A two-part list of links to download the article, or parts of the article, in various formats.
Downloads (link to download the article as PDF)
Open citations (links to open the citations from this article in various online reference manager services)
Cite this article (links to download the citations from this article in formats compatible with various reference manager tools)
The pupillary light response as a physiological index of aphantasia, sensory and phenomenological imagery strength
eLife 11:e72484.
https://doi.org/10.7554/eLife.72484


