Antigenic evolution of human influenza H3N2 neuraminidase is constrained by charge balancing
- Department of Biochemistry, University of Illinois at Urbana-Champaign, United States
- Department of Physics, University of Washington, United States
- Max Planck Institute for Dynamics and Self-Organization, Germany
- Fred Hutchinson Cancer Research Center, United States
- Center for Biophysics and Quantitative Biology, University of Illinois at Urbana-Champaign, United States
- Carl R. Woese Institute for Genomic Biology, University of Illinois at Urbana-Champaign, United States
- Carle Illinois College of Medicine, University of Illinois at Urbana-Champaign, United States
Figures
Figure 1 with 3 supplements
Natural evolution of an antigenic region in human H3N2 neuraminidase (NA).
(a) The enzyme active site and the antigenic region of interest are highlighted as red and blue, respectively, on one protomer of the NA tetramer. The sialic acid within the active site is shown in yellow. (b) Seven residues in the antigenic region of interest are highlighted in blue spheres. (c) Natural occurrence frequencies of the amino acid variants that have a natural occurrence at >50% in any given year at the residues of interest are shown (Figure 1—source data 1 and Figure 1—source data 2). Of note, only those amino acid variants with a natural occurrence at >80% in any given year were included in our mutant libraries. Therefore, although D368 is shown in this plot, it was not included in our mutant libraries since it only reached a maximum occurrence of 67%.
-
Figure 1—source data 1
Human H3N2 neuraminidase (NA) protein sequences.
- https://cdn.elifesciences.org/articles/72516/elife-72516-fig1-data1-v2.zip
-
Figure 1—source data 2
Natural occurrence frequencies of the major amino acid variants at the residues of interest in different years.
- https://cdn.elifesciences.org/articles/72516/elife-72516-fig1-data2-v2.zip
Figure 1—figure supplement 1
Accumulation of amino acid mutations in the hemagglutinin (HA) and neuraminidase (NA) of human H3N2 viruses.
The number of amino acid mutations in the HA and NA relative to the ancestral strain, A/Hong Kong/1/1968 (HK68), is shown as a line graph. Consensus sequence of all isolates from a given year is used for calculating the number of mutations relative to HK68.
Figure 1—figure supplement 2
The frequency of haplotypes at the neuraminidase (NA) antigenic region of interest in circulating human H3N2 strains.
In naturally circulating human H3N2 strains, 53 of the 864 haplotypes of interest were observed. The sequences of these 53 haplotypes are shown on the y-axis. Their occurrence frequency from 1968 to 2020 is plotted. For a frequency of 100%, the density curve would almost touch the next higher baseline. Some haplotypes have a very low occurrence frequency and may look like a complete flat line in the frequency diagram.
Figure 1—figure supplement 3
Correlations of fitness measurements between replicates.
Correlations of variant fitness measurements between replicates of deep mutational scanning experiments are shown as scatterplots. Each data point within a scatterplot represents a unique variant. The Pearson correlation (R) between replicates is indicated. Data points corresponding to the wild type (WT) sequences of HK68, Bk79, Bei89, Mos99, and HK19 are colored as indicated. Of note, the WT sequence of Vic11 contains a naturally rare variant T329 that was not included in our study. Therefore, the WT sequence of Vic11 is not included in our mutant libraries.
Figure 2 with 1 supplement
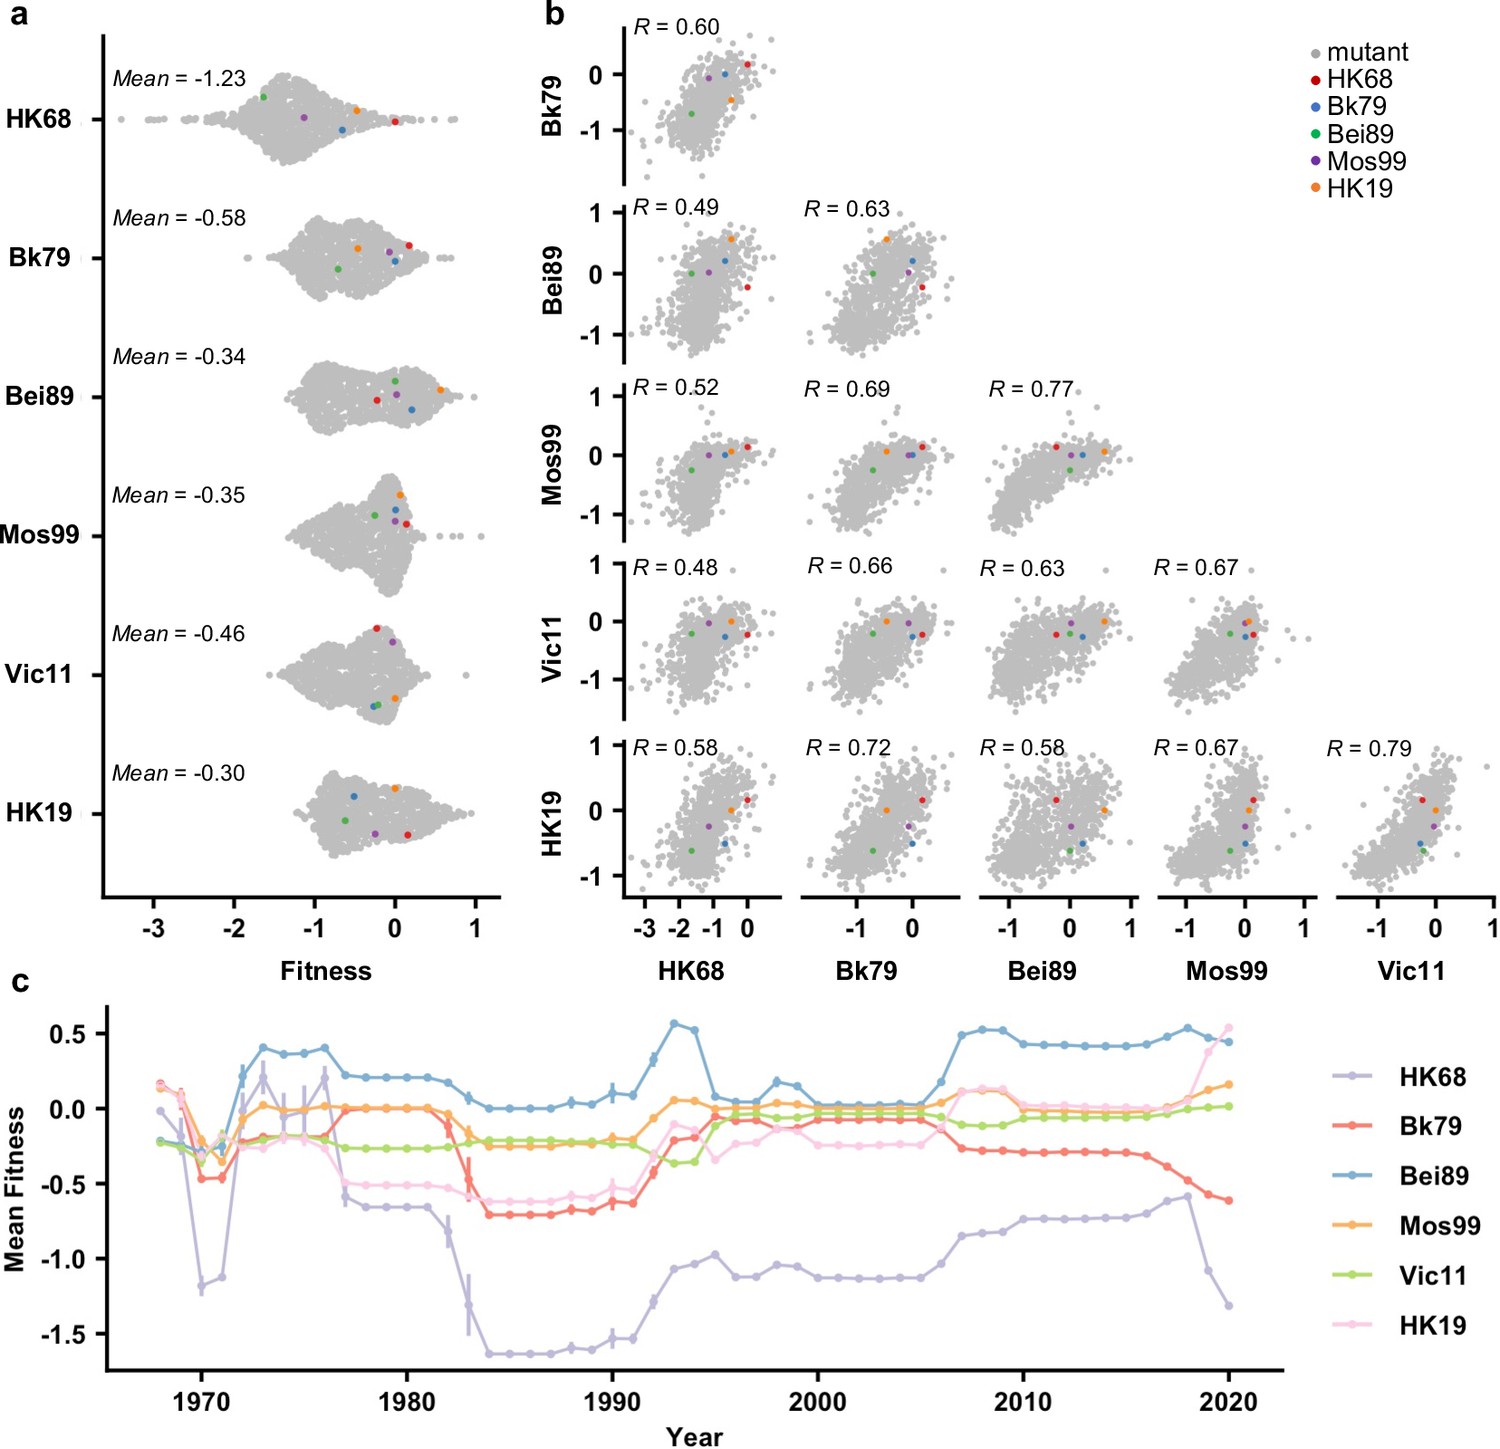
Comparing the local fitness landscapes of the neuraminidase (NA) antigenic region in six human H3N2 strains.
(a) Variant fitness distributions in different genetic backgrounds are shown as a sina plot (Figure 2—source data 1). Each data point represents one variant. A total of 864 data points are present for each row (each genetic background). (b) Correlations of variant fitness distribution among different genetic backgrounds are shown, with each data point representing one variant. Pearson correlation coefficients (R) are indicated. (a, b) Data points corresponding to the wild type (WT) sequences of HK68, Bk79, Bei89, Mos99, and HK19 are colored as indicated. Of note, the WT sequence of Vic11 contains a naturally rare variant T329. Therefore, the WT sequence of Vic11 was not included in our mutant libraries. (c) Naturally occurring variants were grouped by the year of isolation, and their mean fitness in different genetic backgrounds is shown (Figure 2—source data 2). Different genetic backgrounds are represented by different lines, which are color coded as indicated on the right. Error bars represent the standard error of mean. This analysis included 66,562 NA sequences from human H3N2 strains that were isolated between 1968 and 2020 (Figure 1—source data 1).
-
Figure 2—source data 1
Fitness value of each variant across six different genetic background.
- https://cdn.elifesciences.org/articles/72516/elife-72516-fig2-data1-v2.xlsx
-
Figure 2—source data 2
The yearly mean fitness of naturally occurring variants in different genetic backgrounds.
- https://cdn.elifesciences.org/articles/72516/elife-72516-fig2-data2-v2.zip
Figure 2—figure supplement 1
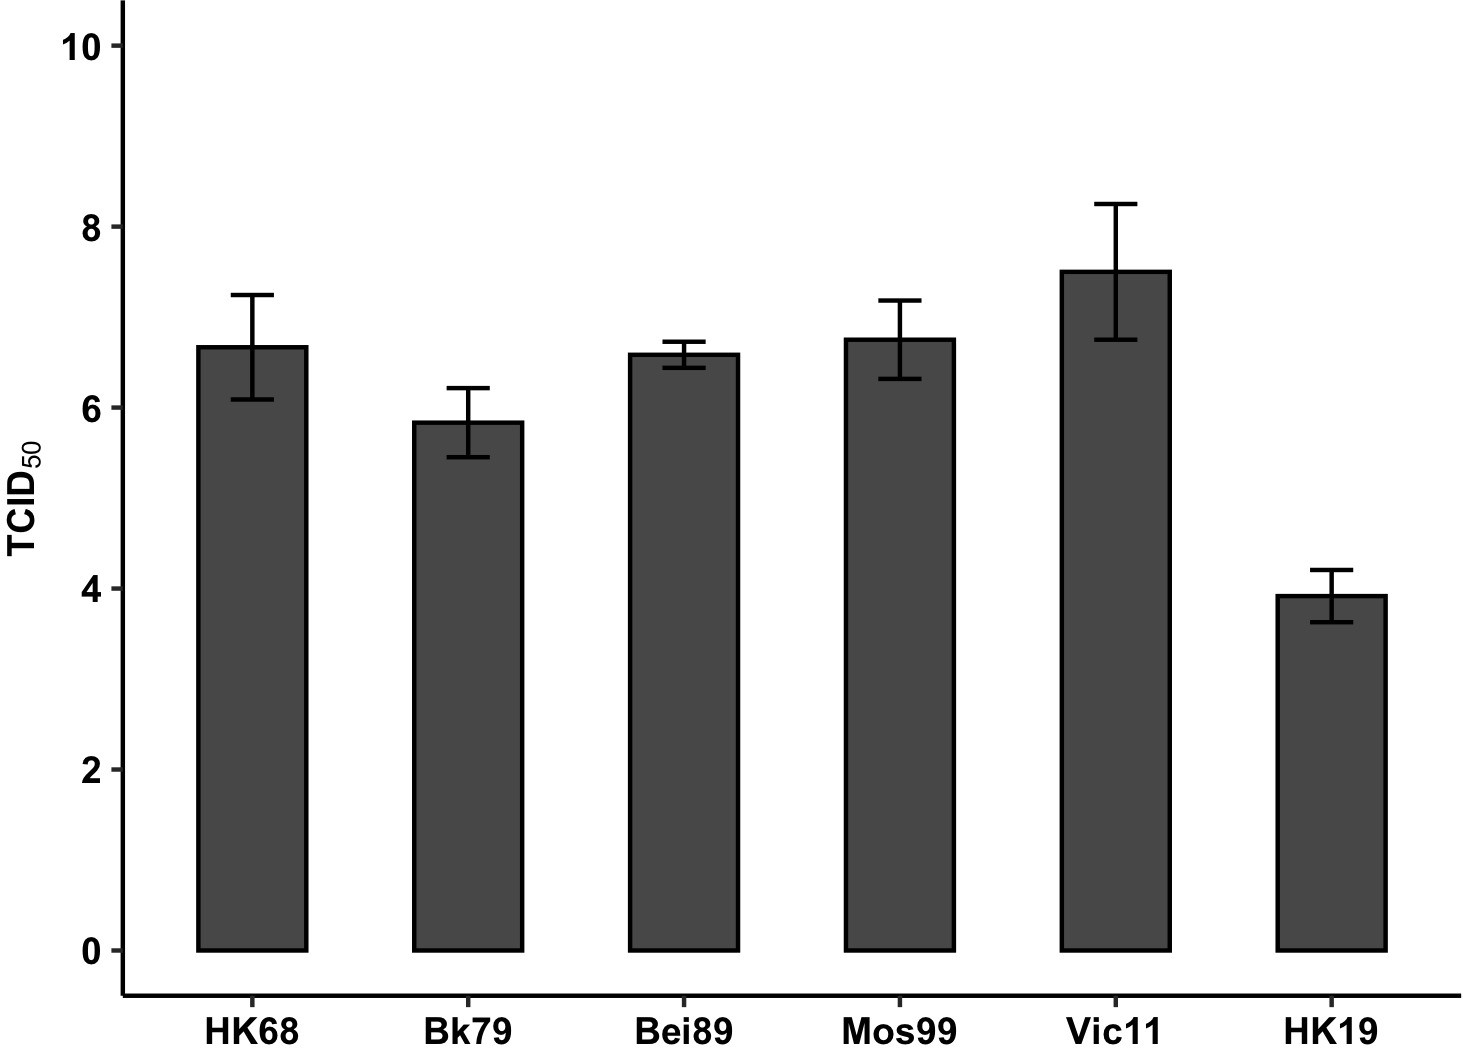
Virus rescue experiment of wild type (WT) strains.
The titer of six WT strains (HK68, Bk79, Bei89, Mos99, Vic11, and HK19) from a virus rescue experiment is shown. Error bar represents standard error from three biological replicates. This rescue experiment was performed using the six internal segments from A/WSN/33 (H1N1) and hemagglutinin (HA) segment from HK68.
Figure 3 with 5 supplements

Inference of additive fitness and pairwise epistasis.
(a) Parameters for additive fitness in different genetic backgrounds are shown. (b) Pairwise epistatic effects show strong correlations among six different genetic backgrounds, and therefore, Bk79 is shown as a representative. The identity of a given double amino acid variant is represented by the labels on the x- and y-axes. The same plots for other genetic backgrounds are shown in Figure 3—figure supplement 5. (a, b) Positive additive fitness and pairwise epistasis are in red. Negative additive fitness and pairwise epistasis are in blue. The magnitude is proportional to the size of the circle. (c) Correlation matrices of additive fitness and pairwise epistasis among six genetic backgrounds are shown as a heatmap. See Figure 3—figure supplements 4 and 5 for the related scatter plots.
Figure 3—figure supplement 1
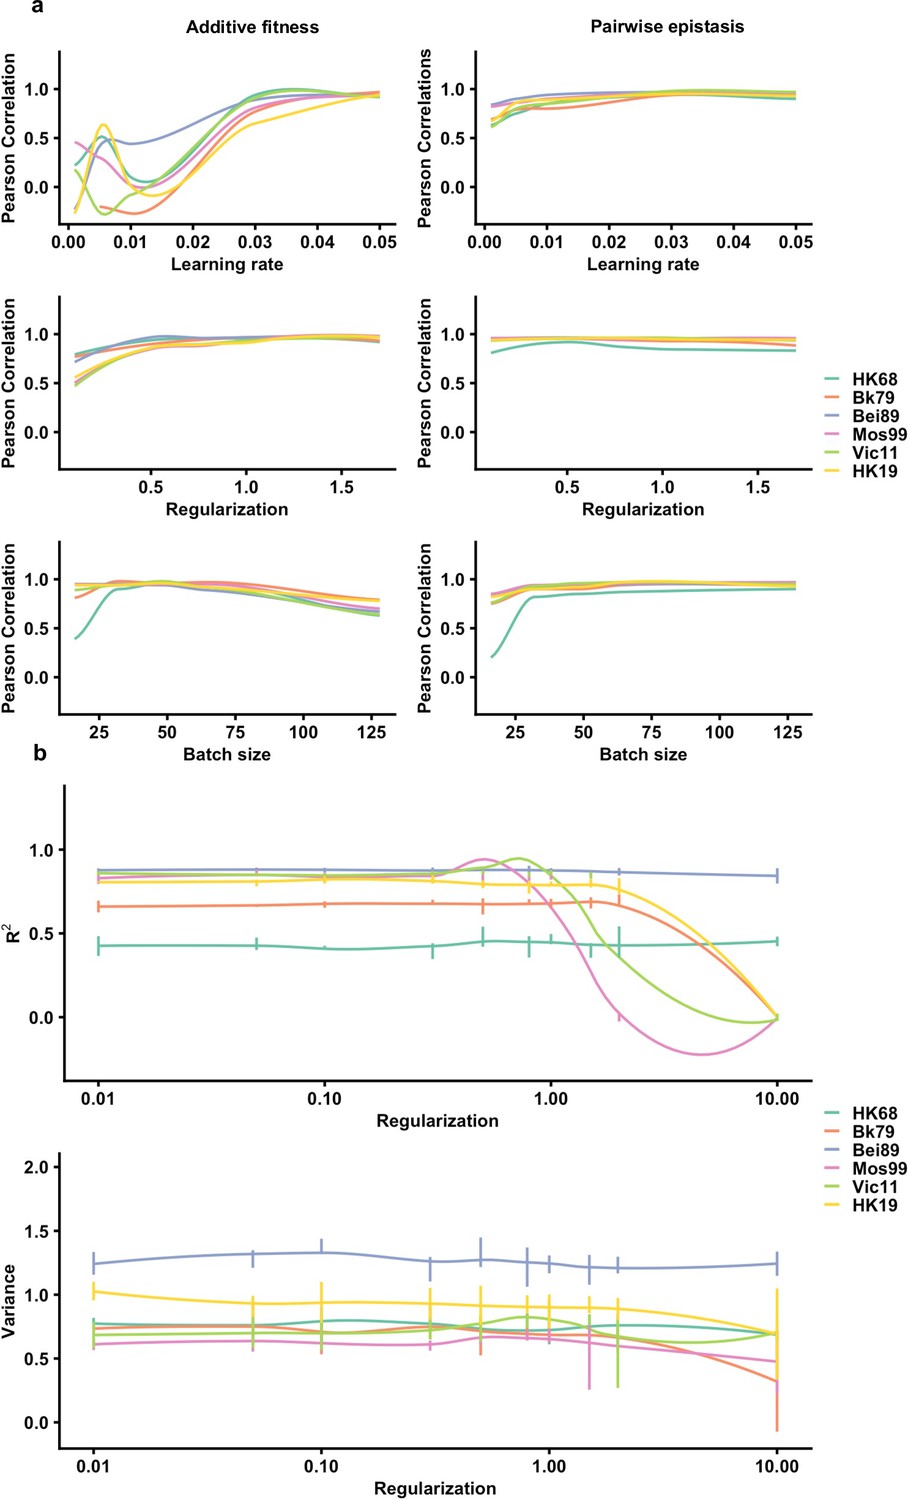
Evaluation of model hyperparameters using repeated k-fold cross-validation.
(a) The relationship between different hyperparameters (learning rate, regularization, and batch size) and model robustness is evaluated. (b) The relationship between different regularization hyperparameter and model fit is evaluated.
Figure 3—figure supplement 2
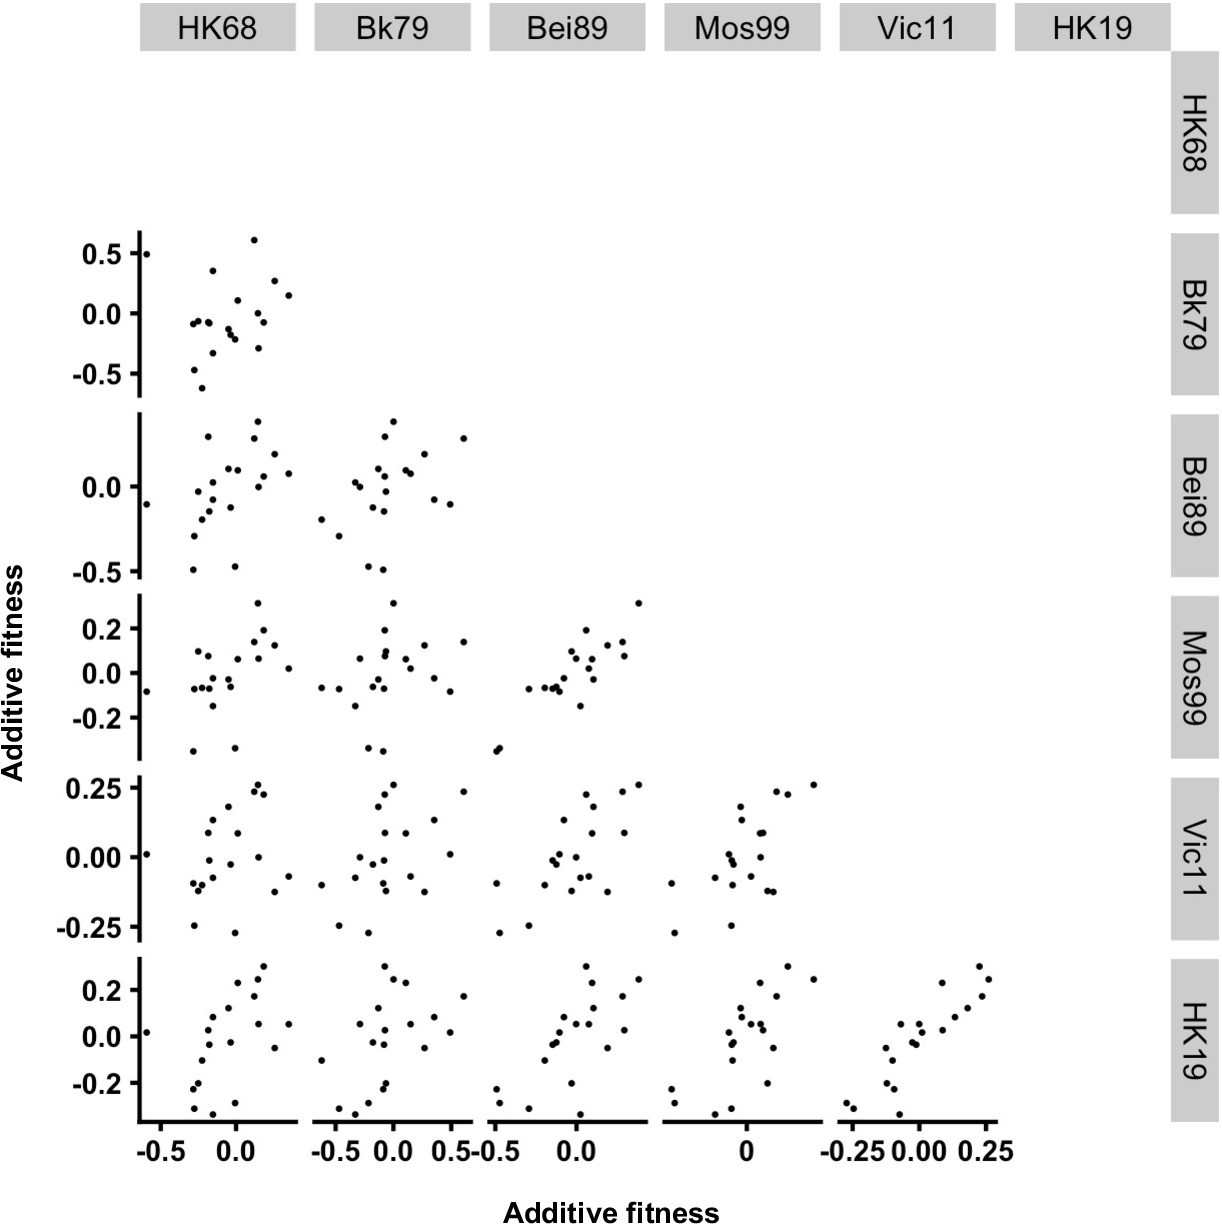
Correlations of additive fitness among genetic backgrounds.
The 19 parameters for additive fitness are compared among genetic backgrounds, with each data point representing one parameter. The correlations of additive fitness among genetic backgrounds varied hugely (Pearson correlation = 0.12–0.88).
Figure 3—figure supplement 3
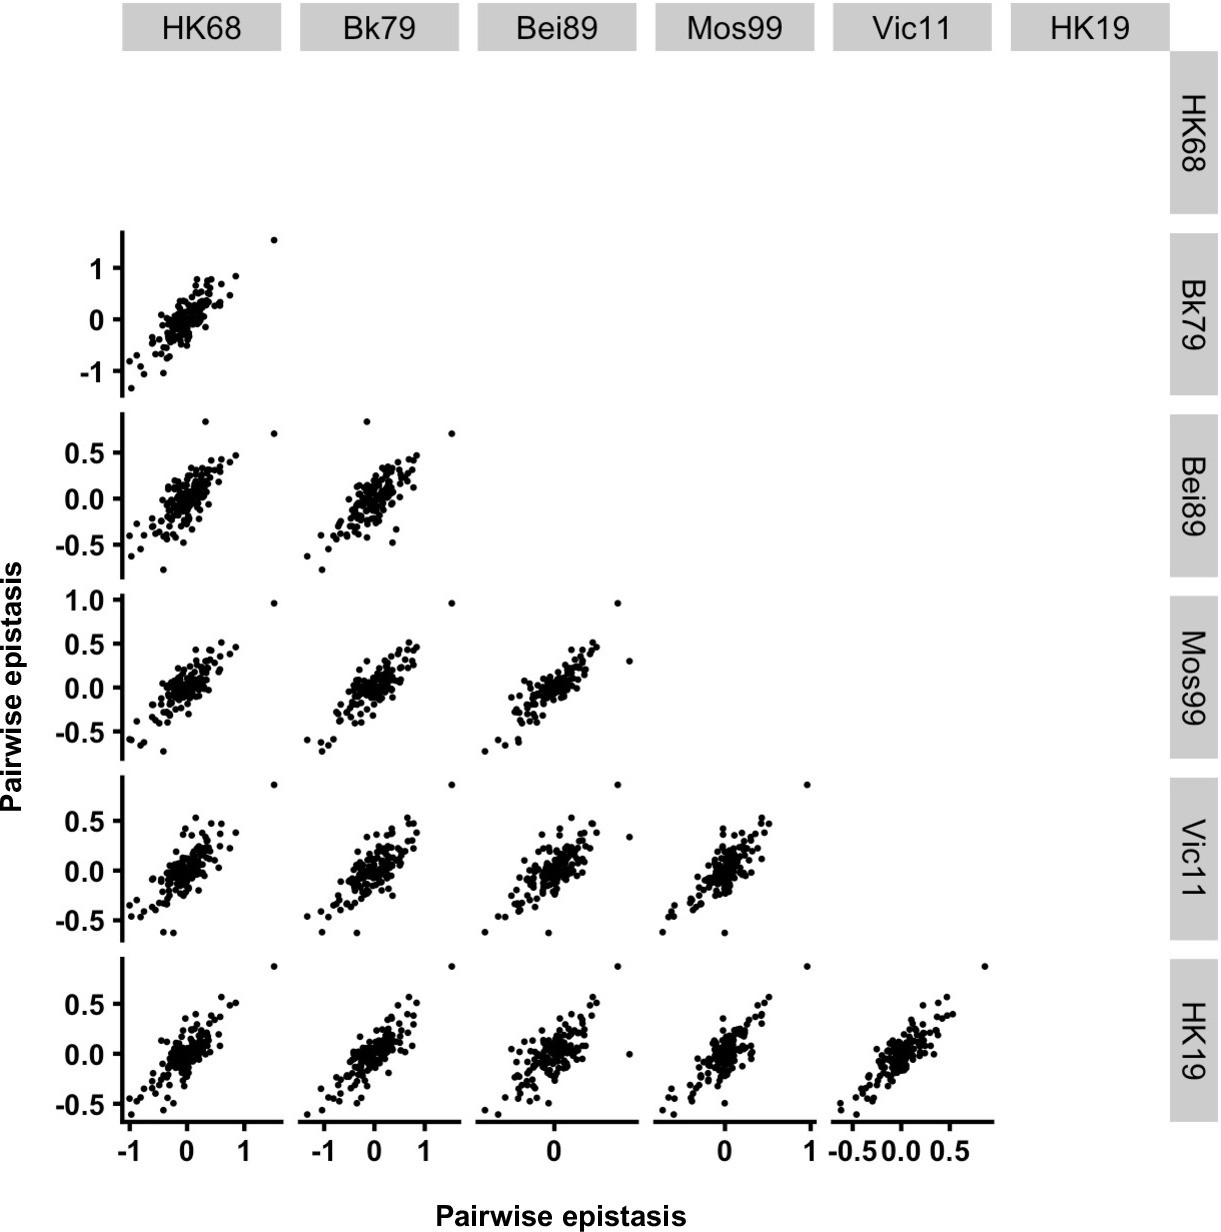
Correlations of pairwise epistasis among genetic backgrounds.
The 153 parameters for pairwise epistasis are compared among genetic backgrounds, with each data point representing one parameter. The correlations of pairwise epistasis among genetic backgrounds are generally strong (Pearson correlation = 0.69–0.86).
Figure 3—figure supplement 4
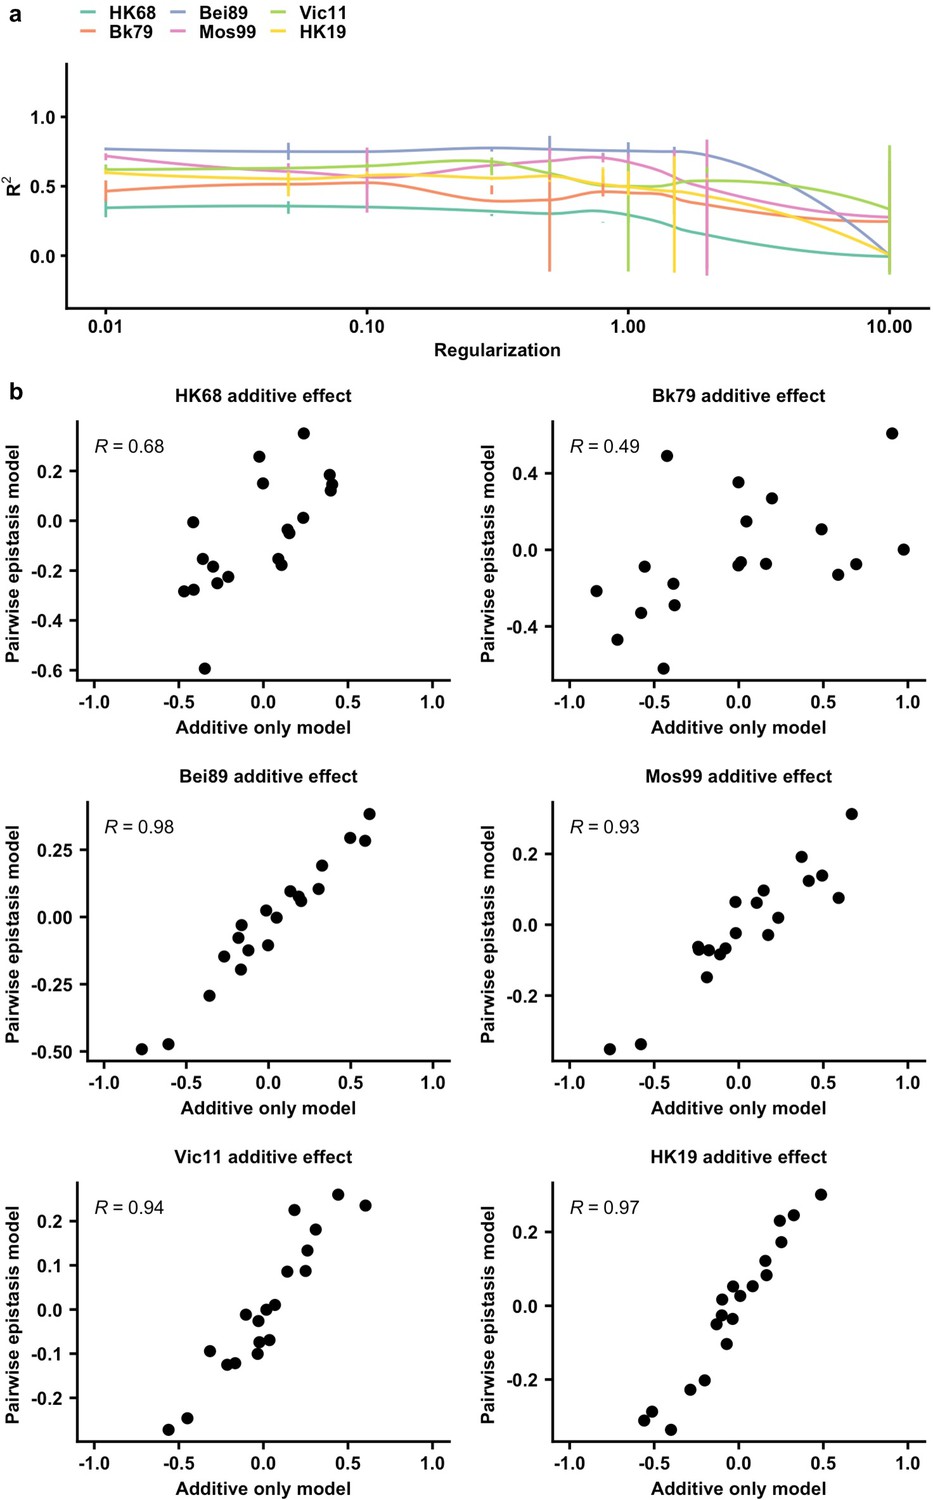
Evaluation of additive-only model.
(a) The relationship between different regularization hyperparameter and model fit is evaluated. The best R2 for the additive-only model are 0.38 (HK68), 0.51 (Bk79), 0.8 (Bei89), 0.71 (Mos99), 0.65 (Vic11), and 0.6 (HK19), and the best R2 for the pairwise model are 0.48 (HK68), 0.7 (Bk79), 0.88 (Bei89), 0.86 (Mos99), 0.86 (Vic11), and 0.82 (HK19), respectively. (b) The inferred additive fitness effects correlation between two models. Pearson correlation is indicated.
Figure 3—figure supplement 5
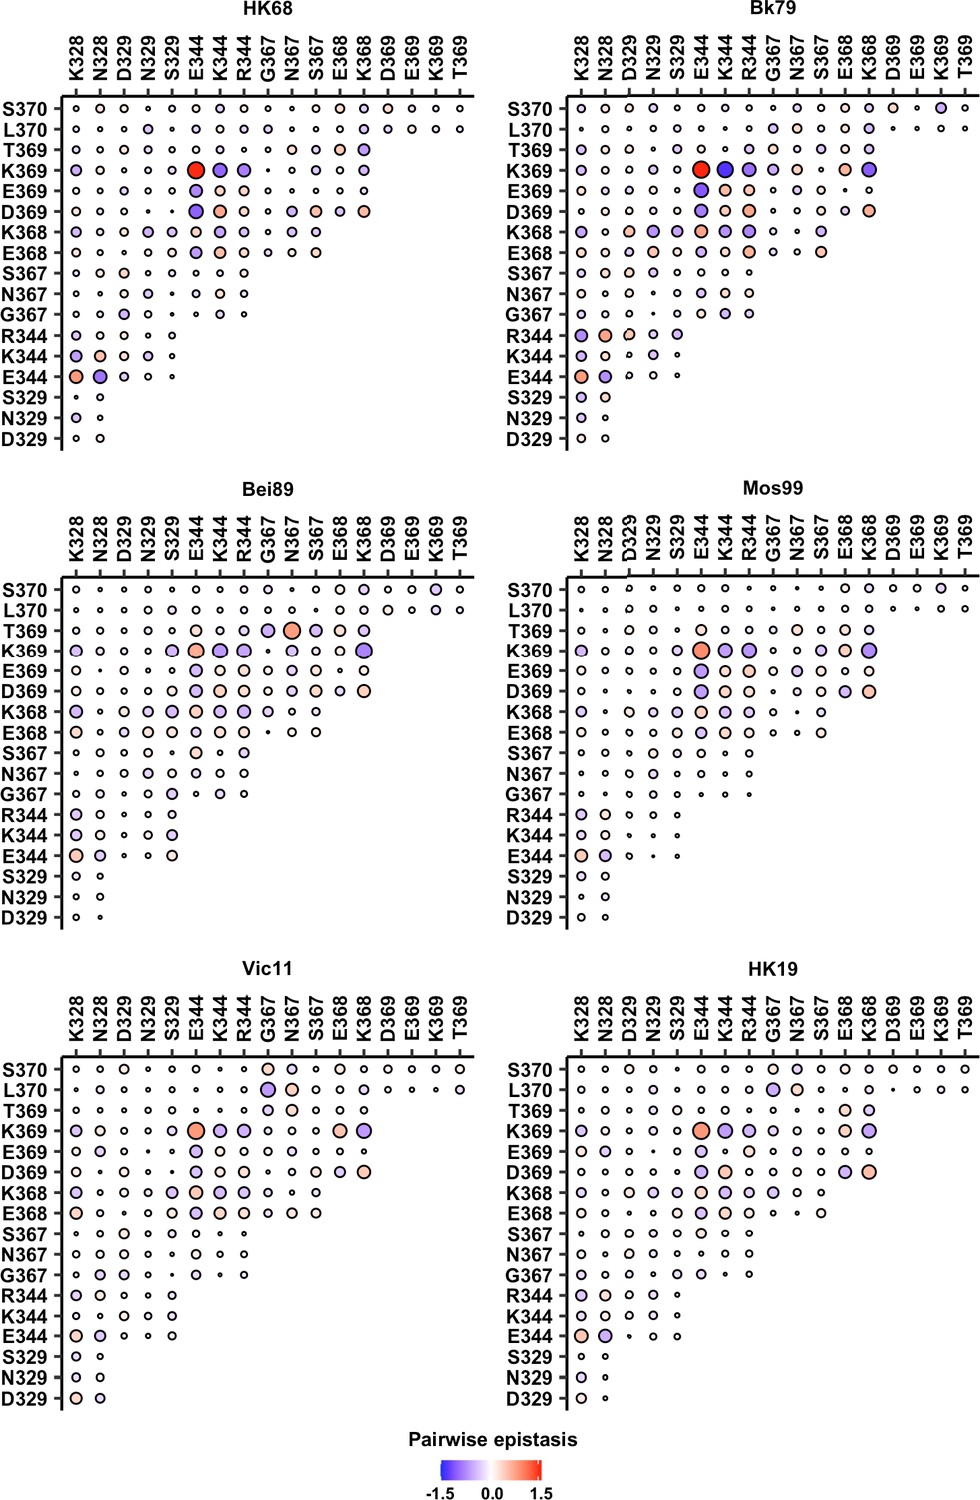
Pairwise epistasis in different genetic backgrounds.
Positive epistasis is in red, while negative epistasis is in blue. The magnitude of epistasis is proportional to the size of the circle. The identity of a given double amino acid variant is represented by the labels on the x- and y-axes.
Figure 4 with 4 supplements
The importance of local net charge in the neuraminidase (NA) antigenic region.
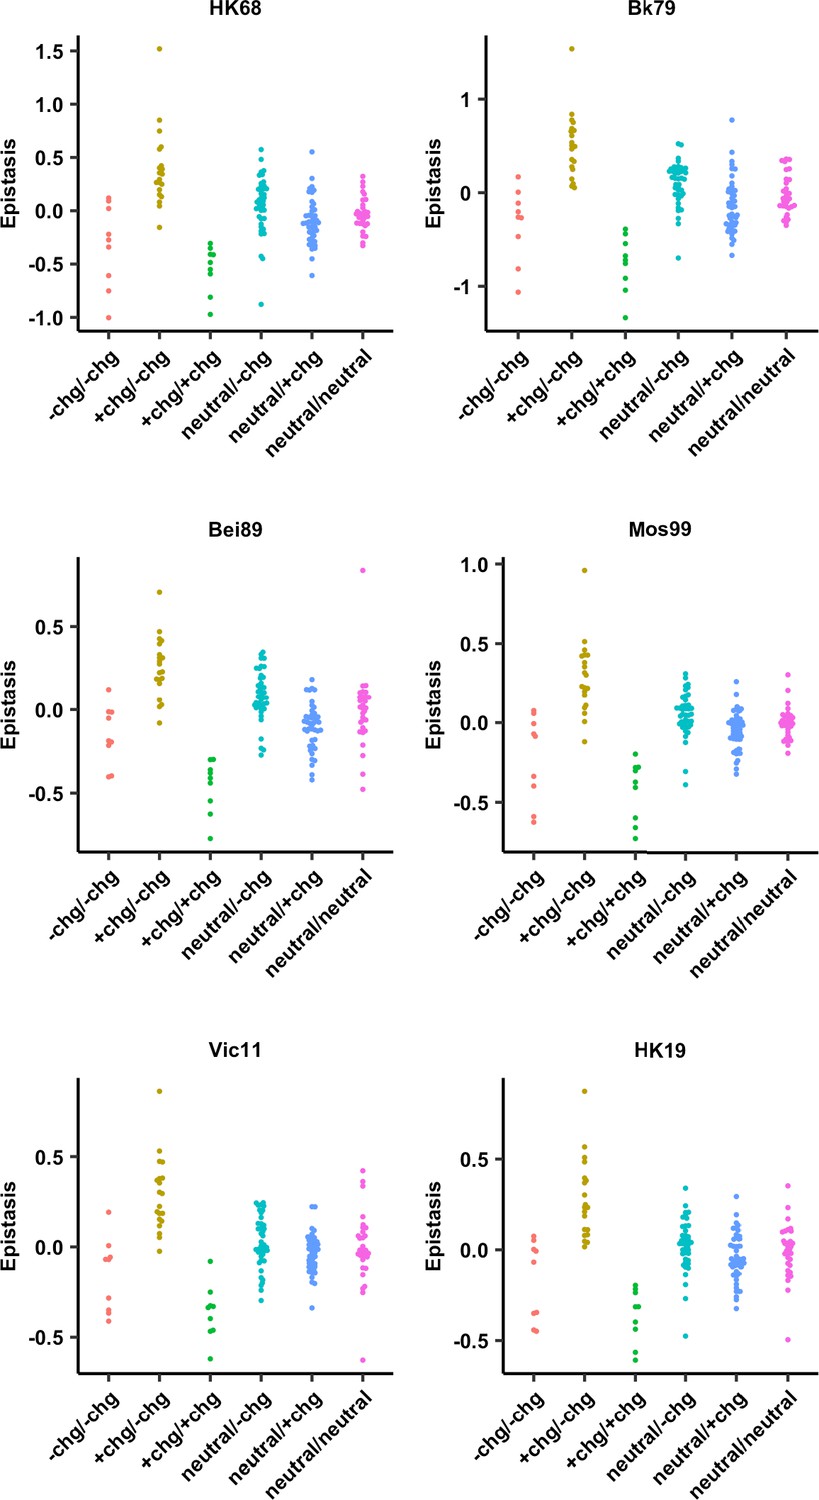
(a) Pairwise epistasis in genetic background Bk79 is shown and classified based on amino acid charges. +chg represents positively charged amino acids (K/R), -chg represents negatively charged amino acids (D/E), and neutral represents the remaining amino acids. The same plots for other genetic backgrounds are shown in Figure 4—figure supplement 1. (b) NA structure from H3N2 A/Memphis/31/98 (PDB 2AEP), which has K328, E344, and K369, was analyzed (Gulati et al., 2002). A similar NA structure from H3N2 A/Tanzania/205/2010, which has K328 and E344, is shown in Figure 4—figure supplement 2. (c) The relationship between variant fitness and net charge in genetic background Bk79 is shown. A smooth curve was fitted by loess and shown in teal. The same plots for other genetic backgrounds are shown in Figure 4—figure supplement 4. (d–f) Relationship between the side-chain–side-chain distances (Figure 4—source data 1) and epistasis for (d) variant pairs with opposite charges, (e) variant pairs with the same charge, and (f) variant pairs that involve a neutral amino acid in genetic background Bk79 is shown. The same plots for other genetic backgrounds are shown in Figure 4—figure supplement 3. Pearson correlation coefficient (R) is indicated.
-
Figure 4—source data 1
Pairwise side-chain–side-chain distances within neuraminidase (NA) antigenic region.
- https://cdn.elifesciences.org/articles/72516/elife-72516-fig4-data1-v2.zip
Figure 4—figure supplement 1
Pairwise epistasis was classified based on the side-chain charge in each pair of amino acid variants.
+chg represents positively charged amino acids (K/R), -chg represents negatively charged amino acids (D/E), and neutral charge represents the remaining amino acids.
Figure 4—figure supplement 2
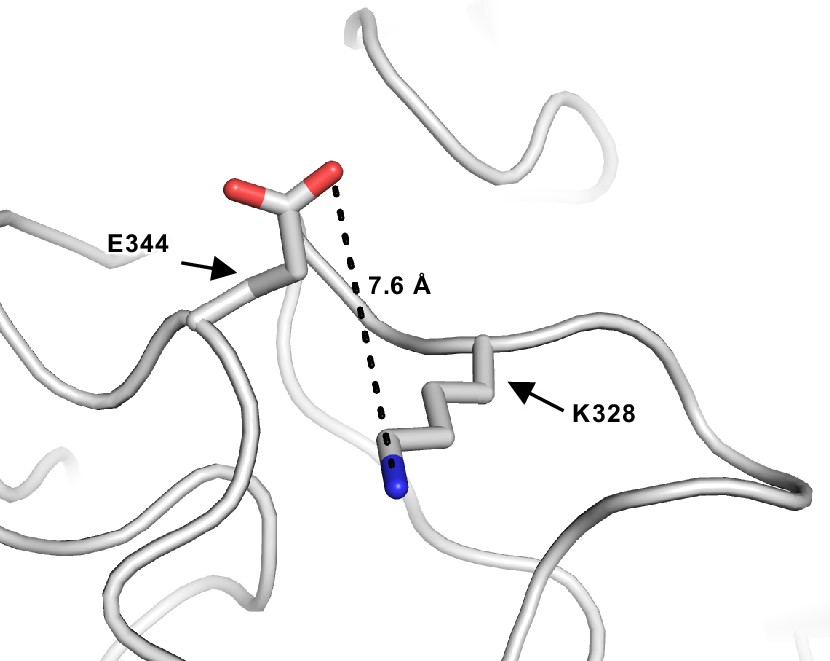
Neuraminidase (NA) structure from H3N2 A/Tanzania/205/2010 (PDB 4GZO) (Zhu et al., 2012), which has K328 and E344, is shown.
The distance between the side-chain carboxylate oxygen of E344 and the side-chain amine nitrogen of K328 is indicated.
Figure 4—figure supplement 3
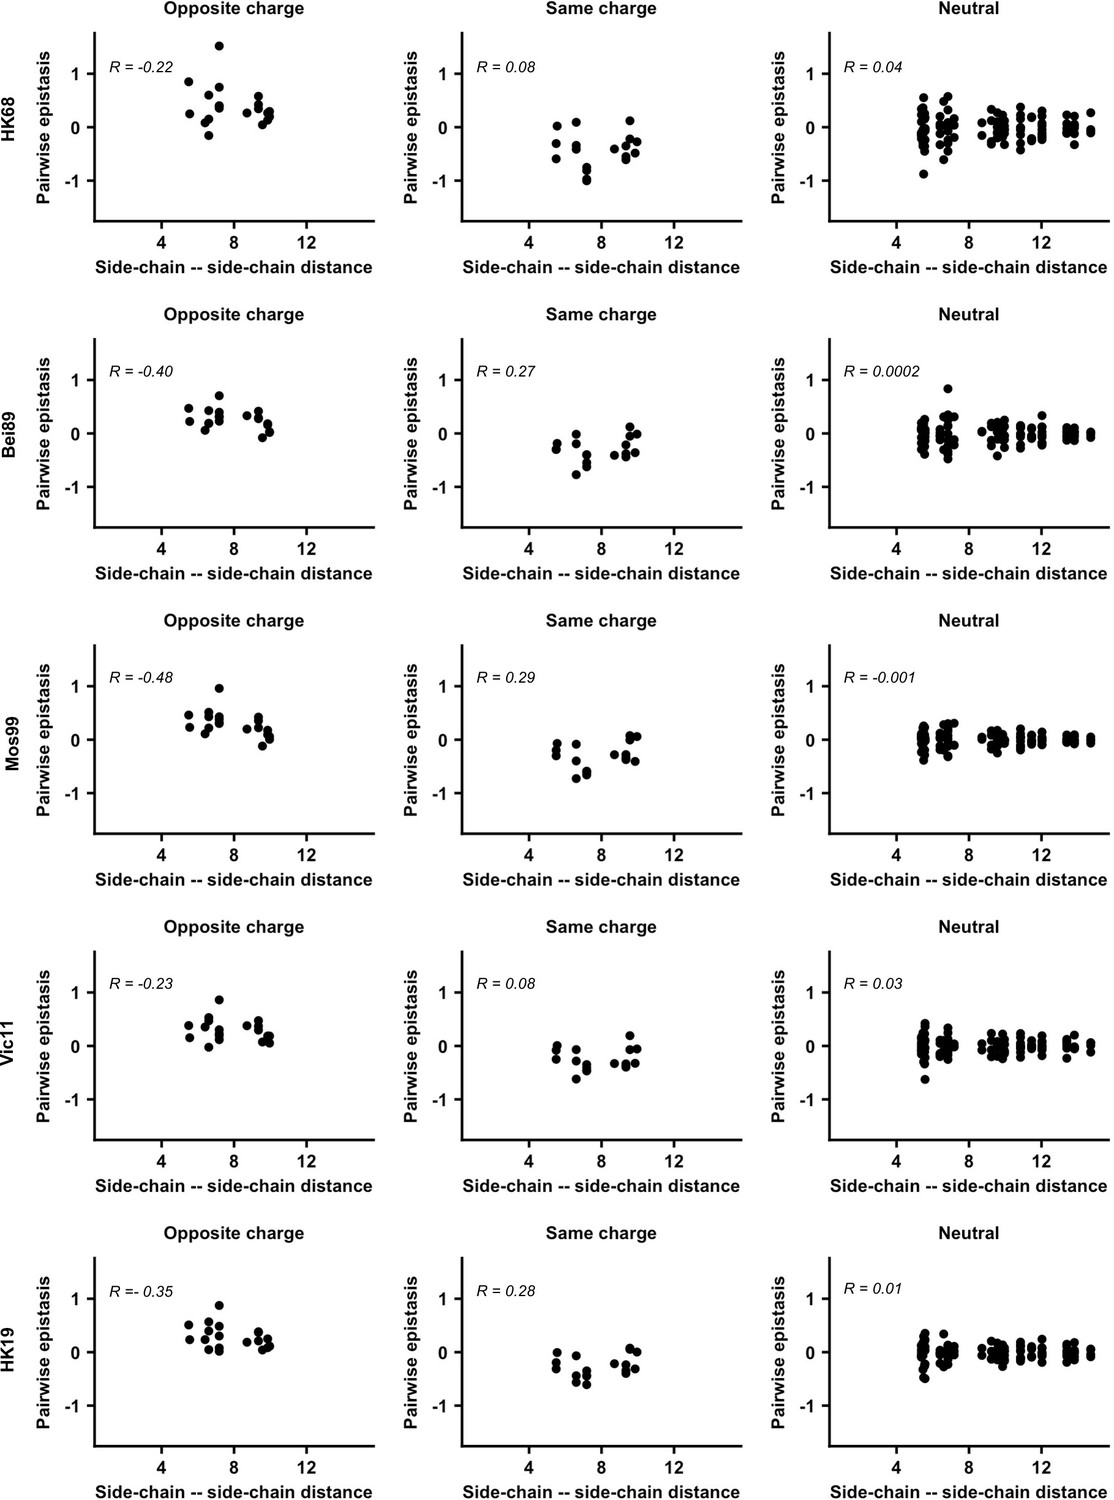
Relationship between the side-chain–side-chain distance and pairwise epistasis.
The side-chain–side-chain distance was computed based on the geometric center of the side-chain atoms from each residue of interest (Hockenberry and Wilke, 2019).
Figure 4—figure supplement 4
Relationship between variant fitness and the local net charge.
The relationship between variant fitness and the local net charge in the indicated genetic background is shown. A smooth curve was fitted by loess and shown in teal.
Figure 5 with 6 supplements
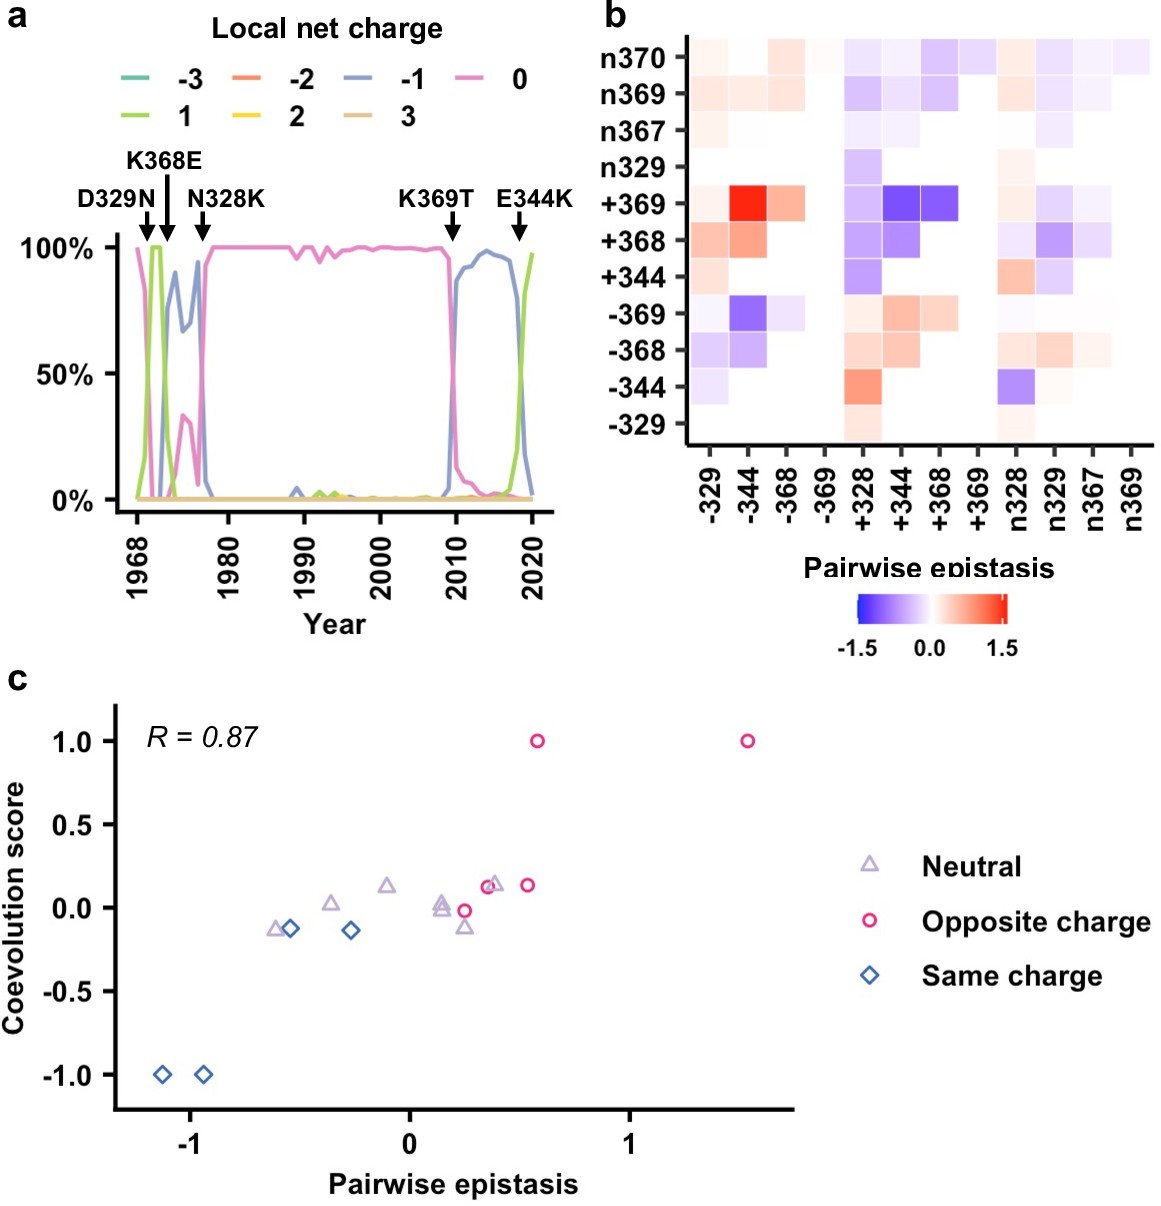
Correlation between epistasis and coevolution of charge states in the neuraminidase (NA) antigenic region.
(a) The natural evolution of frequency of haplotypes by local net charge at the NA antigenic region of interest is shown (Figure 5—source data 1). Key mutation events that led to changes in local net charge are indicated. (b) Pairwise epistasis of charge states among different residues. Amino acids were classified based on charges. (+) represents positively charged amino acids (K/R). (-) represents negatively charged amino acids (D/E). (n) represents the remaining amino acids. (c) Relationship between coevolution score (Figure 5—source data 2) and pairwise epistasis in genetic background Bk79 is shown. Pearson correlation coefficient (R) is indicated. The same plots for other genetic backgrounds are shown in Figure 5—figure supplement 4.
-
Figure 5—source data 1
The local net charge at the neuraminidase (NA) antigenic region of interest in different strains from 1968 to 2020.
- https://cdn.elifesciences.org/articles/72516/elife-72516-fig5-data1-v2.zip
-
Figure 5—source data 2
Pairwise coevolution score for pairs of charge states that emerge or disappear within 5 years.
- https://cdn.elifesciences.org/articles/72516/elife-72516-fig5-data2-v2.csv
Figure 5—figure supplement 1
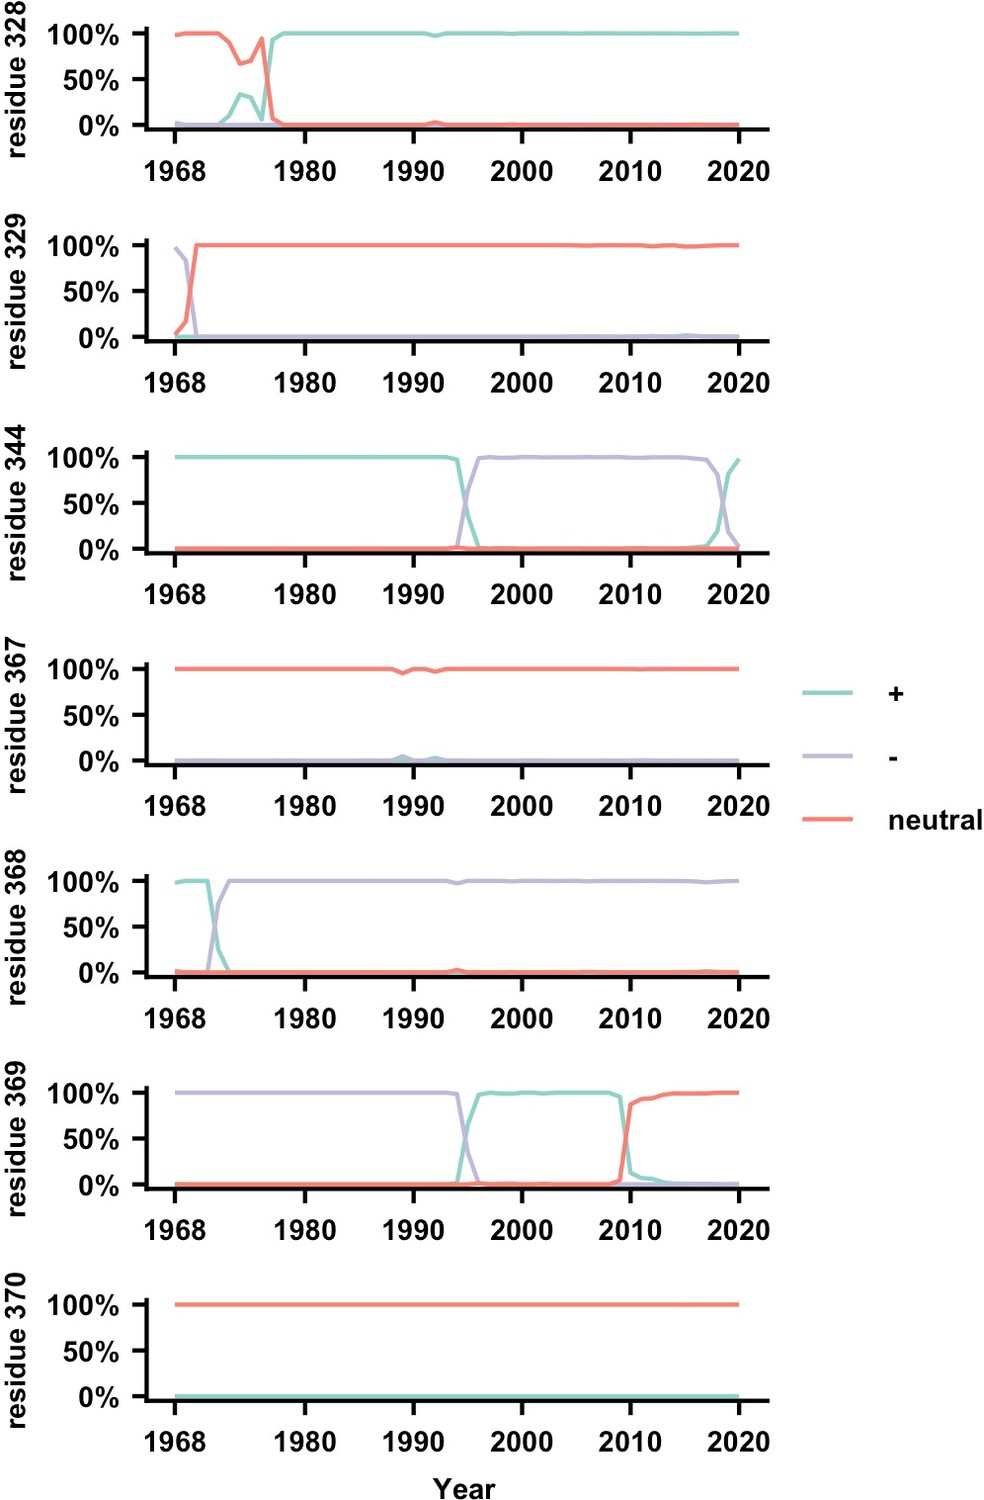
The natural occurrence frequencies of the major amino acid charge states are shown.
(+) represents positively charged amino acids (K/R), (-) represents negatively charged amino acids (D/E), and (n) represents the remaining amino acids.
Figure 5—figure supplement 2
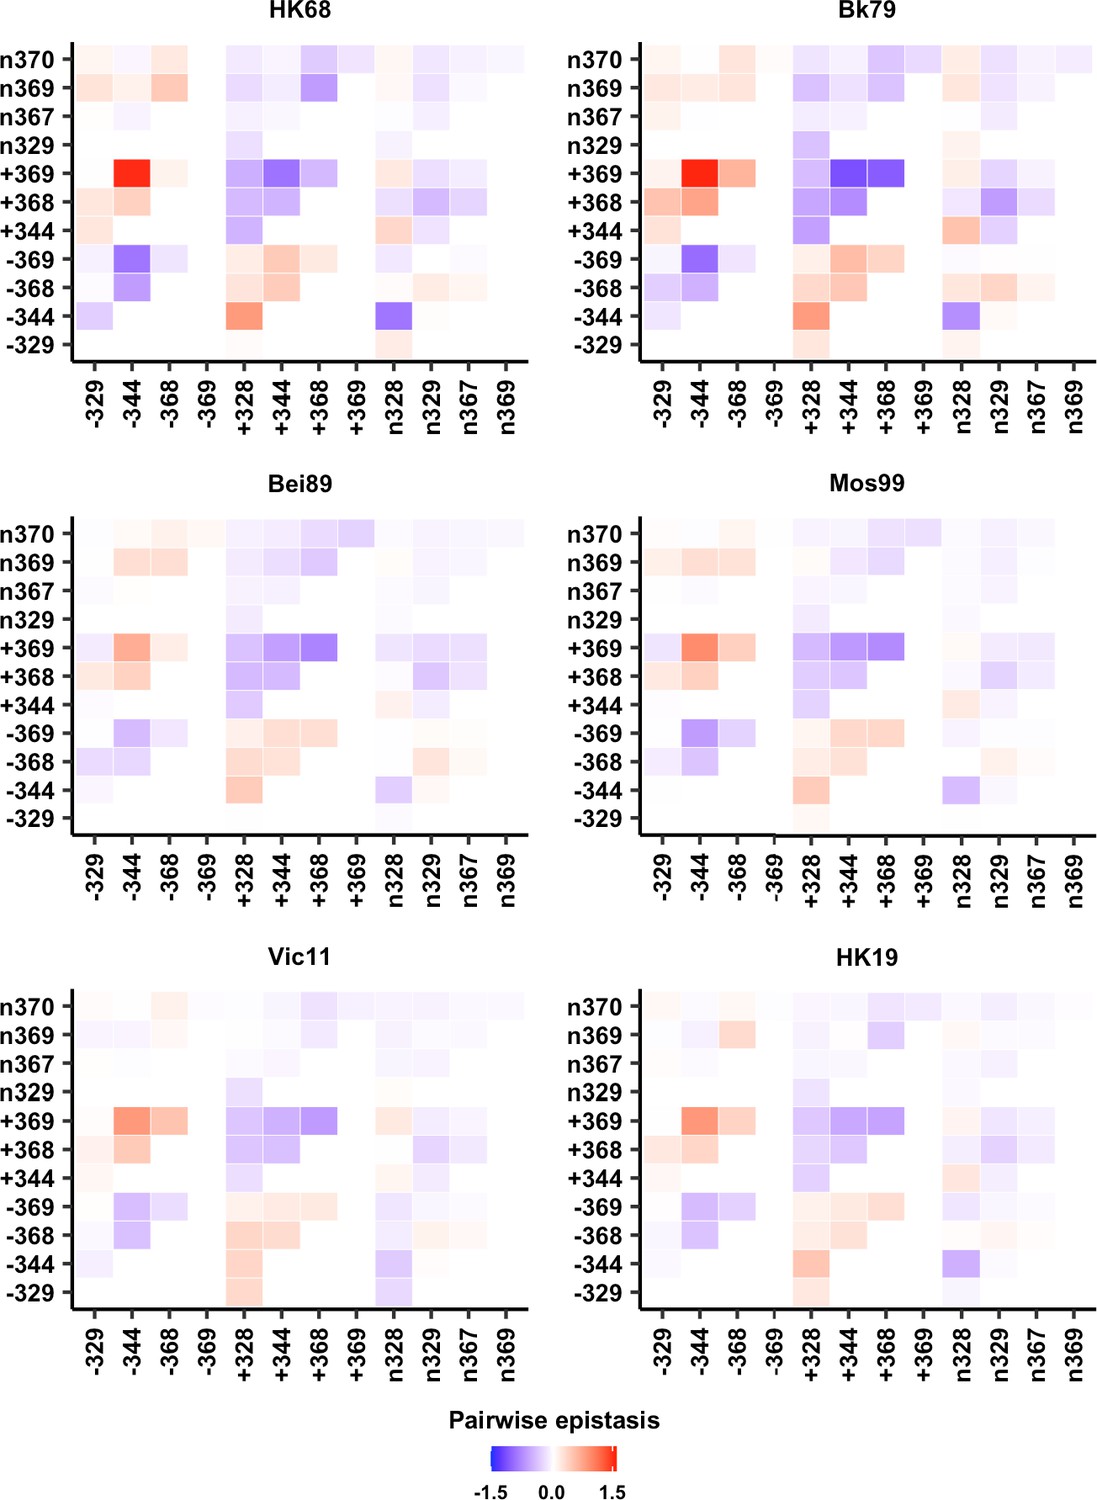
Pairwise epistasis of charged states among seven residues.
Amino acids were classified based on their charge state. (+) represents positively charged amino acids (K/R), (-) represents negatively charged amino acids (D/E), and (n) represents the remaining amino acids. For instance, –344 represents negatively charged amino acids (D/E) at residue 344. The epistasis of +344/–369 would then be the average among that of K344/D369, R344/D369, K344/E369, and R344/E369.
Figure 5—figure supplement 3
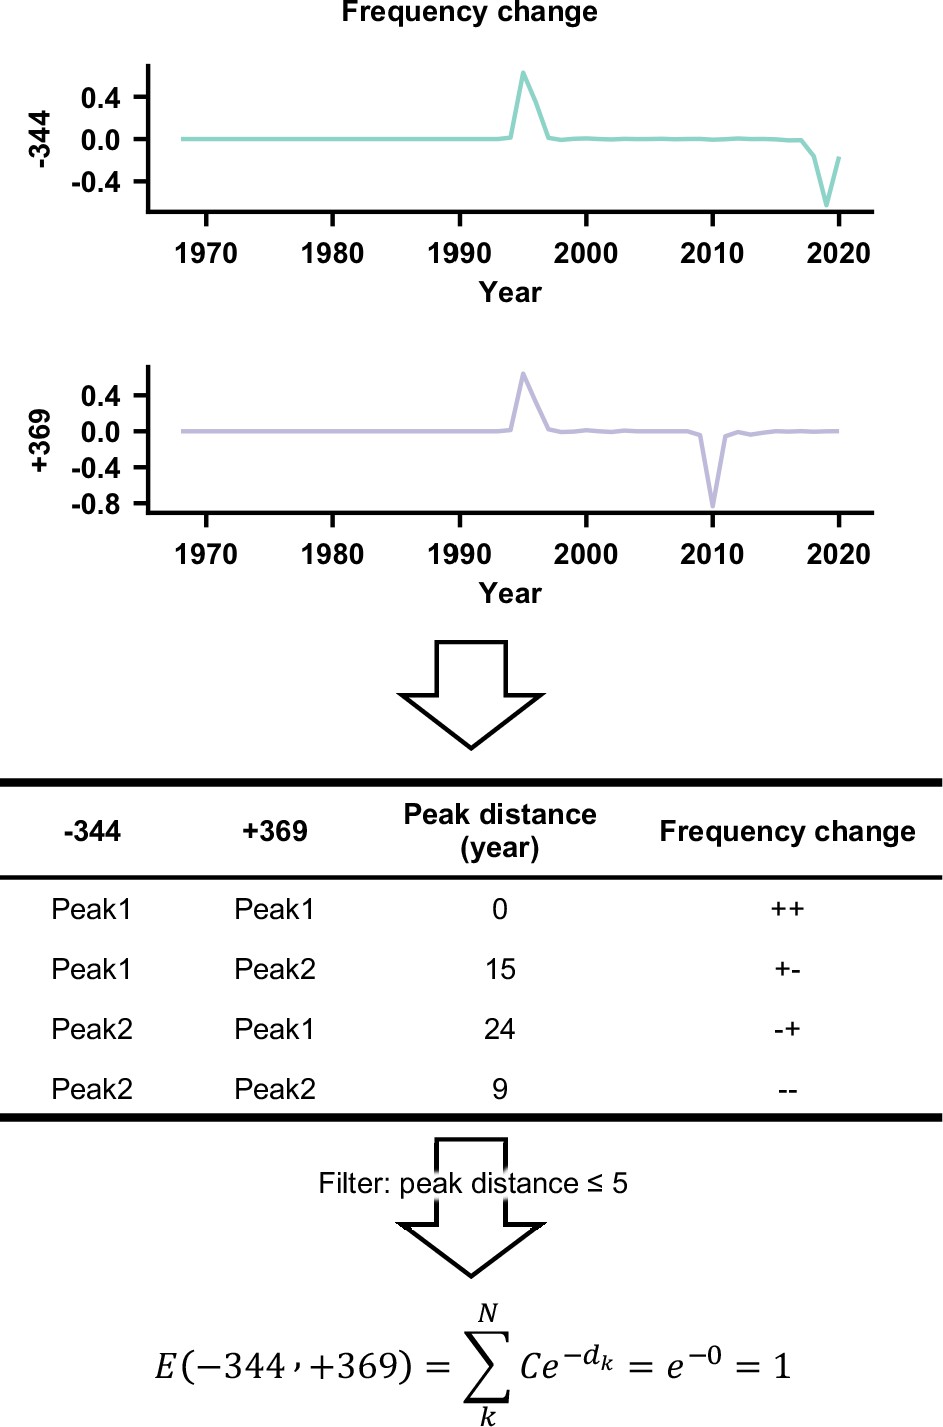
Schematic overview of calculating the coevolution score.
The natural frequency changes of amino acids charges at residues 328, 329, 344, 367, 368, 369 and 370 from year to year were calculated. In this simplified example here, one pair of charge states (–344/+369) was used for demonstration. –344 represents negatively charged amino acids (D/E) at residue 344 and +369 means positively charged amino acids (K/R) at residue 369. The frequency change represents frequency in year n minus frequency in year n–1. Both –344 and +369 have two peaks that are above our cutoff of 5% frequency change. Subsequently, peaks from different residues were compared and the distance between each pair of peaks was calculated. Each pair of peaks was classified based on their signs. For example, ‘++’ represents both peaks are positive in magnitude. Eventually, coevolution score of a given pair of charge states was calculated as the sum of exponential decay function of all pairwise peak distances. C = 1 if both peaks have the same sign (++ or --), otherwise C = –1 (+- or -+). In this study, pairs of peaks with a time separation of larger than 5 years were discarded.
Figure 5—figure supplement 4
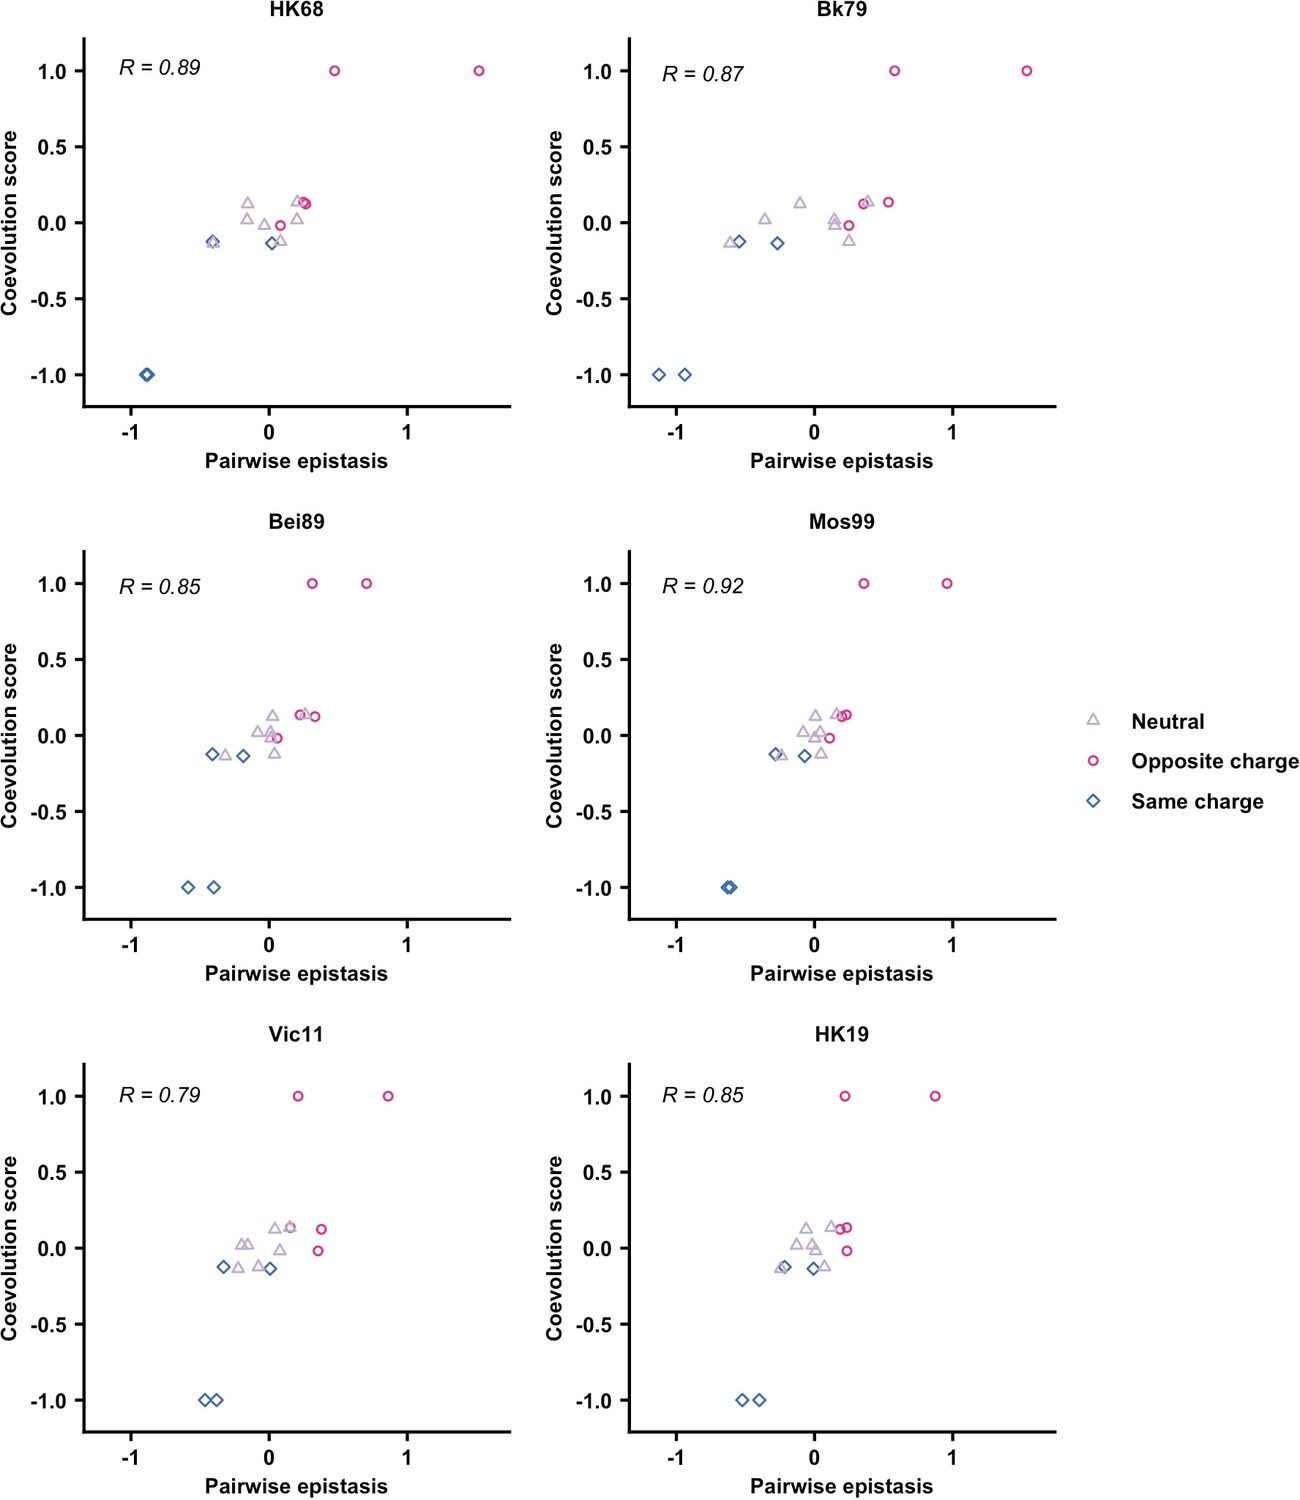
Correlations between coevolution score and pairwise epistasis in different genetic backgrounds.
The relationship between the coevolution score and pairwise epistasis of charge states in the indicated genetic background is shown. Pearson correlation is indicated.
Figure 5—figure supplement 5
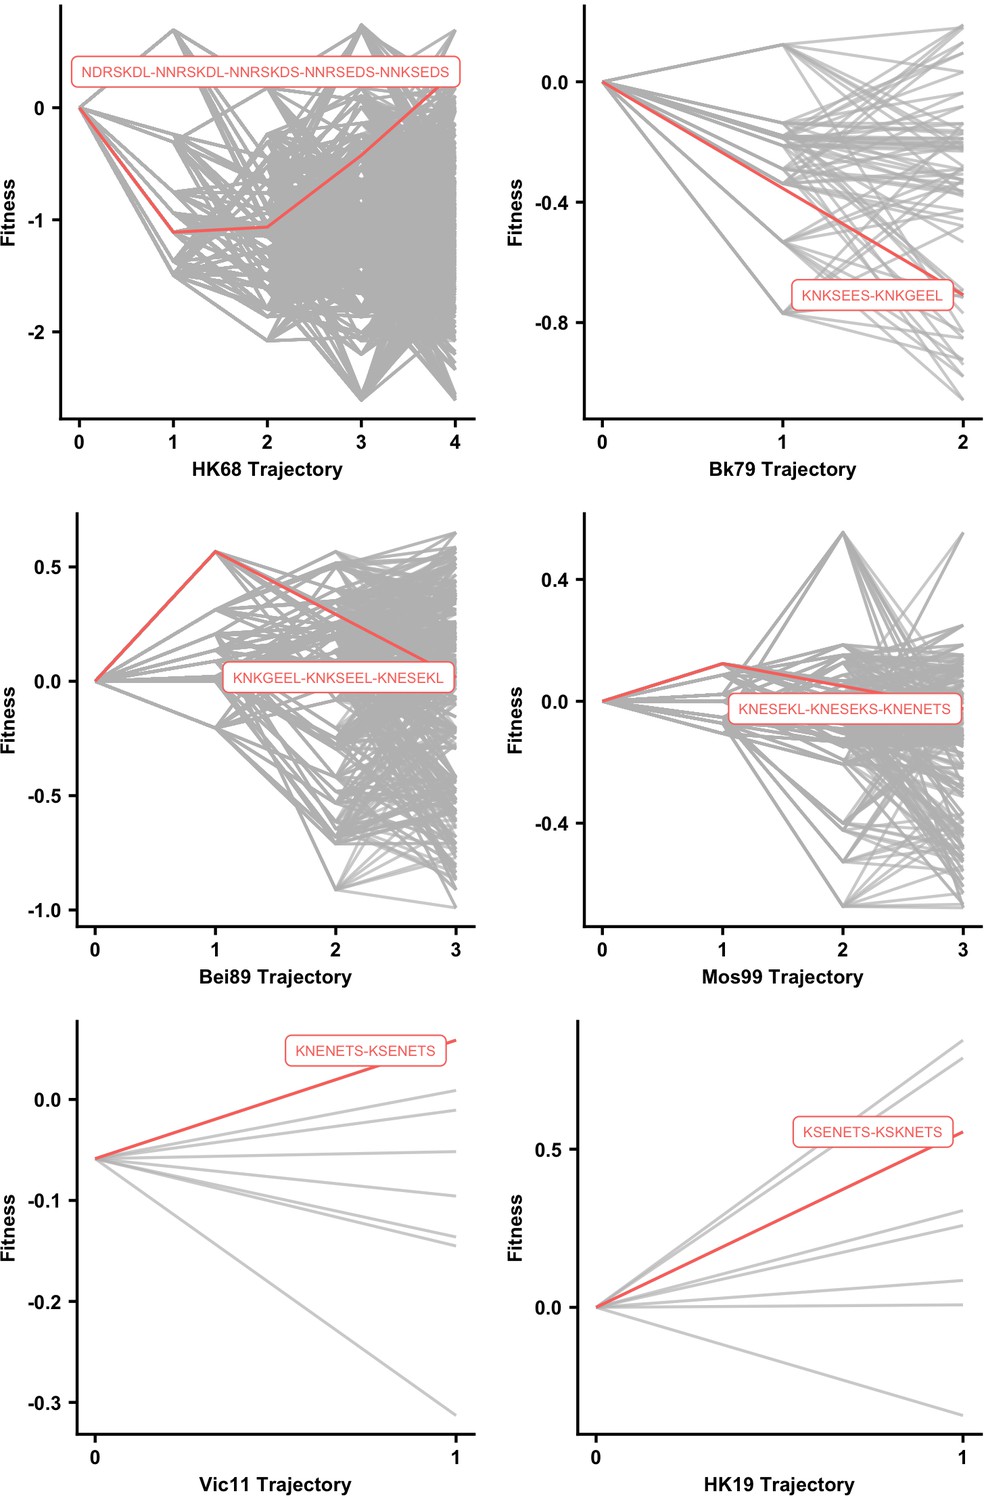
An ensemble of evolutionary trajectories constructed from fitness data.
Evolutionary trajectories were constructed based on the fitness data (see Materials and methods). The realized trajectory in nature is highlighted in red. This result demonstrates that natural evolutionary trajectory does not always maximize the replication fitness. This discrepancy is likely due to other selection pressures in nature (e.g., immune selection pressure) that were not being captured in our in vitro fitness measurement or due to changes in the genetic background through epistatic interactions that were not captured by our experiments.
Figure 5—figure supplement 6
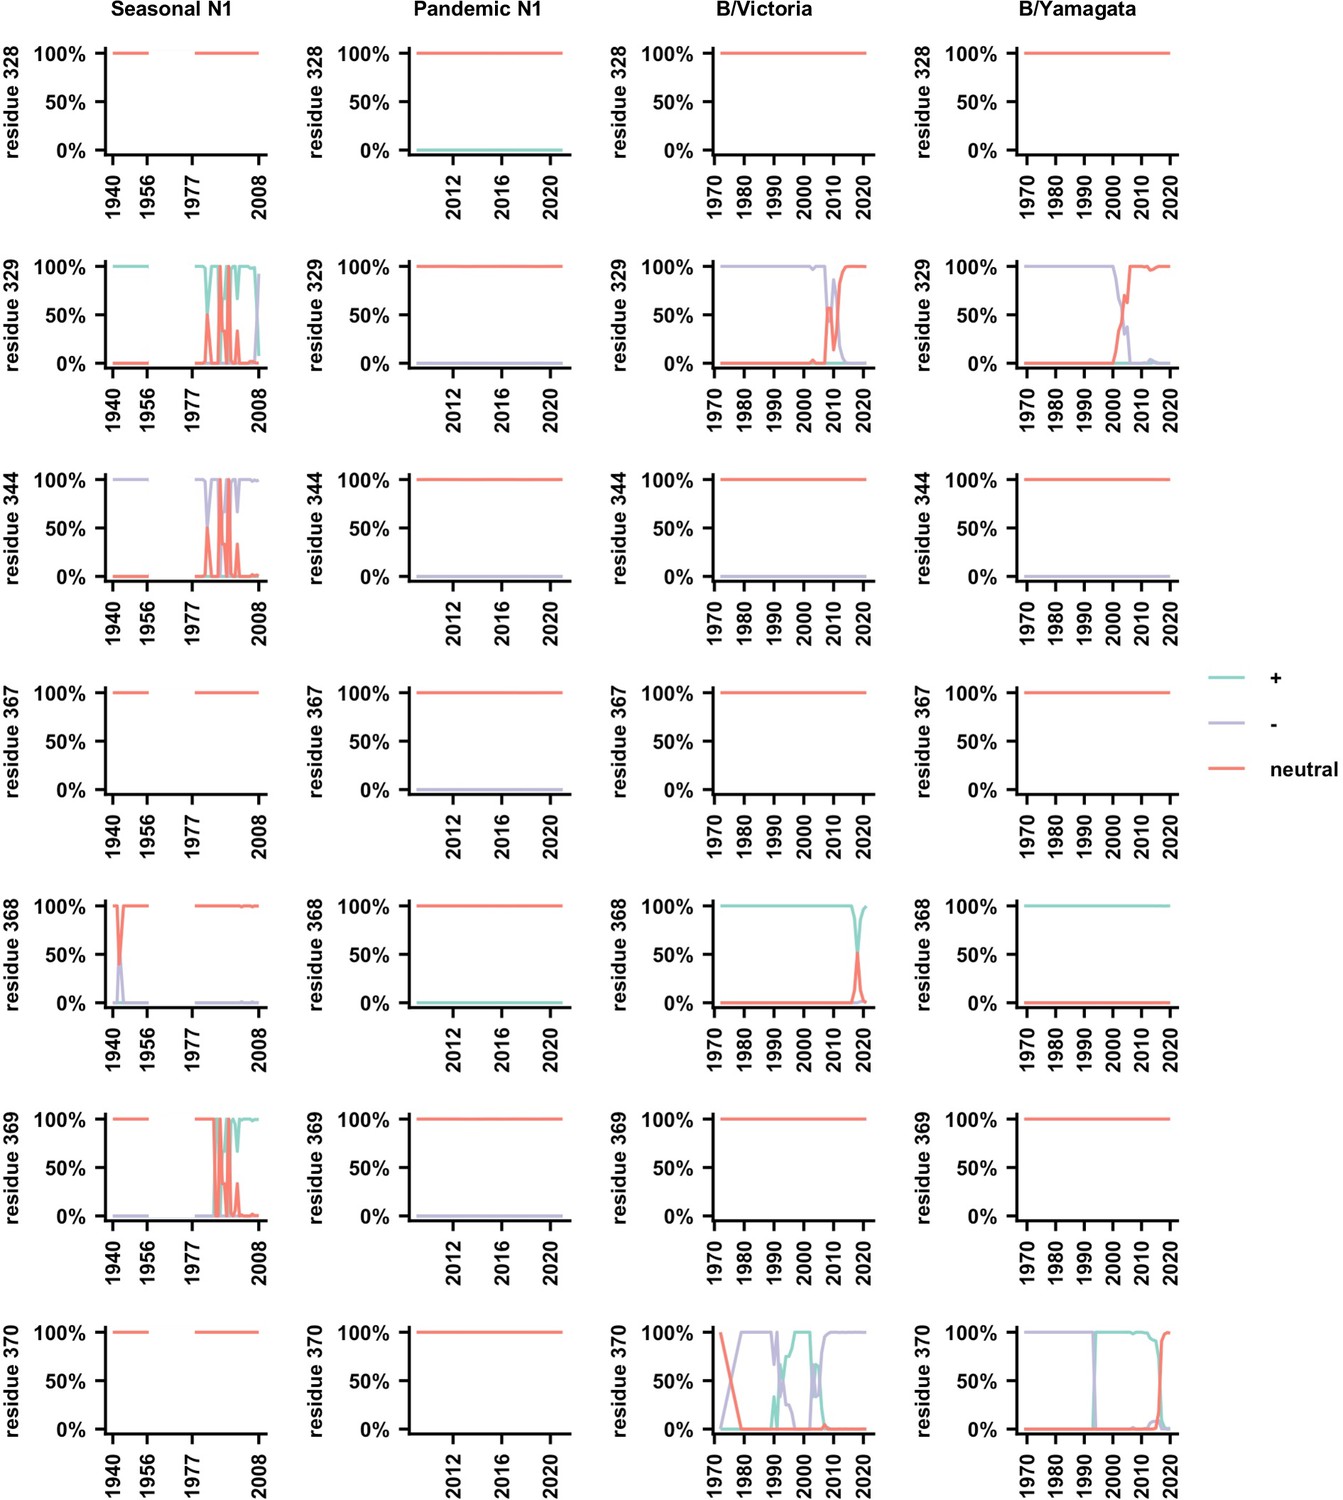
The natural occurrence frequencies of the charge states in the homologous regions of H1N1 and influenza B are shown.
(+) represents positively charged amino acids (K/R), (-) represents negatively charged amino acids (D/E), and (n) represents the remaining amino acids. N2 numbering is used in this analysis.
Tables
Key resources table
| Reagent type (species) or resource | Designation | Source or reference | Identifiers | Additional information |
|---|---|---|---|---|
| Cell line (Homo sapiens) | MDCK-SIAT1 | Sigma-Aldrich | Cat#: 05071502-1VL | |
| Cell line (H. sapiens) | HEK 293T | Scripps Research | N/A | |
| Strain, strain background (Escherichia coli) | MegaX DH10B T1R | Thermo Fisher Scientific | Cat#: C640003 | |
| Recombinant DNA reagent | A/WSN/33 (H1N1) eight-plasmid reverse genetics system | Neumann et al., 1999 | N/A | |
| Commercial assay or kit | Lipofectamine 2000 | Thermo Fisher Scientific | Cat#: 11668019 | |
| Commercial assay or kit | KOD Hot Start DNA Polymerase | EMD Millipore | Cat#: 71086-3 | |
| Software, algorithm | Python | Python Software Foundation | RRID:SCR_008394 | |
| Software, algorithm | R | R Core Team | RRID:SCR_001905 |
Additional files
-
Supplementary file 1
Primer sequences.
- https://cdn.elifesciences.org/articles/72516/elife-72516-supp1-v2.xlsx
-
Supplementary file 2
Number of human H3N2 neuraminidase (NA) sequences per year.
- https://cdn.elifesciences.org/articles/72516/elife-72516-supp2-v2.tsv
-
Transparent reporting form
- https://cdn.elifesciences.org/articles/72516/elife-72516-transrepform1-v2.pdf
Download links
A two-part list of links to download the article, or parts of the article, in various formats.
Downloads (link to download the article as PDF)
Open citations (links to open the citations from this article in various online reference manager services)
Cite this article (links to download the citations from this article in formats compatible with various reference manager tools)
Antigenic evolution of human influenza H3N2 neuraminidase is constrained by charge balancing
eLife 10:e72516.
https://doi.org/10.7554/eLife.72516


