Cell-type-specific responses to associative learning in the primary motor cortex
- Department of Cellular and Molecular Medicine, University of Ottawa, Canada
- Department of Physics, STEM Complex, University of Ottawa, Canada
- Brain and Mind Research Institute, University of Ottawa, Canada
- Center for Neural Dynamics, University of Ottawa, Canada
Figures
Figure 1
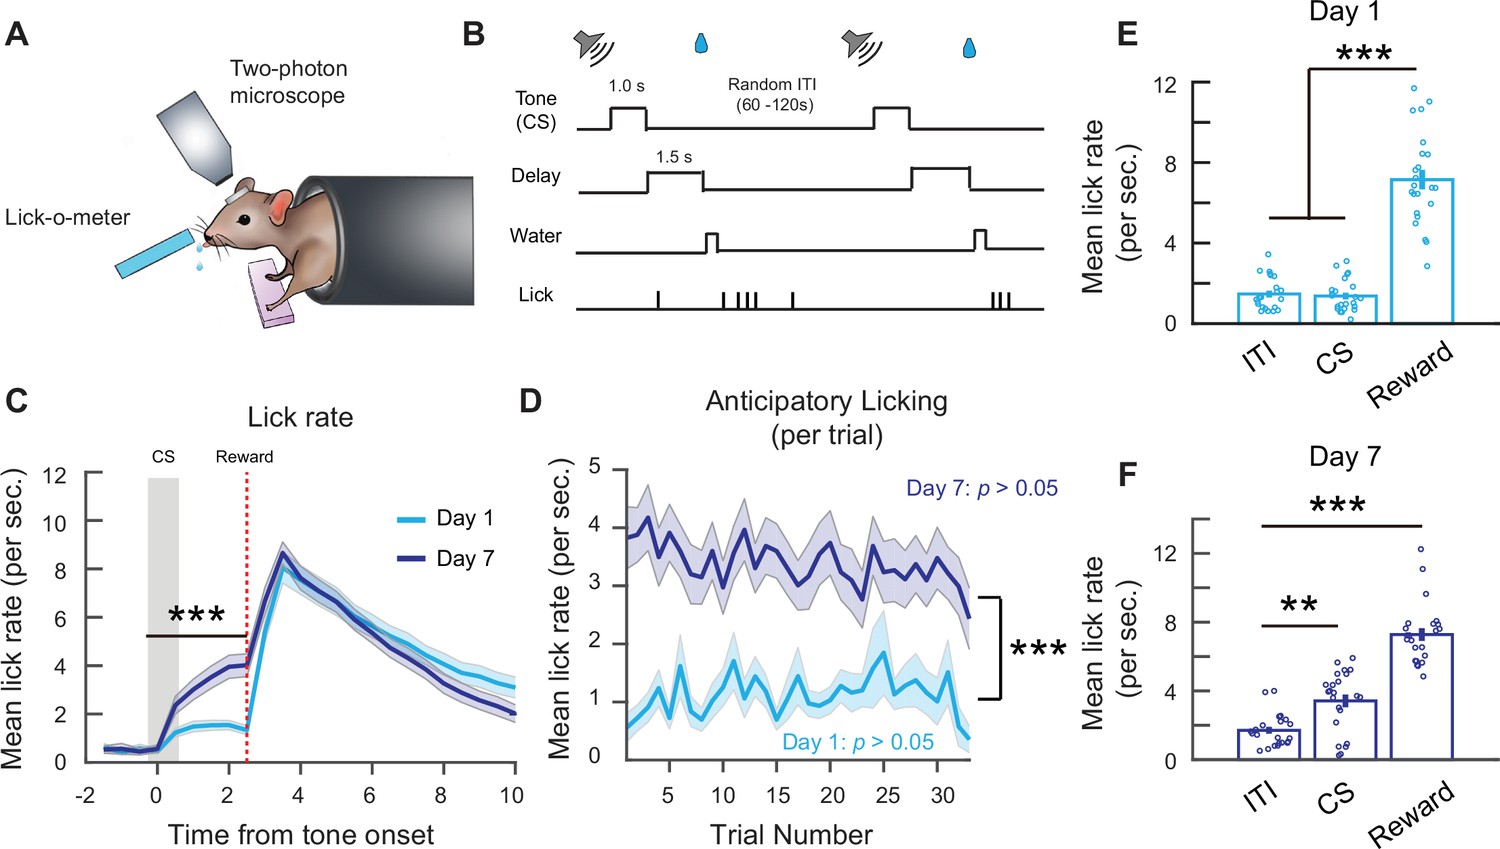
Associative learning during a head-fixed classical conditioning task.
(A) Schematic of head-fixed classical conditioning task. (B) Trial structure. (C) Mean lick rate per second on days 1 and 7. Binned over 0.5-s intervals. Lick rate following cue stimulus (CS) onset up to reward delivery time is higher on day 7. Two-way analysis of variance (ANOVA), ***p < 1 × 10⁻³, effect of time: p < 1 × 10⁻³, effect of day: p < 1 × 10⁻³. (D) Mean anticipatory lick rate across trials within days 1 and 7 sessions. Mean anticipatory lick rate was calculated from CS onset to end of delay period. Two-way ANOVA, effect of trial number: p = 0.91, effect of day: p < 1 × 10⁻³. (E) Mean lick rate during the first 2.5 s of intertrial interval (ITI) lick bouts, 2.5 s following CS onset and 2.5 s following reward delivery on day 1. Each point is the mean from an individual mouse. One-way ANOVA with Tukey–Kramer correction for multiple comparisons, ITI vs. CS: p = 0.97, ITI vs. reward: p < 1 × 10⁻³, CS vs. reward: p < 1 × 10⁻³. (F) Mean lick rate during the first 2.5 s of ITI lick bouts, 2.5 s following CS onset and 2.5 s following reward delivery on day 7. Each point is the mean from an individual mouse. One-way ANOVA with Tukey–Kramer correction for multiple comparisons. ITI vs. CS: p = 1.08 × 10⁻³, ITI vs. reward: p < 1 × 10⁻³. n = 23 mice. **p < 0.01, ***p < 0.001. Error bars show standard error of the mean (SEM).
Figure 2 with 2 supplements

Longitudinal in vivo Ca2+ imaging of neuronal responses in M1 during a classical conditioning task.
(A) Experimental timeline (top). In vivo two-photon imaging of L2/3 pyramidal neurons (PNs) expressing GCaMP6f in M1 (bottom left). The same population can be tracked from days 1 to 7 (bottom right). Yellow arrows indicate example tracked neurons across days. (B) Z-Scored fluorescence traces from 13 neurons (top), and the corresponding licking measured with the lick-o-meter (bottom) from the same mouse and same trial on day 1. Gray bar represents the timing of the cue stimulus (CS). Dotted red line indicates the onset of water reward delivery. (C) Z-Scored activity of all the active neurons from an example mouse during one representative trial on days 1 and 7, sorted by timing of maximum activity following the CS onset. Gray bar represents the timing of the CS. White line indicates the onset of water reward delivery. (D) Mean percent of active neurons within a session, irrespective of the behavioral task, for PNs, PV-INs, VIP-INs, and SOM-INs on days 1 and 7. All cell types showed a similar percentage of active neurons. One-way analysis of variance (ANOVA), n.s., nonsignificant, day 1: p = 0.38, day 7: p = 0.22. Error bars show standard error of the mean (SEM). (E–H) Mean percent of responsive neurons to CS (top) and reward (bottom) within 2.5 s of CS/reward onset for each cell type. Violin plots show null distribution of percentage of responsive neurons made by randomly resampling mice and shuffling the session, 1000 times (see Methods). The circle represents the mean percentage of tone- or reward-responsive neurons. Monte-Carlo with Bonferroni correction, n.s., nonsignificant, *p < 0.05, ***p < 1 × 10⁻³. PN CS day 1: p = 0.582, CS day 7: p = 0.423, Reward day 1: p < 1 × 10⁻³, Reward day 7: p = 0.015, n = 1029 cells from six mice (E), PV-IN CS day 1: p < 1 × 10⁻³, CS day 7: p < 1 × 10⁻³, Reward day 1: p < 1 × 10⁻³, Reward day 7: p < 1 × 10⁻³, n = 316 cells from six mice (F), VIP-IN CS day 1: p = 0.039, CS day 7: p < 1 × 10⁻³, Reward day 1: p < 1 × 10⁻³, Reward day 7: p < 1 × 10⁻³, n = 407 cells from four mice (G), SOM-IN CS day 1: p = 0.47 , CS day 7: p < 1 × 10⁻³, Reward day 1: p = 0.033, Reward day 7: p < 1 × 10⁻³, n = 189 cells from seven mice (H).
Figure 2—figure supplement 1
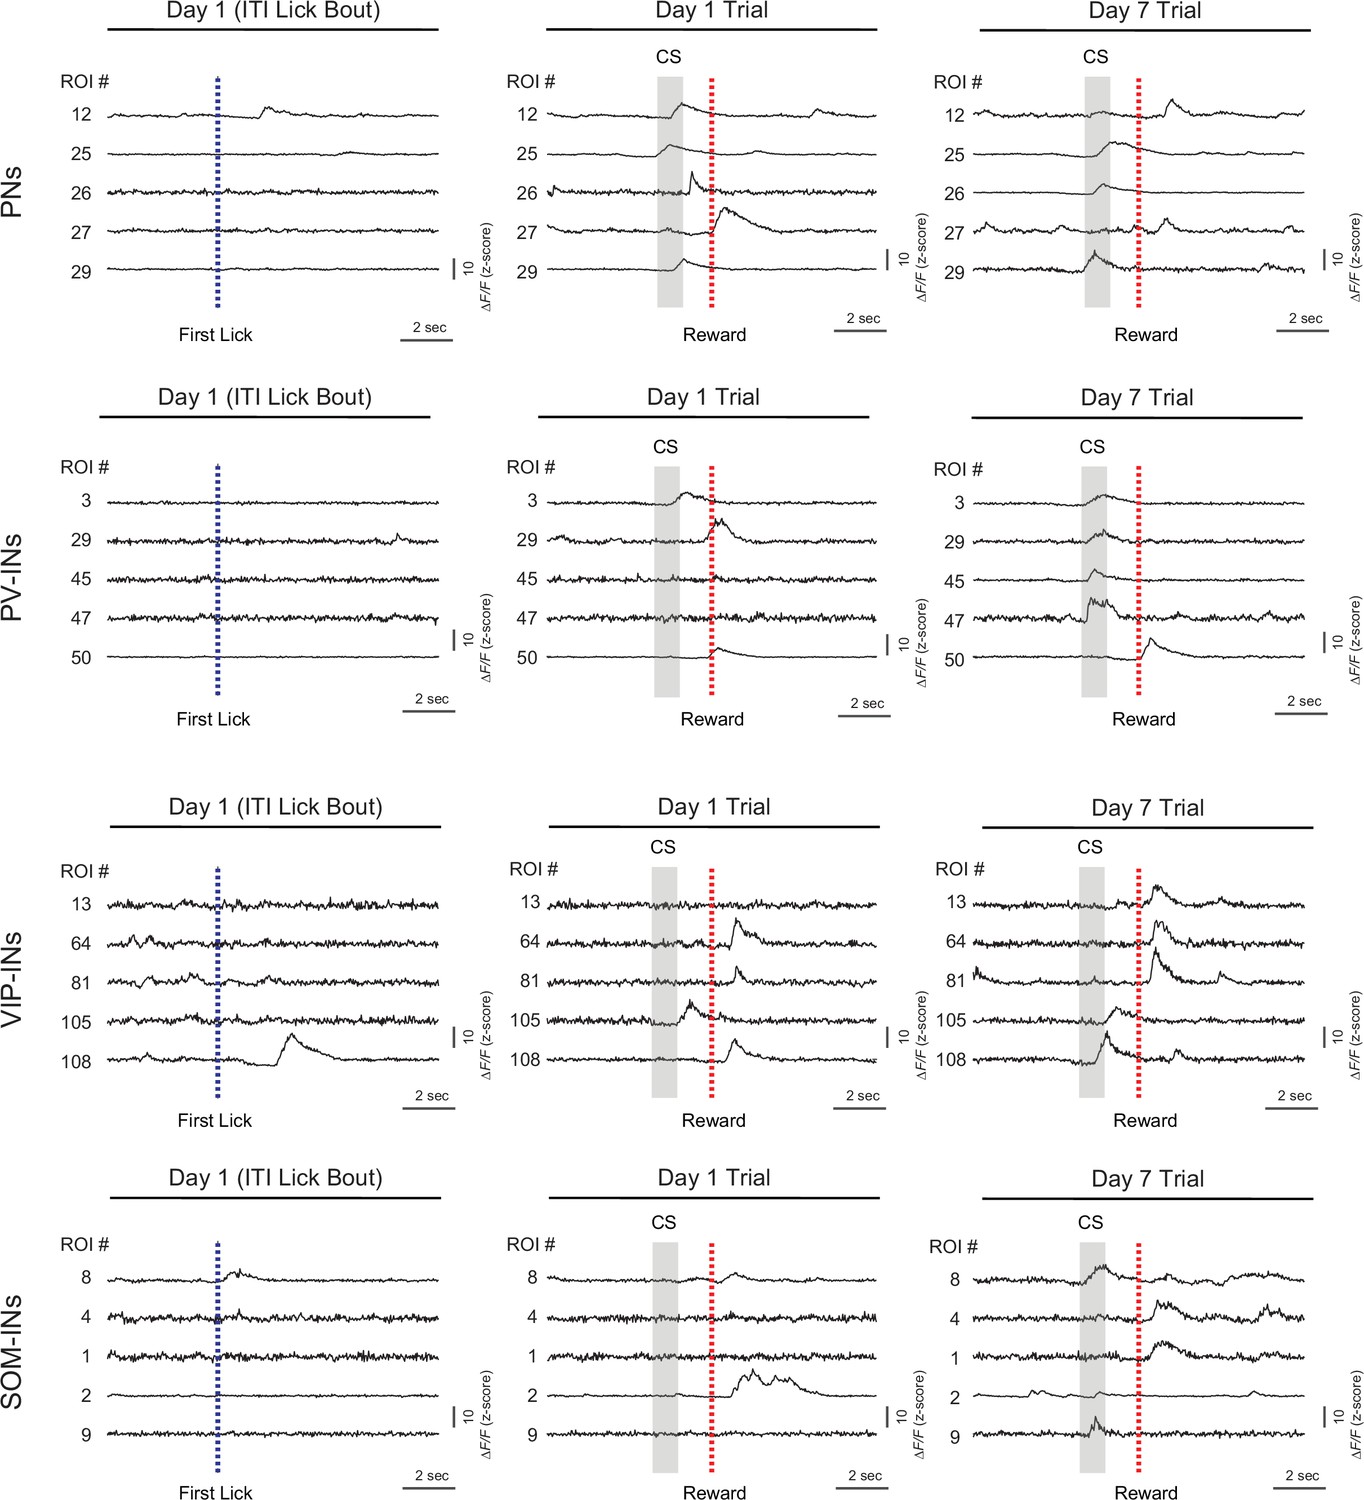
Z-Scored ∆F traces from cells among each cell type on days 1 and 7.
Example calcium traces from five example cells (same mouse) during a representative intertrial interval (ITI) lick bout on day 1 (left), a trial on day 1 (middle) and a trial on day 7 (right). The same cells are tracked from days 1 to 7. Blue dashed line indicates the time of the first lick in the lick bout (left). Gray shading represents time of the cue stimulus (CS) and the red dashed line indicates the time of the water reward delivery (middle, right).
Figure 2—figure supplement 2
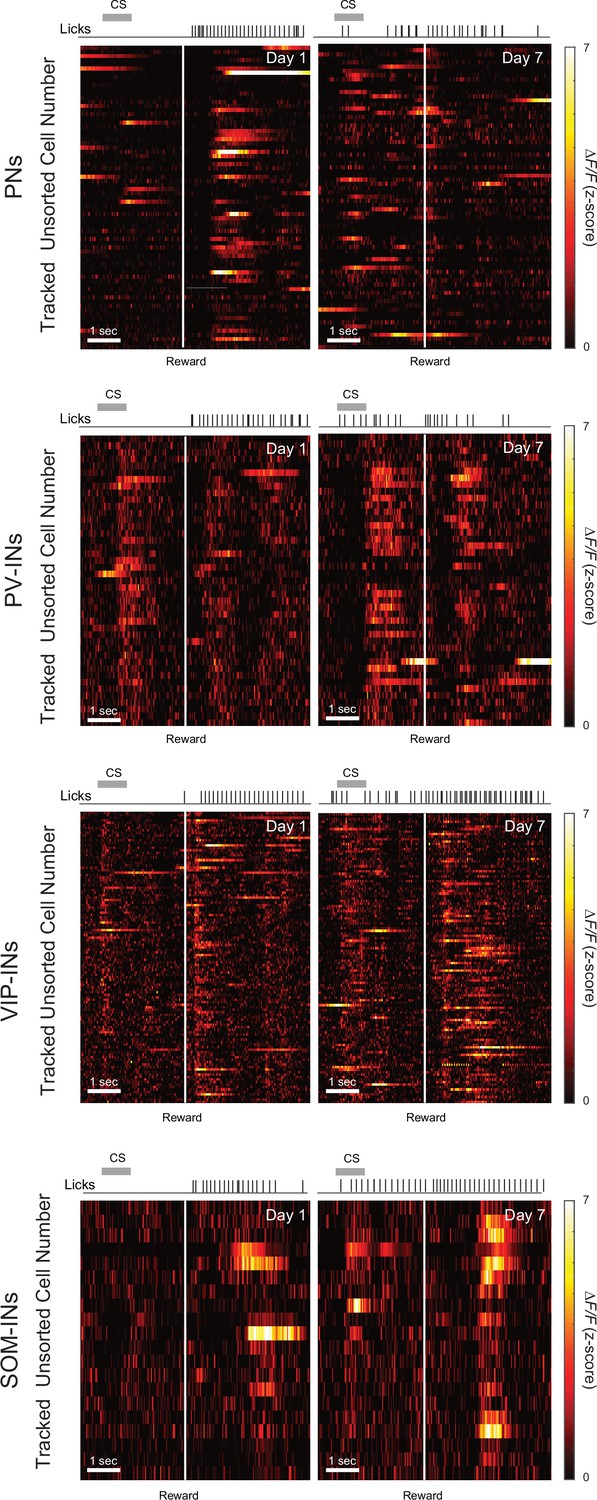
Z-Scored population activity of cells tracked from days 1 to 7 for each cell type.
Neurons were not sorted and the order of all cells were maintained for the days 1 and 7 plot. Gray bar represents the timing of the cue stimulus (CS). White line indicates the onset of water reward delivery. Black lines indicate licking.
Figure 3
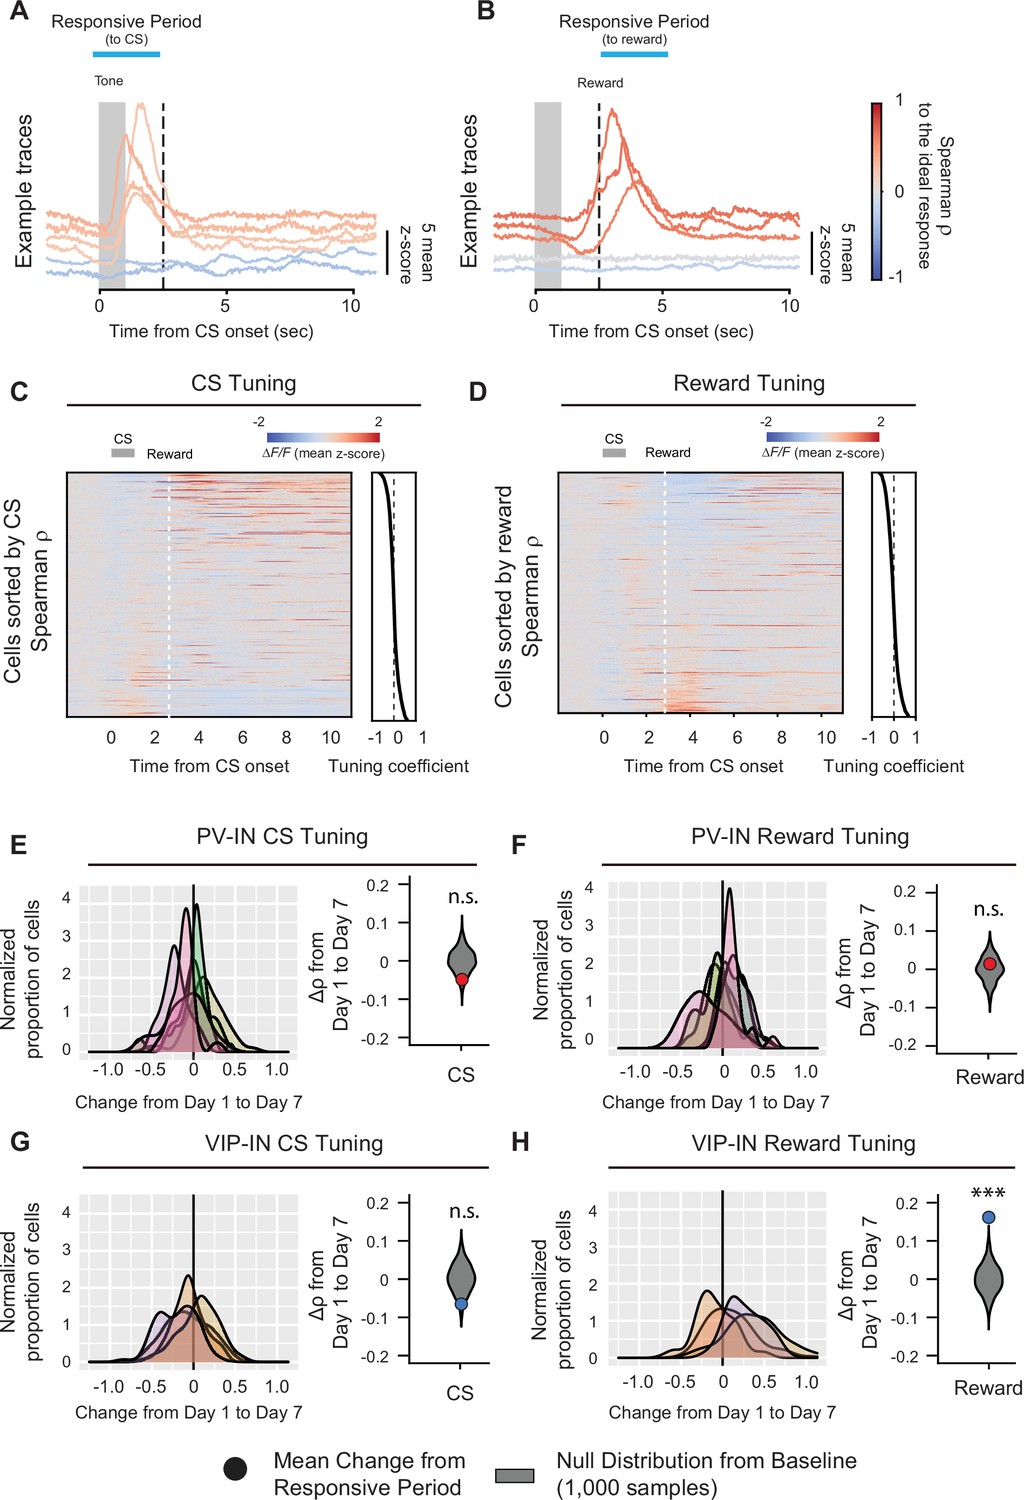
Learning-associated changes in single-neuron tuning properties in M1.
Example fluorescence traces, color-coded based on nonparametric Spearman correlation with cue stimulus (CS) (A) or reward (B). Each trace is a trial-averaged response from different neurons on day 7. Trial-averaged fluorescence of all the neurons recorded on day 7 and sorted to the value of the Spearman correlation (−1−1) to CS (C) or reward (D). Active neurons during the CS- or reward-responsive period showed higher tuning coefficient. Left, distribution of changes in Spearman correlation Δρ with CS (E, G) or reward (F, H) for PV-INs (top) and VIP-INs (bottom). Each curve represents a Gaussian kernel density estimate of the distribution of Δρ in a single mouse. Right, mean change in Spearman correlation for PV-INs and VIP-INs. Null distributions (gray) were estimated by resampling each mouse and shuffling trials 1000 times (see description of calculation of tuning coefficients in Methods). VIP-IN reward tuning significantly increased with associative learning. Monte-Carlo, ***p < 1 × 10⁻³, n.s., nonsignificant, PV-IN CS p = 0.12 (E), PV-IN Reward p = 0.61 (F), VIP-IN CS p = 0.082 (G), VIP-IN Reward p < 1 × 10⁻³ (H) PV-IN: n = 316 cells from six mice. VIP-IN: n = 407 cells from four mice.
Figure 4 with 2 supplements

PV-IN and VIP-IN cue stimulus (CS)-related responses before and after associative learning.
(A) Trial structure. Gray shaded bar represents the response period analyzed for CS-responsive activity. (B) Z-Scored activity of all the active PV-INs from an example mouse during one representative trial on days 1 and 7, sorted by timing of maximum activity following the CS onset. Gray bar represents the timing of the CS. White line indicates the onset of water reward delivery. Mean percent of cells that are responsive to the CS for PV-INs (C) and VIP-INs (D). PV-INs showed an increase in the percent of CS-responsive neurons after reinforcement learning, while VIP-INs did not show any change. Paired t-test, *p < 0.05, n.s., nonsignificant, PV-IN: p = 0.031 (C), VIP-IN: p = 0.38 (D). (E) Cumulative probability plots showing the percent of trials that each neuron responded to the CS for PV-INs and VIP-INs on day 1. Neurons from each cell type were pooled across mice. PV-INs showed significantly greater reliability to the CS than VIP-INs. Kolmogorov–Smirnov test, p < 1 × 10⁻³. Mean reliability index of cells that are responsive to the CS for PV-INs (F) and VIP-INs (G). Each cell type is divided into High or Low Reliability Group based on the 50th percentile from the cumulative probability plots in (E). High Reliability PV-INs maintained their consistency, while the Low Reliability group became more consistent in their responses to CS. (G) VIP-INs did not show a change in either group after learning. Paired t-test, PV-IN High Reliability: p = 0.38, PV-IN Low Reliability: p = 0.044, VIP-IN High Reliability: p = 0.79, VIP-IN Low Reliability: p = 0.060. (H) CS responses from all tracked PV-INs in one example mouse on days 1 and 7. Left, cumulative distribution of CS response reliability among all tracked cells within the example mouse. Right, binary map of each cell’s CS response (active or not) across all trials on days 1 and 7. Cells were sorted by their day 1 reliability shown on the left and the order is maintained on day 7. Cells with low response reliability to CS on day 1 became more reliable on day 7. (I) Cumulative probability plots of the change in reliability from days 1 to 7 () among PV-INs with Low Reliability group to CS on day 1. Bold red, of the population of PV-INs. Thin red lines show the distribution within individual PV-Cre mice. As a control, day 7 session was randomly sampled and a random reliability was calculated. was calculated by subtracting day 1 CS reliability from the day 7 random reliability (gray, from the same population of PV-INs). Kolmogorov–Smirnov test, ***p < 1 × 10⁻³ PV-IN: n = 316 cells from six mice. VIP-IN: n = 407 cells from four mice. Error bars show standard error of the mean (SEM).
Figure 4—figure supplement 1
Response properties of PV-IN and VIP-IN cells tracked from days 1 to 7 are consistent across days.
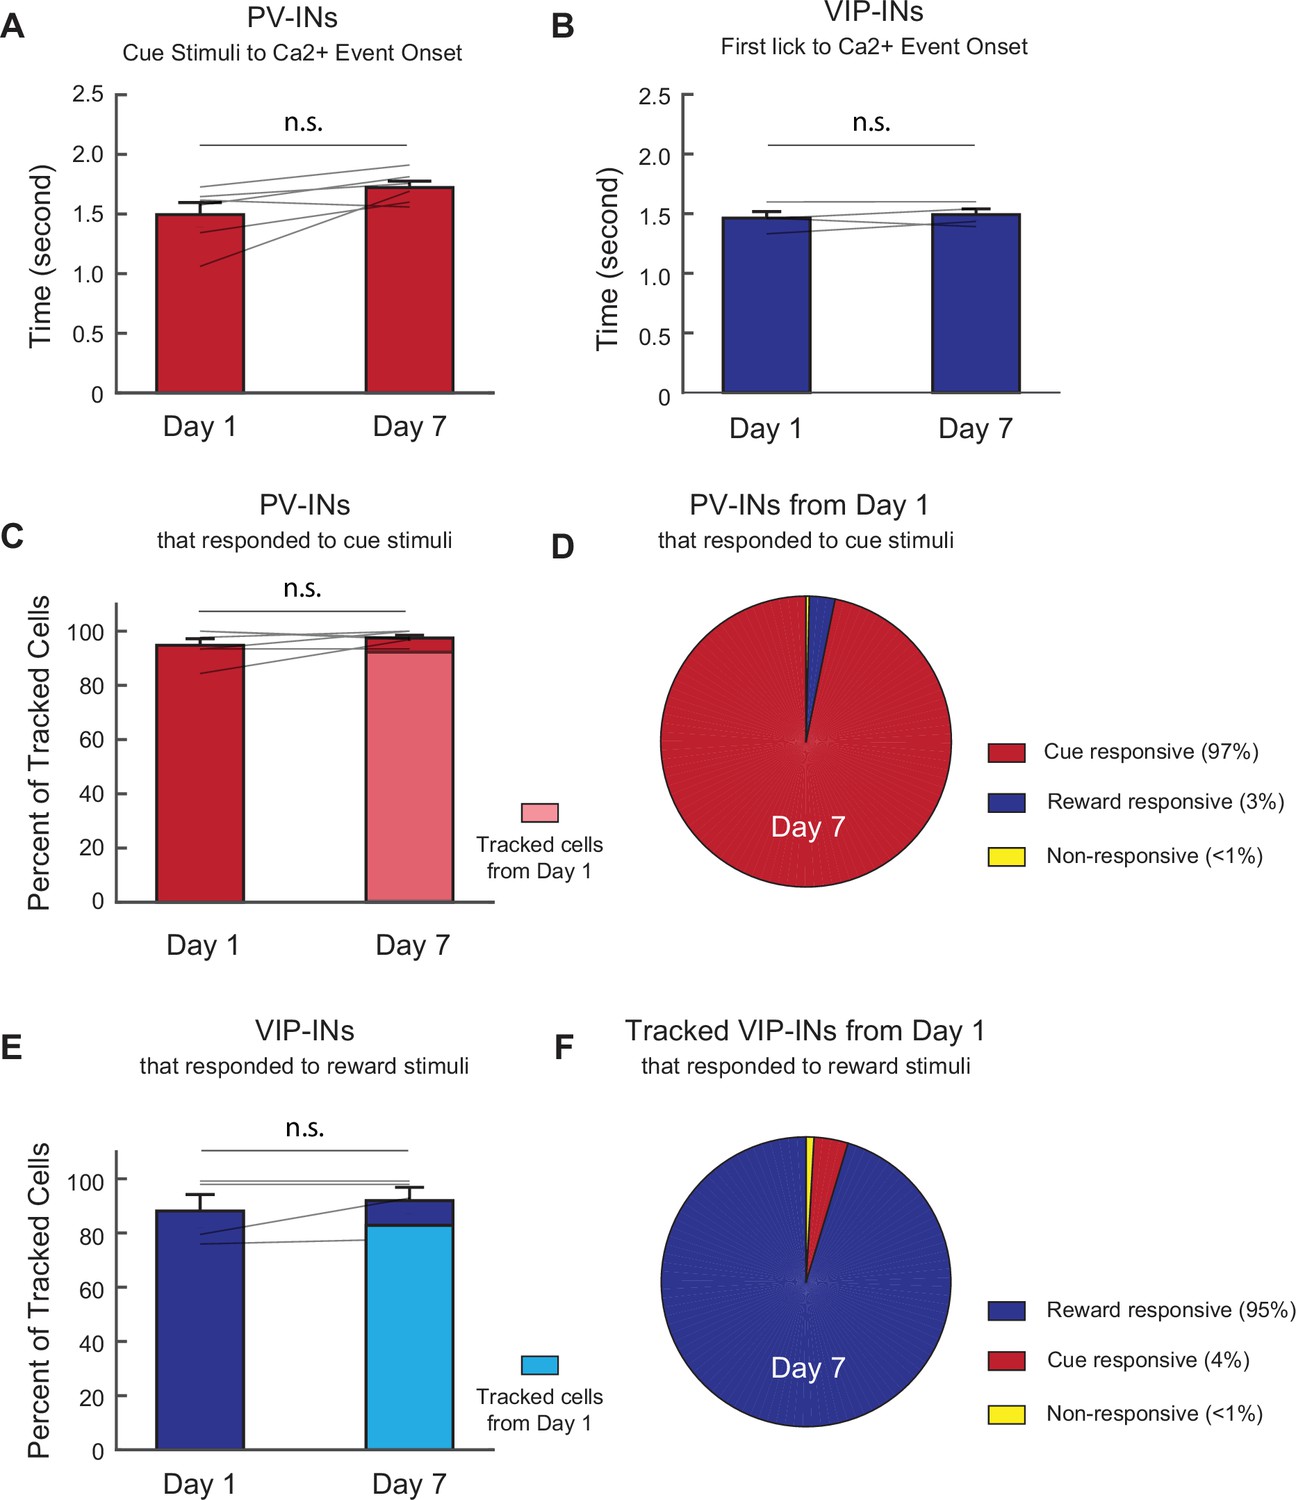
(A) Mean time from the cue stimulus (CS) onset to Ca2+ event onset for all PV-IN CS responses. Each line represents an individual mouse. The mean event onset time did not change from days 1 to 7. Paired t-test, p = 0.058. (B) Mean time from the first lick in response to reward delivery to Ca2+ event onset for all VIP-IN reward responses. Each line represents an individual mouse. The mean event onset time did not change from days 1 to 7. Paired t-test, p = 0.53. (C) Overall proportion of PV-INs that responded to the CS on day 1 did not change on day 7. Light red indicates the proportion of day 7 CS-responsive cells that also responded to the CS on day 1. Each line represents an individual mouse. Paired t-test, p = 0.32. (D) PV-INs that responded to the CS on day 1, tracked to day 7. 97% of the cells that responded to CS on day 1 also responded to the CS on day 7. 3% of the cells that responded to the CS on day 1 became responsive to reward but not to the CS on day 7. Less than 1% responded to neither CS nor reward on day 7. (E) Overall proportion of VIP-INs that responded to the reward stimuli on day 1 did not change on day 7. Light blue indicates the proportion of day 7 reward-responsive cells that also responded to reward on day 1. Each line represents an individual mouse. Paired t-test, p = 0.32. (F) VIP-INs that responded to reward on day 1, tracked to day 7. 95% of the cells that responded to reward on day 1 also responded to reward on day 7. 4% of cells that responded to reward on day 1 became responsive to CS but not reward on day 7. Less than 1% responded to neither cue nor reward on day 7. PV-IN: n = 316 cells from six mice. VIP-IN: n = 407 cells from four mice. Error bars show standard error of the mean (SEM).
Figure 4—figure supplement 2
PV-IN and VIP-IN population plasticity is specific to associative learning.
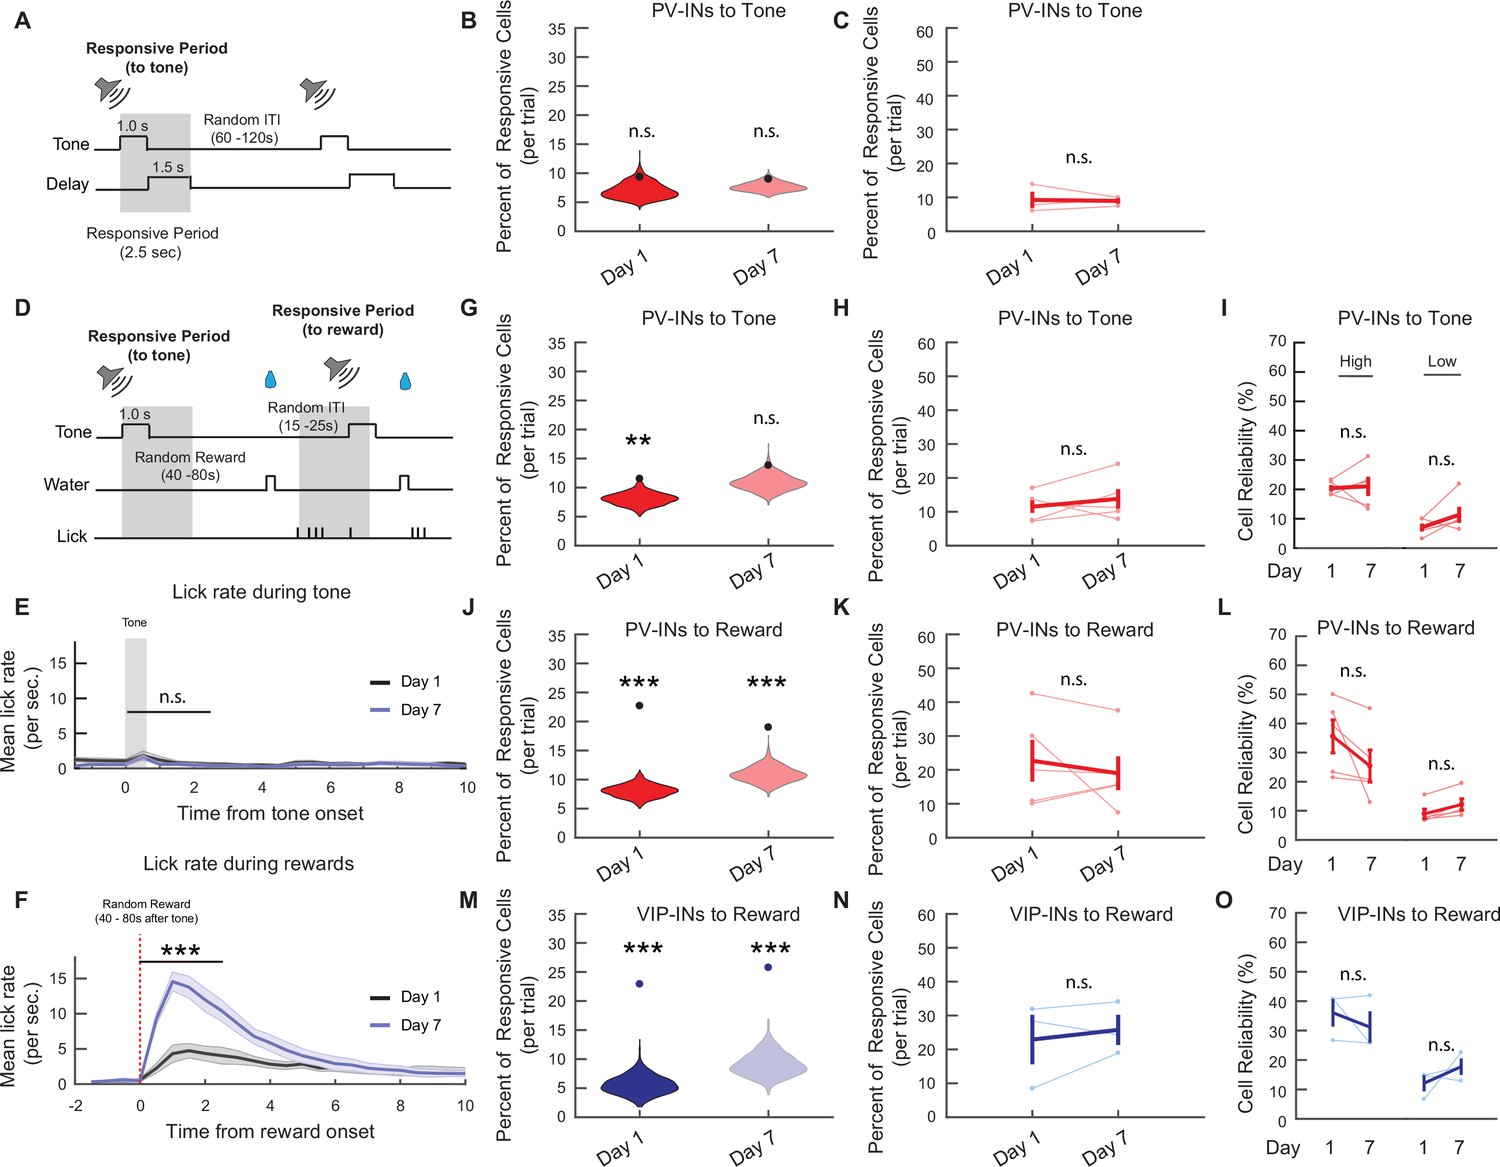
(A) Trial structure for the no-reward control task. Gray shaded bar represents the response period analyzed for tone-responsive activity. (B) Mean percent of tone-responsive PV-INs from the no-reward task. Violin plots show null distribution of percentage of responsive neurons made by resampling mice and shuffling the session 1000 times (same as Figure 2). The circle represents the mean percentage of tone-responsive neurons. In the absence of reward, PV-INs did not show significant responses to tone. Bootstrap, day 1: p = 0.11, day 7: p = 0.11. (C) The mean percent of tone-responsive PV-INs during no-reward control do not change between days 1 and 7. Paired t-test, n.s., nonsignificant, p = 0.89. (D) Trial structure for the nonpaired control task. Tone was followed by a randomly varied 40- to 80-s period before reward delivery and then a randomly varied intertrial interval (ITI) between 15 and 25 s. First gray shaded bar shows the response period analyzed for tone-responsive activity (2.5 s from tone onset). Second shaded bar shows the response period analyzed for reward-responsive activity (2.5 s from onset of first lick after reward delivery). (E) Mean lick rate during the tone from the nonpaired task. Mice did not show increased anticipatory licking during the tone on day 7. One-way analysis of variance (ANOVA), p = 0.097. (F) Mean lick rate following the randomized water rewards from the nonpaired task. Mice increased lick rate to consume the reward. The lick response was greater on day 7. One-way ANOVA, p < 1 × 10⁻³. (G) Mean percent of tone-responsive PV-INs during the nonpaired task. Violin plots show null distribution of percentage of responsive neurons made by resampling mice and shuffling the session 1000 times. The circle represents the mean percentage of tone-responsive neurons. When tone was not paired with reward, PV-INs showed significant responses to tone on day 1 but not day 7. Bootstrap, Bonferroni correction for multiple comparisons, day 1 p = 0.003, day 7 p = 0.069. (H) The mean percent of tone-responsive PV-INs during the nonpaired task did not change between days 1 and 7. Paired t-test, n.s., nonsignificant, p = 0.43. (I) Mean reliability index of PV-INs that were responsive to the tone during the nonpaired task. Cells were divided into High or Low Reliability Group based on the 50th percentile of tone reliability. The reliability of neither High nor Low Reliability PV-INs changed from days 1 to 7. Paired t-test, n.s., nonsignificant, High: p = 0.86, Low: p = 0.19. (J) Mean percent of reward-responsive PV-INs during the nonpaired task. Violin plots show null distribution of percentage of responsive neurons made by re-sampling mice and shuffling the session 1000 times. The circle represents the mean percentage of reward-responsive neurons. PV-INs responded significantly to randomly timed rewards on days 1 and 7. Bootstrap, Bonferroni correction for multiple comparisons, day 1: p < 1 × 10⁻³,day 7: p < 1 × 10⁻³. (K) The mean percent of reward-responsive PV-INs during the nonpaired task did not change between days 1 and 7. Paired t-test, n.s., nonsignificant, p = 0.51. (L) Mean reliability index of PV-INs that were responsive to the reward. Cells were divided into High or Low Reliability Group based on the 50th percentile of reward reliability. The reliability of neither High nor Low Reliability PV-INs changed from days 1 to 7. Paired t-test, n.s., nonsignificant, High: p = 0.23, Low: p = 0.24. (M) Mean percent of reward-responsive VIP-INs during the nonpaired task. Violin plots show null distribution of percentage of responsive neurons made by resampling mice and shuffling the session 1000 times. The circle represents the mean percentage of reward-responsive neurons. VIP-INs responded significantly to randomly timed rewards on days 1 and 7. Bootstrap, day 1: p < 1 × 10⁻³, day 7: p < 1 × 10⁻³. (N) The mean percent of reward-responsive VIP-INs during the nonpaired control did not change between days 1 and 7. Paired t-test, n.s., nonsignificant, p = 0.57. (O) Mean reliability index of VIP-INs that were responsive to the reward. Cells were divided into High or Low Reliability Group based on the 50th percentile of reward reliability. The reliability of neither High nor Low Reliability PV-INs changed from days 1 to 7. Paired t-test, n.s., nonsignificant, High: p = 0.53, Low: p = 0.22. **p < 0.01, ***p < 0.001.
No-water rewards: n = 357 PV-IN cells from three mice. Nonpaired rewards: n = 324 PV-IN cells from five mice; n = 208 VIP-IN cells from three mice. Error bars show standard error of the mean (SEM).
Figure 5
PV-IN and VIP-IN reward-related responses before and after associative learning.
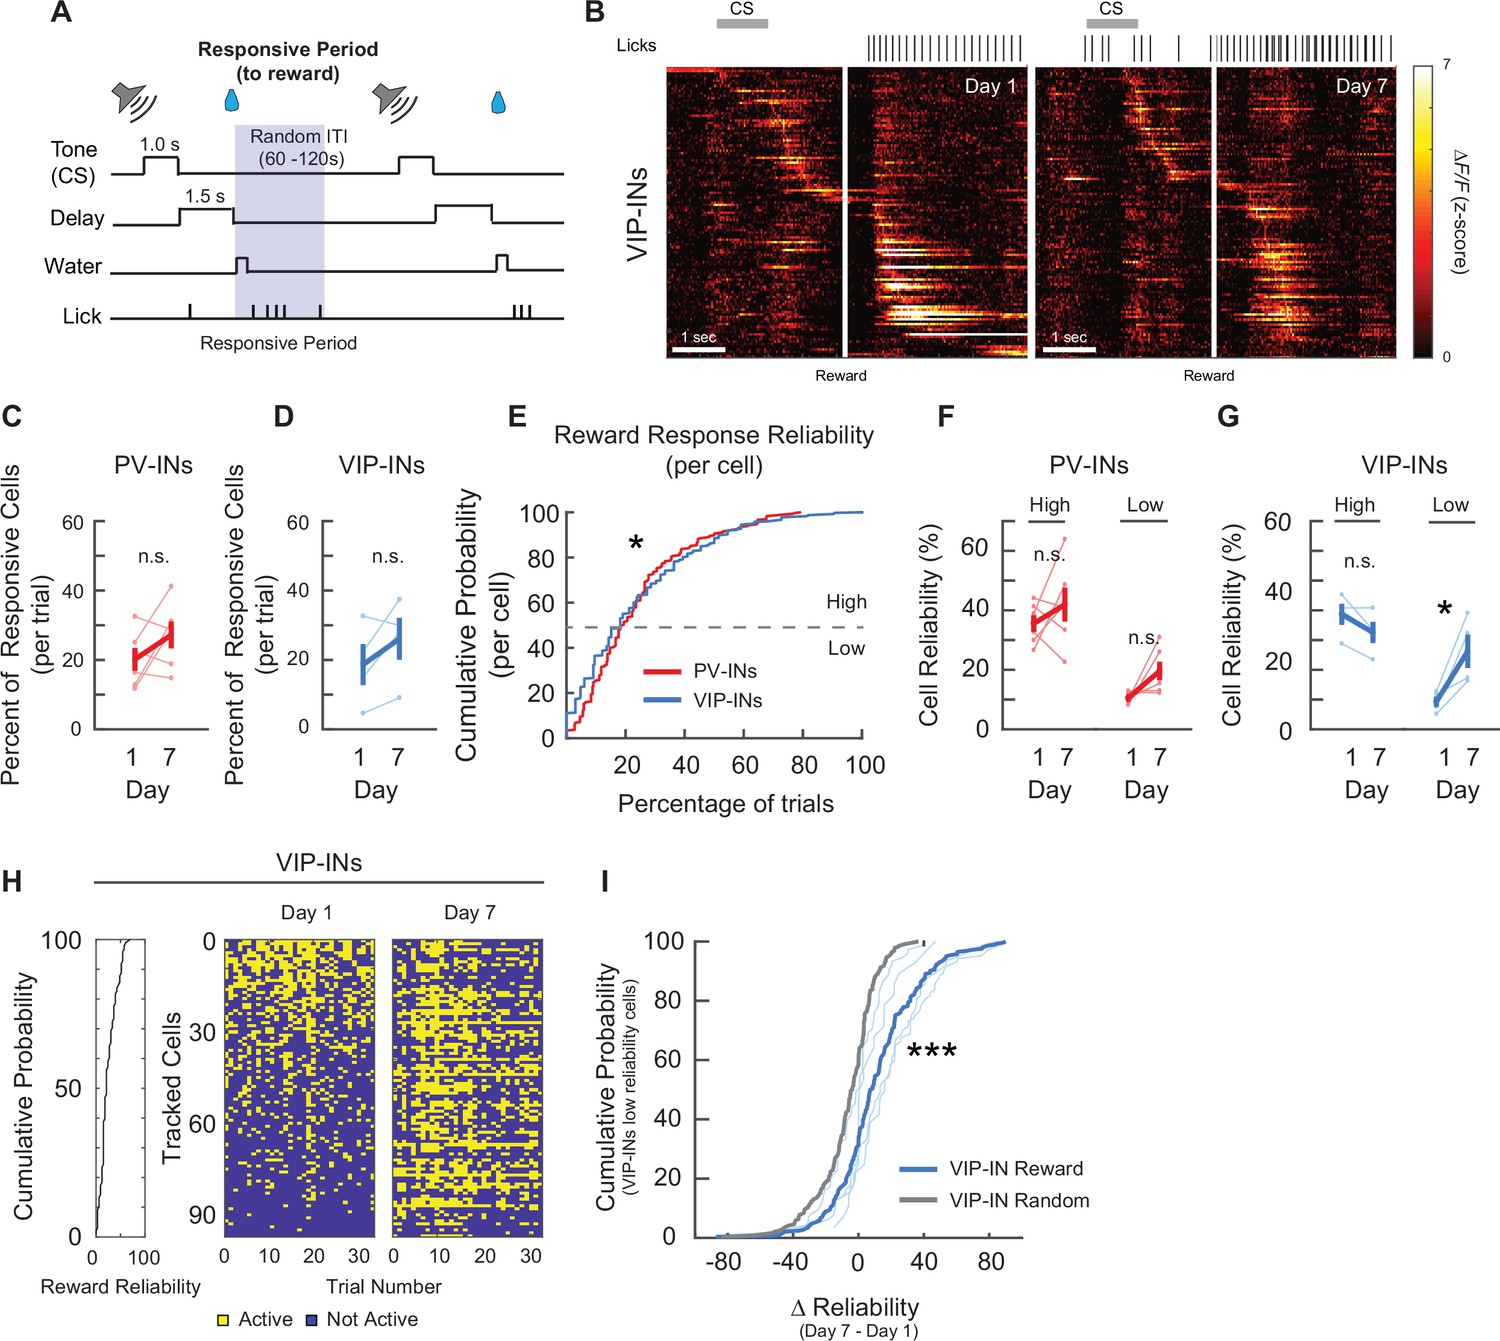
(A) Trial structure. Gray shaded bar represents the response period analyzed for reward-responsive activity. (B) Z-Scored activity of all the active VIP-INs from an example mouse during one representative trial on days 1 and 7, sorted by timing of maximum activity following the cue stimulus (CS) onset. Gray bar represents the timing of the CS. White line indicates the onset of water reward delivery. Mean percent of cells that are responsive to the reward for PV-INs (C) and VIP-INs (D). Neither PV- or VIP-INs showed a significant change. Paired t-test, n.s., nonsignificant, PV-IN: p = 0.16 (C), VIP-IN: p = 0.16 (D). (E) Cumulative probability plots showing the percent of trials that each neuron responded to reward for PV-INs and VIP-INs on day 1. Neurons from each cell type were pooled across mice. VIP-INs showed a significantly greater response reliability to the reward than PV-INs. Kolmogorov–Smirnov test, *p < 0.05, p = 5.2 × 10⁻³. Mean reliability index of cells that are responsive to the reward for PV-INs (F) and VIP-INs (G). Each cell type is divided into High or Low Reliability Group based on the 50th percentile from the cumulative probability plots in (E). High and Low Reliability PV-INs maintained their consistency. (G) High Reliability VIP-INs did not show a change, while Low Reliability VIP-INs significantly increased in reliability following associative learning. Paired t-test, PV-IN High Reliability: p = 0.36, PV-IN Low Reliability: p = 0.058, VIP-IN High Reliability: p = 0.090, VIP-IN Low Reliability: p = 0.045. (H) Reward-responses from all tracked VIP-INs in an example mouse on days 1 and 7. Left, cumulative distribution of reward response reliability among all tracked cells within the example mouse. Right, binary map of each cell’s reward response (active or not) across all trials on days 1 and 7. Cells were sorted by their day 1 reliability shown on the left and the order is maintained on day 7. Cells with low response reliability to reward on day 1 became more reliable on day 7. (I) Cumulative probability plots of the change in reliability from days 1 to 7 () among VIP-INs with Low Reliability to reward on day 1. Bold blue, of the population. Thin blue lines show the distribution within individual VIP-Cre mice. As a control, day 7 session was randomly sampled and a random reliability was calculated. was calculated by subtracting day 1 reward reliability from the day 7 random reliability (Gray, from the same population of VIP-INs). Kolmogorov–Smirnov test, ***p < 1 × 10⁻³. PV-IN: n = 316 cells from six mice. VIP-IN: n = 4 07 cells from four mice. Error bars show standard error of the mean (SEM).
Figure 6
Pyramidal neuron (PN) and SOM-IN reliability is altered after associative learning.
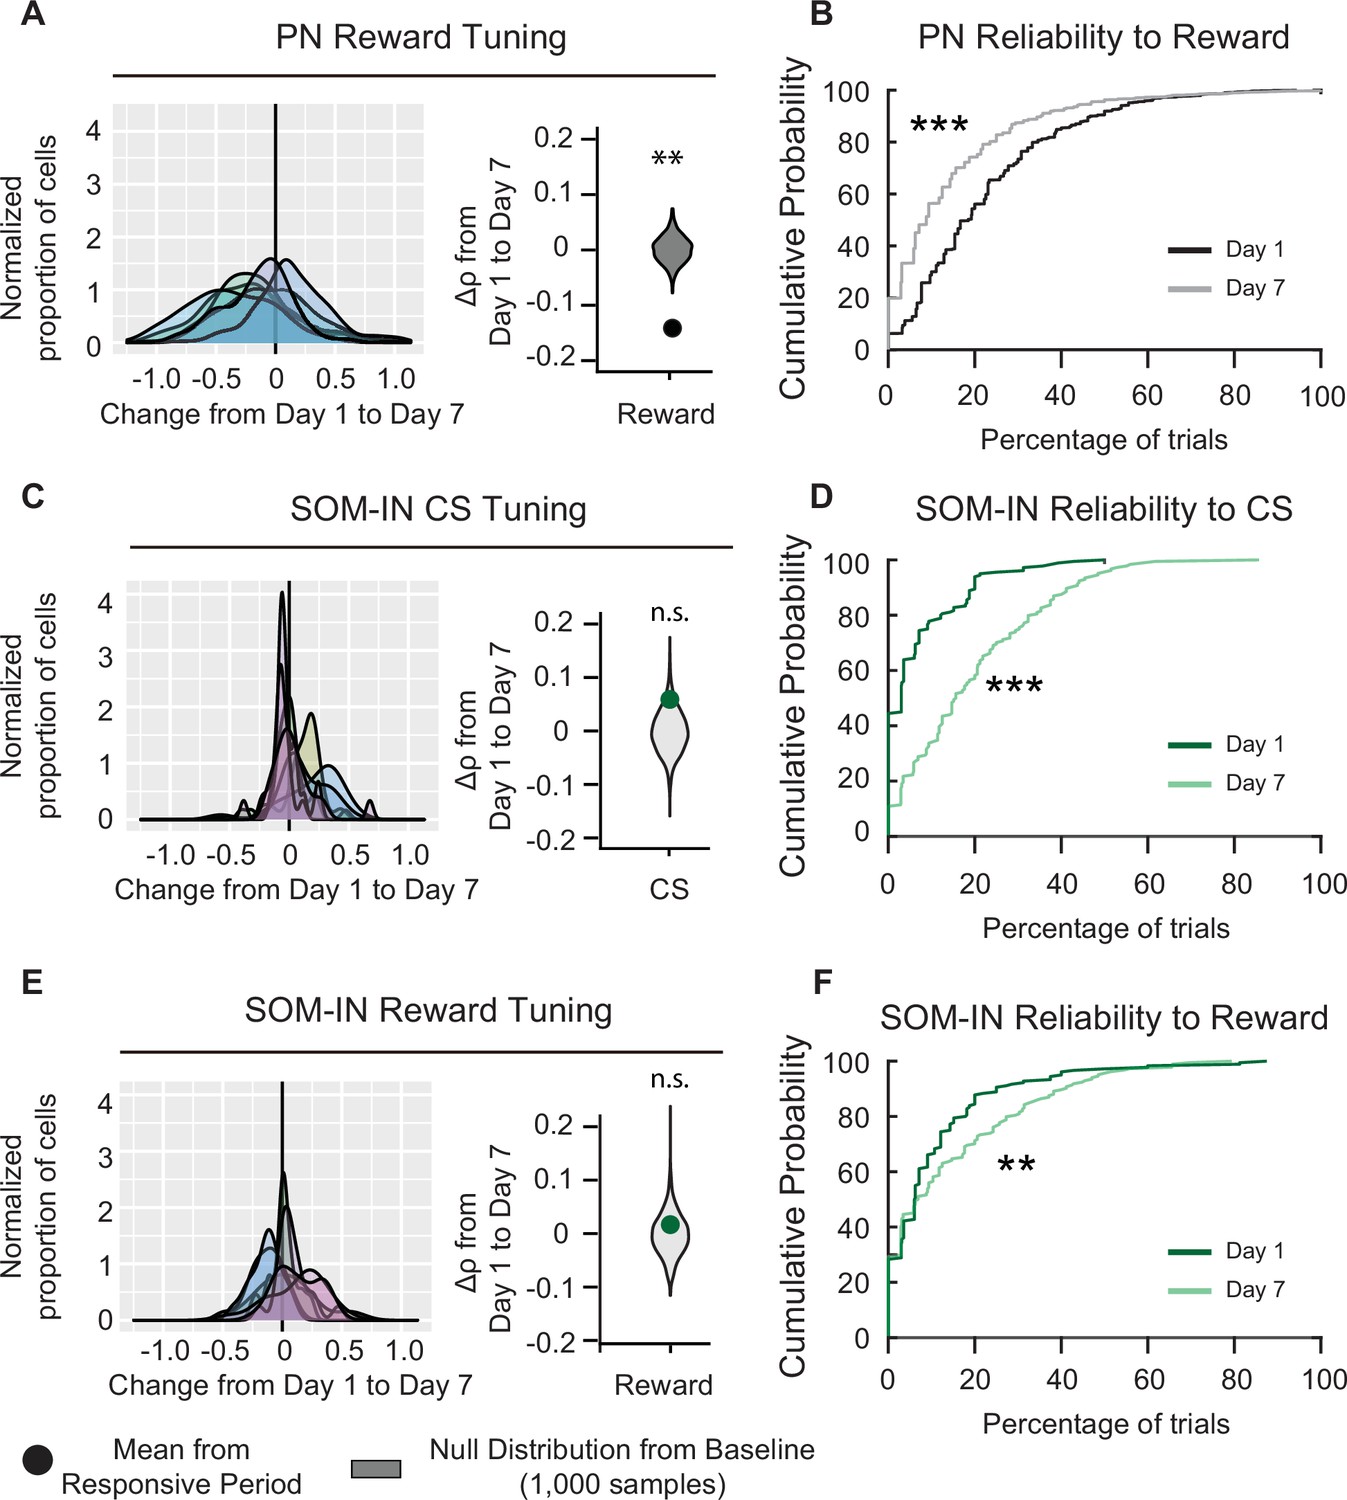
(A) Left, distribution of changes in PN Spearman correlation Δρ for reward. Each curve represents a Gaussian kernel density estimate of the distribution of Δρ in a single mouse. Right, mean change in Spearman correlation . Null distributions (gray) were estimated by resampling each mouse and shuffling trials 1000 times. Reward tuning among PNs decreased after associative learning, Monte-Carlo, ***p < 1 × 10⁻³. (B) Cumulative probability plots showing the percent of trials that each neuron responded to reward for PNs on days 1 and 7. Neurons were pooled across mice. Day 7 reliability was significantly lower than day 1. Kolmogorov–Smirnov test, ***p < 1 × 10⁻³. (C) Left, distribution of changes in SOM-IN Spearman correlation Δρ with cue stimulus (CS). Each curve represents a Gaussian kernel density estimate of the distribution of Δρ in a single mouse. Right, mean change in Spearman correlation . SOM-INs did not show a change in tone tuning. Monte-Carlo, n.s., nonsignificant, p = 0.128. (D) Cumulative probability plots showing the percent of trials that each neuron responded to the CS for SOM-INs on days 1 and 7. Neurons were pooled across mice. Day 7 reliability was significantly greater than day 1. Kolmogorov–Smirnov test, p < 1 × 10⁻³. (E) Left, distribution of changes in SOM-IN Spearman correlation Δρ with reward. Each curve represents a Gaussian kernel density estimate of the distribution of Δρ in a single mouse. Right, mean change in Spearman correlation . SOM-INs did not show a change in reward tuning. Monte-Carlo, n.s., nonsignificant, p = 0.598. (F) Cumulative probability plots showing the percent of trials that each neuron responded to the reward for SOM-INs on days 1 and 7. Neurons were pooled across mice. Day 7 reliability was significantly greater than day 1. Kolmogorov–Smirnov test, **p = 0.012.
PN: n = 1029 cells from six mice. SOM-INs: n = 189 cells from seven mice.
Figure 7 with 1 supplement

Cell-type-specific cue and reward activity are not due to licking movements.
(A) Schematic of the cued reward conditioning task (top) and the trial structure (bottom). (B) Example licking behavior during the intertrial intervals (ITIs) from one mouse on day 1. Purple shading shows licks that were considered to be an individual lick bout. Gray shaded bar shows the cue stimulus (CS) timing and the red dotted line shows the reward timing. (C) Z-Scored activity of all the active pyramidal neurons (PNs) from an example mouse during one representative ITI lick bout. Left: maximum activity aligned to the lick bout onset. Right: maximum activity aligned to the CS onset. Gray bar represents the timing of the CS. White line indicates the time of water reward delivery. (D–F) Mean reliability index for all cell types with significant CS-related responses during ITI lick bouts with no water reward present, compared to the mean reliability index during the CS and up to but not including the reward delivery time. As shown in Figure 1, mice display anticipatory licking during the CS on day 7, but not day 1. PV-INs, VIP-INs, and SOM-INs were more reliably responsive during the CS than during licking movement alone. Only sessions/cell types with significant CS-related responses were analyzed. Paired t-test, *p < 0.05, ***p < 0.001. PV-INs day 1: p < 1 × 10⁻³, PV-IN day 7: p = 6.6 × 10⁻³ (D), VIP-IN day 1: p = 0.0355, VIP-IN day 7: p < 1 × 10⁻³ (E), SOM-IN day 7: p = 3.9 × 10⁻³ (F). (G–I) Mean reliability index for all cell types with significant reward-related responses during ITI lick bouts with no water reward present, compared to the mean reliability index following reward timing. All cell types were more reliably responsive during the reward period than during licking movement alone. Only sessions/cell types with significant reward-related responses were analyzed. Paired t-test, PV-INs day 1: p = 1.6 × 10⁻³, PV-IN day 7: p = 1.6 × 10⁻³ (G), VIP-IN day 1: p = 0.049, VIP-IN day 7: p = 0.014 (H), PN day 1 p < 1 × 10⁻³ (I), SOM-IN day 7: p = 0.030 (J).
PN: n = 1029 cells from six mice. PV-IN: n = 316 cells from six mice. VIP-IN: n = 407 cells from four mice. SOM-IN: n = 189 cells from seven mice. Error bars show standard error of the mean (SEM).
Figure 7—figure supplement 1
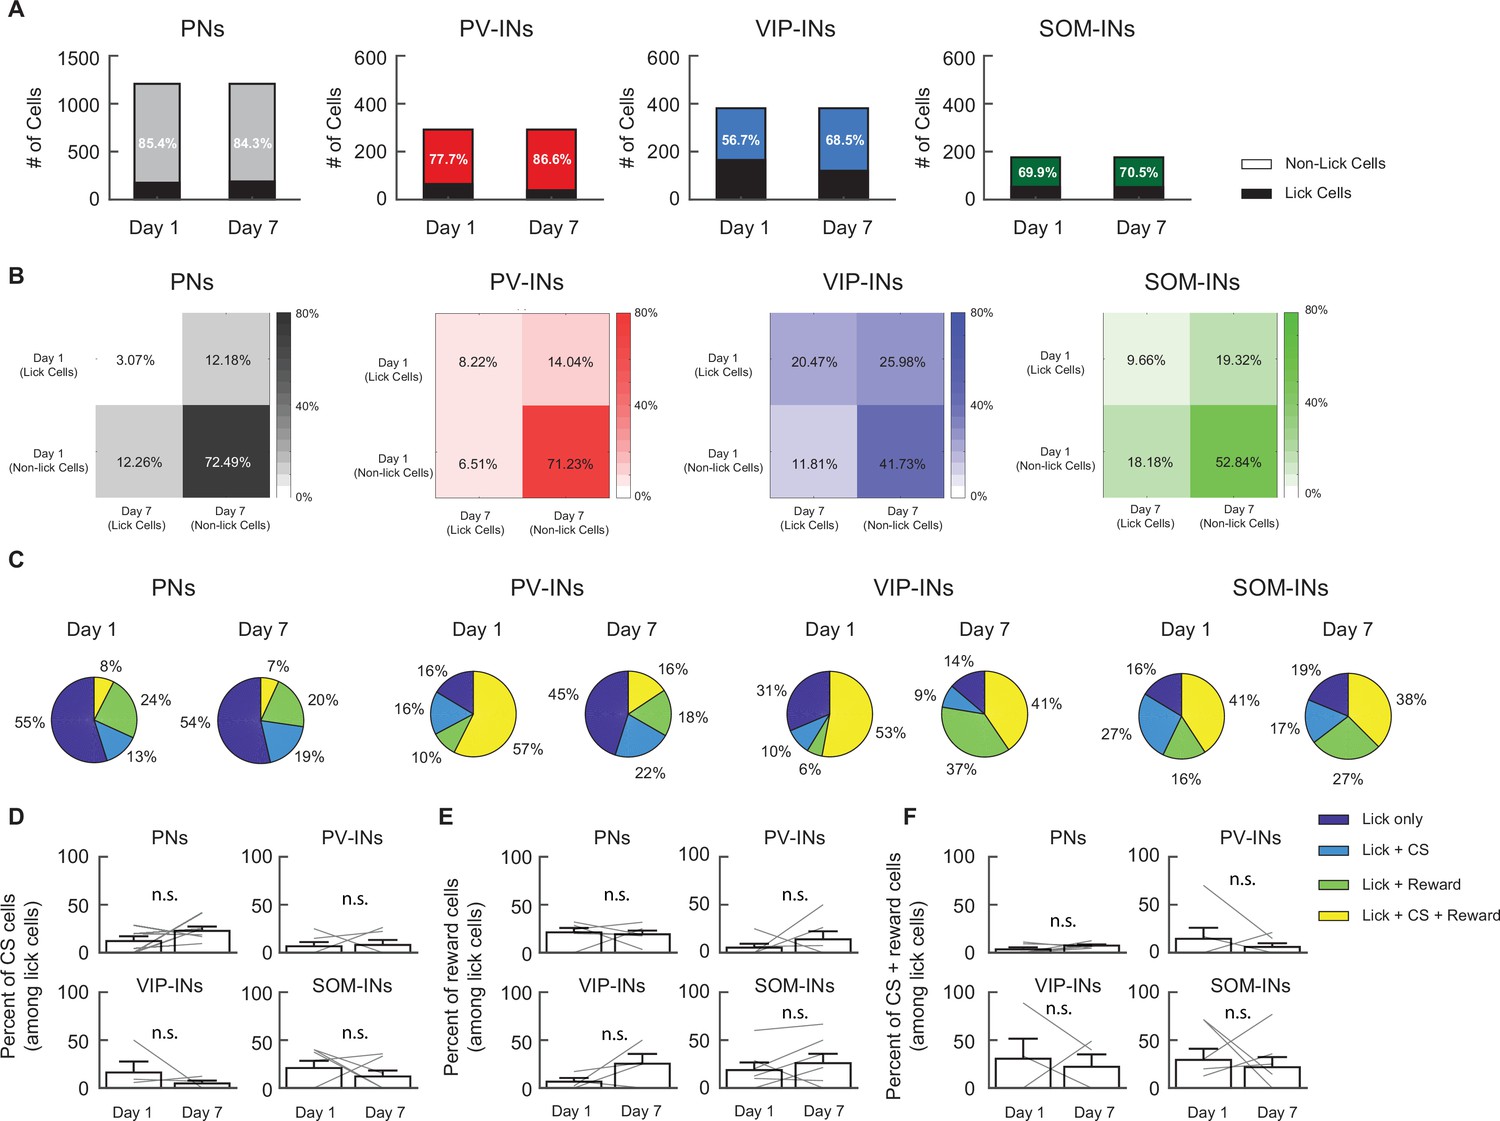
Lick cells were a small subset of active cells with stable mixed selectivity.
(A) The fraction of lick cells (in black) among all active cells tracked from days 1 to 7 for each cell type. Percentages indicate the percentage of cells that were nonlick cells. For all cell types, the majority of cells were nonlick cells. (B) Contingency table showing lick selectivity among all tracked active cells on days 1 and 7. Individual cells were tracked across days to determine if licking-related activity changed across days. For all cell types, most cells were nonlick cells on days 1 and 7. (C) Proportion of mixed selectivity for cue stimulus (CS) and reward among lick cells for all cell types on days 1 and 7. (D) Percentage of lick cells with significant CS but not reward selectivity for all cell types. Each line represents an individual mouse. (E) Percentage of lick cells with significant reward but not CS selectivity for all cell types. Each line represents an individual mouse. (F) Percentage of lick cells with significant CS and reward selectivity for all cell types. Each line represents an individual mouse.
PN: n = 1029 cells from six mice. PV-IN: n = 316 cells from six mice. VIP-IN: n = 407 cells from four mice SOM-IN: n = 189 cells from seven mice. Error bars show standard error of the mean (SEM).
Author response image 1
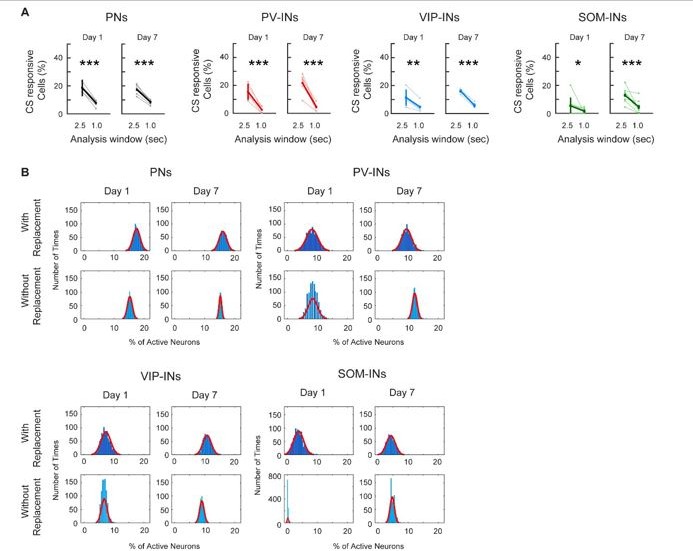
(A) Comparing the percent of CS-responsive cells calculated with a 2. 5s or a 1.0s response window after CS onset. For all cell types, the percent of CS-responsive cells was greatly reduced when using a 1.0s response window for analysis compared to a 2.5s window. Most cell-types were reduced to about 5% of responsive cells. Paired t-test, * p < 0.05, ** p <0.01, *** p < 0.001, PN: Day 1 p < 1×10⁻³, Day 7 p < 1×10⁻³; PV-IN: Day 1 p = 0.002, Day 7 p = 0.001; VIP-IN: Day 1 p = 0.008, Day 7 p < 1×10⁻³, SOM-IN: Day 1 p = 0.034, Day 7 p < 1×10⁻³ (B) Comparing Monte-Carlo resampling methods using sampling with replacement vs. without replacement. For each cell type, the null distribution estimates the percent of cells active at baseline using sampling with replacement (top row) and without replacement (bottom row) for Day 1 and Day 7. With replacement: mice were re-sampled with replacement, the session was randomly sampled, and the mean percent of active cells was calculated; this was repeated 1000 times. Without replacement: all mice were sampled once, the session was randomly sampled, and the mean percent of active cells was calculated; this was repeated 1000 times. As random sampling of mice with replacement allows for a more unbiased estimate of between animal variability, the distribution created without replacement is much narrower with a smaller range and standard deviation. PN: n = 1029 cells from 6 mice. PV-IN: n = 316 cells from 6 mice. VIP-IN: n = 407 cells from 4 mice. SOM-IN: n = 189 cells from 7. Error bars show SEM.
Author response image 2

(A-B) Examining if PV-INs or SOM-INs in M1 showed synchronized activity. Z-scored activity of all tracked active neurons from an example PV-Cre mouse and SOM-Cre mouse during the first 1,000s of the Day 1 session (left) and the Day 7 session (right). Neuron order along the y-axis was not sorted and was maintained across days. Red arrows indicate trial start time, and white dashed lines indicate water reward delivery. Licking activity is shown above. Different from Garcia-Junco-Clemente et al., 2019, synchrony was not apparent within the PV-IN or SOM-IN population.
Additional files
-
Transparent reporting form
- https://cdn.elifesciences.org/articles/72549/elife-72549-transrepform1-v2.docx
-
Supplementary file 1
Summary.of the number of mice, total regions of interests (ROIs), total active cells, and total active cells tracked from days 1 to 7 in all experimental conditions.
- https://cdn.elifesciences.org/articles/72549/elife-72549-supp1-v2.xlsx
Download links
A two-part list of links to download the article, or parts of the article, in various formats.
Downloads (link to download the article as PDF)
Open citations (links to open the citations from this article in various online reference manager services)
Cite this article (links to download the citations from this article in formats compatible with various reference manager tools)
Cell-type-specific responses to associative learning in the primary motor cortex
eLife 11:e72549.
https://doi.org/10.7554/eLife.72549


