Histone H1 prevents non-CG methylation-mediated small RNA biogenesis in Arabidopsis heterochromatin
- Department of Cell and Developmental Biology, John Innes Centre, United Kingdom
- Institute of Science and Technology, Austria
Figures
Figure 1 with 1 supplement
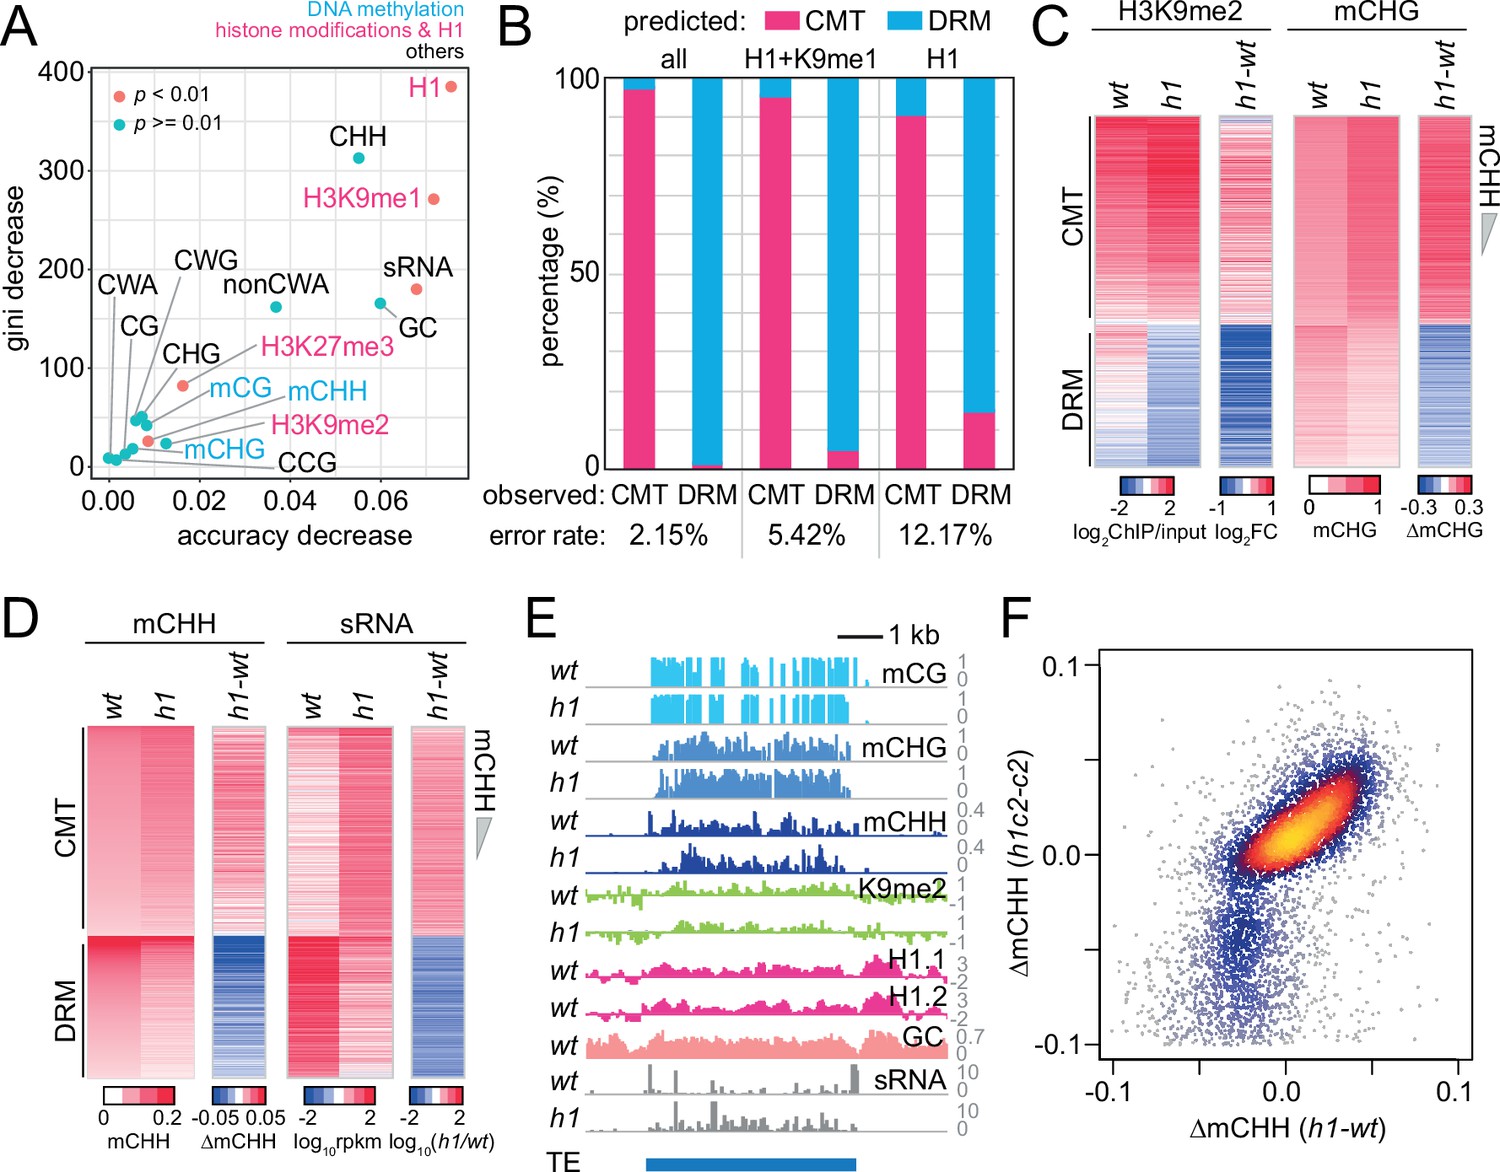
Histone H1 prohibits RNA-directed DNA methylation of chromomethylase (CMT)-dependent heterochromatic transposons.
(A) The importance of DNA methylation, histone H3 modifications, small RNA (sRNA), H1, and cytosine sequence context to predict CMT transposable element (TE) or DRM TE classes by random forest classification. (B) Prediction of CMT or DRM TE classes by random forest classification with all variables, H1 and H3K9me1, or only H1. Heatmaps of H3K9me2 and CHG methylation (mCHG) levels (C) and mCHH and sRNA levels (D) at CMT and DRM TEs in wt and h1 plants. TEs were sorted by mCHH level in wt. (E) Example of DNA methylation and sRNA expression at a CMT TE in wt and h1 (AT1TE58075). (F) mCHH difference between wt and h1 (x-axis) vs h1cmt2 (h1c2) and cmt2 (c2; y-axis) at CMT TEs.
-
Figure 1—source data 1
Lists of chromomethylase (CMT)- and DRM-dependent transposons and intermediate transposons in Arabidopsis.
- https://cdn.elifesciences.org/articles/72676/elife-72676-fig1-data1-v2.xlsx
Figure 1—figure supplement 1
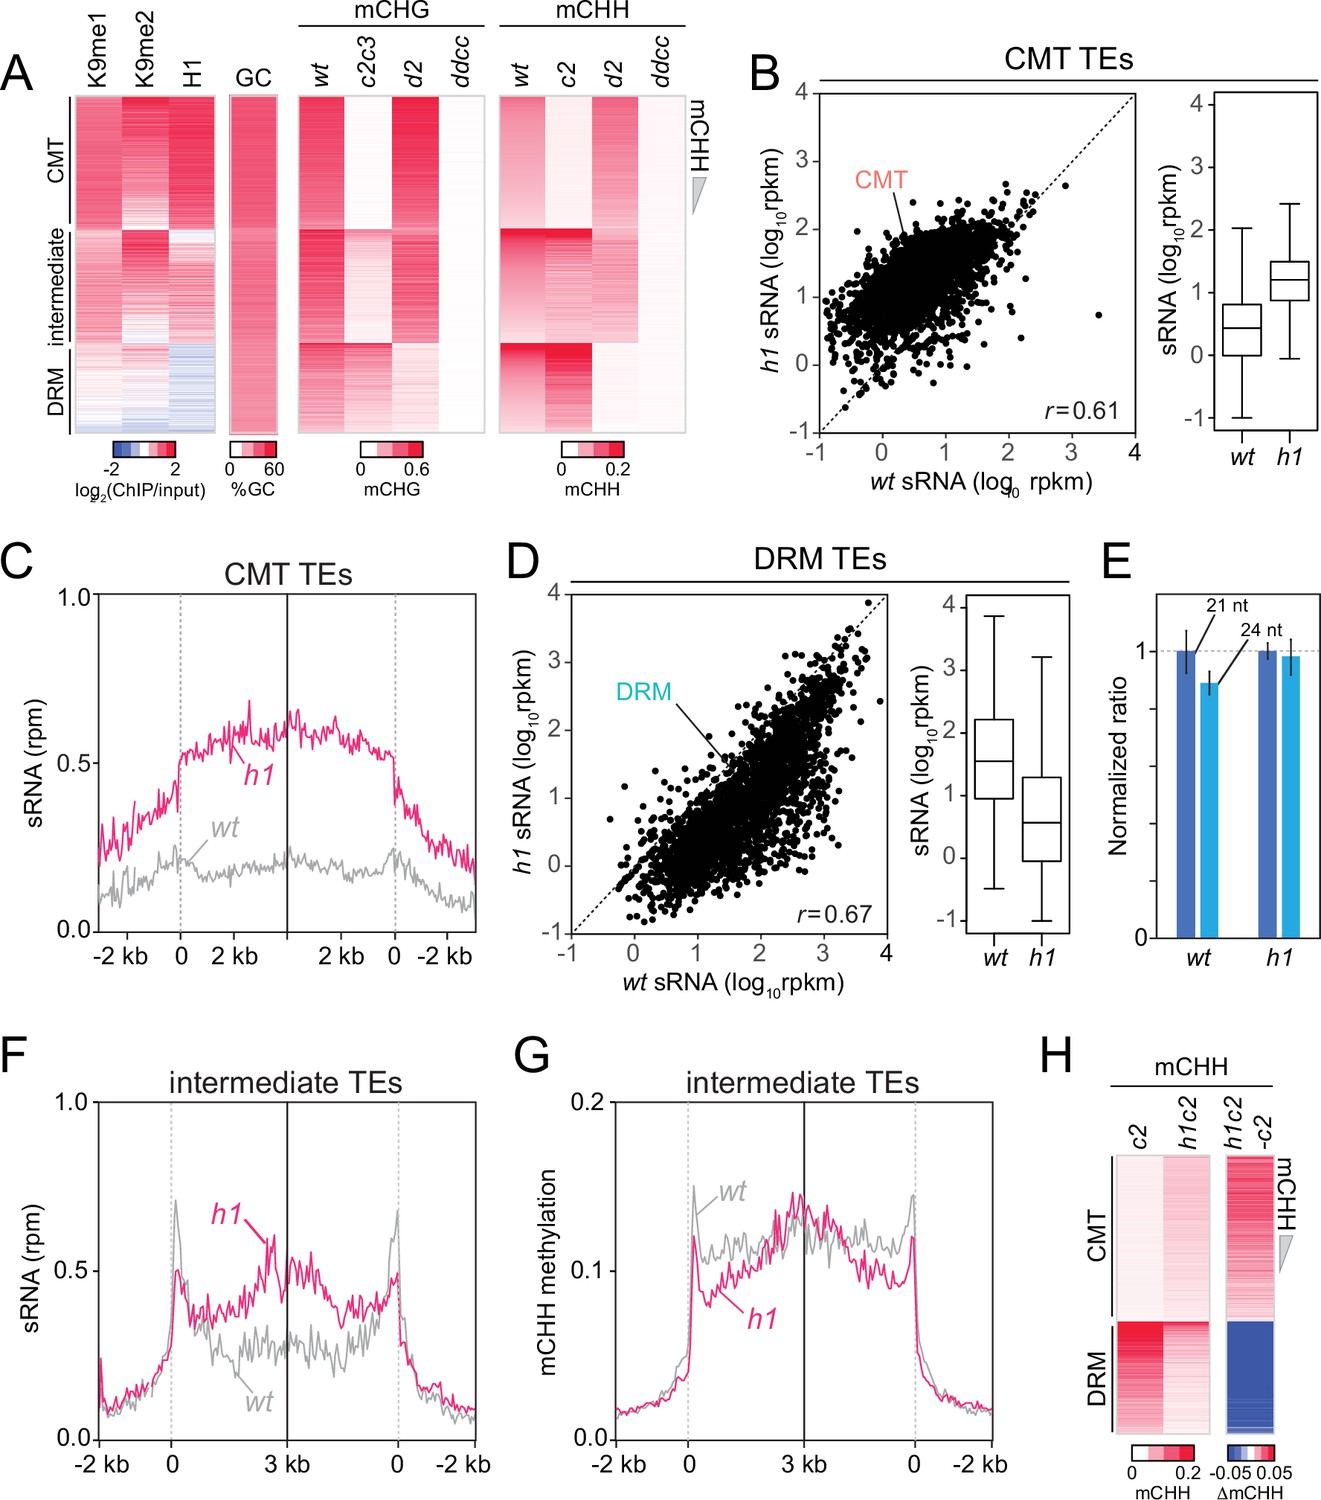
Chromomethylase (CMT) transposable elements (TEs) gain non-CG DNA methylation and small RNA (sRNA) expression in h1 plants.
(A) Heatmaps of H3K9me, H1, GC (G+C) content, CHG methylation (mCHG), and mCHH at CMT, DRM and intermediate TEs in wt, cmt2 (c2), cmt2cmt3 (c2c3), drm2 (d2), and drm1drm2cmt2cmt3 (ddcc) plants. 3807 intermediate TEs had more than 2% mCHH in cmt2 and drm2 plants (TEs longer than 200 bp). TEs were sorted by mCHH level in wt. (B) Average sRNA expression level of CMT TEs in wt and h1 plants. (C) Average sRNA distribution around CMT TEs in wt and h1 plants. (D) Average sRNA expression level of DRM TEs in wt and h1 plants. (E) Normalized number of mapped reads of 21-nt and 24-nt length sRNAs in wt and h1 plants. The number of mapped reads of 21-nt sRNA was normalized to 1. Average sRNA distribution (F) and mCHH level (G) around intermediate TEs in wt and h1 plants. (H) Heatmaps of mCHH in c2 and h1cmt2 (h1c2) plants. TEs were sorted by mCHH level in wt. (B, D) rpkm indicates reads per kilobase of transcript, per million mapped reads. r indicates Pearson’s correlation. (C) rpm indicates reads per million mapped reads.
Figure 2 with 1 supplement
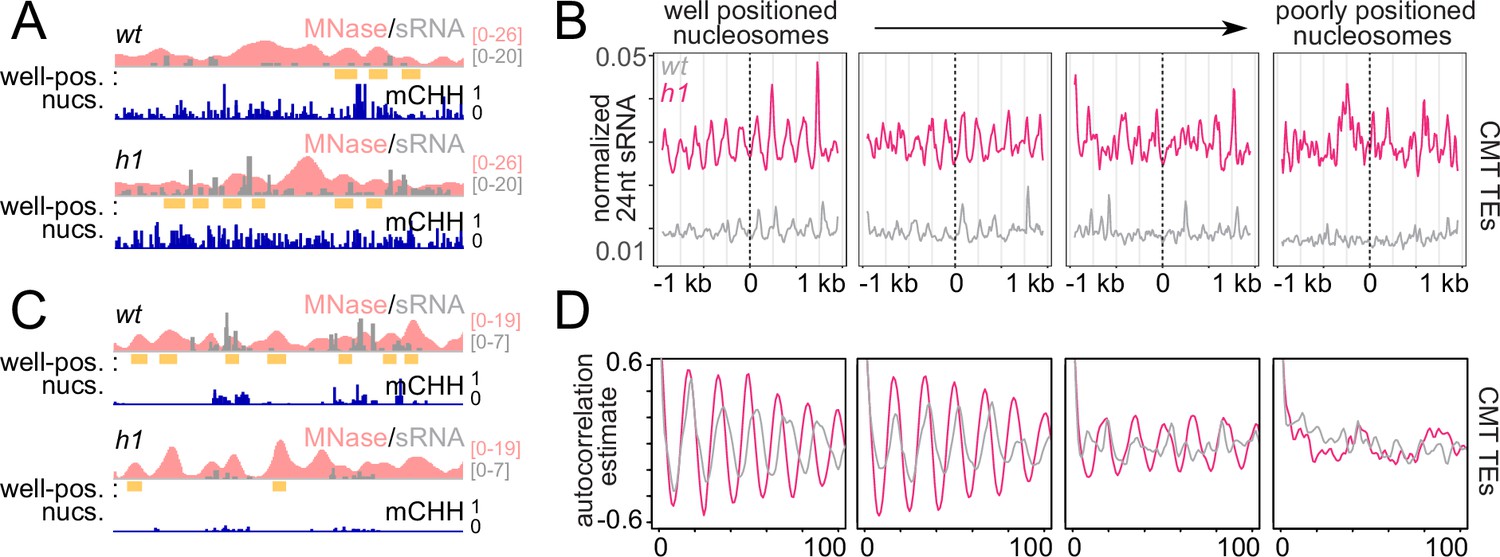
RdDM is preferentially active in linker DNA in h1 plants.
(A, C) Example of a chromomethylase (CMT) transposable element (TE; Chr2: 3,944,600–3,946,400) (A) and DRM TE (Chr2: 6,389,500–6,392,500) (C) with well-positioned nucleosomes (yellow boxes). Smoothed MNase-seq (apricot), sRNA expression (gray), and mCHH (indigo) are plotted. (B) Average sRNA expression around well positioned or poorly positioned nucleosomes at CMT TEs. (D) Autocorrelation estimates of average sRNA values shown in (B) to illustrate shortened small RNA (sRNA) phasing in h1 mutants corresponding to shortened nucleosome repeat length. Nucleosome positioning data and designations are from Lyons and Zilberman, 2017.
Figure 2—figure supplement 1
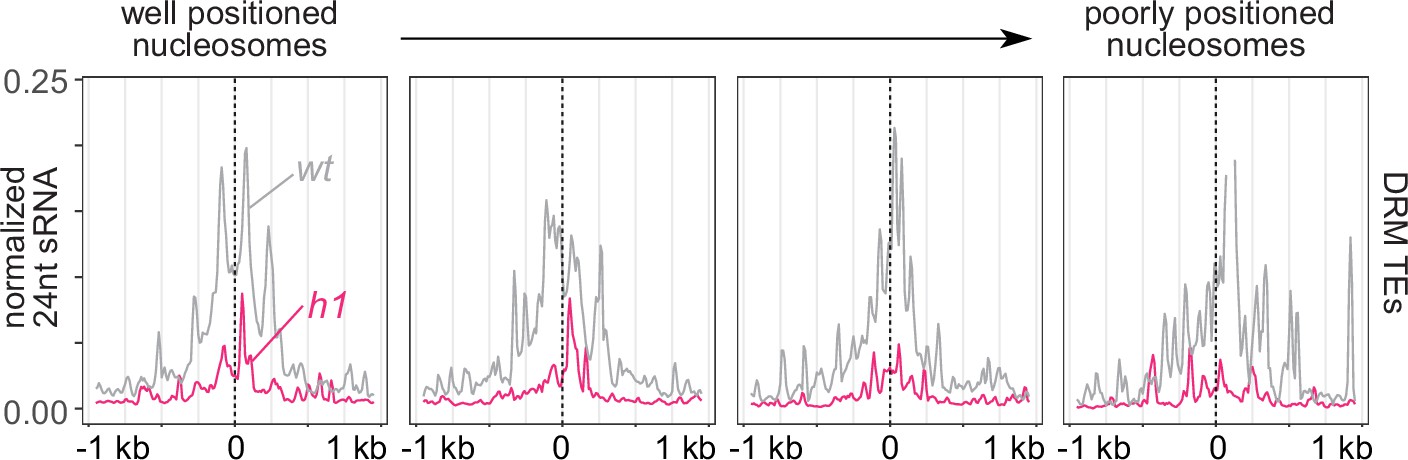
RNA-directed DNA methylation (RdDM) is enriched at linker DNA around well-positioned nucleosomes.
Average small RNA (sRNA) expression around well positioned (left) to increasingly poorly positioned nucleosomes at DRM transposable elements (TEs).
Figure 3
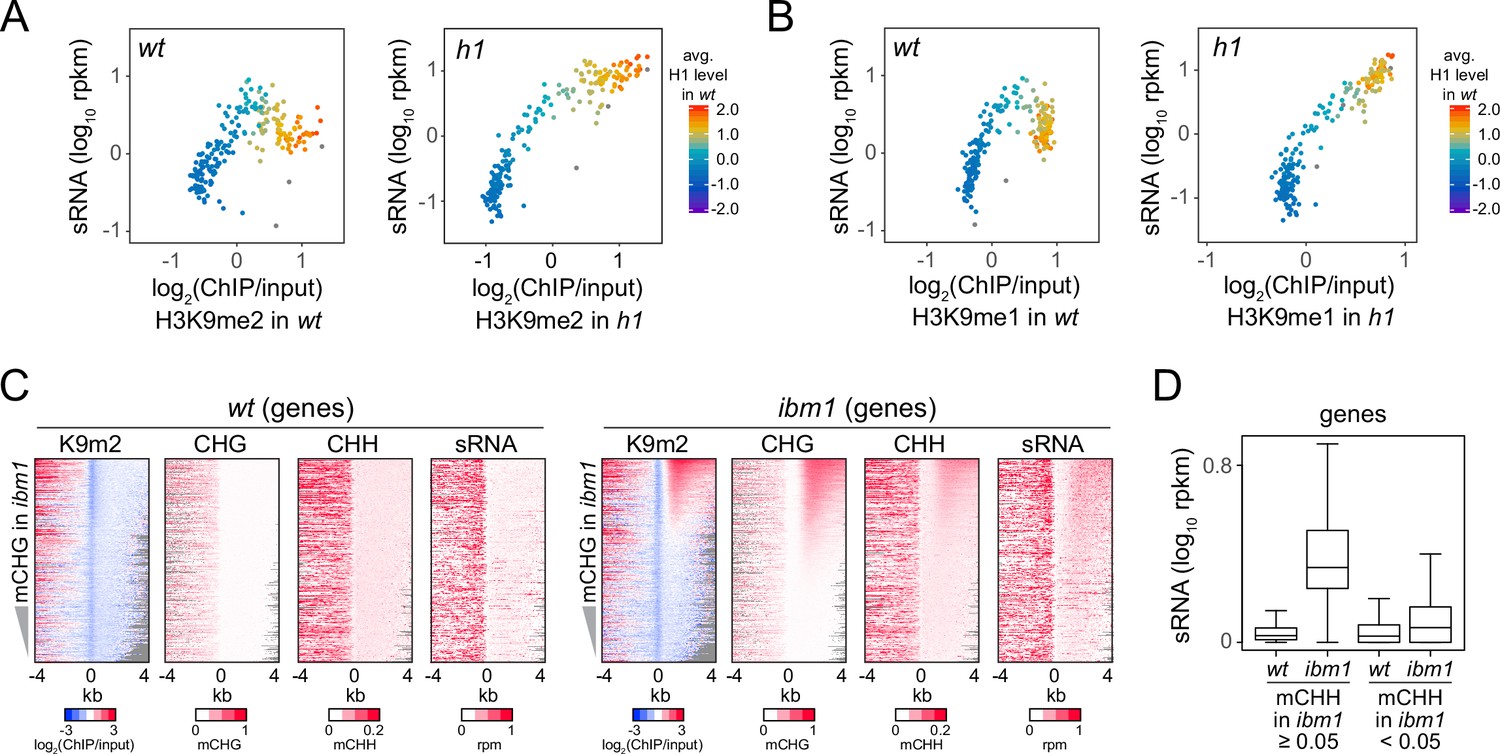
Small RNA (sRNA) biogenesis is associated with H3K9me and non-CG methylation.
(A, B) Average H3K9me2 (A) or H3K9me1 (B) (x-axis) and sRNA expression level (y-axis) in wt and h1. Each dot represents the average of 100 transposable elements (TEs) sorted by GC content. (C) Distribution of H3K9me2, non-CG methylation, and sRNA expression around 5′ ends of genes in wt and ibm1 plants. (D) A boxplot shows sRNA expression level at genes in wt and ibm1 plants. Genes that have more than 5% mCHH in ibm1 or less than 5% mCHH in ibm1 are plotted separately.
Figure 4 with 2 supplements

SHH1 is not required for non-CG hypermethylation in h1.
(A) Heatmaps of mCHH and small RNA (sRNA) expression at chromomethylase (CMT) and DRM transposable elements (TEs) in plants with shh1 or clsy mutations. (B) Venn diagram of TEs in indicated categories.
Figure 4—figure supplement 1
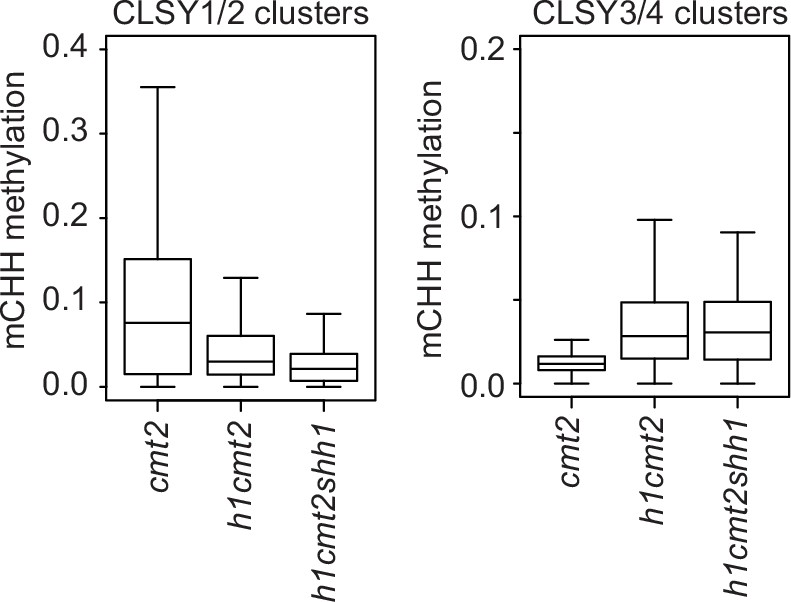
Loss of h1 causes chromomethylase (CMT)2-independent hypermethylation at transposable elements (TEs) with CLSY3/4 small RNA (sRNA) clusters.
Boxplots show mCHH at TEs within indicated CLSY clusters.
Figure 4—figure supplement 2
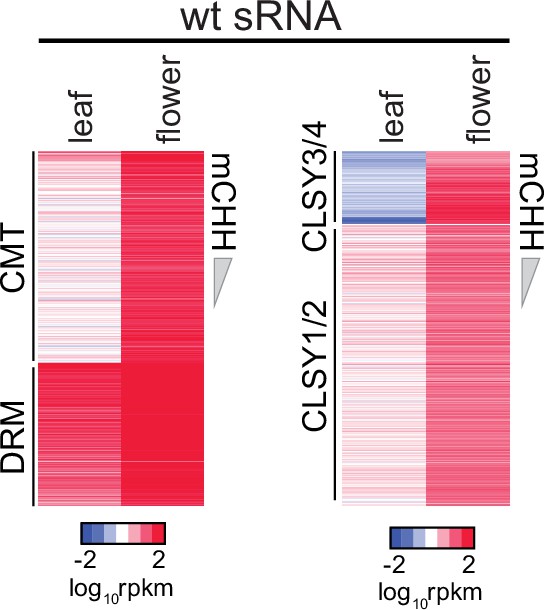
Heatmaps of wt sRNA expression at chromomethylase (CMT), DRM transposable elements (TEs) and CLSY1/2, CLSY3/4 small RNA (sRNA) clusters in leaves and flowers.
Figure 5 with 1 supplement
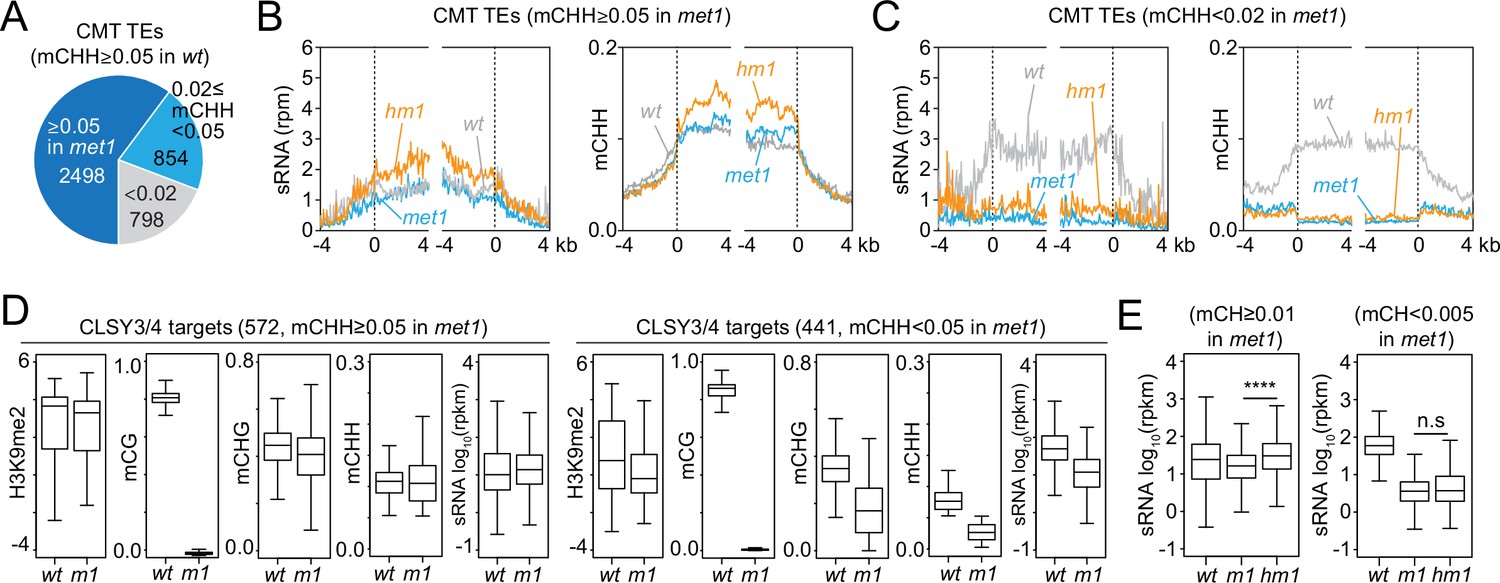
Small RNA (sRNA) expression at CLSY3/4 clusters is independent of CG methylation (mCG).
(A) The number of chromomethylase (CMT) transposable elements (TEs; mCHH ≥0.05 in wt) that maintain mCHH in met1 (mCHH ≥0.05 in met1; 2498) or lose mCHH in met1 (mCHH <0.02 in met1; 798). (B, C) Averaged sRNA distribution and mCHH levels around CMT TEs in wt, met1, and h1met1 (hm1) plants that maintain mCHH in met1 (mCHH ≥0.05 in met1; B) and lose mCHH in met1 (mCHH <0.02 in met1; C). (D) Boxplots of H3K9me2, DNA methylation, and sRNA expression at CLSY3/4 sRNA clusters in wt and met1 (m1). CLSY3/4 clusters that maintain more than 5% mCHH in met1 or less than 5% mCHH in met1 are plotted separately. (E) sRNA expression level at CLSY3/4 sRNA clusters that maintain non-CG methylation (mCH >0.01) in met1 or lose non-CG methylation (mCH <0.005) in met1. Non-CG methylation (mCH) density equals number of mCH sites per base pair. **** indicates p < 0.0001.
Figure 5—figure supplement 1

DNA methylation and small RNA (sRNA) expression changes in met1 and h1met1.
(A) H3K9me2 levels around chromomethylase (CMT) transposable elements (TEs) that maintain mCHH (mCHH ≥0.05) in met1 and lose mCHH (mCHH <0.02) in met1. (B) Kernel density distribution of sRNA expression changes at CLSY3/4 sRNA clusters in met1 (vs. wt) that maintain more than 5% mCHH in met1 or less than 5% mCHH in met1. (C) Heatmaps of DNA methylation and sRNA expression at CLSY3/4 clusters in wt, met1 (m1), and h1met1 (hm1). TEs were sorted by non-CG methylation level (mCH) in met1.
Figure 6 with 1 supplement
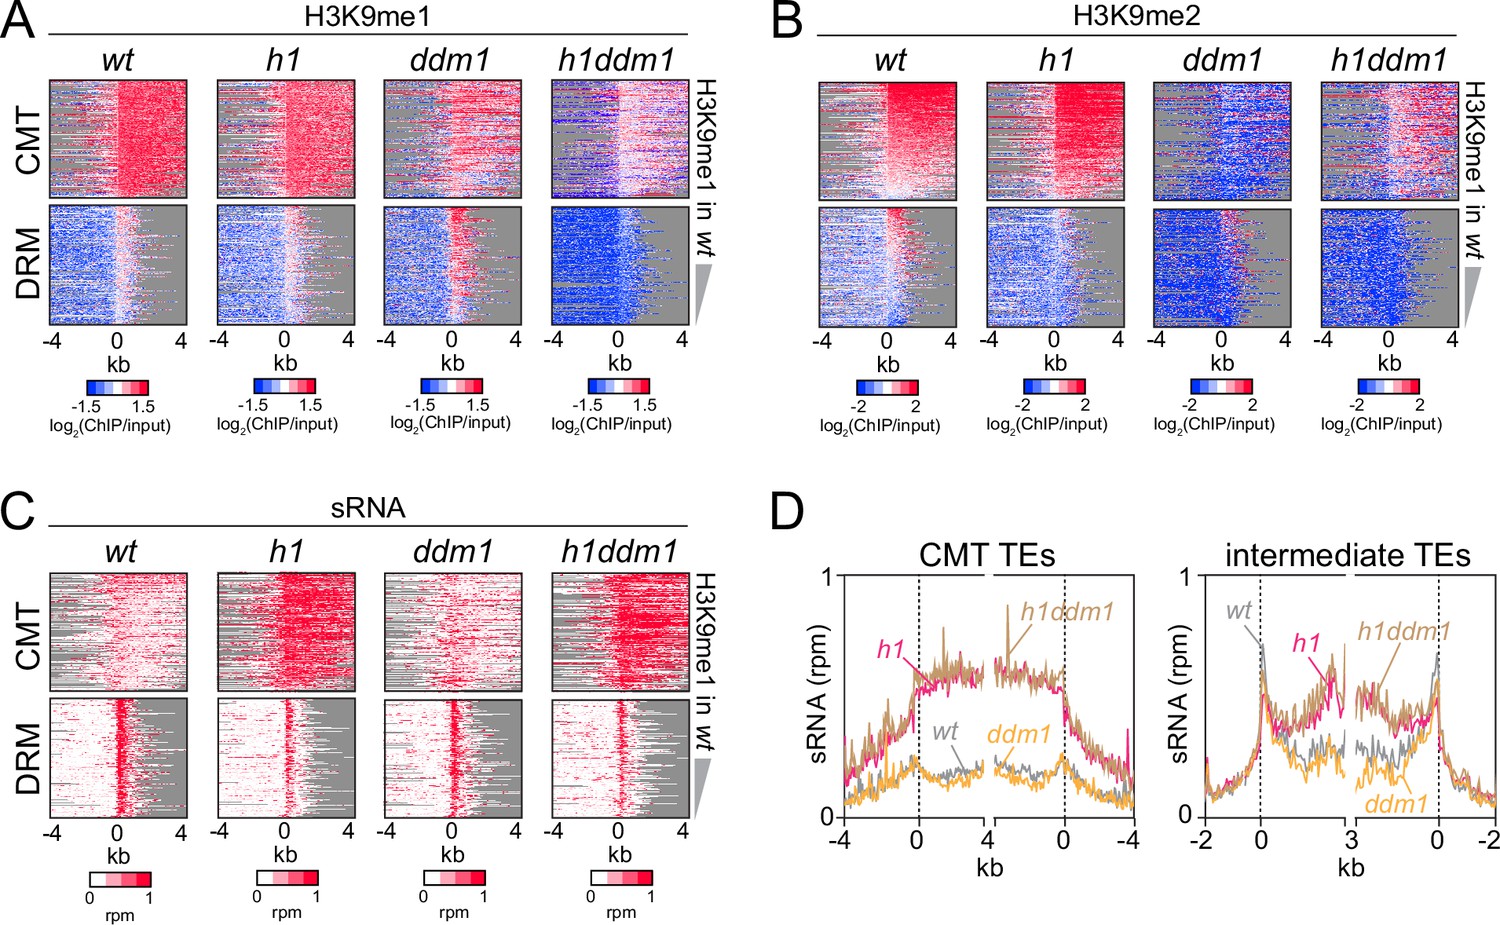
Severely reduced H3K9 methylation does not prevent small RNA (sRNA) expansion.
(A-C) Distribution of H3K9 methylation (A, B) and sRNA expression (C) around 5′ ends of chromomethylase (CMT) and DRM transposable elements (TEs) in wt, h1, ddm1, and h1ddm1 plants. (D) Averaged sRNA distribution around CMT and intermediate TEs in wt, h1, ddm1, and h1ddm1 plants.
Figure 6—figure supplement 1
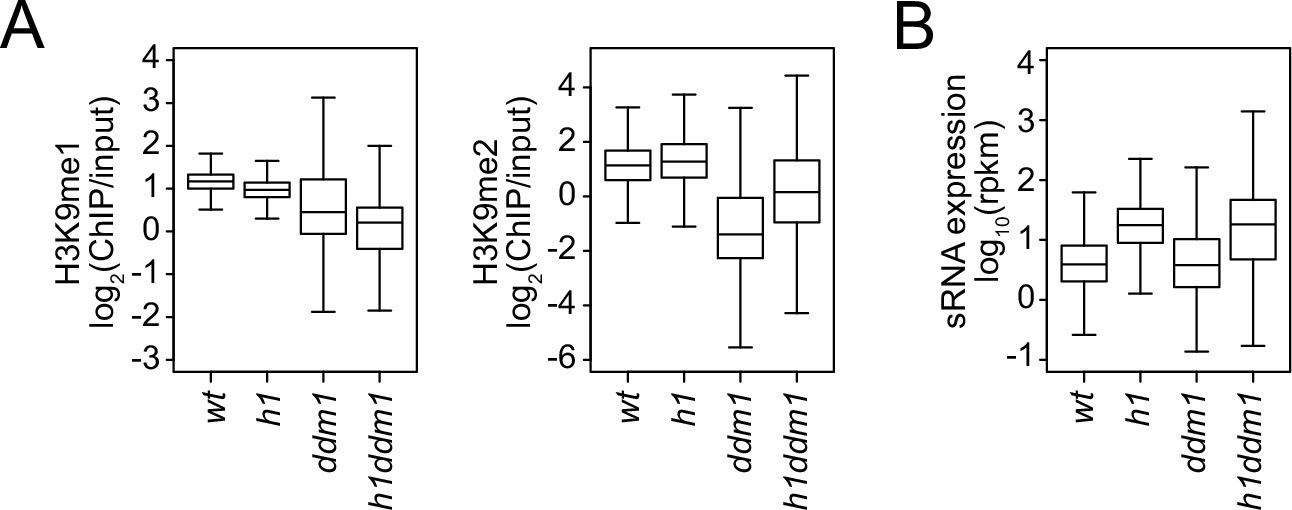
Small RNA (sRNA) expression and H3K9 methylation changes in h1, ddm1, and h1ddm1.
Boxplots of H3K9 methylation levels (A) and sRNA expression (B) at chromomethylase (CMT) transposable elements (TEs) in wt, h1, ddm1, and h1ddm1 plants.
Figure 7 with 1 supplement
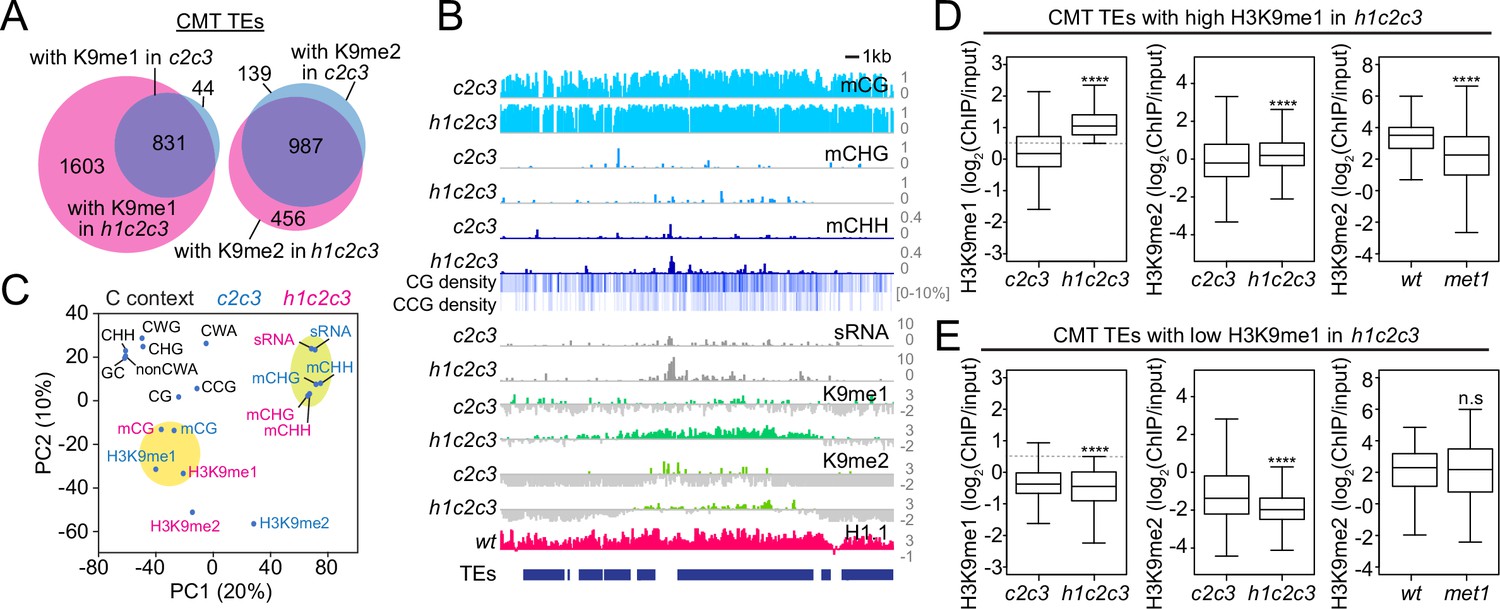
Non-CG DNA methylation and H3K9 methylation are decoupled in h1c2c3.
(A) Number of chromomethylase (CMT) transposable elements (TEs) with H3K9 methylation (average H3K9me1 [K9me1] or H3K9me2 [K9me2] >0.5) in cmt2cmt3 (c2c3) or h1cmt2cmt3 (h1c2c3) plants. (B) Example of DNA methylation, CG and CCG density, H1 level, H3K9 methylation, and small RNA (sRNA) expression around CMT TEs in c2c3 and h1c2c3 plants (Chr3: 14,495,000–14,520,000). (C) Principal component analysis of H3K9me, cytosine content (total GC content, CG, CCG, CHG, CHH, CWG, CWA, and non-CWA [W = A and T]), DNA methylation, and sRNA expression in c2c3 and h1c2c3 plants. (D, E) H3K9me levels at CMT TEs with high H3K9me1 (H3K9me1 ≥0.5; D) or low H3K9me1 (H3K9me1 <0.5; E) in h1c2c3 plants. **** indicates p < 0.0001.
Figure 7—figure supplement 1
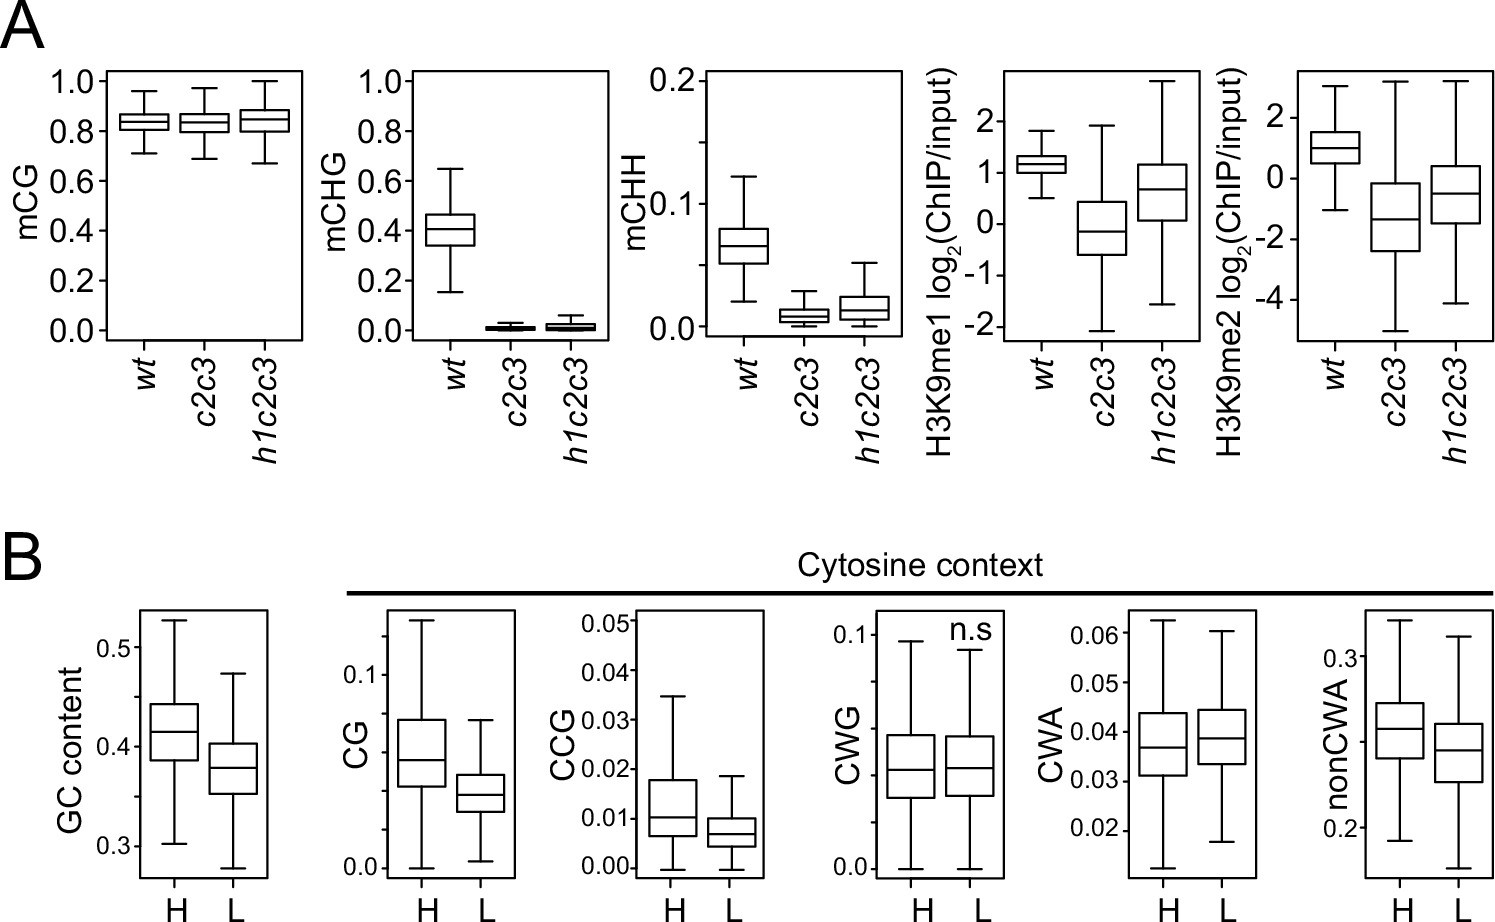
Analysis of chromatin features at chromomethylase (CMT) transposable elements (TEs).
(A) Boxplots of DNA methylation and H3K9 methylation levels at CMT TEs in wt, cmt2cmt3 (c2c3), and h1cmt2cmt3 (h1c2c3) plants. (B) Cytosine context density (total GC content, CG, CCG, CWG, CWA, and non-CWA [W = A and T]) at CMT TEs with high H3K9me1 (H3K9me1 ≥0.5; H) and low H3K9me1 (H3K9me1 <0.5; L) in h1c2c3 plants.
Figure 8 with 1 supplement
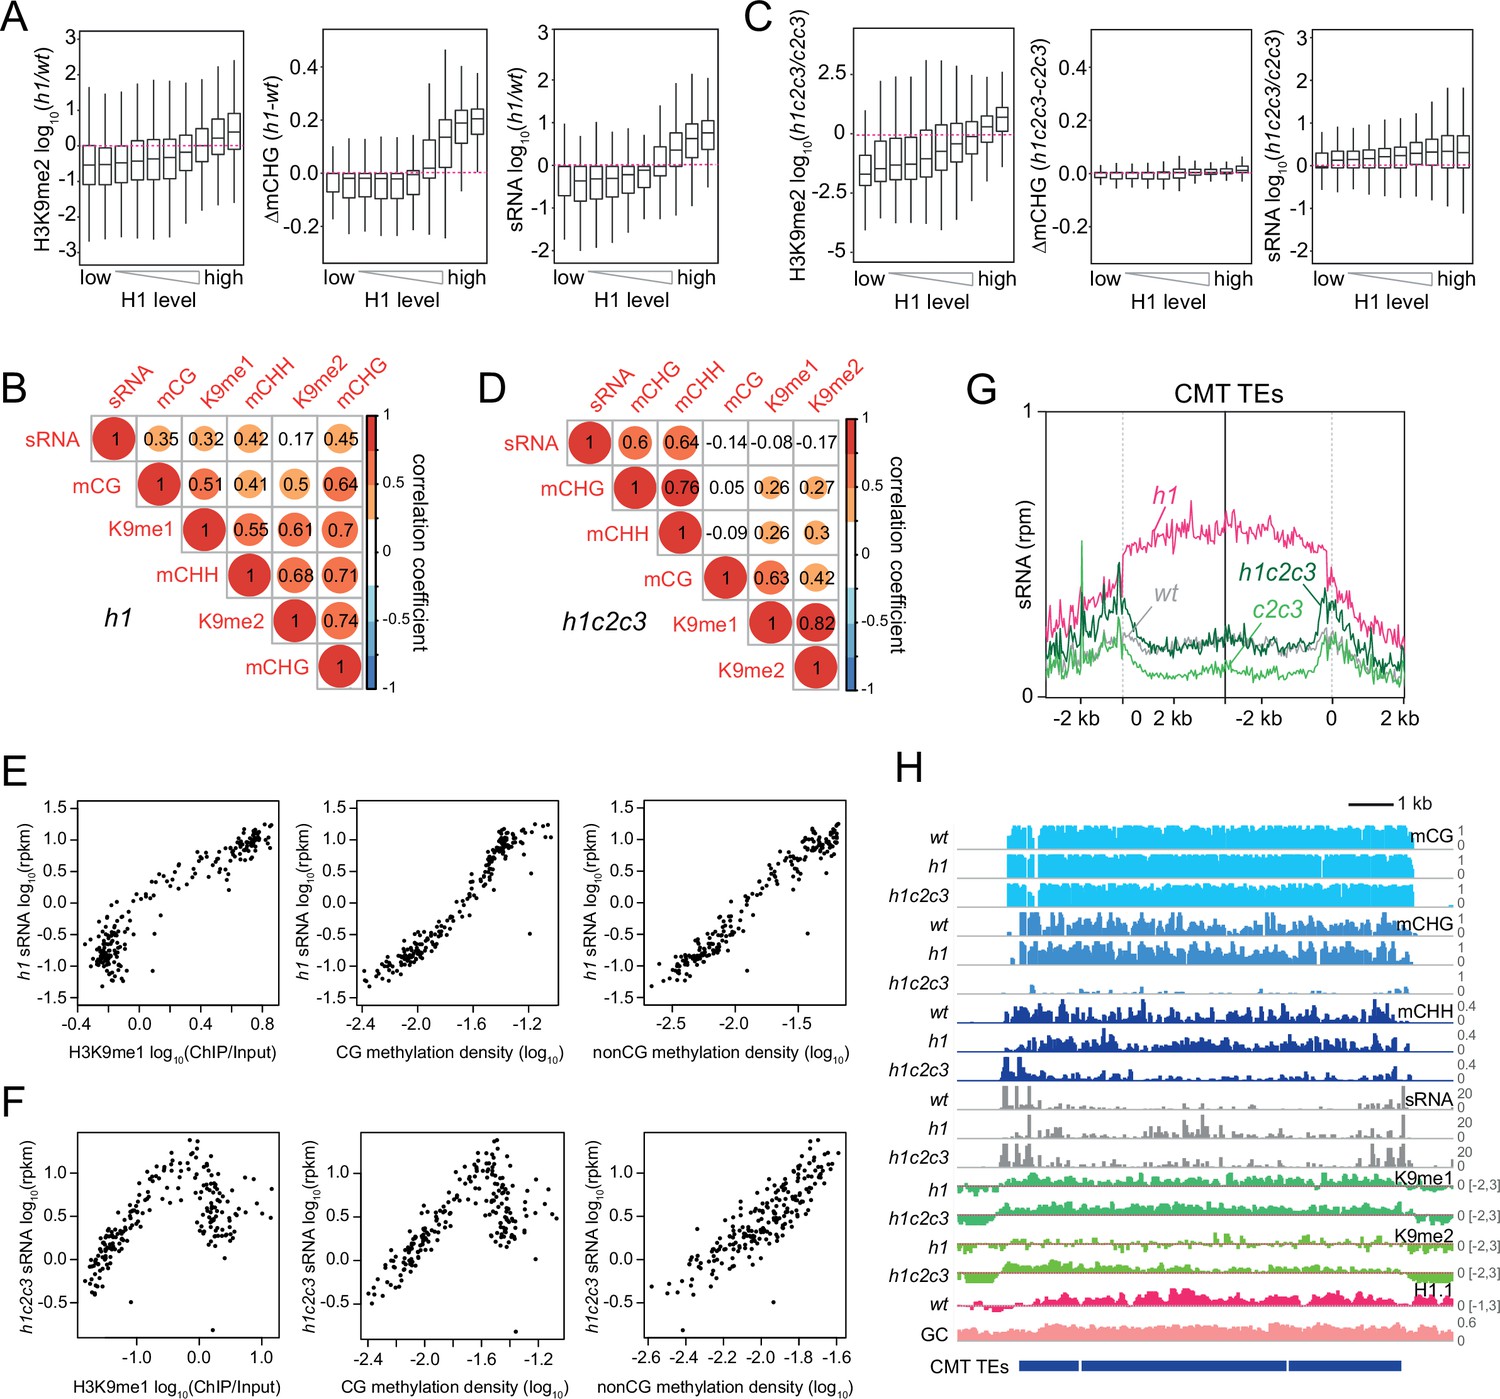
Small RNA (sRNA) expression specifically correlates with non-CG methylation.
(A, C) Boxplots of H3K9me2, CHG methylation (mCHG), and sRNA expression changes in h1 vs. wt (A) and h1c2c3 vs. c2c3 (C). (B, D) Correlation among H3K9 methylation, DNA methylation, and sRNA expression in h1 plants (B) and h1c2c3 plants (D). (E, F) sRNA expression relation to H3K9me1, CG, and non-CG methylation density in h1 plants (E) and h1c2c3 plants (F). Each dot represents the average of 100 transposable elements (TEs) sorted by GC content. DNA methylation density equals number of methylated sites per base pair. (G) Average sRNA expression level of chromomethylase (CMT) TEs in wt, h1, c2c3, and h1c2c3 plants. (H) Example of DNA methylation, sRNA expression, H3K9 methylation (K9me1 and K9me2), and H1.1 distribution at CMT TEs in wt, h1, and h1c2c3 plants (Chr2: 6,548,000–6,559,000).
Figure 8—figure supplement 1
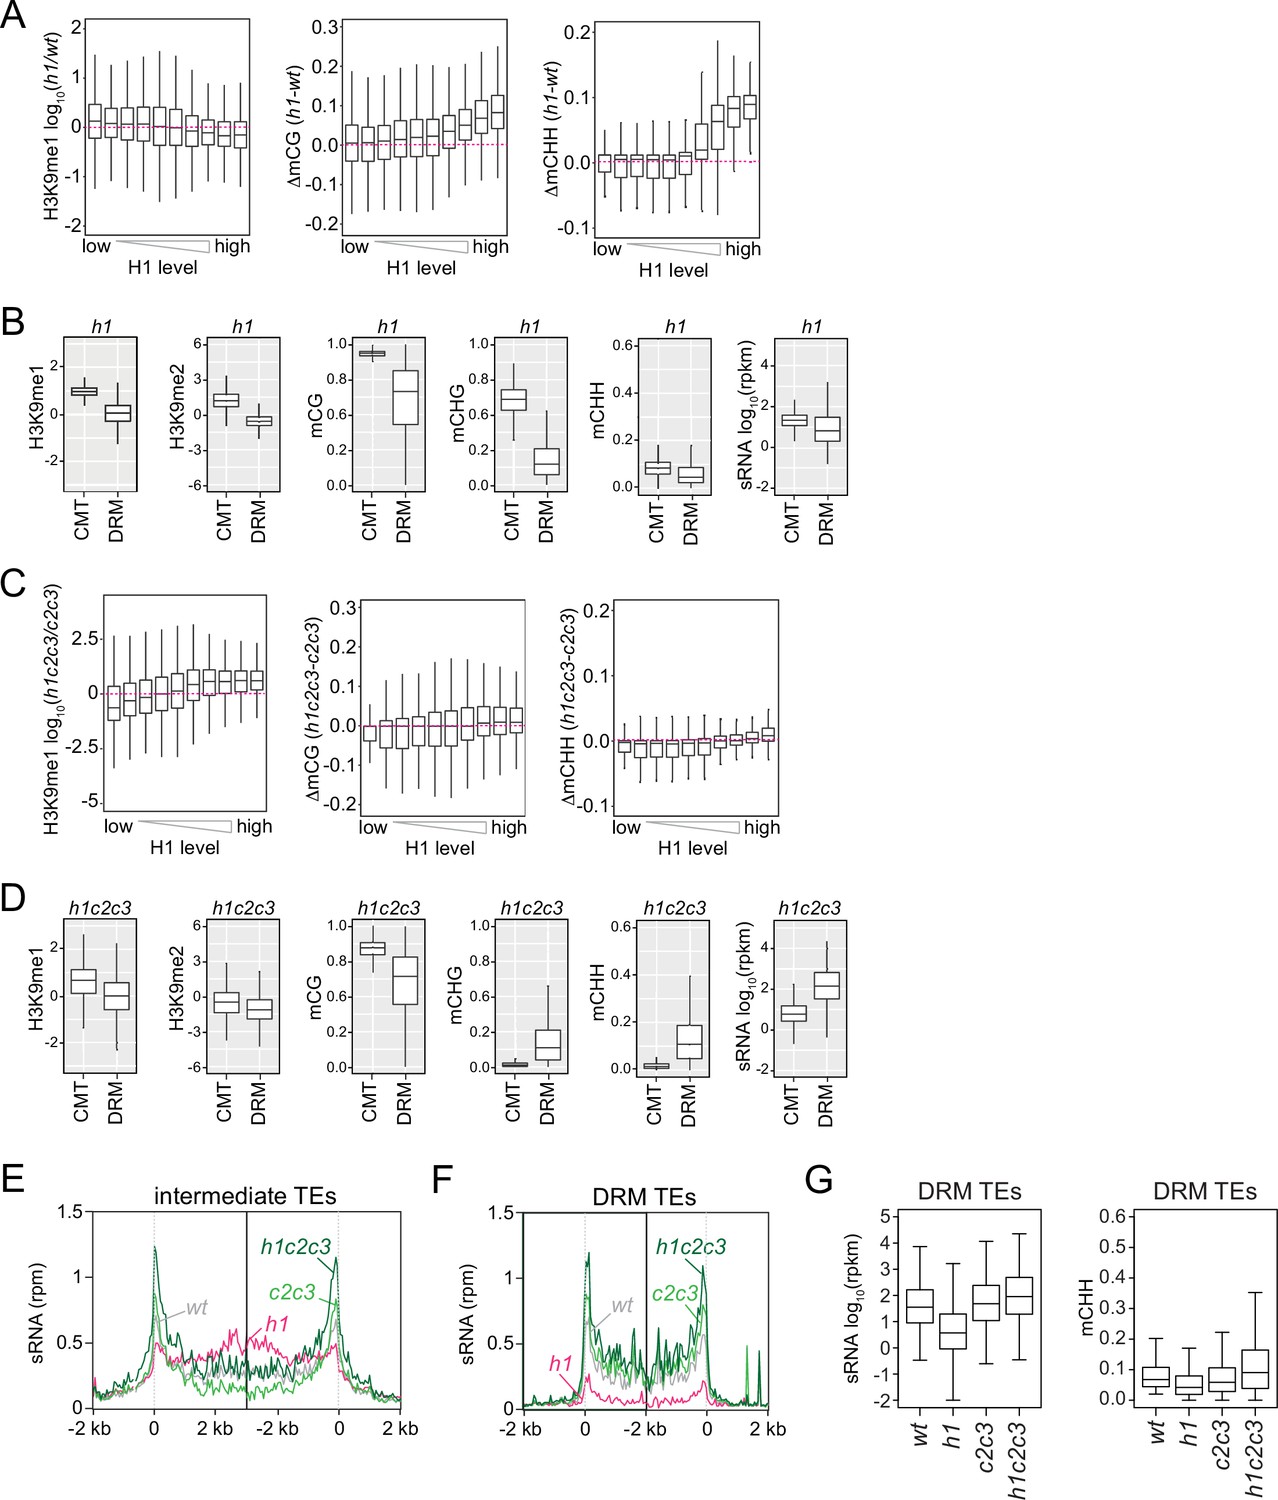
H3K9 methylation, DNA methylation, and small RNA (sRNA) expression in h1 and h1c2c3 plants.
(A, C) Boxplots of H3K9me1, mCG, and mCHH change in h1 vs. wt (A) and h1c2c3 vs. c2c3 (C). (B, D) Boxplots of H3K9 methylation, DNA methylation, and sRNA expression levels at chromomethylase (CMT) and DRM transposable elements (TEs) in h1 plants (B) and h1c2c3 plants (D). (E, F) Average sRNA expression level of intermediate TEs (E) and DRM TEs (F) in wt, h1, c2c3, and h1c2c3 plants. (G) Boxplots of sRNA expression and mCHH levels at DRM TEs in wt, h1, c2c3, and h1c2c3 plants.
Figure 9

CLSY1/2-dependent small RNA (sRNA) expression is associated with non-CG methylation.
(A) Boxplots of H3K9me1, H3K9me2, mCHH, and sRNA expression levels at CLSY1/2-dependent sRNA clusters in h1c2c3 plants. sRNA clusters were classified by H3K9 methylation level (H3K9me1 >0.5, H3K9me2 >0 as high H3K9me [H], and the rest as low H3K9me [L]) and mCHH level (mCHH >0.05 as high mCHH [H] and the rest as low mCHH [L]). (B) Boxplots of H3K9me2, mCHH, and sRNA expression levels at CLSY1/2-dependent sRNA clusters in suvh4/5/6 plants. sRNA clusters were classified by H3K9me2 level (H3K9me2 >0 as high H3K9me2 [H] and the rest as low H3K9me2 [L]) and mCHH level as in (A). (C) Examples of CLSY1/2 sRNA clusters with high H3K9me2 in suvh4/5/6 but different non-CG methylation levels (Chr1: 17,520,000–17,538,000). (D) Correlation among H3K9me2, DNA methylation, and sRNA expression in suvh4/5/6 plants. (E) Overlap between H3K9me2 low/mCHH high CLSY1/2 clusters (LH) in suvh4/5/6 plants and mCHH demethylated CLSY1/2 clusters in polv plants. (F-H) Boxplots of non-CG methylation levels (F), sRNA expression (G), and mCG levels (H) at 597 CLSY1/2 clusters that lose mCHH in polv (blue in panel E).
Figure 10
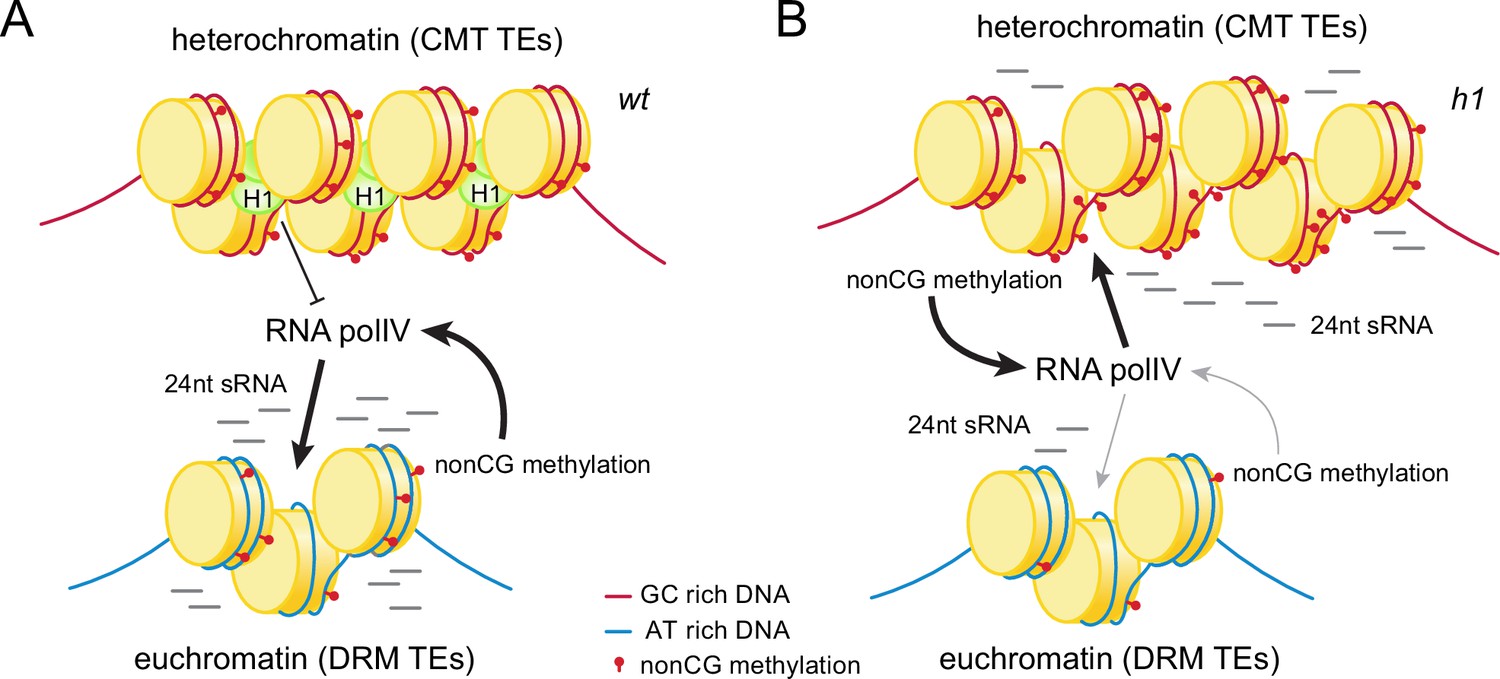
Histone H1 prevents non-CG methylation-mediated small RNA (sRNA) biogenesis in Arabidopsis heterochromatin.
(A) In wt plants, H1 binds to GC-rich chromomethylase (CMT) transposable elements (TEs) to restrict access of RNA polymerase IV (Pol IV). Pol IV binds to DRM TEs and produces sRNA. (B) In h1 plants, RNA Pol IV can transcribe non-CG-methylated CMT TEs to produce 24-nt sRNA, which leads to DNA methylation of CMT TEs and reduced activity at DRM TEs.
Tables
Key resources table
| Reagent type (species) or resource | Designation | Source or reference | Identifiers | Additional information |
|---|---|---|---|---|
| Antibody | anti-H3K9me1 (Rabbit polyclonal) | Millipore | 07-450RRID:AB_310625 | 1:200 |
| Antibody | anti-H3K9me2 (Mouse monoclonal) | Abcam | ab1220RRID:AB_449854 | 1:200 |
| Commercial assay or kit | Library construction (Native ChIP) | Tecan | 3460-24 | |
| Commercial assay or kit | Bisulfite conversion | QIAGEN | 59,104 | |
| Commercial assay or kit | Library construction (bisulfite sequencing) | New England Biolabs | E7645 and E7335S | |
| Commercial assay or kit | Library construction (small RNA) | Illumina | RS-200-0012 and RS-200-0024 | |
| Software, algorithm | cutadapt | doi:10.14806/ej.17.1.200 | RRID:SCR_011841 | |
| Software, algorithm | bowtie | doi:https://doi.org.10.1186/gb-2009-10-3-r25 | RRID:SCR_005476 | |
| Software, algorithm | deepTools2 | doi:10.1093/nar/gkw257 | ||
| Software, algorithm | dzlabtools | doi:10.1126/science.1172417 | https://zilbermanlab.net/tools/ | |
| Software, algorithm | RandomForestExplainer | doi:10.1198/jasa.2009.tm08622 | ||
| Software, algorithm | IGV | doi:10.1038/nbt.1754 | RRID:SCR_011793 | |
| Software, algorithm | Gene Cluster 3.0 | doi:10.1093/bioinformatics/bth078 | ||
| Software, algorithm | corrplot | doi:10.1198/000313002533doi:10.1080/00031305.1996.10474371 | ||
| Software, algorithm | Treeview | doi:10.1093/bioinformatics/bth078 | RRID:SCR_016916 |
Additional files
Download links
A two-part list of links to download the article, or parts of the article, in various formats.
Downloads (link to download the article as PDF)
Open citations (links to open the citations from this article in various online reference manager services)
Cite this article (links to download the citations from this article in formats compatible with various reference manager tools)
Histone H1 prevents non-CG methylation-mediated small RNA biogenesis in Arabidopsis heterochromatin
eLife 10:e72676.
https://doi.org/10.7554/eLife.72676


