Early evolution of beetles regulated by the end-Permian deforestation
- State Key Laboratory of Palaeobiology and Stratigraphy, Nanjing Institute of Geology and Palaeontology and Center for Excellence in Life and Paleoenvironment, Chinese Academy of Sciences, China
- University of Chinese Academy of Sciences, China
- Institute of Vertebrate Paleontology and Paleoanthropology, Chinese Academy of Sciences, China
- Department of Earth and Planetary Sciences, University of California, Santa Cruz, United States
- Palaeontological Institute, Russian Academy of Sciences, Russian Federation
- Institute of Geology and Paleontology, Linyi University, China
- Department of Earth Sciences, Natural History Museum, United Kingdom
Figures
Figure 1
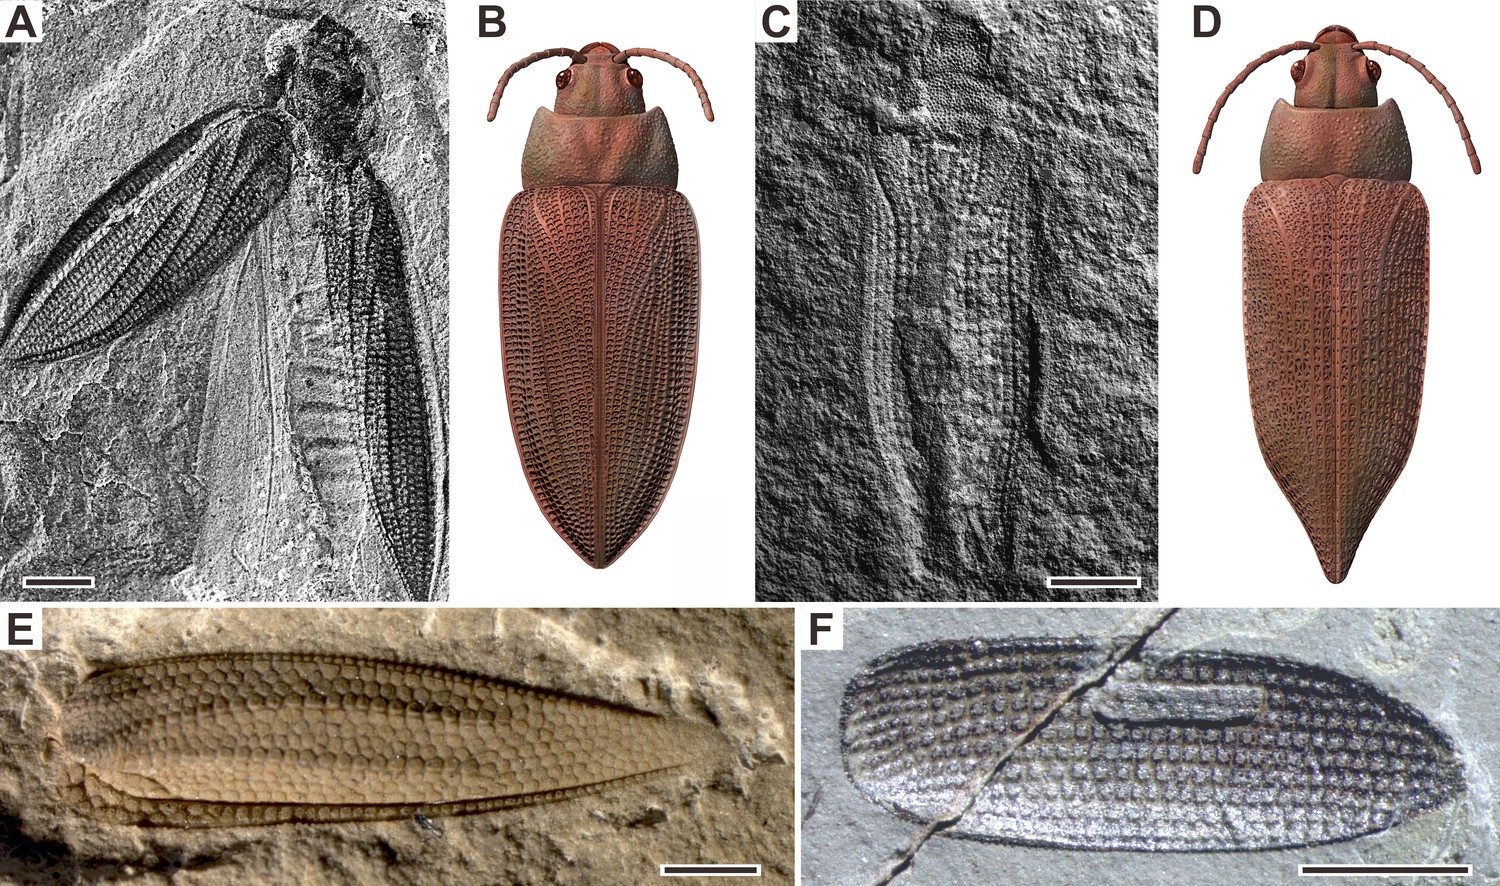
Examples of Permian beetles.
(A and B) Tshekardocoleidae, Moravocoleus permianus Kukalová, 1969, photograph and reconstruction. (C and D) Permocupedinae, Permocupes sojanensis Ponomarenko, 1969, photograph and reconstruction. (E) Tshekardocoleidae, Sylvacoleus richteri Ponomarenko, 1963, elytra photograph. (F) Taldycupedinae, Taldycupes reticulatus Ponomarenko, 1969, elytra photograph. Scale bars represent 1 mm.
Figure 2 with 1 supplement
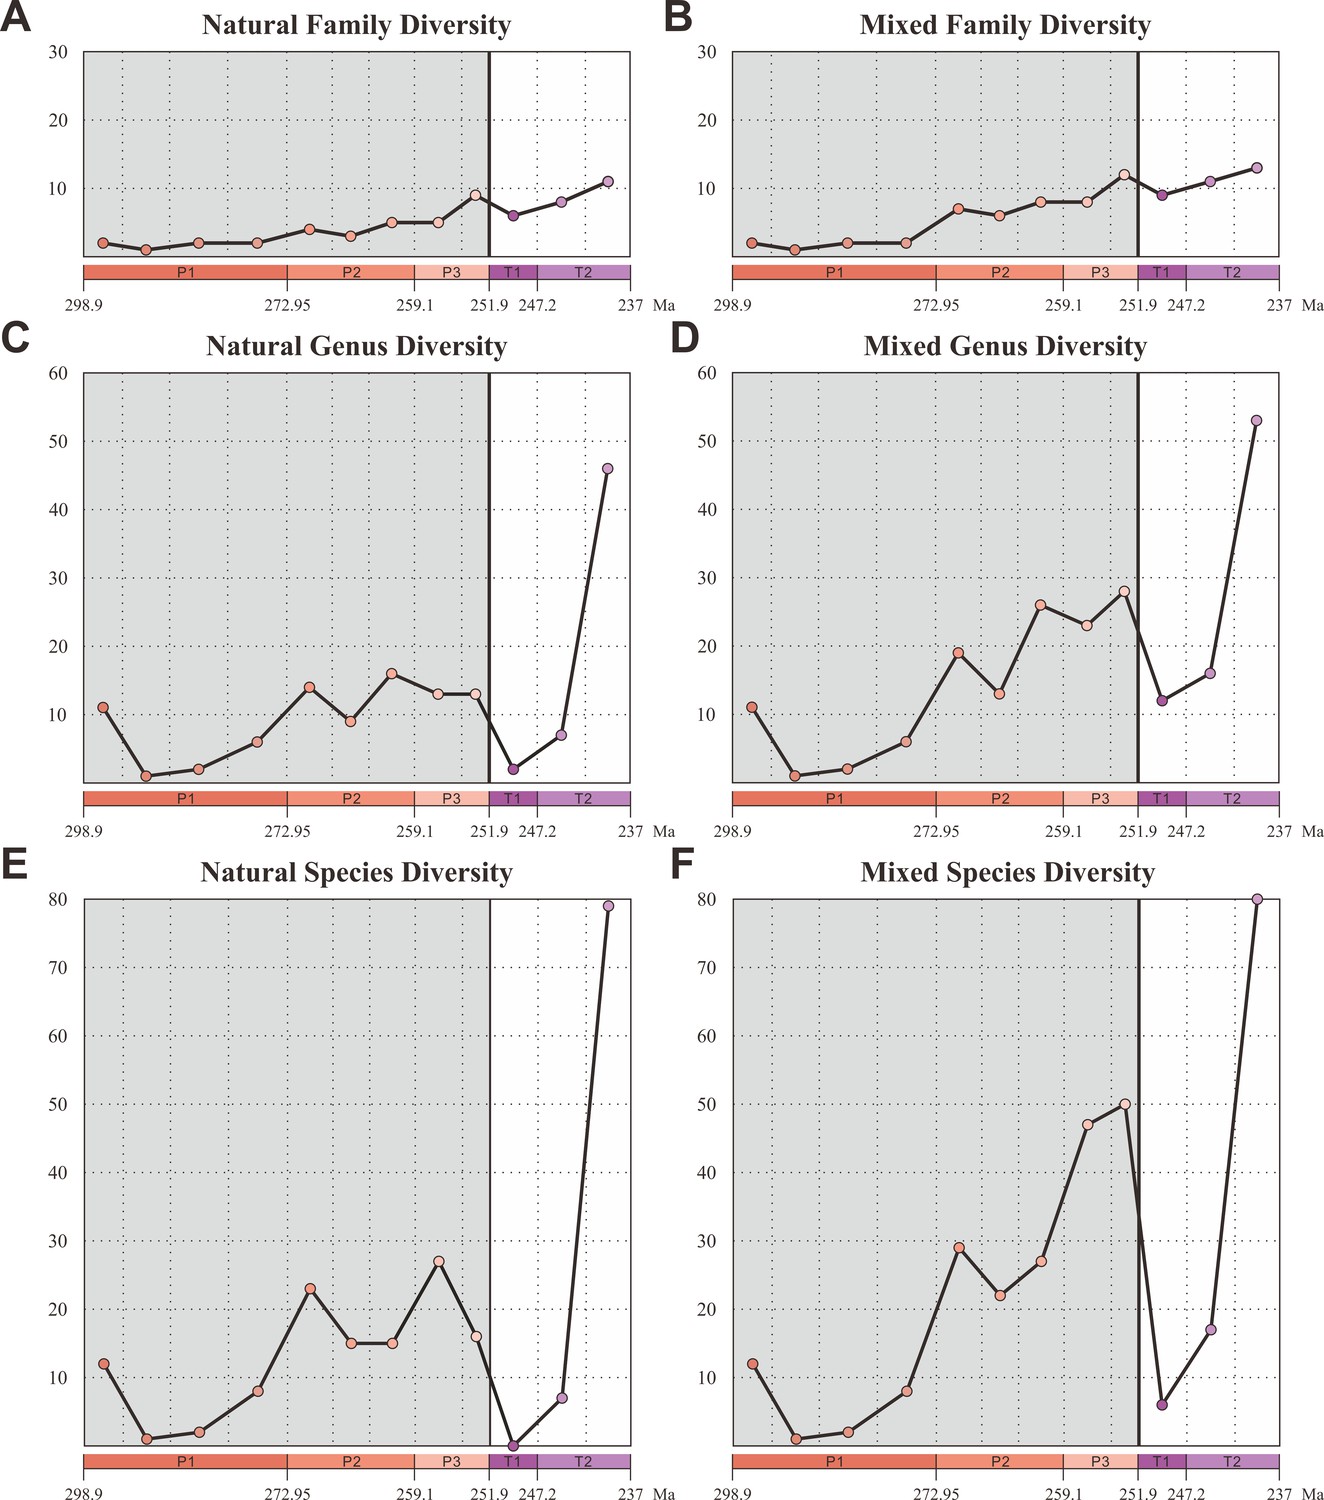
Diversity of Coleoptera from the Early Permian to Middle Triassic.
Natural taxa and mixed taxa (natural taxa and formal taxa) are counted at family, genus, and species levels separately. (A) Family-level diversity of natural taxa. (B) Family-level diversity of mixed taxa. (C) Genus-level diversity of natural taxa. (D) Genus-level diversity of mixed taxa. (E) Species-level diversity of natural taxa. (F) Species-level diversity of mixed taxa. Abbreviations: P1, Early Permian; P2, Middle Permian; P3, Late Permian; T1, Early Triassic; T2, Middle Triassic.
-
Figure 2—source data 1
Fossil coleoptera database.
- https://cdn.elifesciences.org/articles/72692/elife-72692-fig2-data1-v2.xlsx
Figure 2—figure supplement 1

Diversity of Coleoptera formal groups from the Early Permian to Middle Triassic.
(A) Family-level diversity. (B) Genus-level diversity. (C) Species-level diversity. Abbreviations: P1, Early Permian; P2, Middle Permian; P3, Late Permian; T1, Early Triassic; T2, Middle Triassic.
Figure 3 with 1 supplement
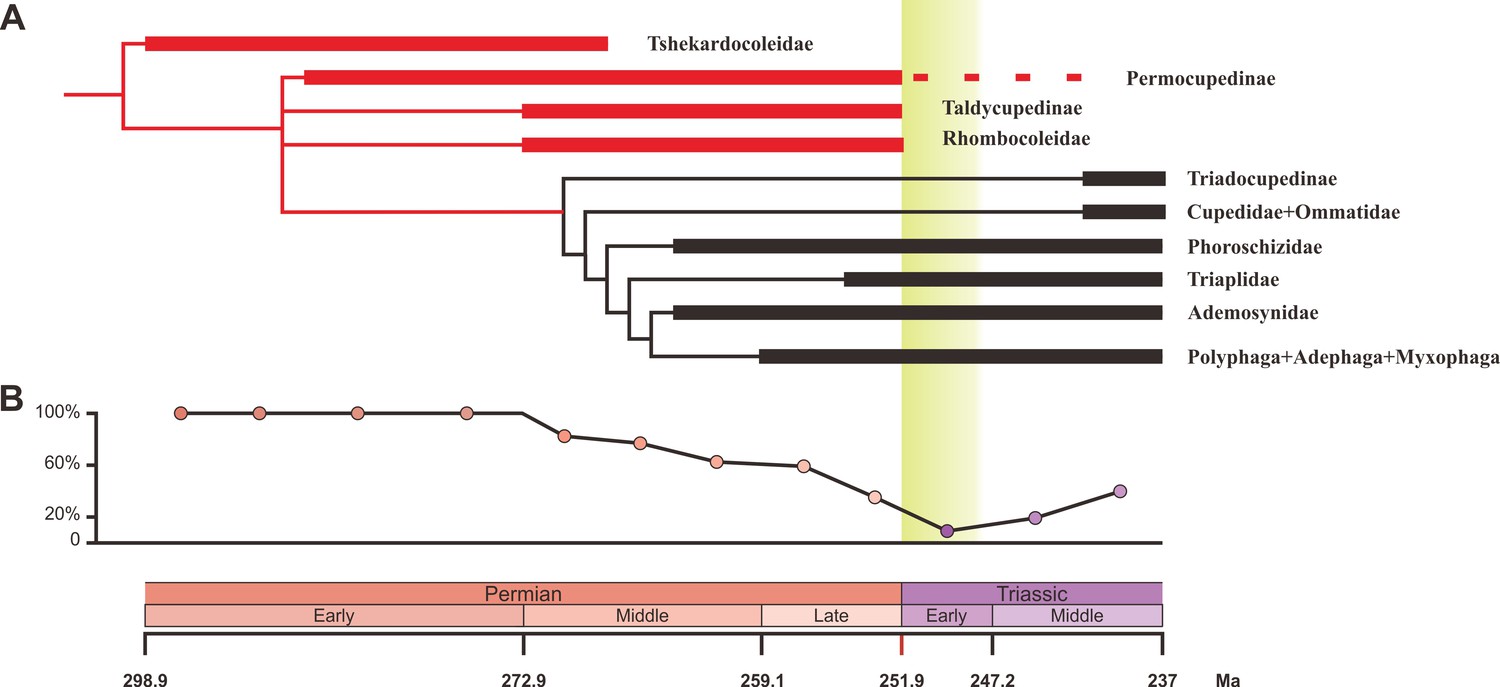
Ecological shifts of Coleoptera from the Early Permian to Middle Triassic.
(A) Simplified phylogeny of Coleoptera from the Early Permian to Middle Triassic. Thick lines indicate the known extent of the fossil record. The branches representing stem groups are shown in red. The ‘dead clade walking’ pattern is symbolized by the dashed line. For details of the phylogenetic analysis, see Figure 3—figure supplement 1. (B) Genus percentage of xylophagous groups from the Early Permian to Middle Triassic. Yellow graded band represents the ‘coal gap’.
-
Figure 3—source data 1
Character state matrix for the phylogenetic analysis.
- https://cdn.elifesciences.org/articles/72692/elife-72692-fig3-data1-v2.xlsx
Figure 3—figure supplement 1

Strict consensus tree of three most parsimonious trees of Coleoptera.
Tree length = 199, consistency index (CI) = 0.800, retention index (RI) = 0.747. Numbers on branches denote bootstrap frequencies; bootstrap frequencies below 50 are not shown. The unambiguous apomorphies are mapped on the tree.
Figure 4 with 8 supplements
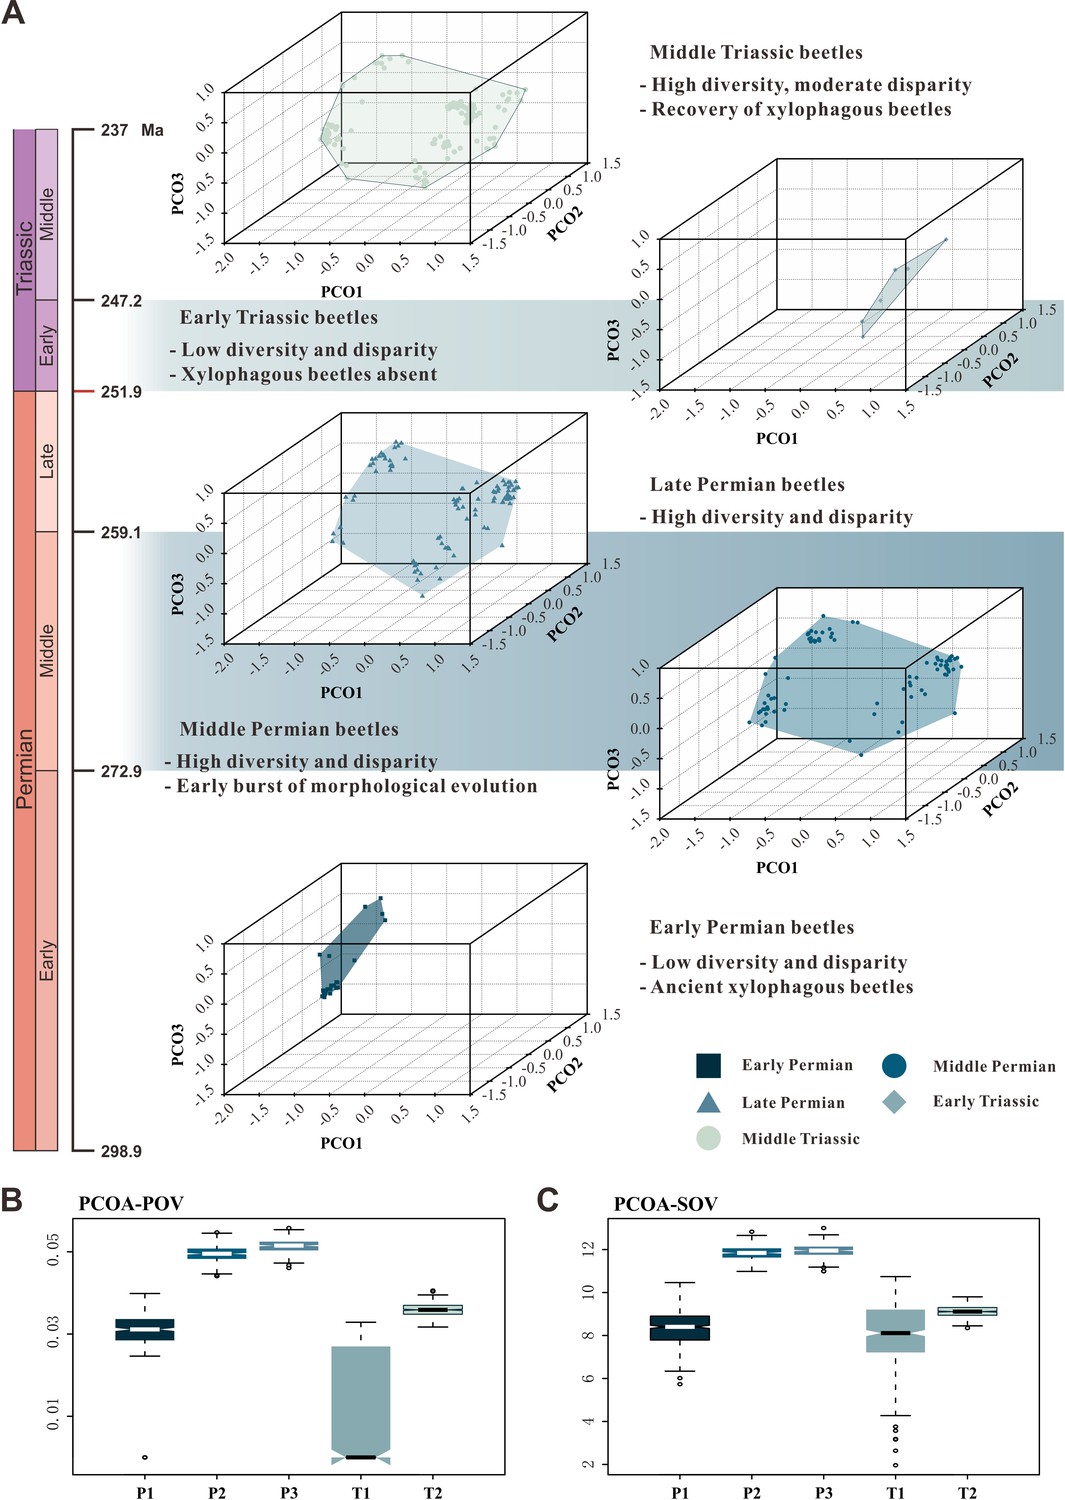
Morphospace comparisons of Coleoptera from the Early Permian to Middle Triassic.
(A) Morphospace three-dimensional (3D) plot ordinated by principal coordinates analysis (PcoA), maximum observable rescale distance (MORD) matrices, based on species-level dataset. (B and C) Disparity comparisons ordinated by PcoA, MORD matrices, based on species-level dataset, proxy by pov and sov. Abbreviations: pov, product of variance; sov, sum of variance; P1, Early Permian; P2, Middle Permian; P3, Late Permian; T1, Early Triassic; T2, Middle Triassic.
-
Figure 4—source data 1
Fossil character matrix for the morphospace analysis.
- https://cdn.elifesciences.org/articles/72692/elife-72692-fig4-data1-v2.xlsx
-
Figure 4—source data 2
Result of permutation test for morphological disparity.
- https://cdn.elifesciences.org/articles/72692/elife-72692-fig4-data2-v2.xlsx
Figure 4—figure supplement 1
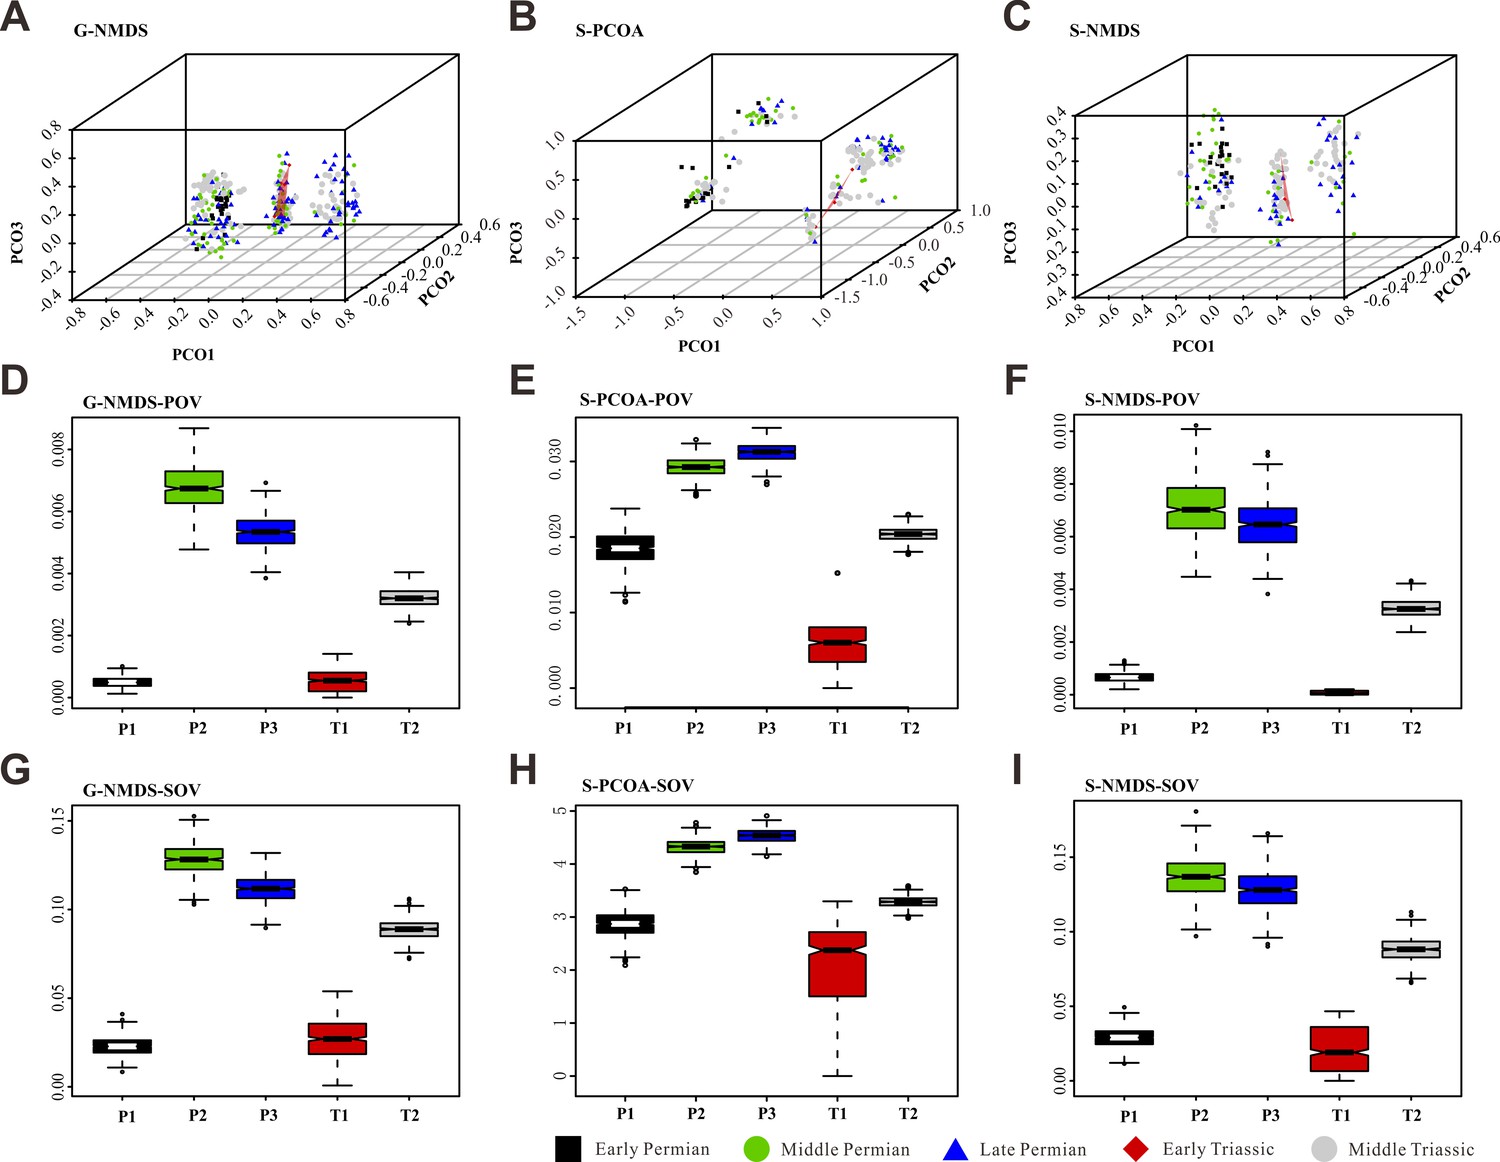
Morphospace comparisons of Coleoptera from the Early Permian to Middle Triassic, maximum observable rescale distance (MORD) matrices, proxy by pov and sov.
(A, D, and G) Morphospace three-dimensional (3D) plot and disparity comparisons ordinated by non-metric multidimensional scaling (NMDS), based on genus-level dataset. (B, E ,and H) Morphospace 3D plot and disparity comparisons ordinated by principal coordinates analysis (PcoA), based on species-level dataset. (C, F, and I) Morphospace 3D plot and disparity comparisons ordinated by NMDS, based on species-level dataset. Abbreviations: pov, product of variance; sov, sum of variance; P1, Early Permian; P2, Middle Permian; P3, Late Permian; T1, Early Triassic; T2, Middle Triassic. In the morphospace 3D plot, morphospace occupation of Early Triassic taxa is highlighted by red area.
Figure 4—figure supplement 2

Morphospace comparisons of Coleoptera from the Early Permian to Middle Triassic, based on genus-level disparity analyses of generalized Euclidean distance (GED) matrices, proxy by pov and sov.
(A, C, and E) Morphospace three-dimensional (3D) plot and disparity comparisons ordinated by principal coordinates analysis (PcoA). (B, D, and F) Morphospace 3D plot and disparity comparisons ordinated by non-metric multidimensional scaling (NMDS). Abbreviations: pov, product of variance; sov, sum of variance; P1, Early Permian; P2, Middle Permian; P3, Late Permian; T1, Early Triassic; T2, Middle Triassic. In the morphospace 3D plot, morphospace occupation of Early Triassic taxa is highlighted by red area.
Figure 4—figure supplement 3
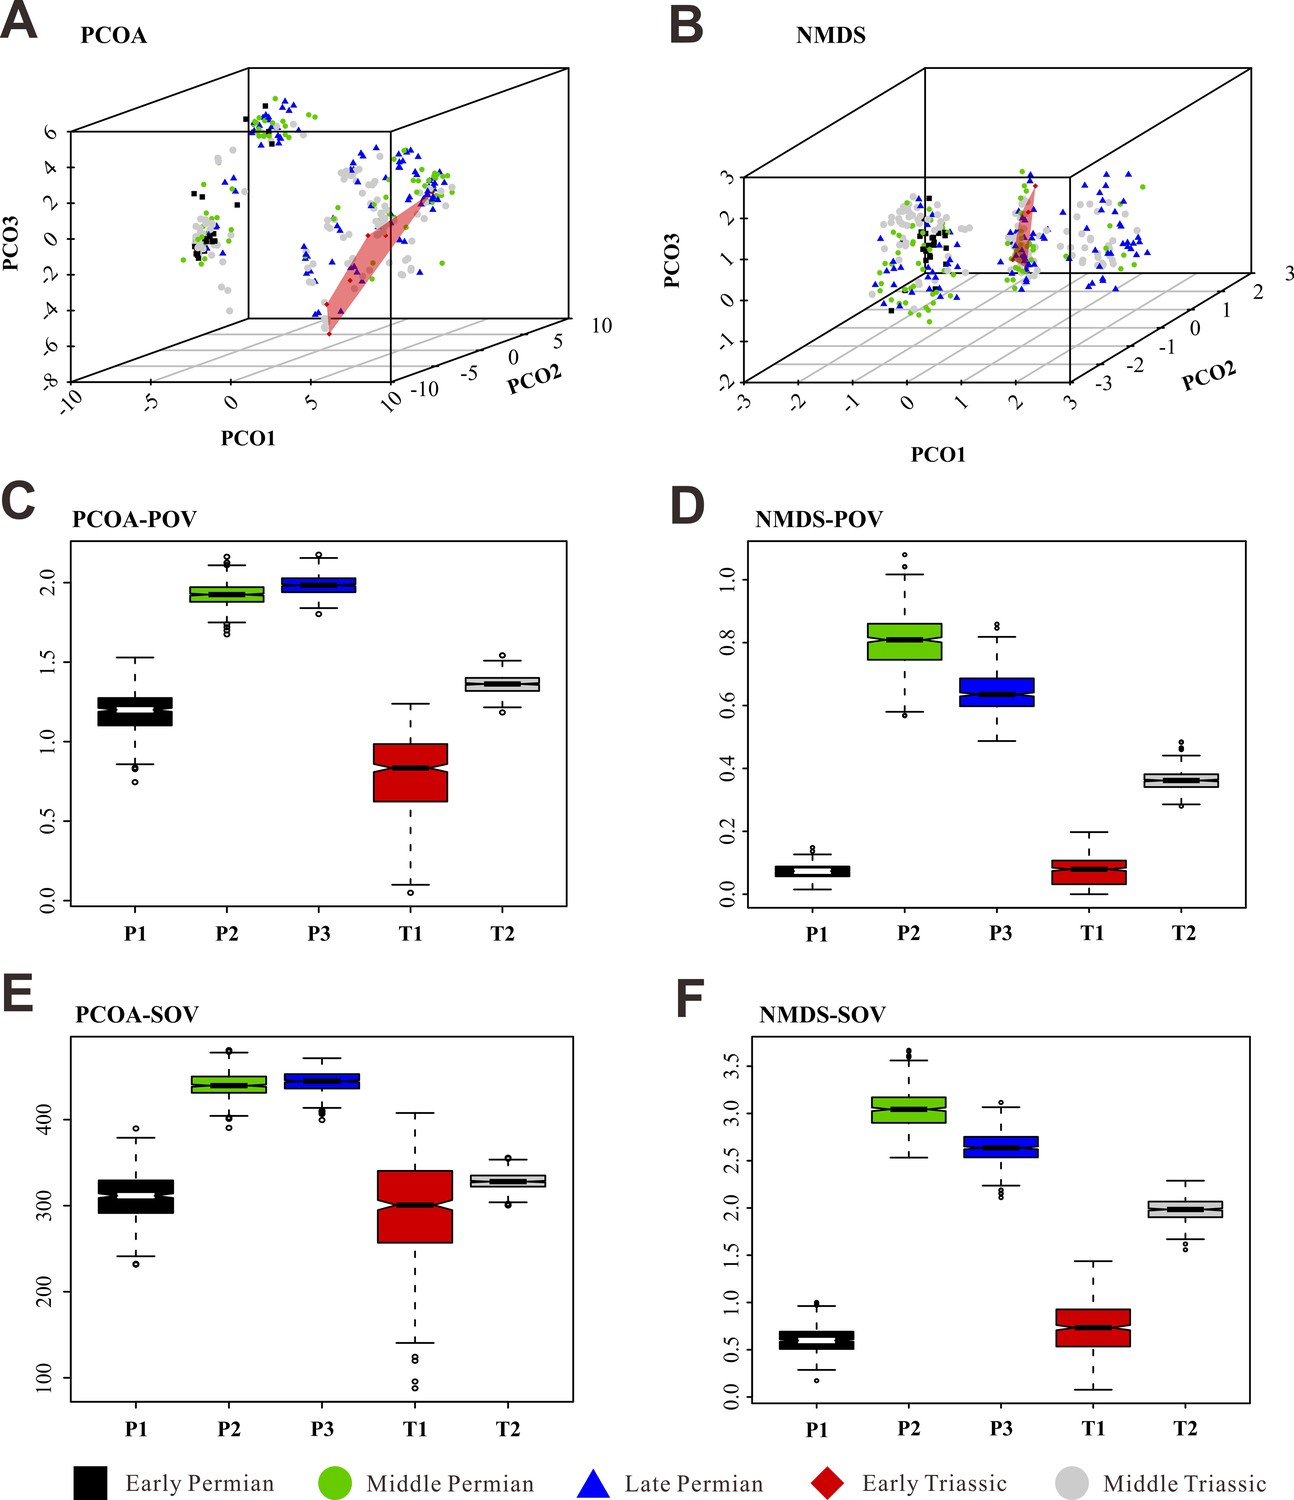
Morphospace comparisons of Coleoptera from the Early Permian to Middle Triassic, based on species-level disparity analyses of generalized Euclidean distance (GED) matrices, proxy by pov and sov.
(A, C, and E) Morphospace three-dimensional (3D) plot and disparity comparisons ordinated by principal coordinates analysis (PcoA). (B, D, and F) Morphospace 3D plot and disparity comparisons ordinated by non-metric multidimensional scaling (NMDS). Abbreviations: pov, product of variance; sov, sum of variance; P1, Early Permian; P2, Middle Permian; P3, Late Permian; T1, Early Triassic; T2, Middle Triassic. In the morphospace 3D-plot, morphospace occupation of Early Triassic taxa is highlighted by red area.
Figure 4—figure supplement 4

Permutation tests with sample size corrected (maximum observable rescale distance [MORD]).
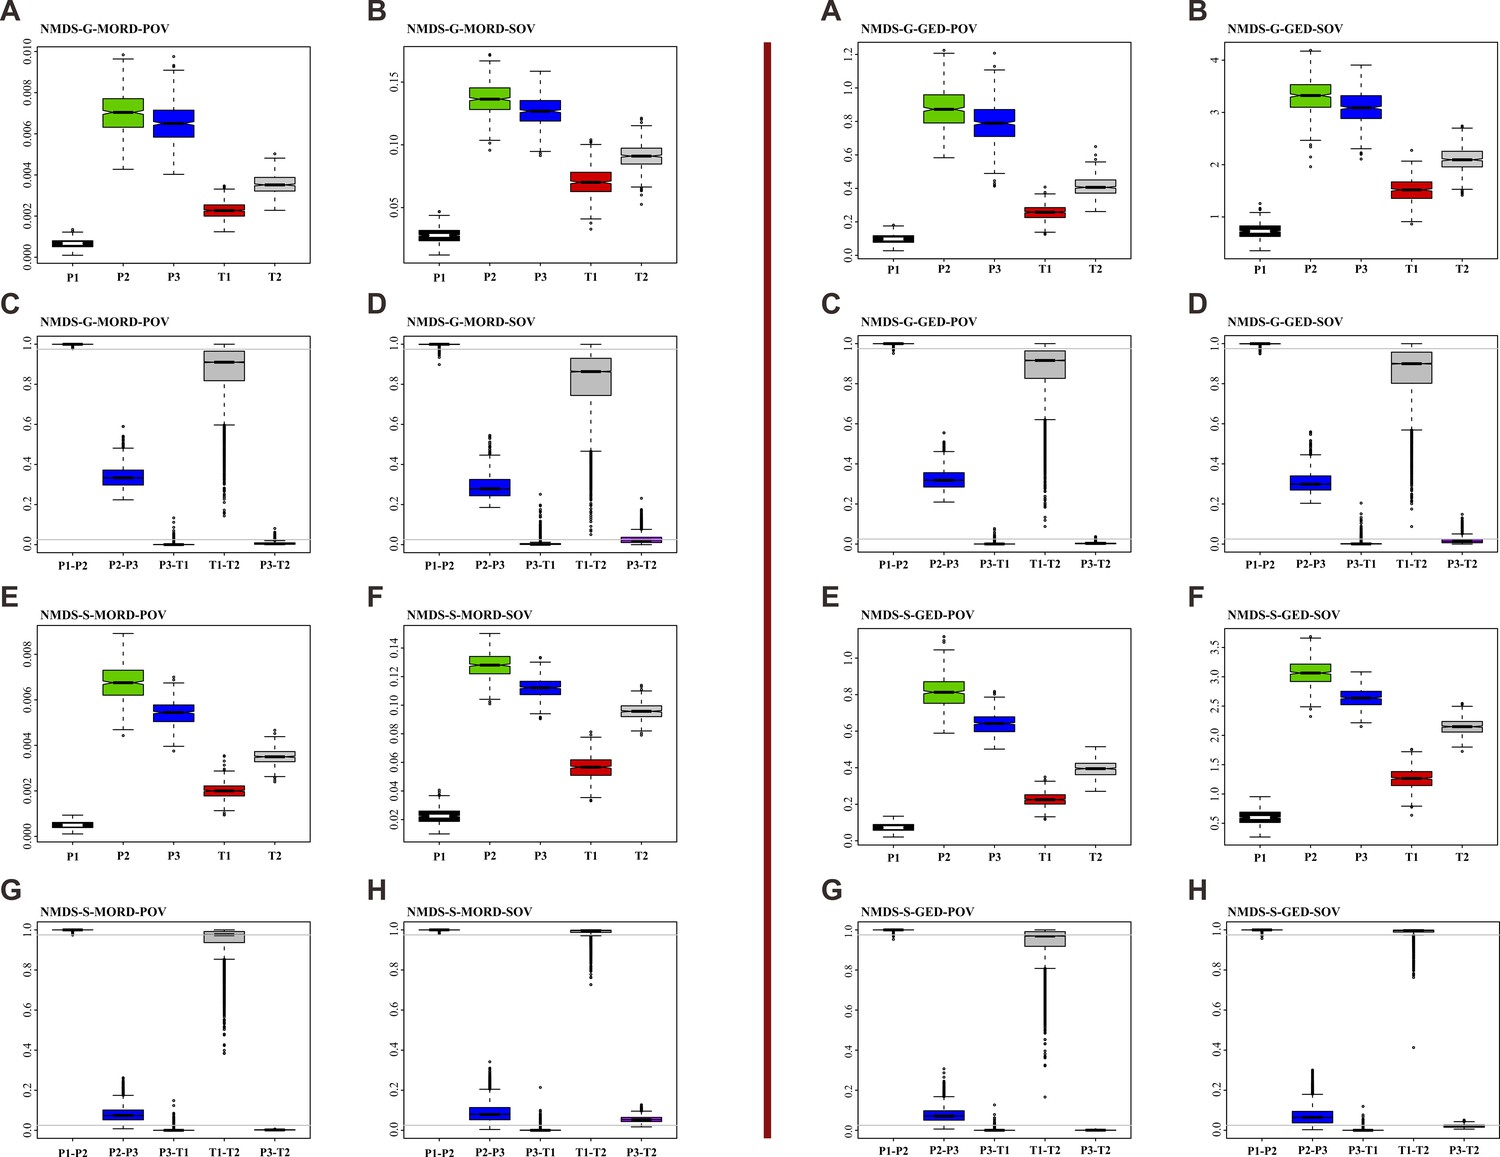
(A–D) Permutation tests for principal coordinates analysis (PcoA) results. (E–H) Permutation tests for non-metric multidimensional scaling (NMDS) results. Each box represents a distribution of the proportion greater than the observed value of the test statistic in the null distribution. Grey line highlights the value of 0.025 or 0.975. Difference lower than 0.025 represents the disparity of the former lower than the latter significantly, and the condition of the difference higher than 0.975 was inverse. Abbreviations: G, genus database; S, species database; pov, product of variance; sov, sum of variance; P1, Early Permian; P2, Middle Permian; P3, Late Permian; T1, Early Triassic; T2, Middle Triassic.
Figure 4—figure supplement 5
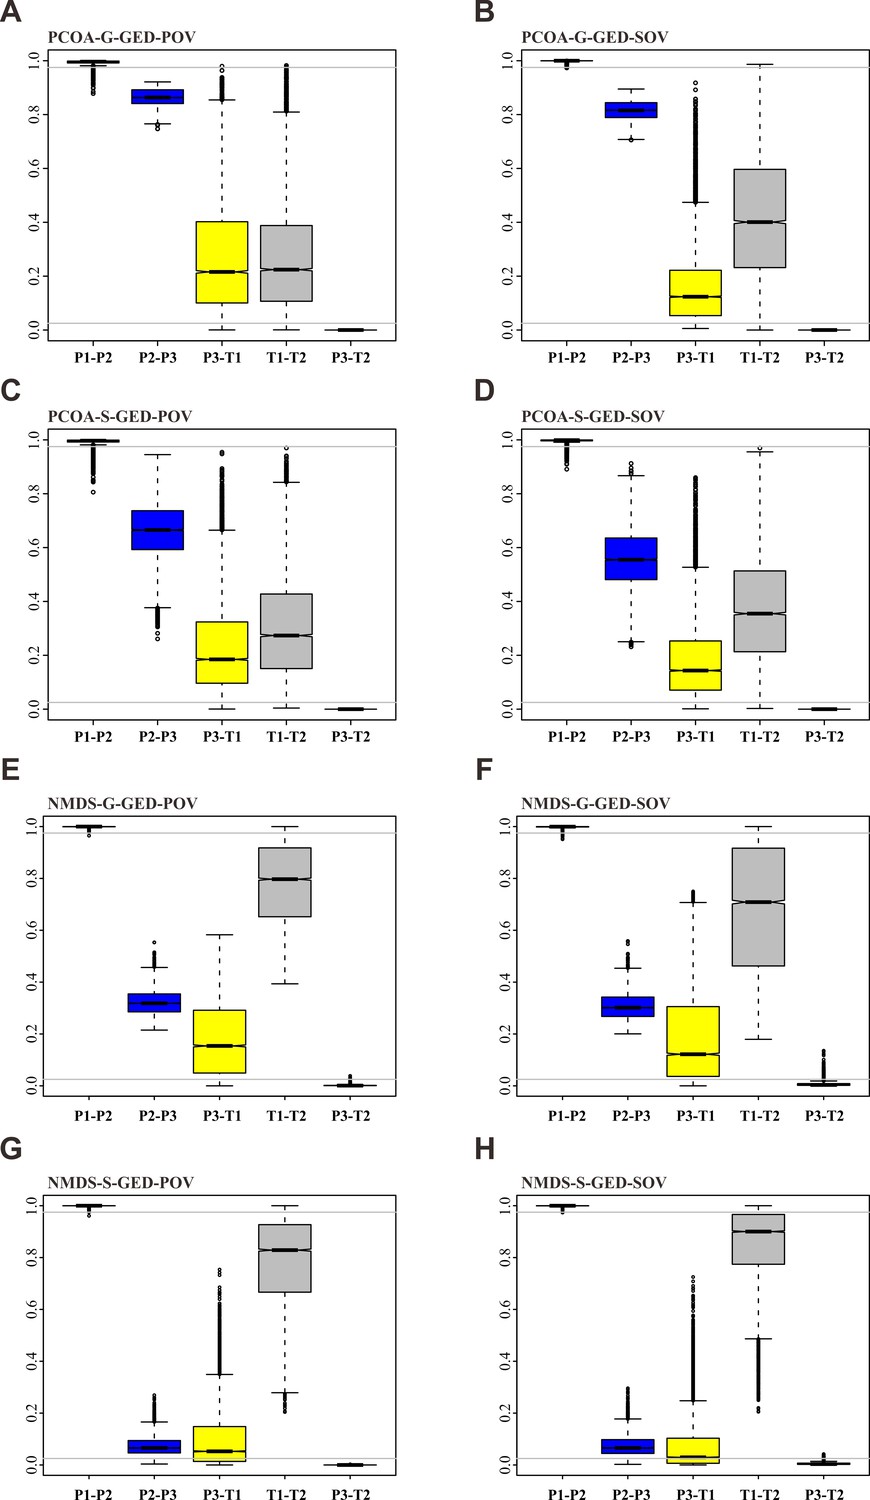
Permutation tests with sample size corrected (generalized Euclidean distance [GED]).
(A–D) Permutation tests for principal coordinates analysis (PcoA) results. (E–H) Permutation tests for non-metric multidimensional scaling (NMDS) results. Each box represents a distribution of the proportion greater than the observed value of the test statistic in the null distribution. Grey line highlights the value of 0.025 or 0.975. Difference lower than 0.025 represents the disparity of the former lower than the latter significantly, and the condition of the difference higher than 0.975 was inverse. Abbreviations: G, genus database; S, species database; pov, product of variance; sov, sum of variance; P1, Early Permian; P2, Middle Permian; P3, Late Permian; T1, Early Triassic; T2, Middle Triassic.
Figure 4—figure supplement 6
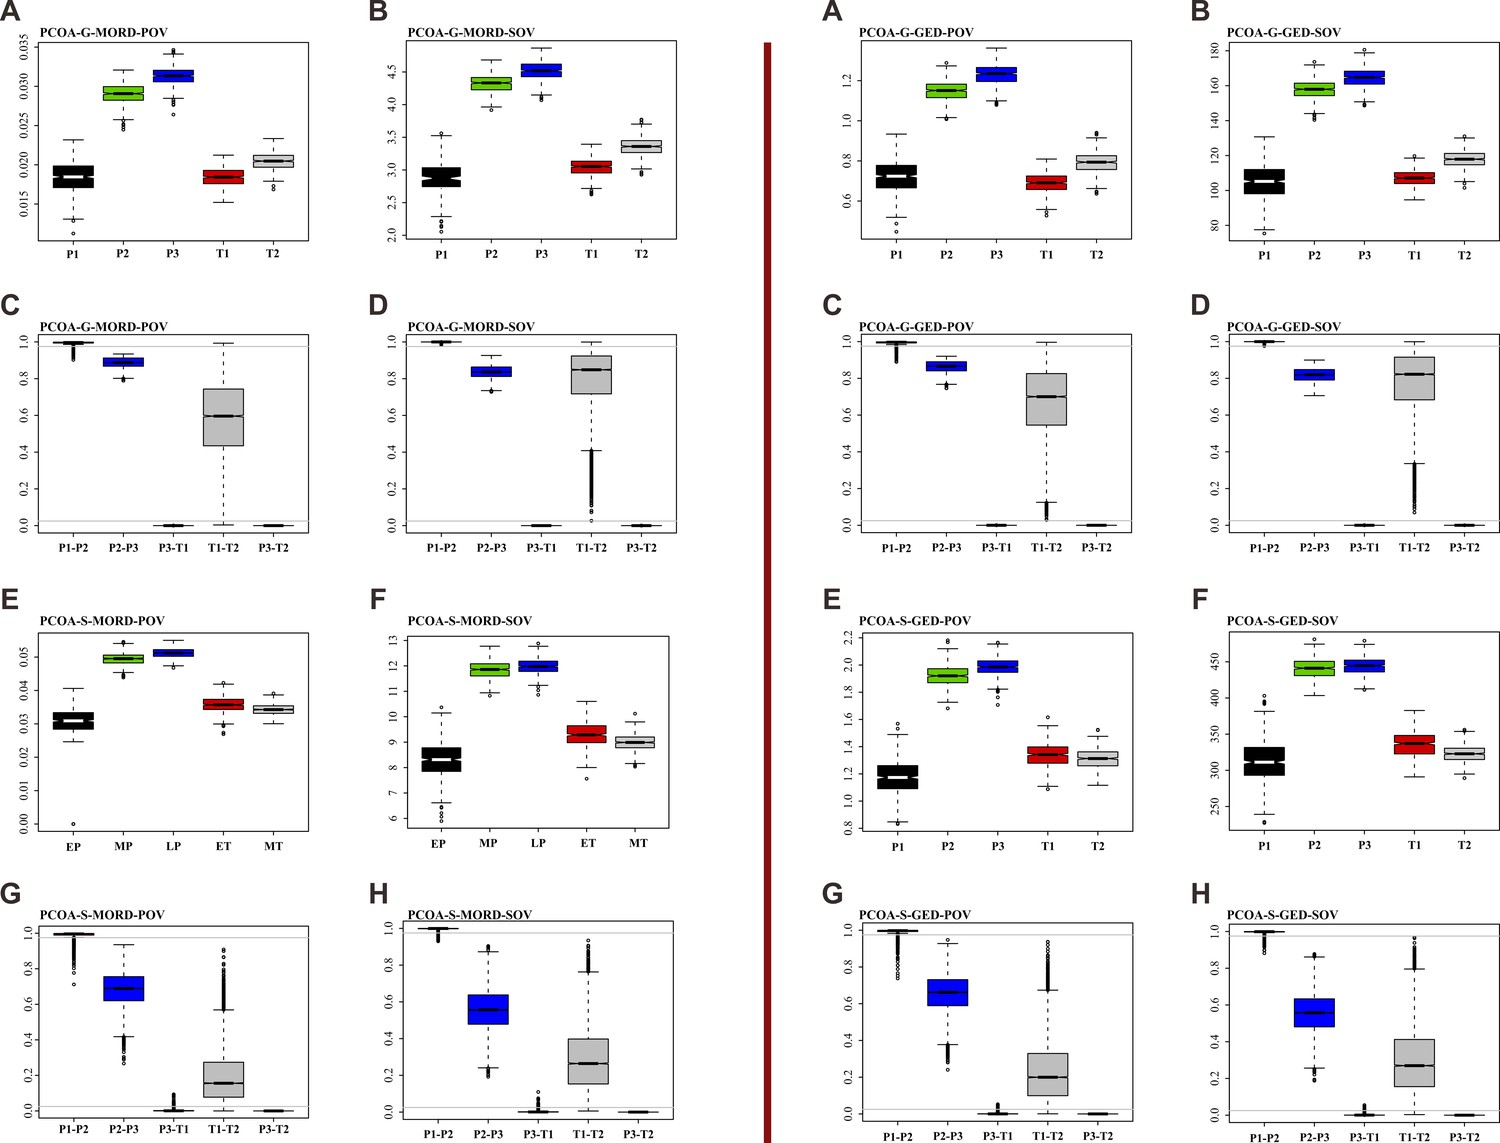
Disparity comparison and permutation tests with sample size corrected, under ordination method of principal coordinates analysis (PcoA), assuming that the age of the Grès à Voltzia specimens is Early Triassic.
Left: results based on maximum observable rescale distance (MORD) matrix. Right: results based on generalized Euclidean distance (GED) matrix. (A, B, E, and F) Disparity comparison. (C, D, G, and H) Permutation tests with sample size corrected. Abbreviations: G, genus database; S, species database; pov, product of variance; sov, sum of variance; P1, Early Permian; P2, Middle Permian; P3, Late Permian; T1, Early Triassic; T2, Middle Triassic.
Figure 4—figure supplement 7
Disparity comparison and permutation tests with sample size corrected, under ordination method of non-metric multidimensional scaling (NMDS), assuming that the age of the Grès à Voltzia specimens is Early Triassic.
Left: results based on maximum observable rescale distance (MORD) matrix. Right: results based on generalized Euclidean distance (GED) matrix. (A, B, E, and F) Disparity comparison. (C, D, G, and H) Permutation tests with sample size corrected. Abbreviations: G, genus database; S, species database; pov, product of variance; sov, sum of variance; P1, Early Permian; P2, Middle Permian; P3, Late Permian; T1, Early Triassic; T2, Middle Triassic.
Figure 4—figure supplement 8
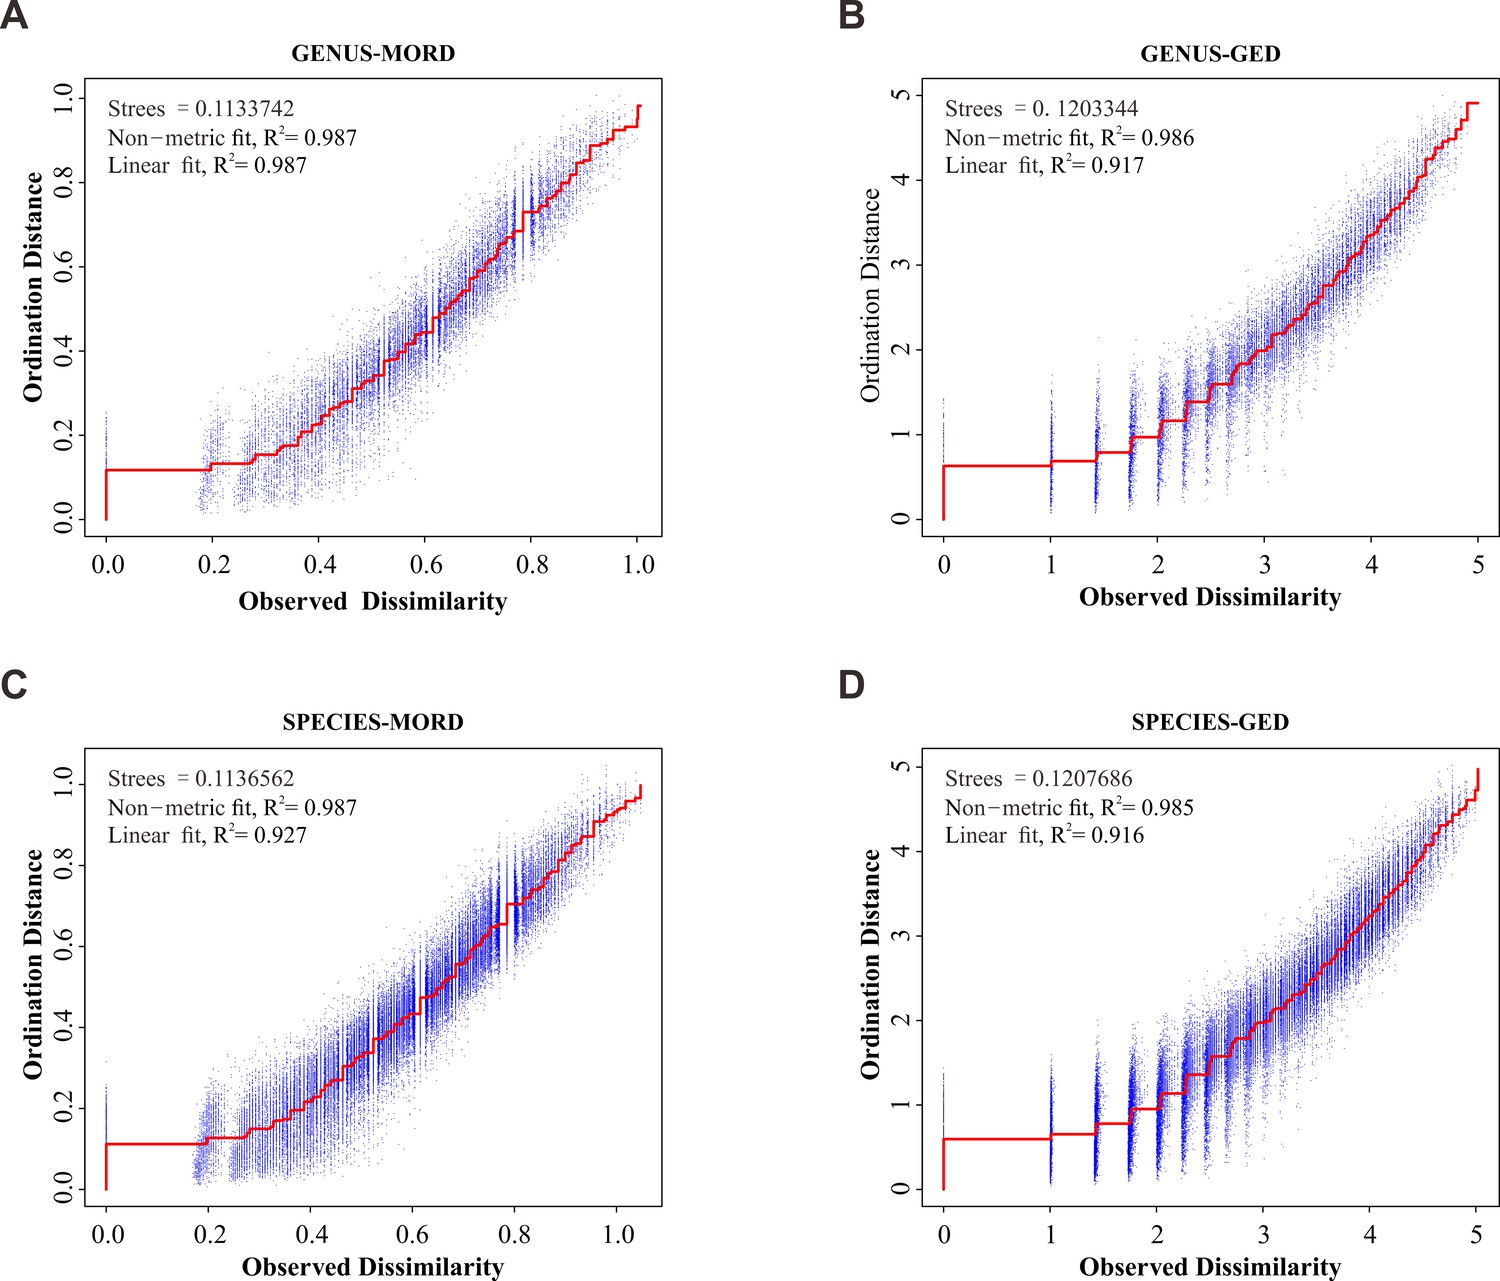
Shepard ‘goodness-of-fit’ stress plot.
(A) Result for maximum observable rescale distance (MORD) matrix of genus database. (B) Result for MORD matrix of species database. (C) Result for generalized Euclidean distance (GED) matrix of genus database. (D) Result for GED matrix of species database. Stress and R2 value indicate a good result of ordinations.
Additional files
-
Supplementary file 1
Taxonomic revisions.
- https://cdn.elifesciences.org/articles/72692/elife-72692-supp1-v2.docx
-
Supplementary file 2
List of taxa used for the phylogenetic analysis.
- https://cdn.elifesciences.org/articles/72692/elife-72692-supp2-v2.docx
-
Supplementary file 3
Characters used for the phylogenetic analysis.
- https://cdn.elifesciences.org/articles/72692/elife-72692-supp3-v2.docx
-
Supplementary file 4
Characters used for the morphospace analysis.
- https://cdn.elifesciences.org/articles/72692/elife-72692-supp4-v2.docx
-
Transparent reporting form
- https://cdn.elifesciences.org/articles/72692/elife-72692-transrepform1-v2.docx
Download links
A two-part list of links to download the article, or parts of the article, in various formats.
Downloads (link to download the article as PDF)
Open citations (links to open the citations from this article in various online reference manager services)
Cite this article (links to download the citations from this article in formats compatible with various reference manager tools)
Early evolution of beetles regulated by the end-Permian deforestation
eLife 10:e72692.
https://doi.org/10.7554/eLife.72692


