Completion of neural crest cell production and emigration is regulated by retinoic-acid-dependent inhibition of BMP signaling
- Department of Medical Neurobiology, Institute of Medical Research Israel-Canada (IMRIC) and the Edmond and Lily Safra Center for Brain Sciences (ELSC), Hebrew University of Jerusalem-Hadassah Medical School, Israel
Figures
Figure 1 with 2 supplements
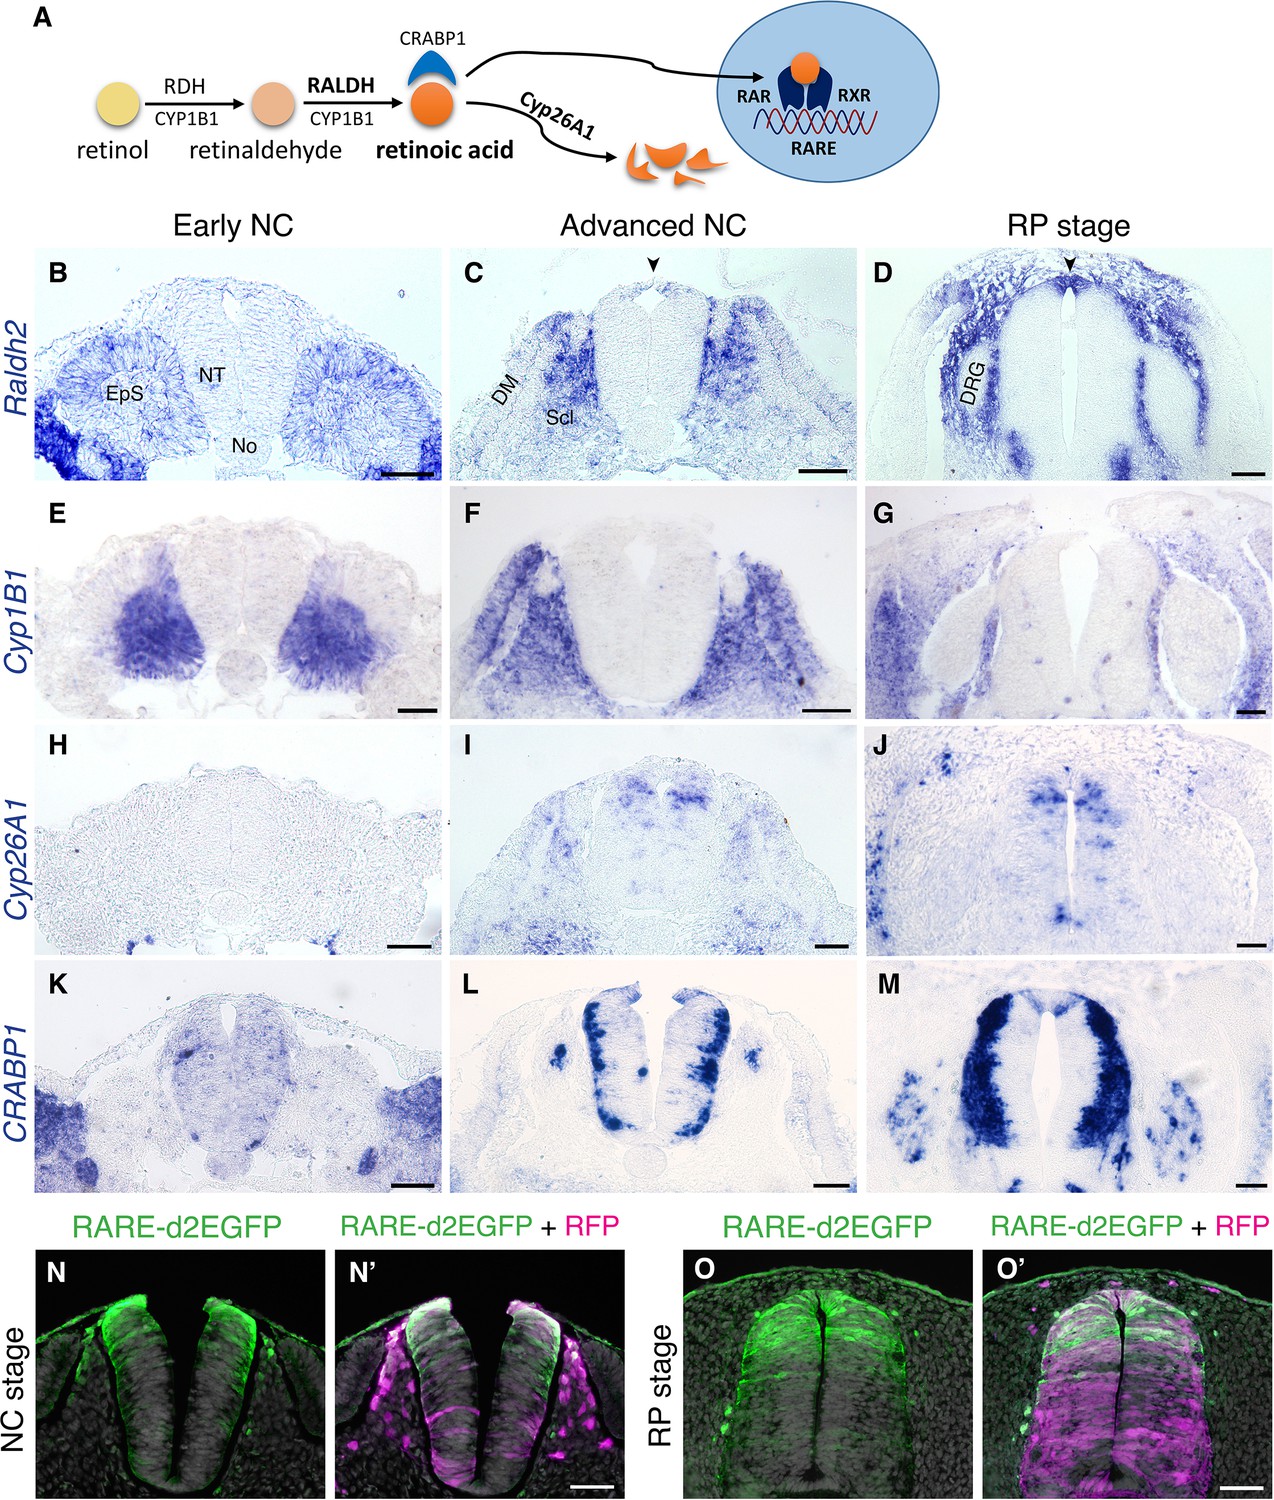
RA is both produced and active in the nascent RP.
(A) Schematic illustration of the metabolic and signaling pathways of RA. (B–M) Expression patterns of genes participating in RA synthesis and metabolism, both at early and advanced NC stages [E2 (27 ss) and E3 (35 ss), respectively], and at the RP stage (E4). ISH for Raldh2/Aldh1a2 (B–D), Cyp1B1 (E–G), Cyp26A1 (H–J), and CRABP1 (K–M). Images were taken at the level of somites 25–27. (N-O’) RA activity in the NT at NC and RP stages, indicated by the presence of destabilized GFP (d2EGFP) driven under the control of a RARE element. Embryos were electroporated at E2.5 (28 ss) along with control RFP to monitor efficiency of transfection, and analyzed 12 hr (N-N’, at 35 ss) or 48 hr (O-O’, at E4) later. RARE activity was evident in the dorsal NT of NC-stage embryos (N = 8/8), and RP-stage embryos (N = 7/7). Images were taken at the level of somites 25–27. Abbreviations, EpS, epithelial somite, No, notochord, NT, neural tube, DM, dermomyotome, Scl, sclerotome, DRG, dorsal root ganglion. Scale bar, 50 μm.
Figure 1—figure supplement 1
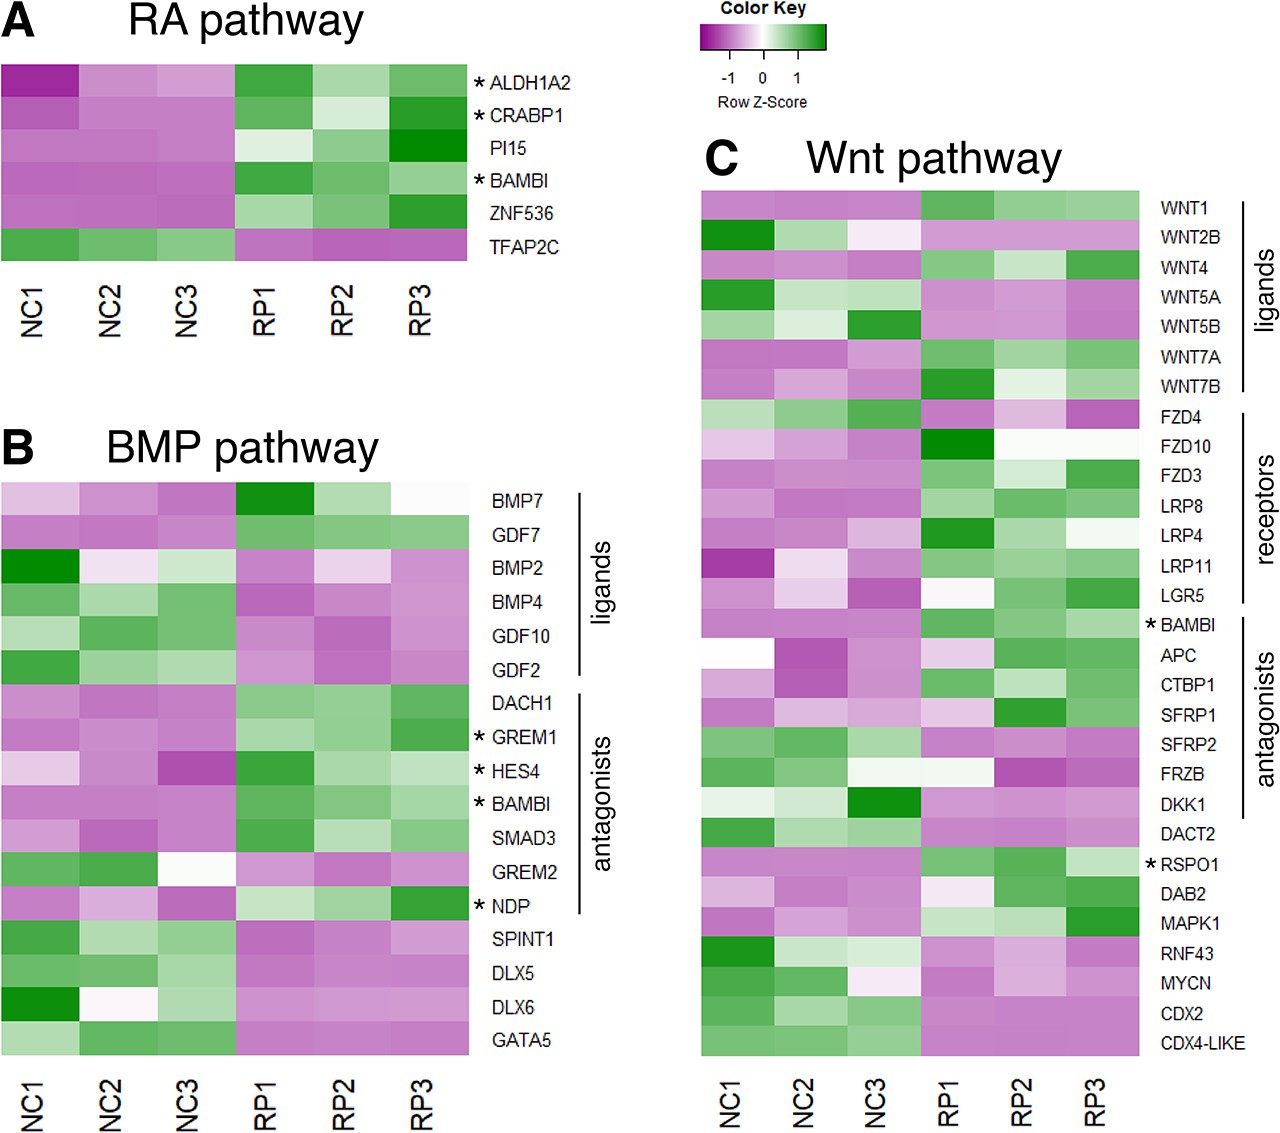
Expression patterns of selected genes from a comparative RNA-seq analysis between NC and RP stages.
(A–C) Heat maps depicting the differential expression patterns of genes involved in RA (A), BMP (B) or Wnt (C) pathways, adapted from an RNA-seq analysis performed by Ofek et al. (Ofek et al., 2021) on premigratory NC (experimental triplicates NC1, NC2, NC3) and RP cells (experimental triplicates RP1, RP2, RP3). Genes discussed in the present study were marked by an asterisk.
Figure 1—figure supplement 2
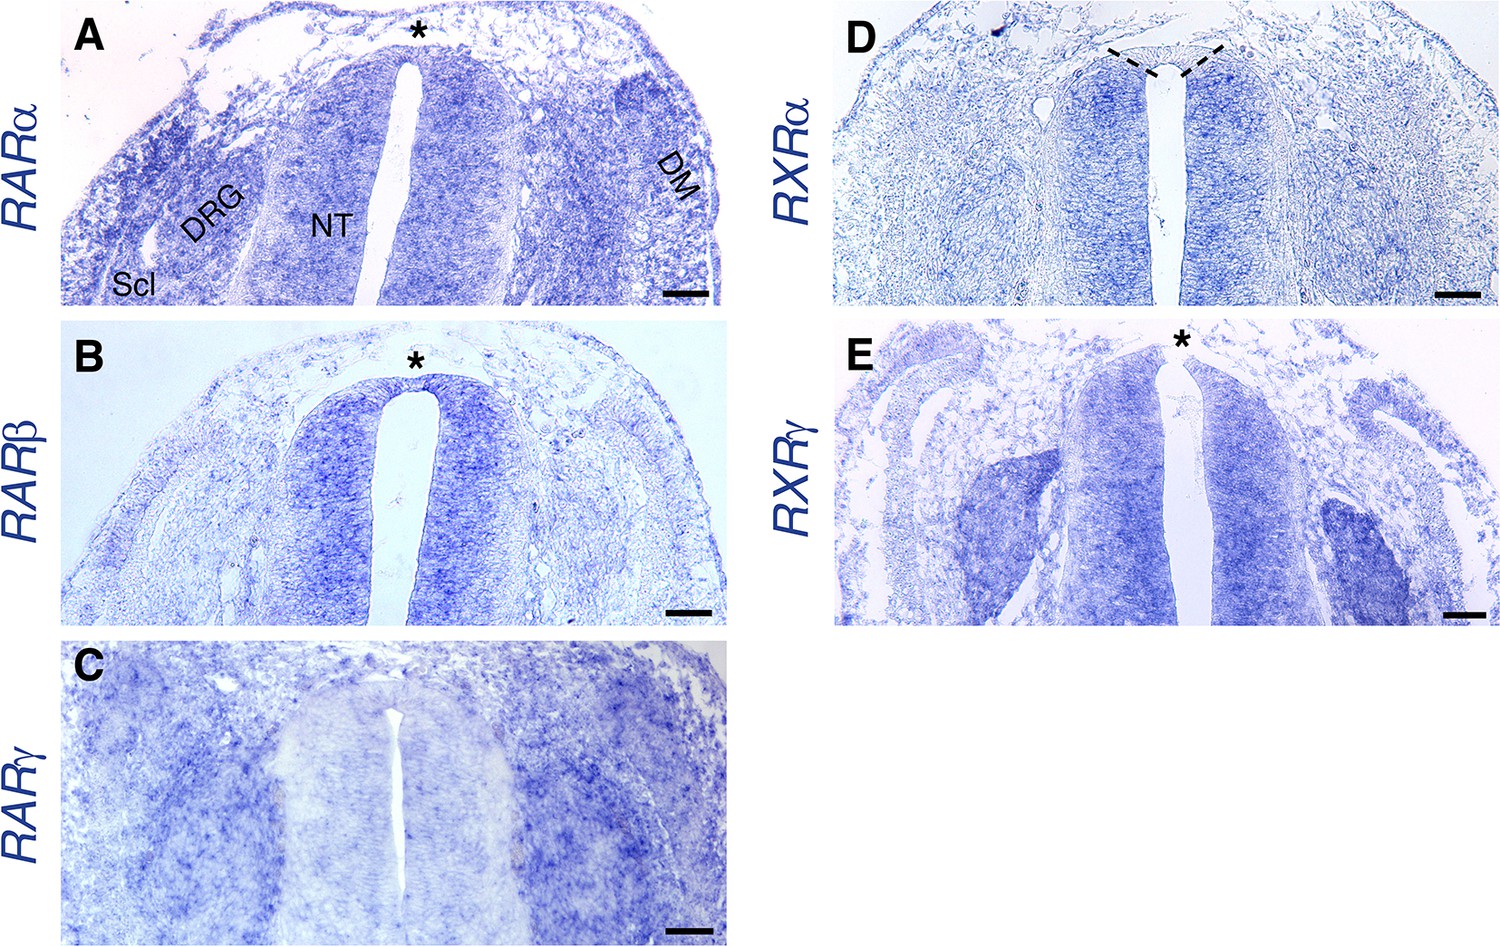
Expression of RA receptors in the dorsal NT at the RP stage.
(A–E) ISH showing expression patterns of RA receptors at the RP stage (E4). [See also (Diez del Corral et al., 2003), for whole-embryo ISH at the NC stage]. Images were taken at somite levels 24–26. (A) Expression of RARα is ubiquitous, including the dorsal NT (asterisk). (B) RARβis expressed in the NT, including the dorsal domain (asterisk). (C) No significant expression of RARγ in the NT. (D) RXRαis expressed throughout the NT, except for the dorsal domain (delineated by dashed lines). (E) Expression of RXRγat the RP stage appears in the entire NT (asterisk dorsal to the RP) and in NC derivatives such as the DRG. Abbreviations, DM, dermomyotome, DRG, dorsal root ganglion, NT, neural tube, No, notochord, Scl, sclerotome. Scale bar, 50 μm.
Figure 2 with 2 supplements
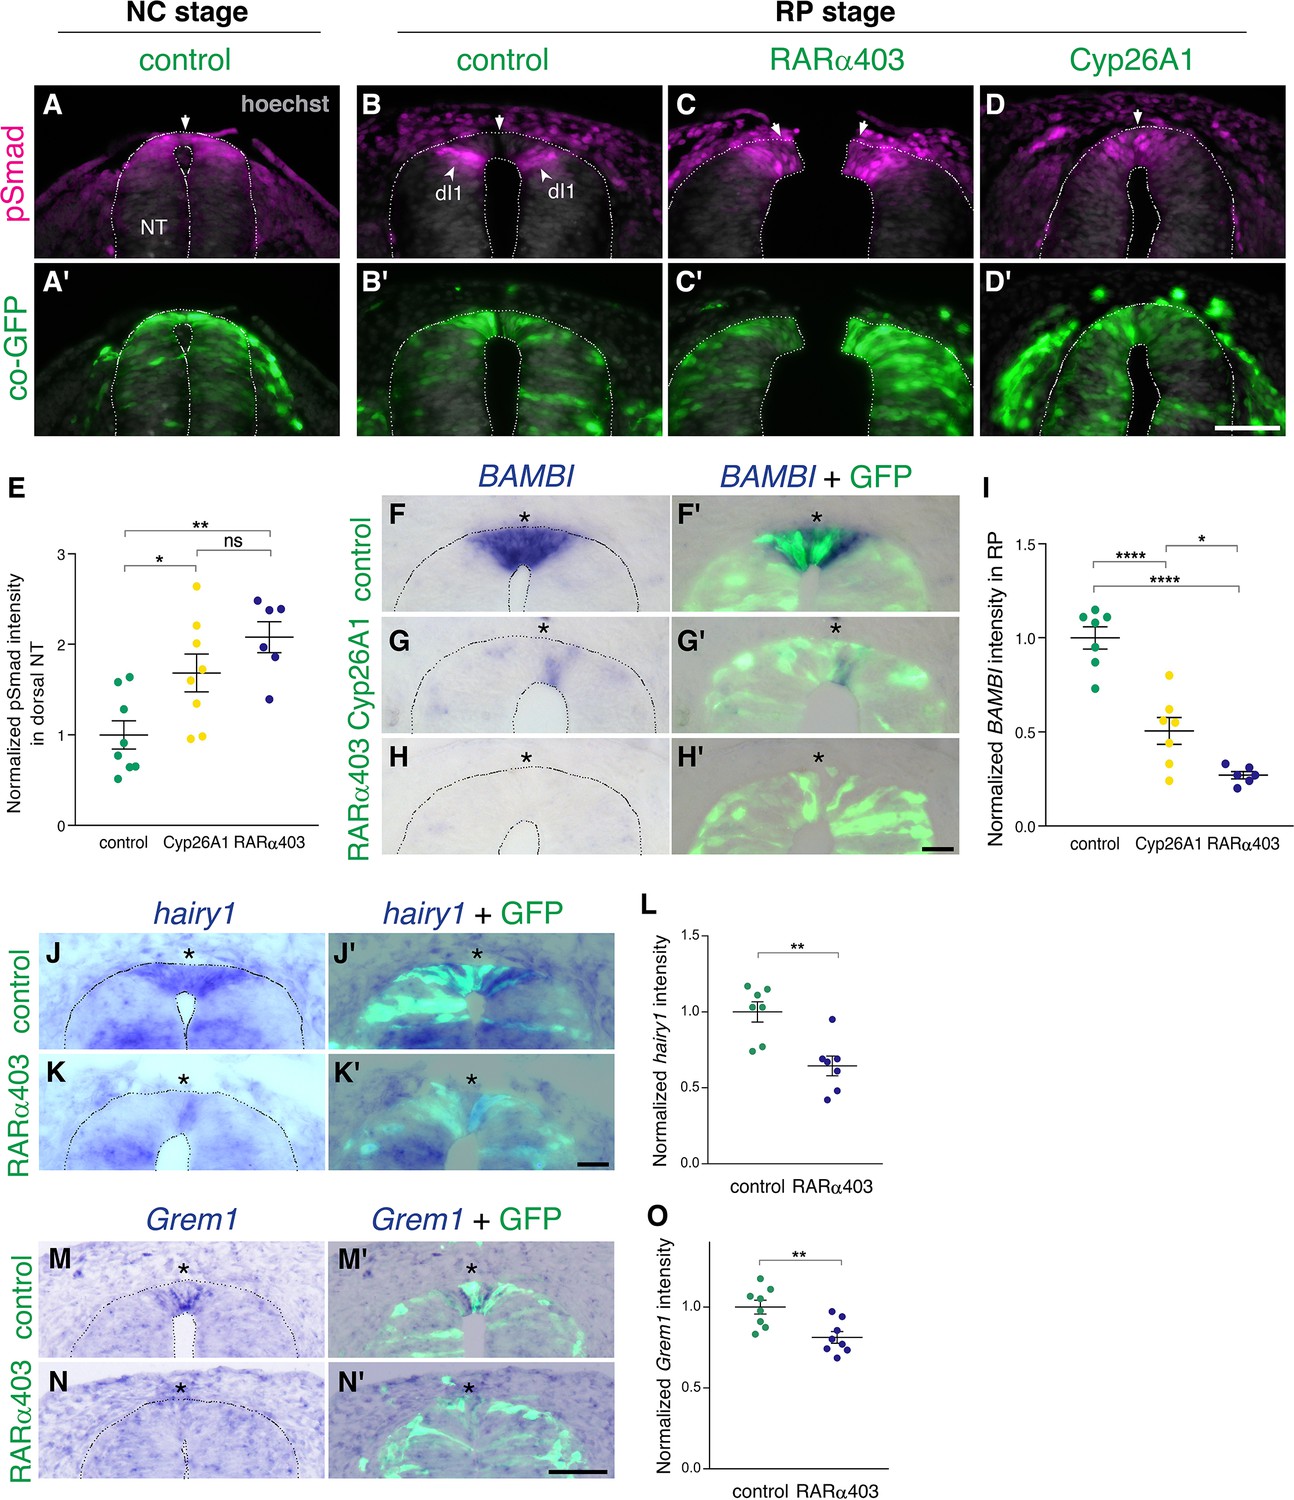
RA is responsible for the loss of sensitivity of dorsal NT progenitors to BMP during the transition from NC to RP.
(A-D’) Immunostaining for pSmad1/5/9. Embryos at E2.5 (27-8ss) were co-electroporated with RARα403, Cyp26A1 or with a control PCAGG vector, along with GFP, and analyzed at 35ss (control only, NC stage) and at E4. Note the presence of BMP activity in premigratory NC (A) and its absence in the RP of control embryos (N = 8, B-B’). Whereas only ventrally located dorsal interneurons are positive in control embryos, the RP domain itself is positive in Cyp26A1 (N = 8) and RARα403-electroporated embryos (N = 7, C-C',D-D'). (E) Quantification of pSmad staining intensity (measured area includes dorsal interneurons). Imaging and quantification were performed at somite levels 24–26. Four-to-21 sections per embryo were analyzed. *p < 0.05, **p < 0.005, one-way ANOVA with post-hoc Tukey’s tests. (F–O) In situ hybridization of embryos electroporated with Cyp26a1 or RARα403 at E2.5 (27 ss) and analyzed at E4. Asterisks mark the RP domain. (F–I) ISH for BAMBI, showing downregulation in the RP of Cyp26A1- and RARα403-treated embryos. (I) For quantification of the intensity of BAMBI, 6-to-21 sections per embryo were analyzed at somite levels 24–26. N = 7,7 and 6 embryos for control, Cyp26A1 and RARα403, respectively. *p < 0.05, ****p < 0.0001, one-way ANOVA with post-hoc Tukey’s tests. (J–L) ISH for hairy1, showing downregulation in the RP of RARα403-treated embryos. (L) For quantification of the intensity of hairy1, 7–18 sections per embryo were analyzed at somite levels 24–26. N = 7 embryos for each group. **p < 0.005, Student’s unpaired t-test. (M–O) ISH for Grem1, showing downregulation in the RP of RARα403-treated embryos. For quantification of the intensity of Grem1, 11–27 sections per embryo were analyzed at somite levels 24–26. N = 8 embryos for each group. **p < 0.005 via Student’s unpaired t-test. Abbreviations, dI1, dorsal interneurons 1, RP, roof plate. Scale bar, 50 μm.
-
Figure 2—source data 1
RA is responsible for the loss of sensitivity of dorsal NT progenitors to BMP during the transition from NC to RP.
- https://cdn.elifesciences.org/articles/72723/elife-72723-fig2-data1-v1.xlsx
Figure 2—figure supplement 1
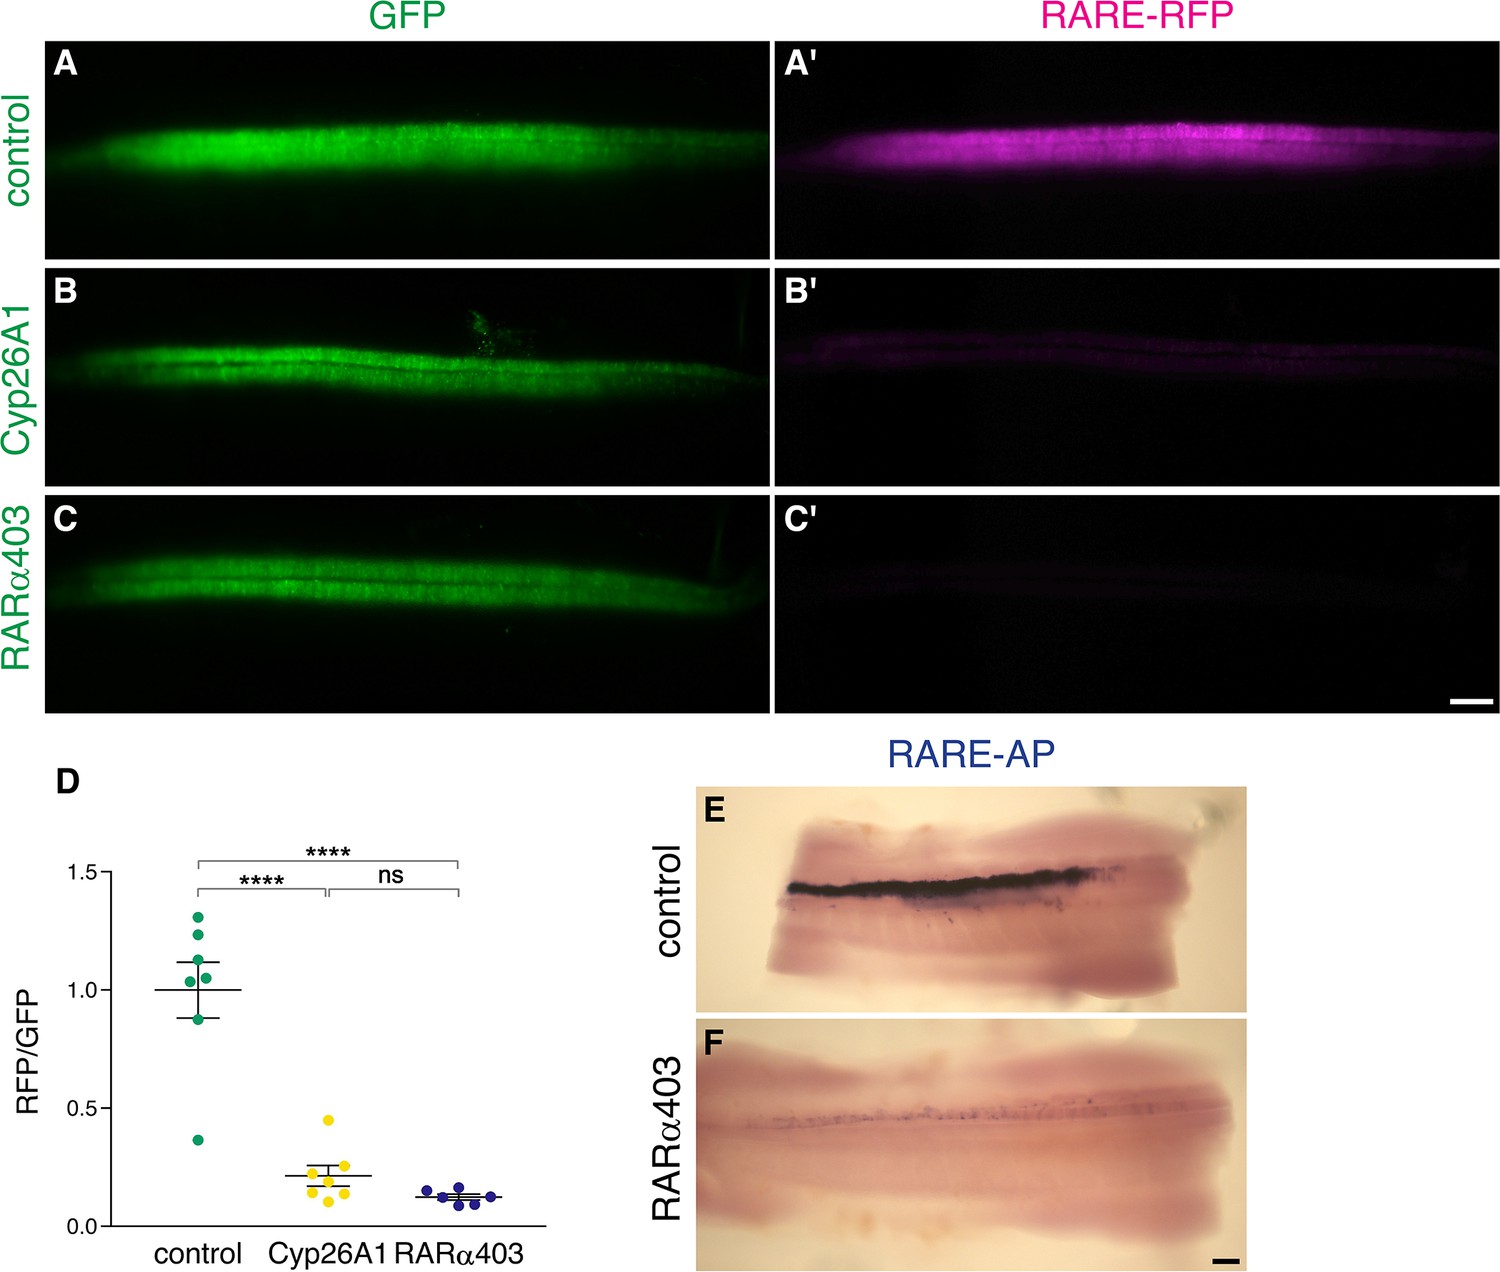
Electroporation of Cyp26A1 or RARα403 into the NT effectively downregulates RA activity.
(A–D) Measurement of RA activity using RARE-RFP (magenta) in embryos electroporated with Cyp26a1, RARα403 or control GFP (green). NTs were co-electroporated bilaterally at E2 (23-24ss) and analyzed 30 hr later. GFP was delivered along with the reporter construct and was used to assess the relative intensity of RFP fluorescence on whole-embryo images (D). N = 7, 7 and 6 embryos for control, Cyp26A1 and RARα403 groups, respectively. ****p < 0.0001, one-way ANOVA with post-hoc Tukey’s tests. (E–F) The same experimental conditions as in (A–D) were applied to unilaterally deliver RARE-AP (electroporated side facing the top). Note the robust AP staining in the control embryo, compared to the weak staining in the RARα403-treated embryo. N = 4/4 for both groups. Scale bar, 100 μm.
-
Figure 2—figure supplement 1—source data 1
Electroporation of Cyp26A1 or RARα403 into the NT effectively downregulates RA activity.
- https://cdn.elifesciences.org/articles/72723/elife-72723-fig2-figsupp1-data1-v1.xlsx
Figure 2—figure supplement 2
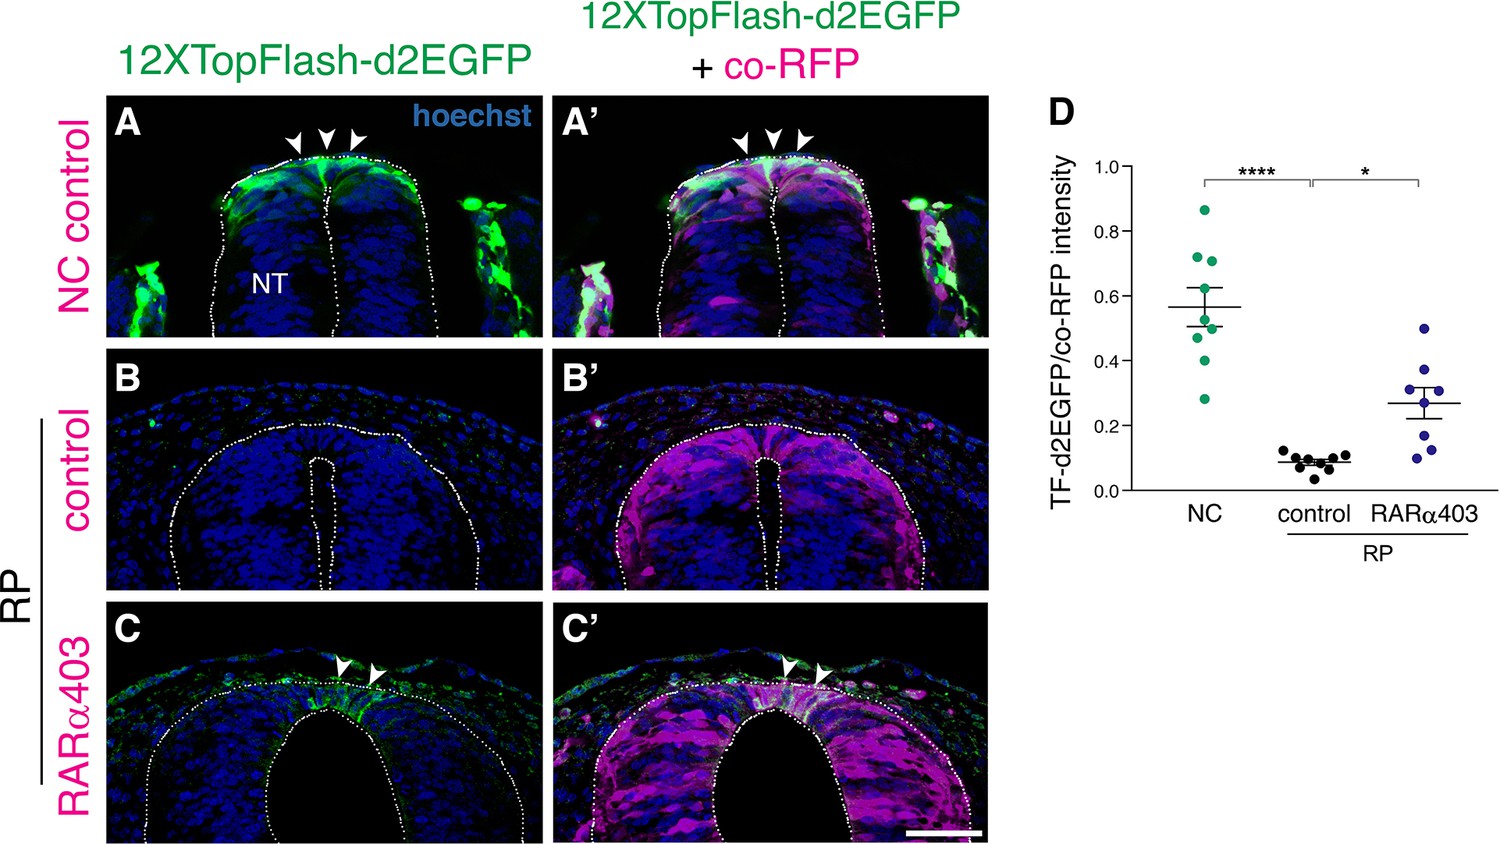
RA promotes the downregulation of Wnt signaling in the nascent RP.
(A–C) A destabilized Wnt reporter, 12XTopFlash-d2EGFP, was electroporated bilaterally into the NT of E2.5 embryos (27 ss), and analyzed at E3 (35 ss, NC stage, control only) and at E4 (RP stage). RFP was co-electroporated to mark the electroporated region. Note the presence of Wnt activity in the premigratory NC (A-A’, arrowheads) compared to its absence in the control RP (B-B’). Wnt activity is upregulated in RARα403-electroporated embryos compared to RFP only controls. Note the GFP+ cells in the RARα403-treated embryo (C-C’, arrowheads). (D) Measurement of d2EGFP fluorescence signal intensity. N = 9 embryos for control NC and RP groups, and N = 8 for the RARα403-treated group, 12 sections were analyzed per embryo at somite levels 24–26. ****p < 0.0001, *p < 0.05, one-way ANOVA with post-hoc Tukey’s test. Abbreviations, NT, neural tube. Scale bar, 50 μm.
-
Figure 2—figure supplement 2—source data 1
RA promotes the downregulation of Wnt signaling in the nascent RP.
- https://cdn.elifesciences.org/articles/72723/elife-72723-fig2-figsupp2-data1-v1.xlsx
Figure 3
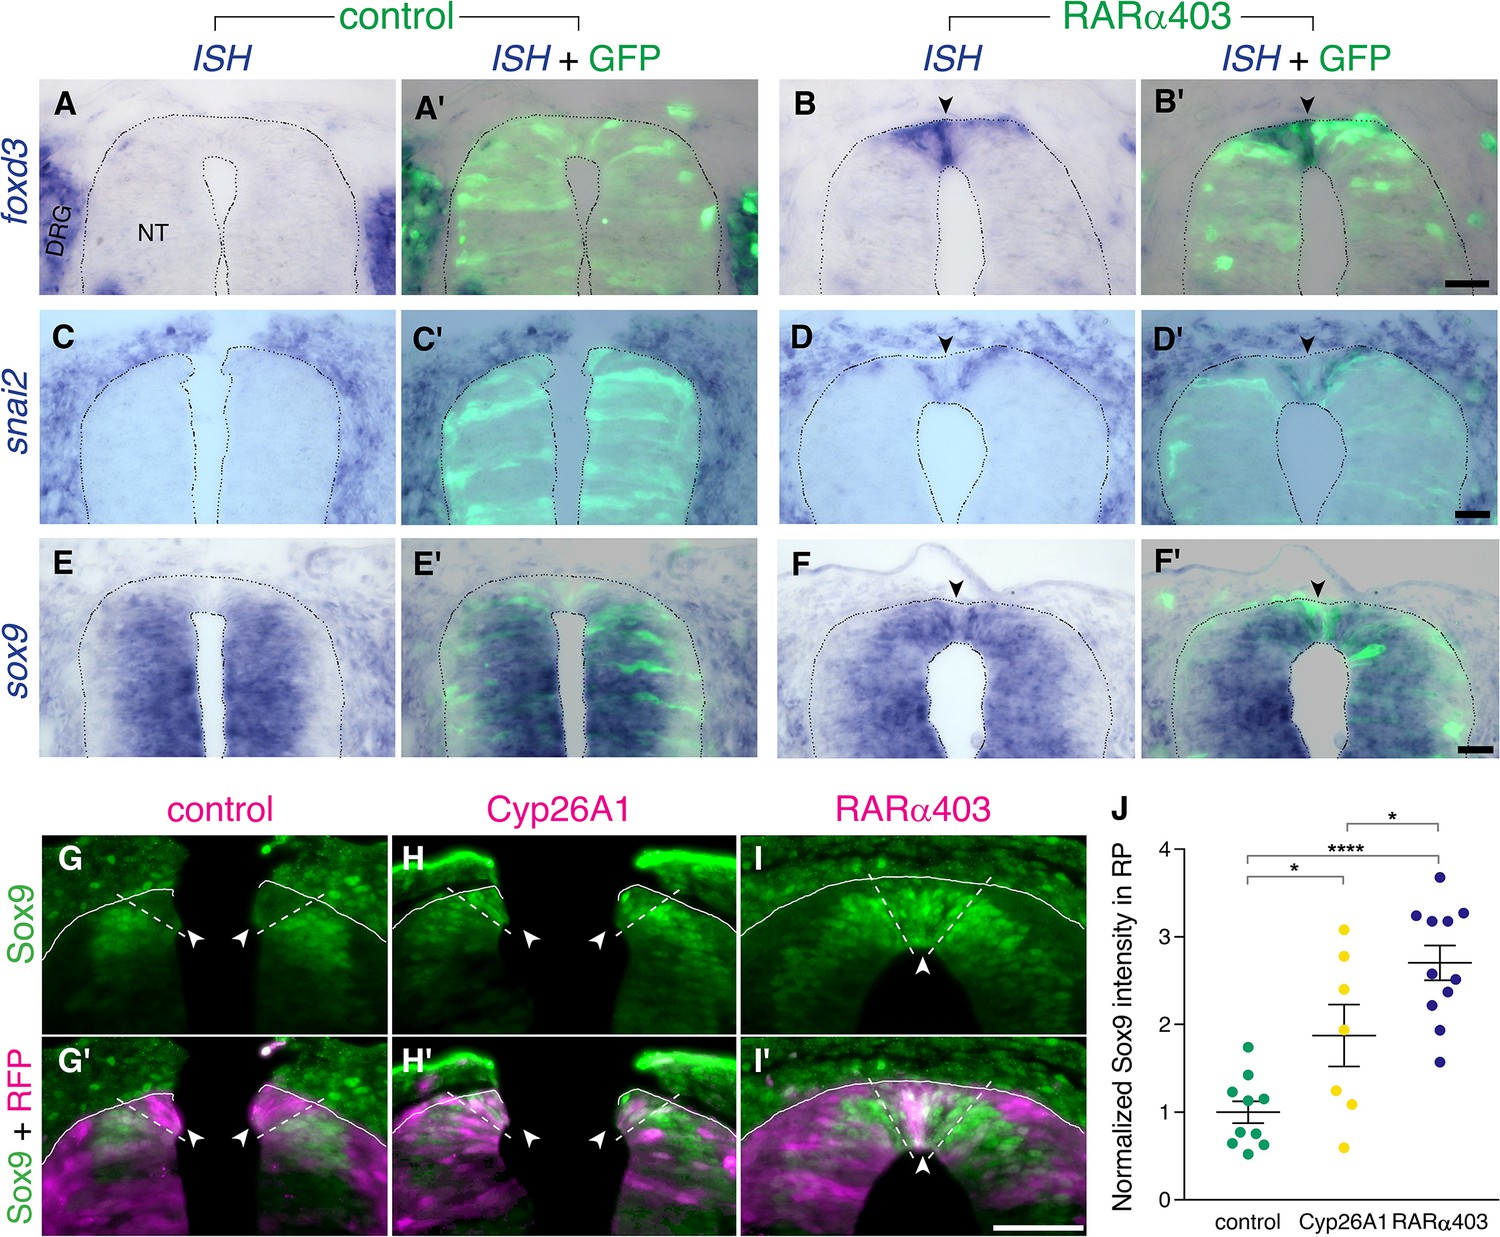
RA downregulates NC markers during the transition to definitive RP.
(A-F’) ISH for neural crest markers on embryos electroporated with GFP along with control PCAGG or RARα403 at E2.5 (27ss) and analyzed at E4. Arrowheads point to the RP in RARα403-treated embryos. (A-B’) ISH for foxd3, showing no expression in the RP of control embryos (N = 7) compared to strong expression in the RP of all RARα403-treated embryos (N = 7). (C-D’) ISH for snai2, showing no expression in the RP of control embryos (N = 11) and clear expression in the RP of all RARα403-treated embryos (N = 11). (E–F) ISH for sox9, showing no expression in the RP of control embryos (N = 9) and strong expression in the RP of all RARα403-treated embryos (N = 9). Note as well expression of sox9 mRNA in more ventral regions of the NT and in adjacent sclerotome. Imaging and analysis were performed at somite levels 25–27. (G–J) Immunostaining for Sox9 in control and experimental embryos, showing the presence of Sox9 protein in the RP of Cyp26A1- and RARα403-treated embryos (arrowheads), compared to absence of Sox9 in the RP of control embryos. RFP was co-electroporated in both groups. Dashed lines delineate the RP domain. (J) Measurement of Sox9 staining intensity. For quantification, 15 sections per embryo were analyzed. Imaging and analysis were performed at somite levels 25–27. N = 10, 7, and 11 embryos for control, Cyp26A1 and RARα403 groups, respectively. *p < 0.05, ****p < 0.0001, one-way ANOVA with post-hoc Tukey’s tests. Abbreviations, NT, neural tube, DRG, dorsal root ganglion. Scale bar, 50 μm.
-
Figure 3—source data 1
RA downregulates NC markers during the transition to definitive RP.
- https://cdn.elifesciences.org/articles/72723/elife-72723-fig3-data1-v1.xlsx
Figure 4
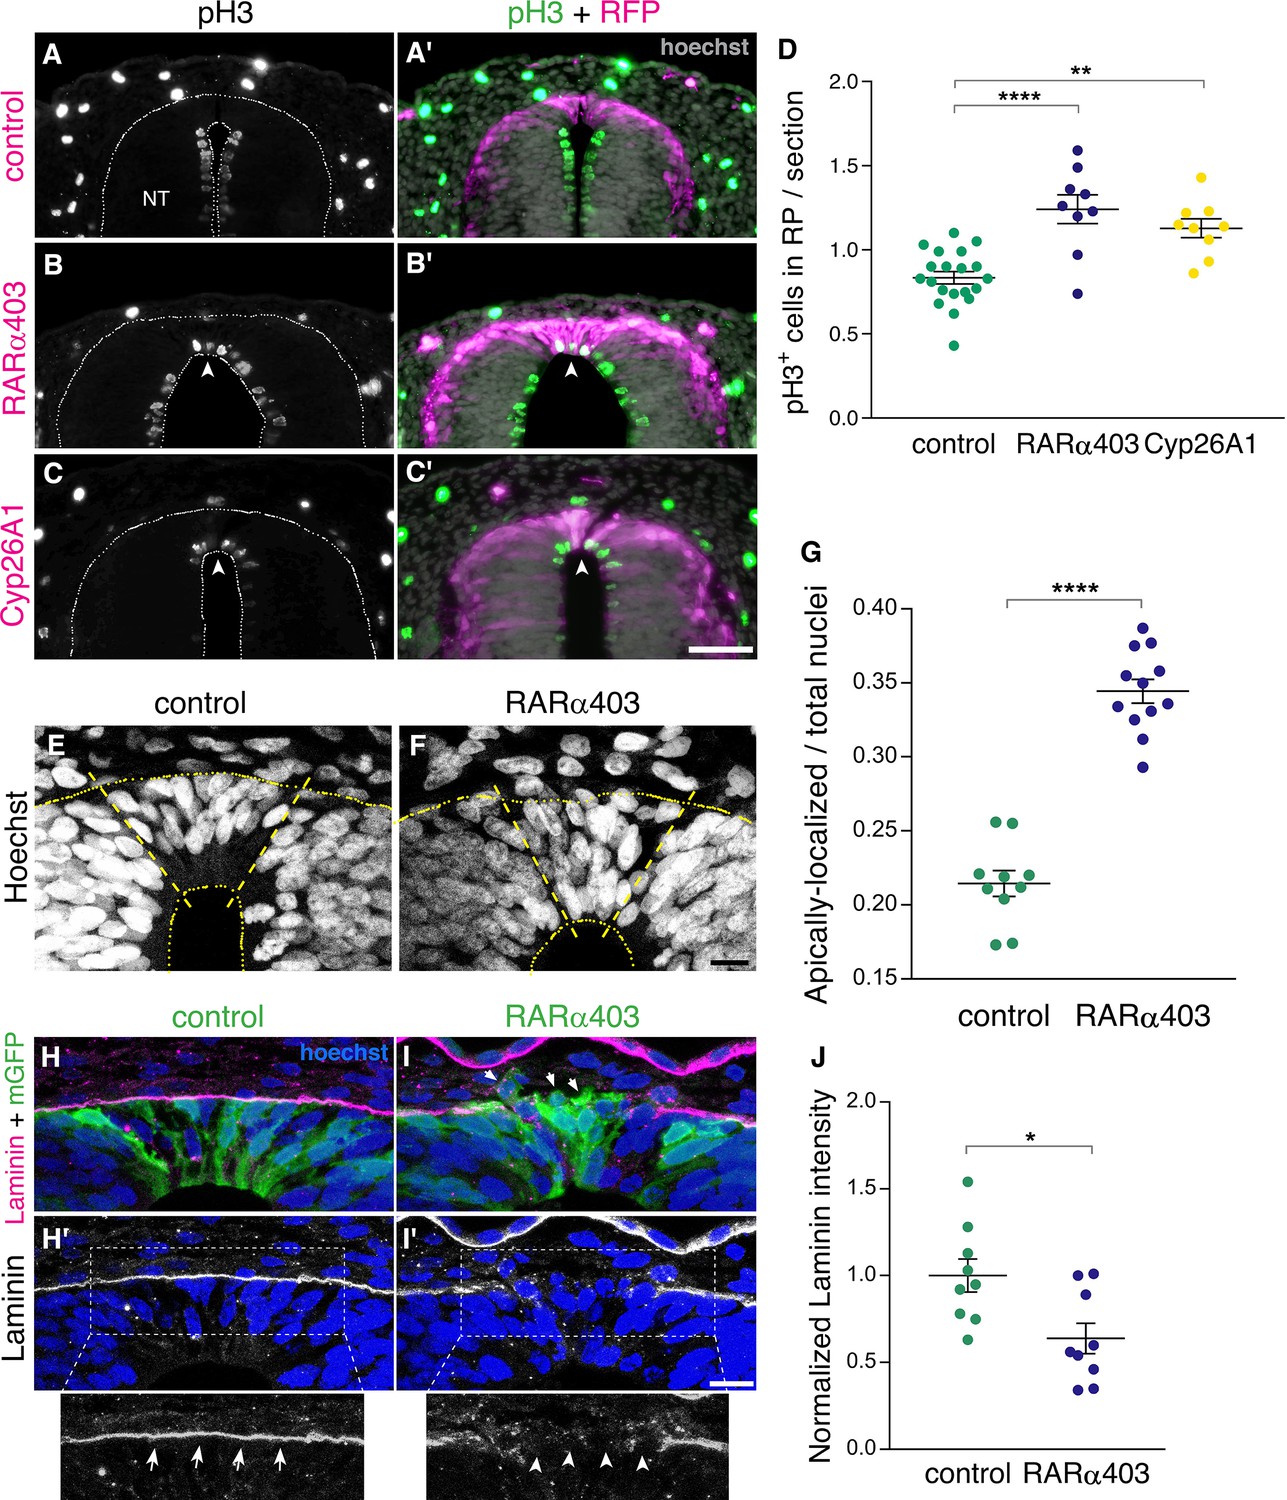
RA signaling promotes cell cycle exit and epithelial traits in dorsal NT cells.
(A–D) Immunostaining for phospho-Histone H3 of embryos electroporated at E2.5 (27 ss) with either control PCAGG, RARα403 or Cyp26A1, and analyzed at E4. Arrowheads in B-C’ point to pH3+ cells in the RP domain of RARα403- and Cyp26A1-electroporated embryos. The quantification of pH3+ cells in the RP is represented in (D). 120 sections were analyzed per embryo. Imaging and analysis were performed at somite levels 24–26. N = 20, 9 and 9 embryos for control, RARα403 and Cyp26A1, respectively. **p < 0.005, ****p < 0.0001, one-way ANOVA with post-hoc Tukey’s tests. (E–G) Apico-basal localization of Hoechst-stained nuclei in embryos electroporated as in A-D. Whereas in control embryos most nuclei are restricted to the basal domain of the RP, in the RP of RARα403-treated embryos, nuclei are apparent across the entire thickness of the tissue. Confocal images were z-stacked and nuclei in the apical and basal halves of the RP domain were counted. The proportion of apically-localized nuclei is represented in (G). Thirteen-to-17 sections were analyzed per embryo. Imaging and analysis were performed at somite levels 25–27. N = 10 and 12 embryos for control and RARα403 groups, respectively, ****p < 0.0001, exact p-value Mann-Whitney test. (H–J) Immunostaining for Laminin of embryos electroporated as in A-D. Arrows and arrowheads in insets of H’ and I’ indicate the presence of either a continuous or a discontinuous RP basal lamina, respectively. Arrows in I point to delaminating cells. (J) Quantification of Laminin intensity along the basal aspect of the RP. Six-to-18 sections were analyzed per embryo. Imaging and analysis were performed at somite levels 25–27. N = 9 embryos both for control and RARα403 treatments. *p < 0.05, Student’s unpaired t-test. Abbreviations, NT, neural tube. Scale bar, (A–C), 50 μm, (E–F, H–I), 10 μm.
-
Figure 4—source data 1
RA signaling promotes cell cycle exit and epithelial traits in dorsal NT cells.
- https://cdn.elifesciences.org/articles/72723/elife-72723-fig4-data1-v1.xlsx
Figure 5 with 3 supplements
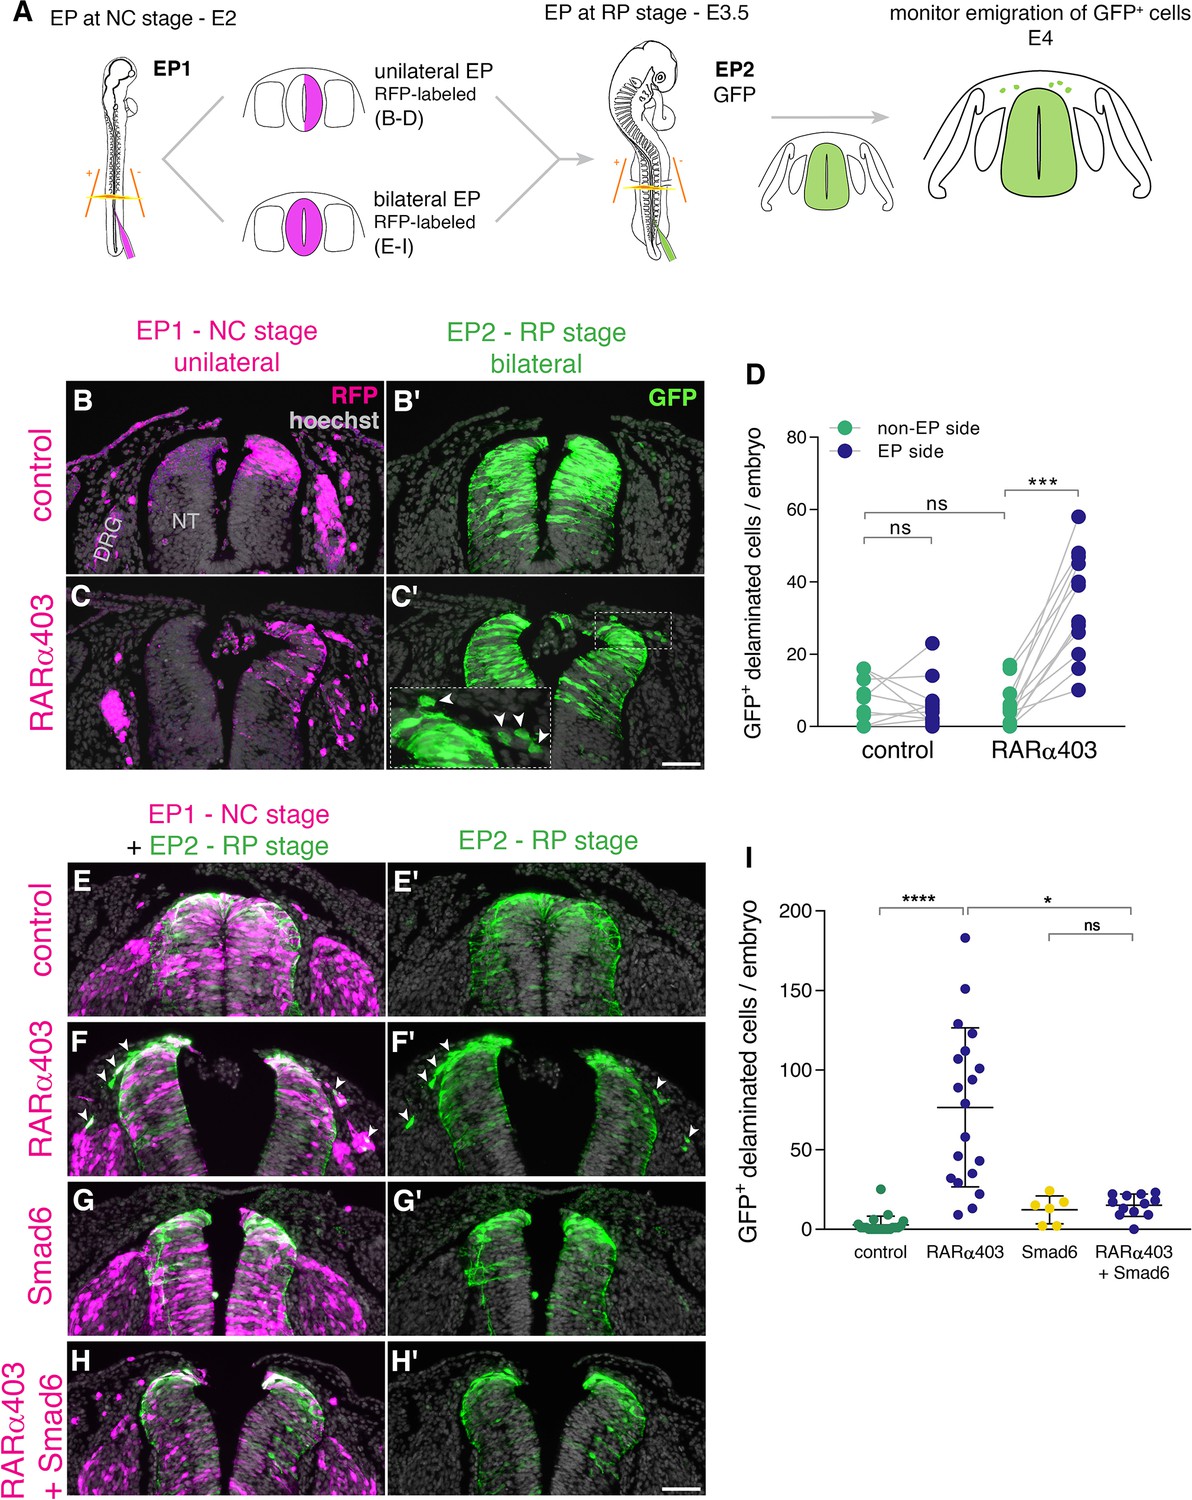
RA is responsible for the end of NC delamination.
(A) Schematic representation of the experimental design for detection of late-emigrating cells (see text for details). (B–D) Embryos electroporated unilaterally at E2 (22-23ss) with either control or RARα403 plasmids, followed by a second bilateral electroporation at E3.5 with control GFP. Emigration of GFP+ cells was compared between electroporated and non-electroporated sides of control and experimental embryos at E4 (D). RFP was delivered with the early electroporation to monitor transfection efficiency. Images presented are adjacent to the rostral somitic domain. Whereas few GFP+ cells delaminated at the RP stage in controls, C’ and inset show late-delaminating GFP+ cells ipsilateral to the early RARα403 electroporation (arrowheads). (D) Quantification of GFP+ cells that emigrated from either intact or electroporated (EP) sides of control and experimental embryos. Seventy two sections per embryo were analyzed at somitic levels 23–25. N = 10 and 11 embryos for control and RARα403 groups, respectively. Statistical tests applied were exact p-value Wilcoxon signed ranks paired test to compare between EP and non-EP sides of embryos inside each experimental group, and exact P-value Mann-Whitney test to compare between non-EP sides of control and RARα403 groups. ***p < 0.001. (E–I) Embryos were electroporated bilaterally at E2 (22-23ss) with control, RARα403, Smad6, or RARα403+ Smad6 constructs along with RFP. At E3.5, bilateral electroporations with GFP were performed and embryos were analyzed for emigration of GFP+ cells at E4. Images presented are opposite a rostral somitic domain. Note the presence of emigrated RFP+ cells in all treatments. Notice as well the presence of GFP+ delaminated cells in F,F’, while virtually no GFP+ cells are seen outside of the NT in E,E’, G,G’ and H,H’. (I) Quantification of delaminated GFP+ cells. Seventy sections per embryo were analyzed at somite levels 23–25. N = 21, 19, 6 and 12 embryos were monitored for control, RARα403, Smad6, and Smad6+ RARα403 groups, respectively. *p < 0.05, ****p < 0.0001, approximate p-value Kruskal-Wallis with post-hoc Dunn’s test. Abbreviations, ns, not significant; NT, neural tube, DRG, dorsal root ganglion. Scale bar, 50 μm.
-
Figure 5—source data 1
RA is responsible for the end of NC delamination.
- https://cdn.elifesciences.org/articles/72723/elife-72723-fig5-data1-v1.xlsx
Figure 5—figure supplement 1
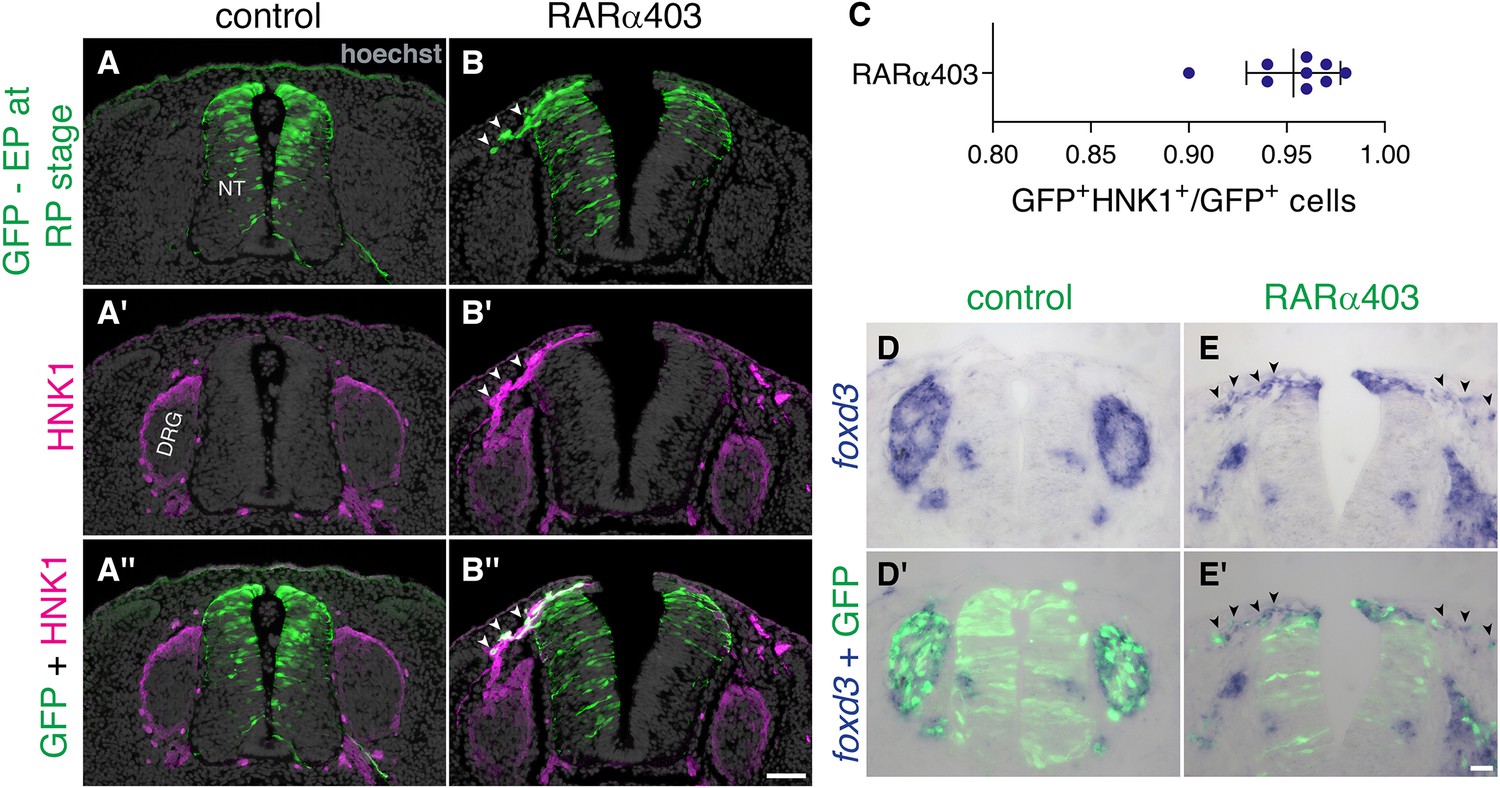
Late-delaminating cells display NC characteristics.
(A–C) Immunostaining for HNK1 of embryos electroporated as in Figure 5 (5, B–D) confirms that late-delaminating GFP+ cells detected in RARα403-treated embryos exhibit traits specific to migrating NC cells (arrowheads in B-B’’). The proportion of GFP+HNK1+ cells out of total GFP+ cells outside the NT, is presented in (C). N = 9 embryos per treatment, 75 sections were monitored per embryo at somite levels 24–26. (D-E’) ISH for foxd3 of embryos electroporated as in Figure 3 (3, A–B) reveals the presence of foxd3+ NC cells in the mesenchyme adjacent to the dorsal NT of all RARα403-treated embryos (arrowheads in E-E’. N = 7). In contrast, only in 2/7 control embryos examined, few foxd3+ + were seen adjacent to the NT. In all control cases foxd3+ + are found in NC derivatives, such as the DRG (N = 7). Abbreviations, DRG, dorsal root ganglion, NT, neural tube. Scale bar, 50 μm.
-
Figure 5—figure supplement 1—source data 1
Late-delaminating cells display NC characteristics.
- https://cdn.elifesciences.org/articles/72723/elife-72723-fig5-figsupp1-data1-v1.xlsx
Figure 5—figure supplement 2
Gain of RA function fails to prematurely downregulate BMP signaling and NC traits.
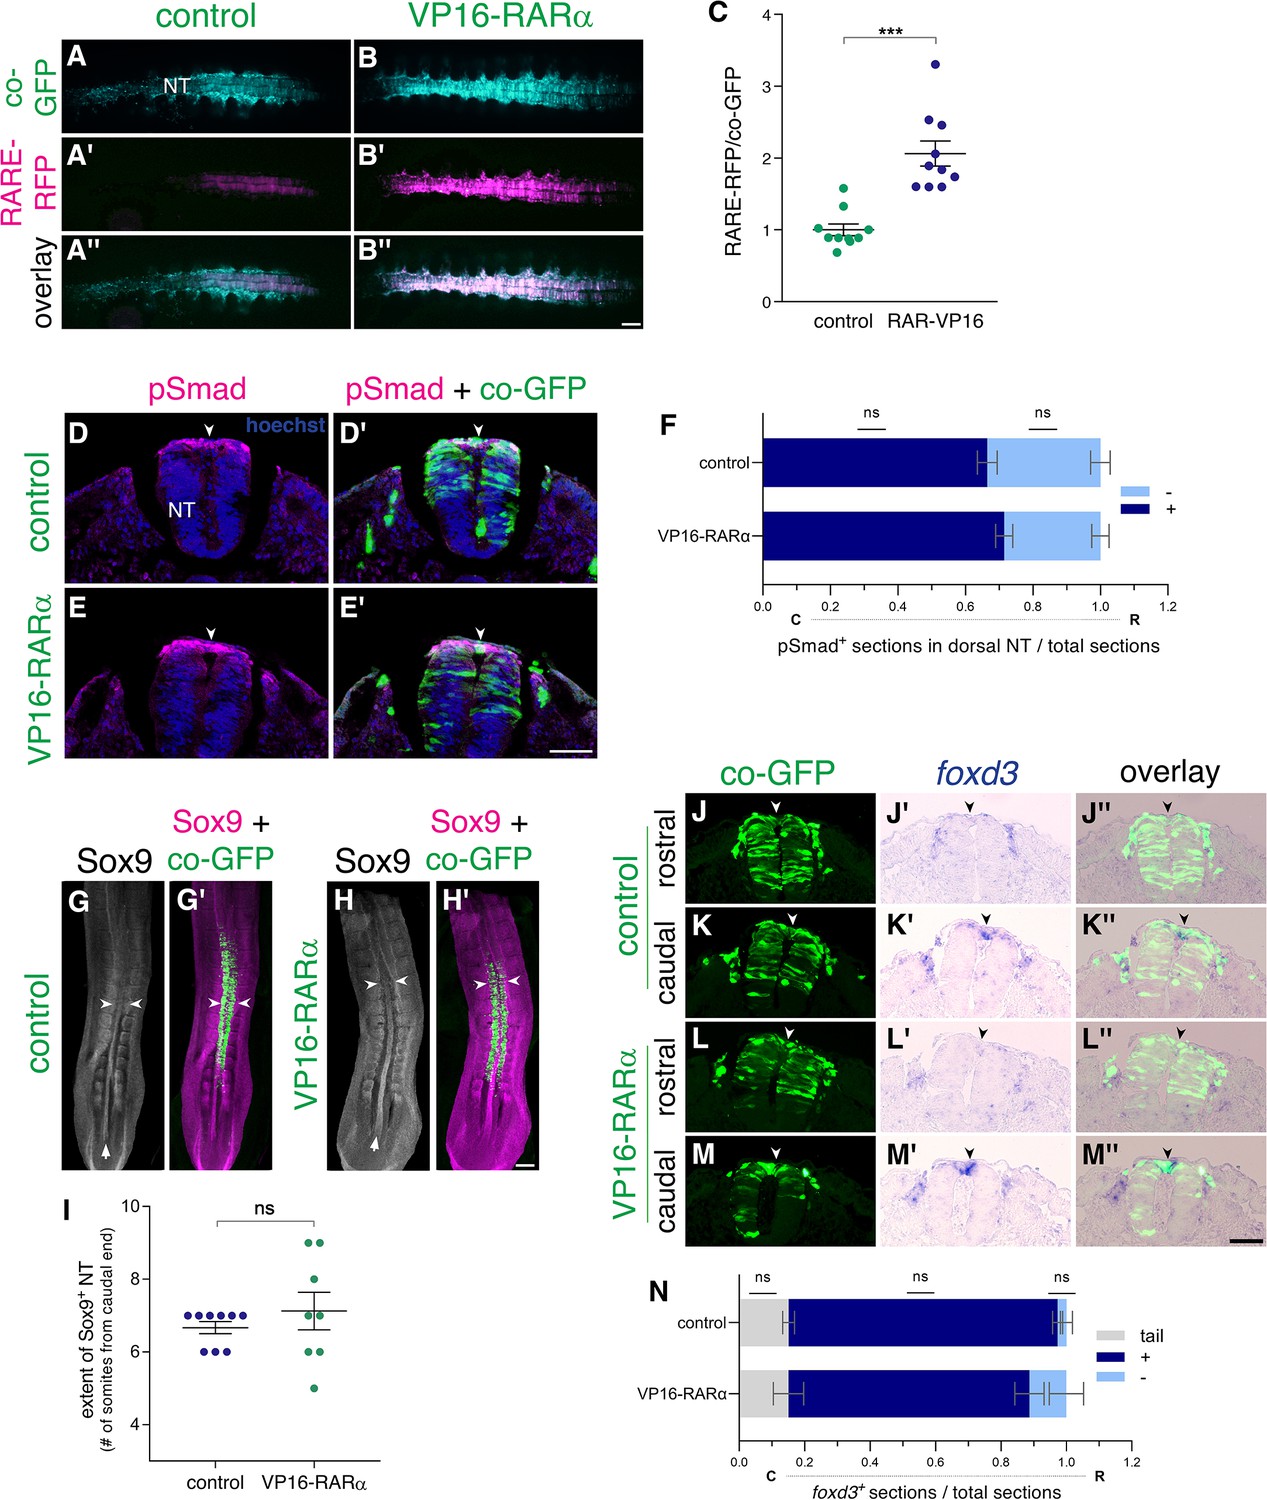
(A–C) VP16-RARα enhances RA signaling in the NT. Measurement of RA activity using RARE-RFP (magenta) in embryos electroporated with VP16-RARα or control plasmid (cyan). NTs were co-electroporated bilaterally at E2 (23-24ss) and analyzed 24 hrs later (E3). GFP was delivered along with the reporter construct and was used to assess the relative intensity of RFP fluorescence on whole-embryo images (C). N = 10 embryos for each group. ***p < 0.001, Welch’s t-test. (D–F) Dynamics of BMP activity assessed by immunostaining for pSmad1/5/9. Embryos were electroporated bilaterally at E2.5 (27ss) with either control PCAGG or VP16-RARα, together with GFP and analyzed 14 hr later (35ss). (D-E’) Images were taken from an axial level positioned just caudal to the level where downregulation of pSmad normally occurs in the dorsal NT midline of control embryos (somite level 23). Note that activation of RA signaling beyond normal levels failed to downregulate pSmad when compared to controls (arrowheads). (F) Quantification of the number of sections positive for pSmad (dark blue) serially monitored from tail to rostral end of the wing bud. Light blue represents sections with no detectable pSmad. Data are expressed as fraction of embryo length from tail. N = 6 and 8 embryos for control and VP16-RARα, respectively. Data were analyzed via Mann-Whitney test. (G–I) The decreasing caudo-rostral gradient of Sox9 immunoreactivity in the NT is not affected by gain of RA function. Embryos were electroporated bilaterally at E2 (24ss) with either control PCAGG or VP16-RARα, together with GFP and analyzed at 28-29ss. Arrows in G,H depict expression of Sox9 in the NT, note also positive signal in adjacent somites. The axial level at which Sox9 staining in the dorsal NT is downregulated, was marked in whole-mount embryos (arrowheads) and quantified in (I) as the number of somites from the last-formed somite pair. N = 9 and 8 embryos for control and VP16-RARα, respectively, Mann-Whitney test. (J–N) ISH for foxd3 in embryos electroporated bilaterally at E2 (23-24ss) with either control PCAGG or VP16-RARα, together with GFP. Serial transverse sections were analyzed at 28-29ss in the caudal (C)-to-rostral (R) direction. (J-M”) Images taken from axial levels positioned just rostral (J,L) and caudal (K,M) to foxd3 downregulation (somite levels 23–24). In both treatments, foxd3 was similarly expressed in the dorsal NT of caudal sections (K-K”,M-M”) and was absent more rostrally (J-J”,L-L”, arrowheads). (N) Quantification of serial sections expressing foxd3. Analysis in the caudo-rostral direction revealed a negative region in the tail (grey), followed by sections with positive signal (blue) and then exhibiting foxd3 downregulation (light blue). Data are expressed as fraction of embryo length from the tail to caudal end of the wing bud. N = 9 and 6 embryos for control and VP16-RARα, respectively. Mann-Whitney test. Abbreviations, NT, neural tube. Scale bar, 50 μm (A-B”,D-E’,J-M”), 200 μm (G-H’).
-
Figure 5—figure supplement 2—source data 1
Gain of RA function fails to prematurely downregulate BMP signaling and NC traits.
- https://cdn.elifesciences.org/articles/72723/elife-72723-fig5-figsupp2-data1-v1.xlsx
Figure 5—figure supplement 3
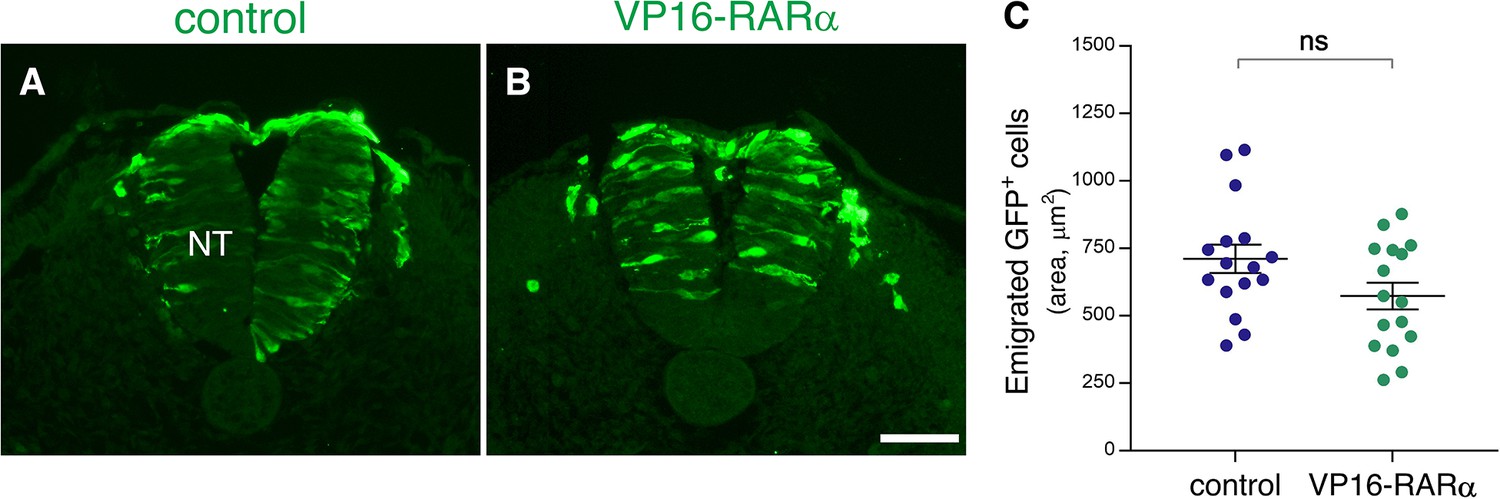
No significant effect of VP16-RARαmisexpression on completion of NC emigration.
(A–C) Emigration of transfected GFP+ cells following gain of RA function. Embryos were electroporated bilaterally at E2.5 (27-28ss) with either control PCAGG or VP16-RARα, together with GFP and analyzed at somite levels 24–26 of embryos aged 35ss. Note ongoing emigration of GFP+ cells in both treatments (A–B). (C) Quantification of NC emigration measured as the area containing GFP+ cells outside the NT (21–42 sections per embryo). N = 16 embryos for each group. p = 0.0654, Welch’s t-test. Abbreviations, NT, neural tube. Scale bar, 50 μm.
-
Figure 5—figure supplement 3—source data 1
No significant effect of VP16-RARα misexpression on completion of NC emigration.
- https://cdn.elifesciences.org/articles/72723/elife-72723-fig5-figsupp3-data1-v1.xlsx
Figure 6 with 2 supplements
Overlapping expression in RP of both NC and RP markers upon inhibition of RA signalling.
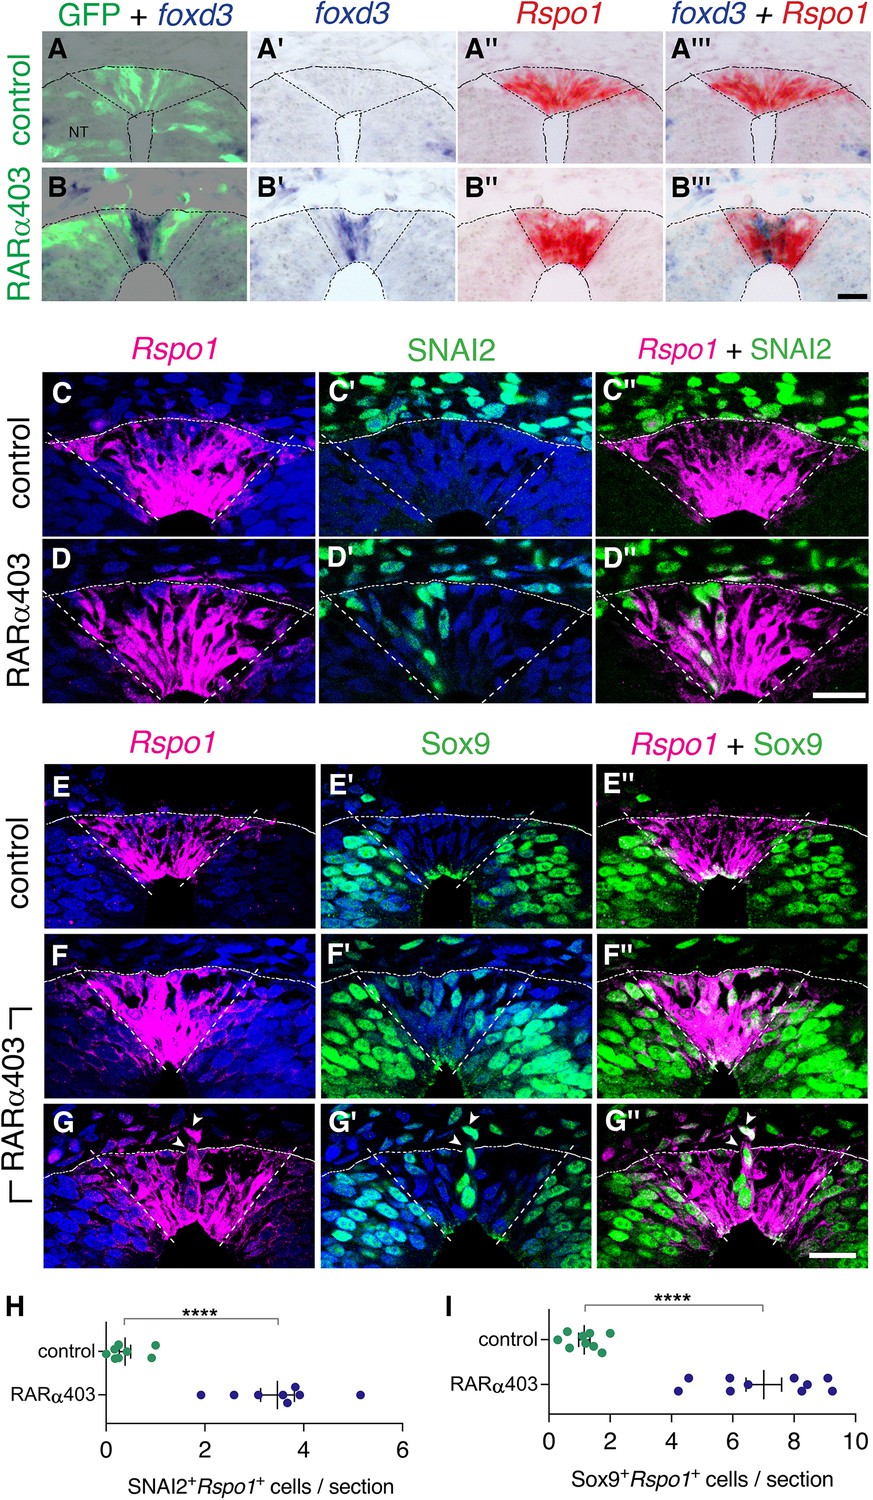
(A-B’’’) Embryos co-electroporated at E2.5 (27ss) with either control PCAGG or RARα403 along with a GFP plasmid. Embryos were fixed at E4, and adjacent sections were in-situ hybridized for foxd3 or Rspo1 and then superimposed to reveal overlapping domains of gene expression. Dotted lines delineate the Rspo1 expression domain. In control embryos, no foxd3 expression was detected in the RP (N = 2, and see also Figure 3). In RARα403-treated embryos, overlapping expression was detected in all four embryos examined. Imaging and analysis were performed somite levels 24–26. (C-D”) Immunostaining for SNAI2 and fluorescent ISH for Rspo1 were combined on the same sections of embryos electroporated at E2.5 (27ss) with either control PCAGG or RARα403 and analyzed at E4. Dashed lines mark the Rspo1 expression domain. Note the presence of SNAI2+Rspo1+ cells in the RP in D”. (E-G”) Immunostaining for Sox9 and fluorescent ISH for Rspo1 were performed as above. Note the presence of Sox9+Rspo1+ cells in the RP in F” and G’’. Additionally, delaminating Sox9+Rspo1+ cells (arrowheads in G-G”) were apparent under experimental conditions. (H,I) Quantification of SNAI2+Rspo1+ and Sox9+Rspo1+ cells in the RP. Imaging and analysis were performed at somite levels 24–26. N = 8 and 8 for SNAI2 in controls and RARα403. N = 9 and 10 embryos for control and RARα403 groups stained with Sox9, respectively. ****p < 0.0001, Welch’s t-test. Abbreviations, NT, neural tube. Scale bar, 20 μm.
-
Figure 6—source data 1
Overlapping expression in RP of both NC and RP markers upon inhibition of RA signalling.
- https://cdn.elifesciences.org/articles/72723/elife-72723-fig6-data1-v1.xlsx
Figure 6—figure supplement 1
Inhibition of RA signaling only partially affects expression of definitive RP markers.
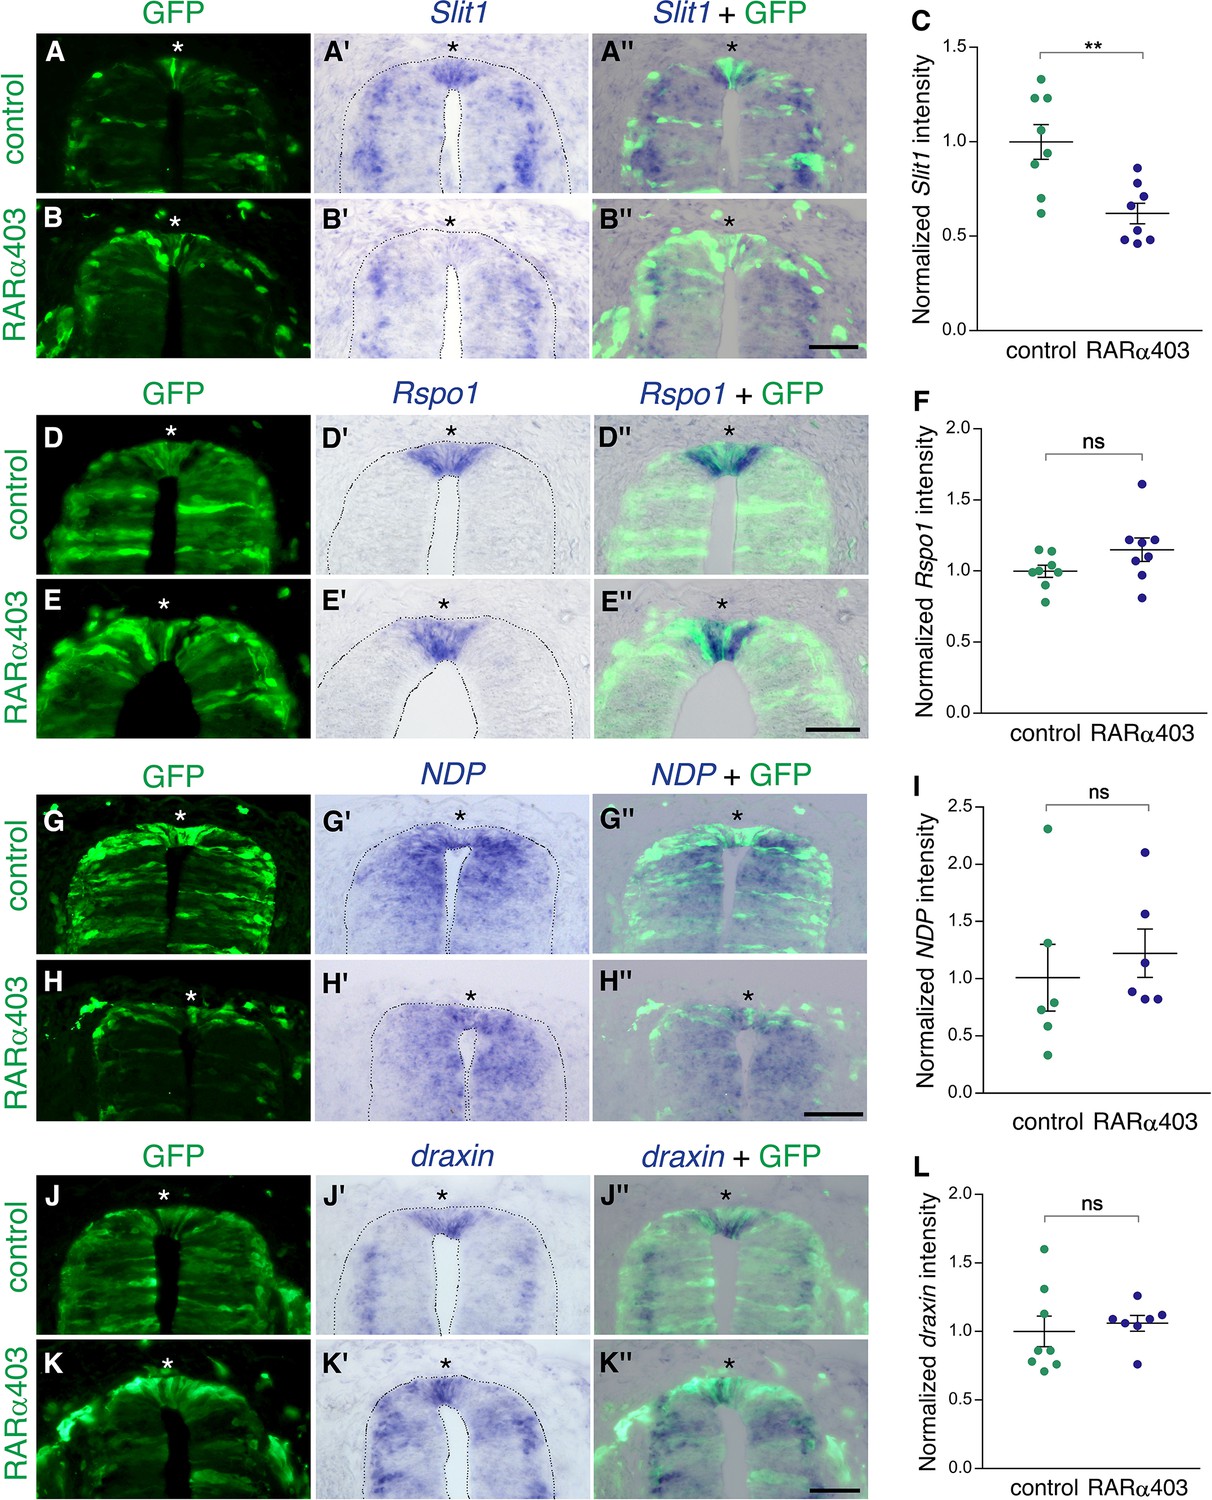
ISH to monitor expression of RP-specific genes. Embryos were electroporated at E2.5 (27 ss) with either control PCAGG or RARα403, together with GFP, and analyzed at E4. Asterisks depict the RP domain. Imaging and analysis were performed at somite levels 25–27. (A–C) ISH for Slit1 reveals downregulation in the RP of RARα403-treated embryos. (C) Data quantification, N = 8 embryos for either control or RARα403 groups, 8–19 sections per embryo were analyzed. **p < 0.005. (D–F) ISH for Rspo1. (F) Data quantification, N = 8 embryos for either control or RARα403 groups, 12–21 sections were analyzed per embryo. (G–I) ISH for NDP (Norrin). (I) Data quantification, N = 6 embryos for either control or RARα403 conditions, 6 sections were analyzed per embryo. (J–L) ISH for draxin. (L) Data quantification, N = 8 control embryos and N = 7 embryos that received RARα403; 10–17 sections were analyzed per embryo. Intensity comparisons of ISH staining presented in C, F, I, and L were carried out using Welch’s t-test. Scale bar, 50 μm.
-
Figure 6—figure supplement 1—source data 1
Inhibition of RA signaling only partially affects expression of definitive RP markers.
- https://cdn.elifesciences.org/articles/72723/elife-72723-fig6-figsupp1-data1-v1.xlsx
Figure 6—figure supplement 2
Gain of RA signaling does not cause a premature upregulation of RP-specific genes.
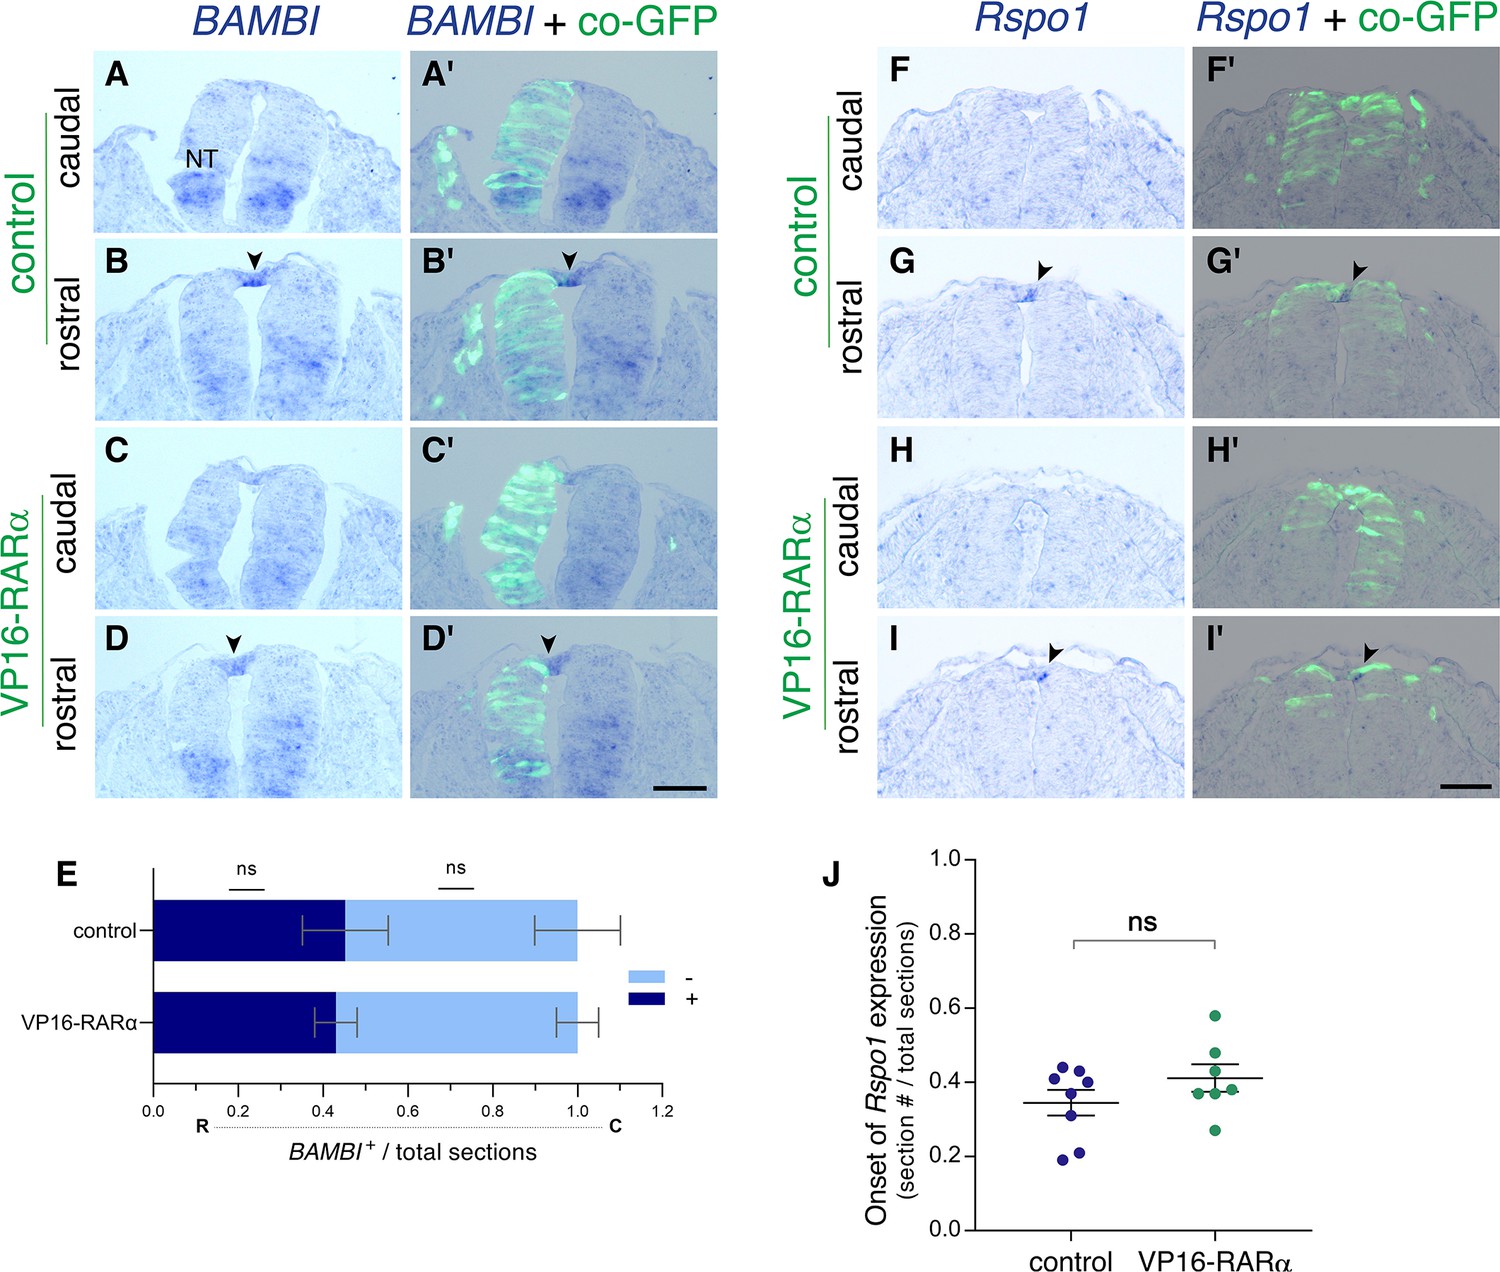
(A–J) ISH for the RP-specific genes BAMBI and Rspo1, to assess their onset of expression in control and VP16-RARα−treated NTs.(A–E) Embryos were electroporated unilaterally at E2 (22-24ss) with either control PCAGG or VP16-RARα, together with GFP and analyzed at 32-33ss for expression of BAMBI. (A-D’) Images taken from axial levels positioned just rostral (B,D) or caudal (A,C) to the first appearance of BAMBI mRNA signal (somite level 25). Positive signal marked by arrowheads in B,D; no signal detected yet at levels of sections in A,C, highlighting similar expression dynamics of BAMBI in the dorsal NT in both treatments. (E) Quantification of serial sections expressing BAMBI. Analysis in the rostro (R)-caudal (C) direction revealed rostral sections with positive signal (blue) followed by caudal sections lacking BAMBI (light blue). Data are expressed as fraction of embryo length (# sections) from the caudal end of the wing bud to the tail. N = 6 and 5 embryos for control and VP16-RARα, respectively, Mann-Whitney test. (F–J) Embryos were electroporated bilaterally at E2.5 (27-28ss) with either control PCAGG or VP16-RARα, together with GFP and analyzed at 35-36ss for expression of Rspo1. (F-I’) Images taken from axial levels localized just rostral or caudal to the onset of Rspo1 expression (somite level 28). Note that Rspo1 begins to be faintly expressed in the rostral region in both treatments (G-G’,I-I’, arrowheads) but is absent from the caudal regions (F-F’,H-H’). (J) Serial quantification of the first section with positive Rspo1 signal out of the total number of sections. Data were monitored from the tail level to the rostral end of the wing bud. N = 8 and 7 embryos for control and VP16-RARα, respectively, Mann-Whitney test. Abbreviations, NT, neural tube. Scale bar, 50 μm.
-
Figure 6—figure supplement 2—source data 1
Figure 6—figure supplement 2 – Gain of RA signaling does not cause a premature upregulation of RP-specific genes.
- https://cdn.elifesciences.org/articles/72723/elife-72723-fig6-figsupp2-data1-v1.xlsx
Figure 7 with 1 supplement
RP-derived dI1 interneuron development only partly depends on RA signalling.
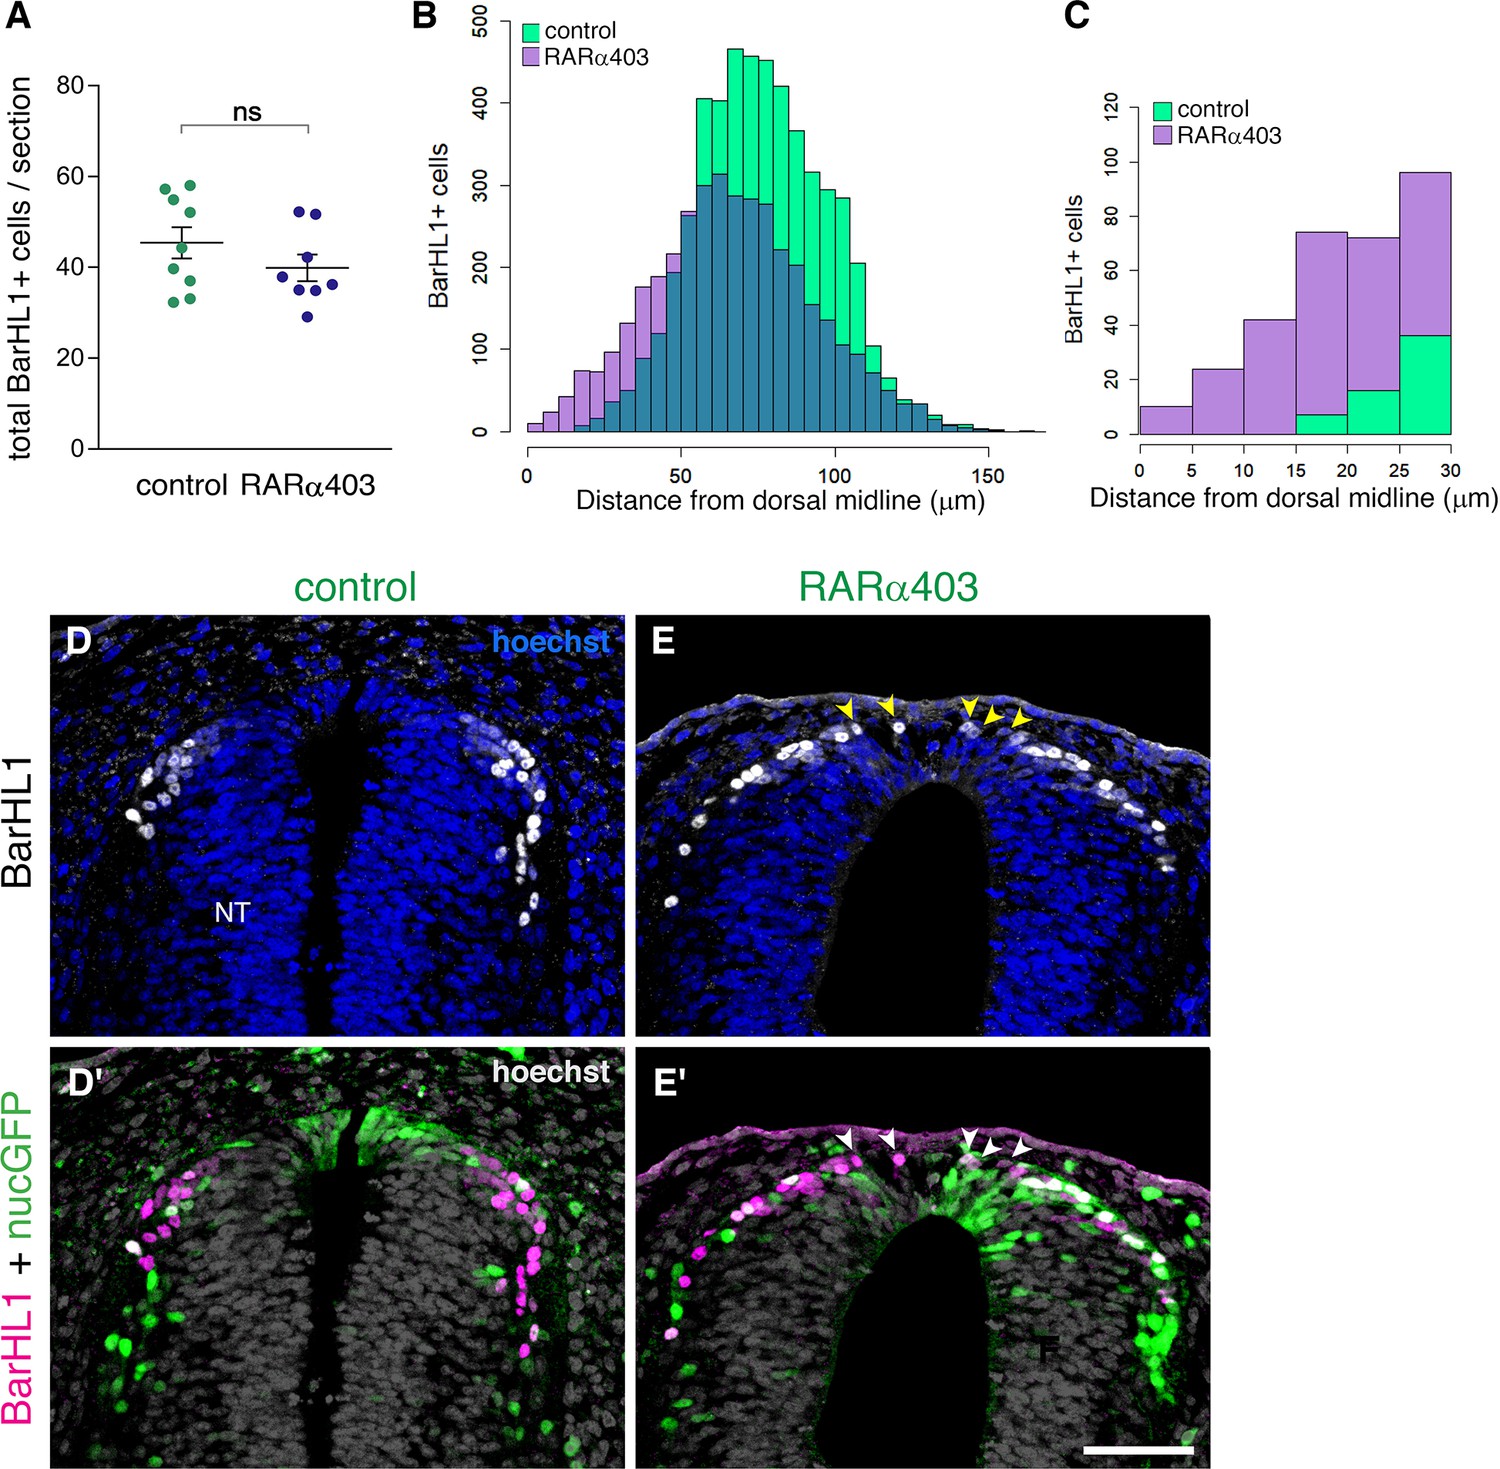
(A) Quantification of BarHL1+ dI1 interneurons in E4 embryos, electroporated at E2.5 (27ss) with either control PCAGG or RARα403. No significant difference in the number of BarHL1+ neurons was monitored. Ten-to-14 sections were analyzed per embryo; N = 9 and 8 embryos for control and RARα403 groups, respectively. Student’s unpaired t-test was applied. (B, C) Spatial distribution of BarHL1+ cells measured as the distance from the dorsal midline. 5126 cells were counted in the control group (green), and 3886 in the RARα403 group (purple). The area of overlap of control and experimental cells is in blue. Note the dorsal shift of cells in the RARα403-treated group when compared to controls. In (B) all the cells are included, while in (C) only cells included in a 30 μm distance from the dorsal midline, comprising the RP region, are presented. (D-E’) Confocal images of BarHL1-stained sections. Nuclear GFP (nucGFP) marks the electroporated domain. Note in E and E’ the presence of BarHL1+ interneurons inside the RP domain (arrowheads) compared to controls in which these neurons are localized ventral to the RP. Nuclei are visualized with Hoechst. Abbreviation, NT, neural tube. Scale bar, 50 μm.
-
Figure 7—source data 1
RP-derived dI1 interneuron development only partly depends on RA signaling.
- https://cdn.elifesciences.org/articles/72723/elife-72723-fig7-data1-v1.xlsx
Figure 7—figure supplement 1
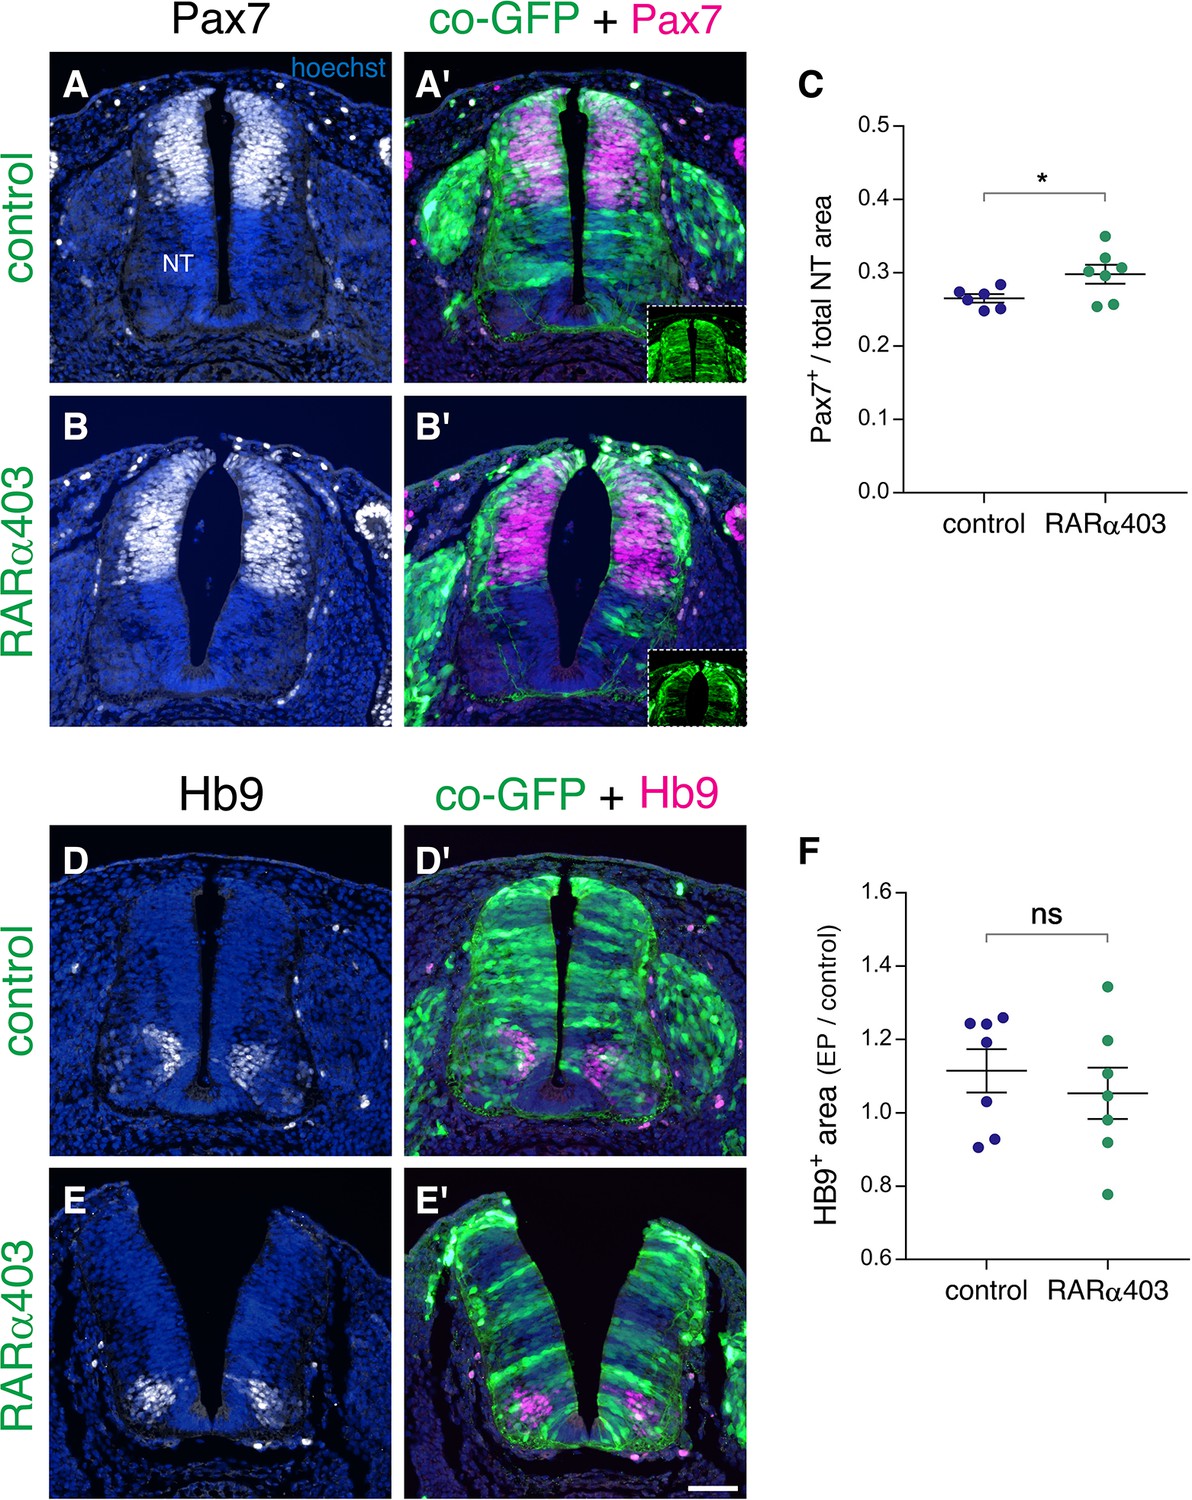
Loss of RA signaling during NC to RP transition does not affect dorso-ventral patterning of the NT.
(A–F) Embryos were electroporated at E2.5 (27 ss) with control PCAGG or RARα403 along with GFP, and immunostained at E4 for Pax7 (A–C) or Hb9 (D–F). (A-B’) Staining for the dorsal marker Pax7. Insets in A’ and B’ show extent of electroporation. (C) Quantification of Pax7 staining. Pax7+ area is expressed as a function of the total NT area. Ten sections per embryos were analyzed at the level immediately caudal to the upper limb. N = 6 and 7 for control and RARα403-treated embryos, respectively. *p < 0.05, Welch’s t-test. (D-E’) Staining for the motoneuron marker Hb9. (F) Quantification of Hb9 staining. The area containing Hb9-positive cells was measured in 10 sections immediately caudal to the upper limb (electroporated region) and in five non-transfected sections at the upper limb level itself. Results are expressed as the ratio between electroporated /control areas of the same embryo. N = 7 for both control and RARα403-treated groups. p = 0.52 using Welch’s t-test. Abbreviations, NT, neural tube. Scale bar, 50 μm.
-
Figure 7—figure supplement 1—source data 1
Loss of RA signaling during NC to RP transition does not affect dorso-ventral patterning of the NT.
- https://cdn.elifesciences.org/articles/72723/elife-72723-fig7-figsupp1-data1-v1.xlsx
Figure 8

Somitic RA is dispensable for NC-to-RP transition.
(A, D) Schematic representations of the experimental design to mechanically separate the NT from somitic mesoderm using an impermeable aluminum foil inserted at 27ss at the level of the rostral segmental plate and five newly formed somites. Embryos were fixed at E4. (B-C’, E-F’) ISH for BAMBI on sections of embryos with intact (B-C’) or split (E-F”) dorsal NTs following grafting of a unilateral barrier between NT and somites. Representative images from two different embryos are presented for each treatment. BAMBI expression remained unchanged in the RP opposite to the operated sides in 7/7 embryos with an intact RP, and in 4/4 embryos with a split RP. Note as well that distal to the barriers, most of the somitic mesoderm disappeared (B,C,E). In some instances, the somatic layer of the lateral plate mesoderm approached the barrier (F). Abbreviations, DM, dermomyotome, DRG, dorsal root ganglion, NT, neural tube. Scale bar, 50 μm.
Figure 9
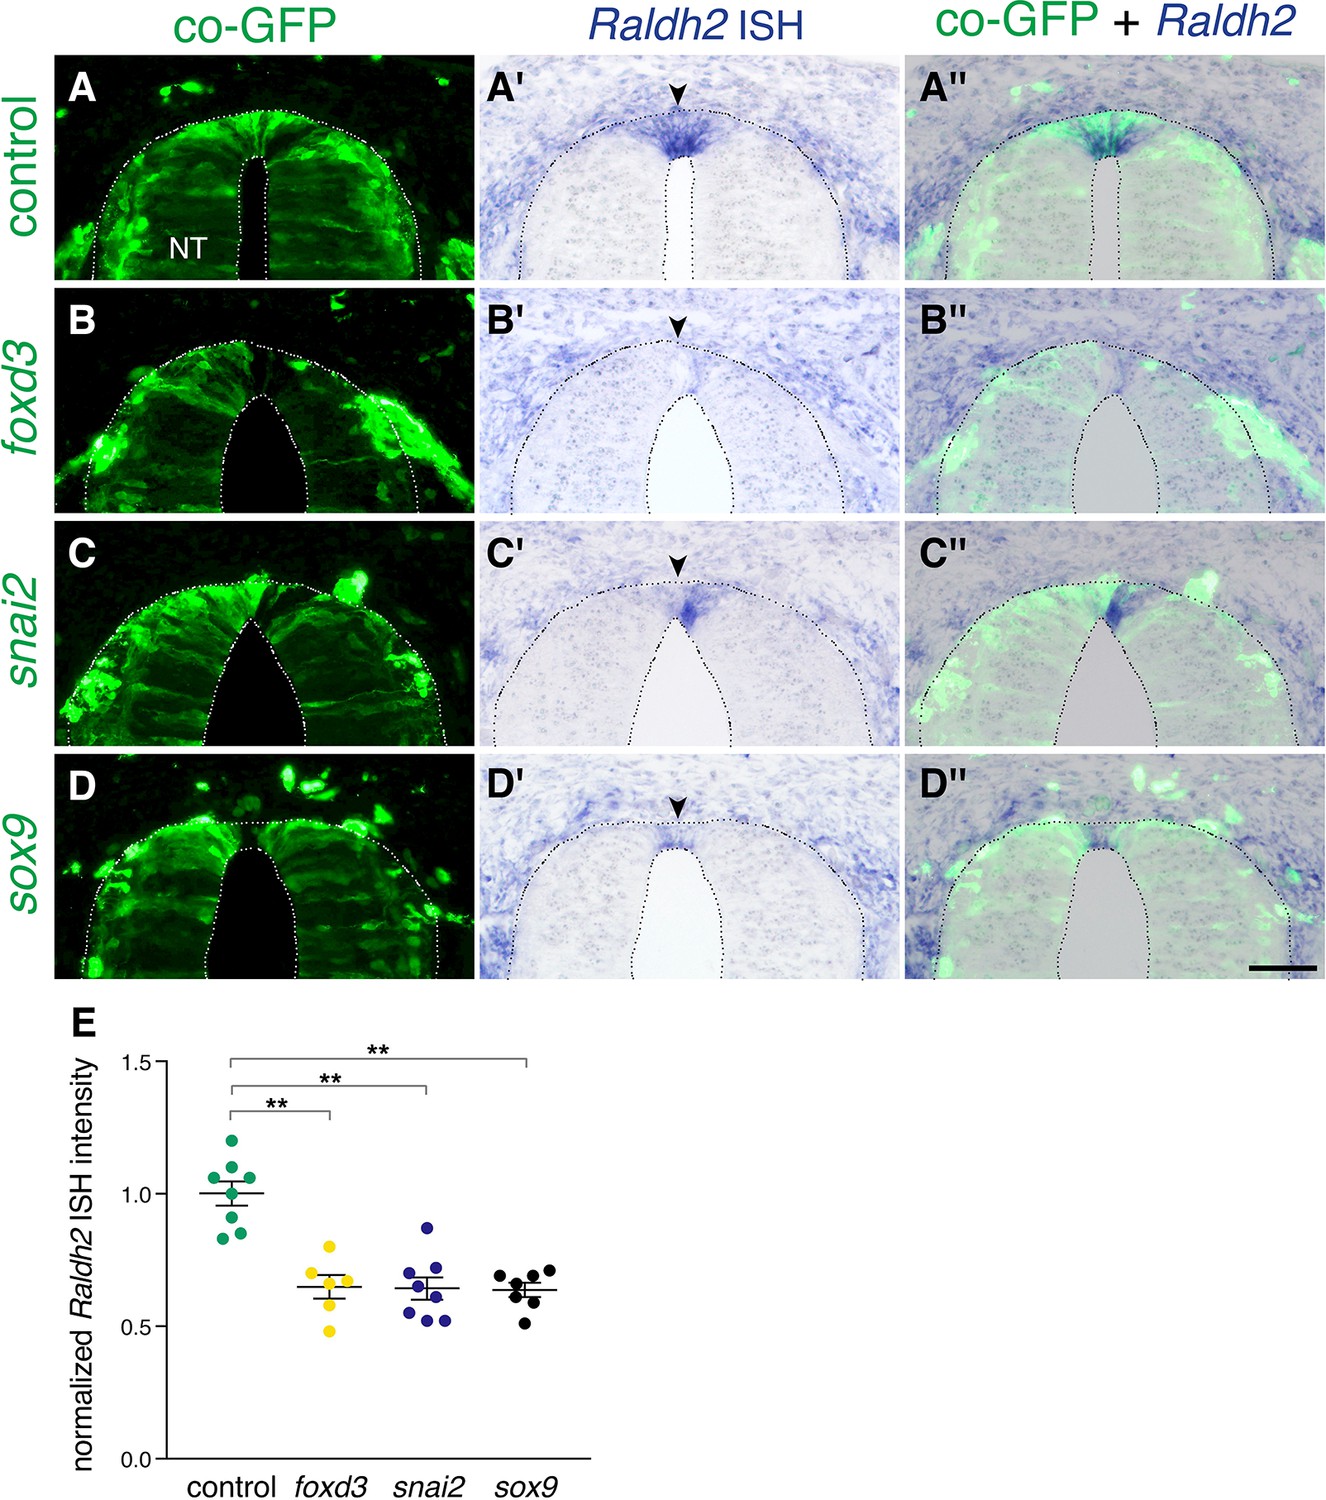
Extension of the activity of NC-specific genes prevents the onset of expression of Raldh2 in the nascent RP.
(A-D”) Embryos were electroporated at E2.5 (27ss) with control unlabeled PCAGG vector or with foxd3, snai2 or sox9-expressing constructs along with GFP, and analyzed at E4 for expression of Raldh2. Note the lack of Raldh2 expression in the transfected cells of all treated groups compared to controls (arrowheads). (E) Quantification of Raldh2 ISH intensity. Six to 30 sections were analyzed at somite levels 24–26. N = 8,6,8 and 7 embryos for control, foxd3, snai2, and sox9 groups, respectively. **p < 0.01 via Kruskal-Wallis with post-hoc Dunn’s test. Abbreviations, NT, neural tube. Scale bar, 50 μm.
-
Figure 9—source data 1
Extension of the activity of NC-specific genes prevents the onset of expression of Raldh2 in the nascent RP.
- https://cdn.elifesciences.org/articles/72723/elife-72723-fig9-data1-v1.xlsx
Figure 10
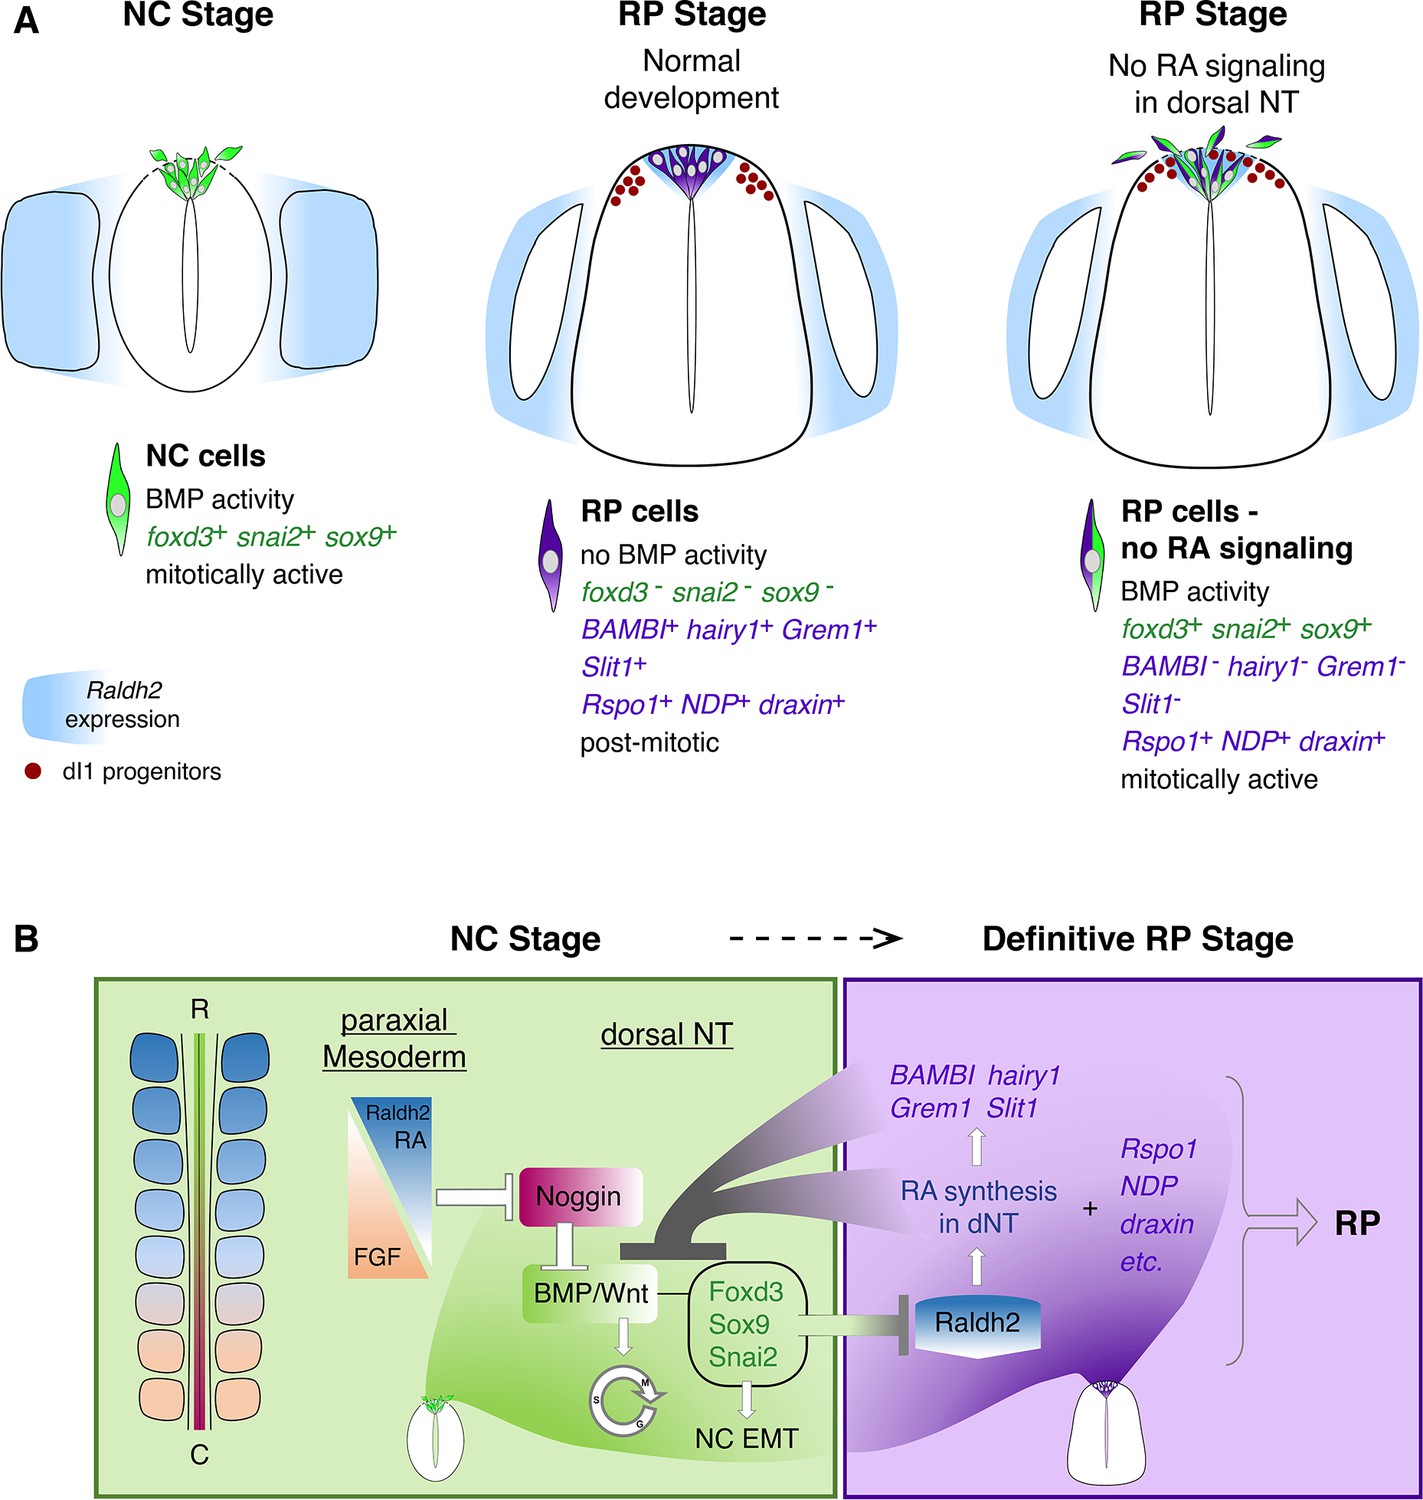
Schematic diagram summarizing the role of RA in the transition from NC to RP.
(A, left panel) At the NC stage, premigratory progenitors residing in the dorsal NT (green) exhibit BMP signaling activity, express specific NC markers (e.g. foxd3, snai2 and sox9, green) and proliferate extensively. Following a process of EMT, NC cells delaminate from the NT through a discontinuous basement membrane (dashed line) to migrate away. At the NC stage, RA is supplied to the NT from the paraxial mesoderm, where it is produced by Raldh2 (blue). (A, middle panel) Under normal conditions, upon cessation of NC production and emigration, a definitive RP forms. RP cells (purple) are refractory to BMP signaling, and exhibit a different gene expression profile when compared to NC cells: they downregulate foxd3, snai2, and sox9 and upregulate RP-specific genes (purple), among which are known inhibitors of BMP signaling. RP cells gradually exit the cell cycle and do not delaminate, regenerating a continuous basement membrane and epithelial traits. During the transition between NC and RP stages, Raldh2 expression begins in the dorsal NT (blue in RP), in addition to RA still produced in somites. The RP functions as a signaling center, regulating specification and/or differentiation of dorsal interneurons (red, dI1 progenitors) that localize ventral to the RP. (A, right panel) In the present study we demonstrate that inhibition of RA signaling in the dorsal NT, impairs the end of NC production and consequently, the normal transition between NC and RP stages. First, under experimental conditions, dorsal NT cells at the RP stage retain active BMP signaling likely via downregulation of BMP antagonists (BAMBI, hairy1, Grem1) otherwise selectively expressed in RP. Second, they express both NC and RP markers (illustrated as green/purple cells), Third, they functionally behave as NC cells, maintaining mitotic activity, impaired epithelial traits (such as a discontinuous basement membrane, dashed line), and continuous emigration from the NT. Fourth, although the advent of several RP-specific markers is normal (e.g; Rspo1, NDP, draxin) and the number of dI1 progenitors (red circles) is unchanged, the spatial segregation between NC, RP, and dI1 interneuron lineages is compromised. (B) A proposed model for the transition between NC (green) and RP (purple) stages. At early stages, reciprocal gradients of RA and FGF in the paraxial mesoderm result in downregulation of the BMP inhibitor Noggin in the dorsal NT. This allows for the activation of BMP and Wnt signaling pathways, which promote cell proliferation and induce NC EMT. As NC cells delaminate and leave the NT, NC-specific genes (foxd3, sox9, and snai2) are downregulated. Since the latter genes inhibit the synthesis of Raldh2 in the nascent RP, their disappearance enables the onset of Raldh2 expression allowing for the local synthesis of RA in RP. RA in turn inhibits BMP and consequently, Wnt signaling, either directly or via upregulation of BMP inhibitors (BAMBI, hairy1, Grem1). We propose the existence of mutual cross-inhibitory interactions between RA-responsive genes that characterize NC and RP stages, respectively, in the temporal sequence leading to the formation of the definitive RP and its segregation from NC.
Tables
Key resources table
| Reagent type (species) or resource | Designation | Source or reference | Identifiers | Additional information |
|---|---|---|---|---|
| Strain, strain background (Japanese quail) | Coturnix coturnix japonica | Moshav Mata | NCBI taxon: 93,934 | |
| Antibody | anti-GFP (Rabbit polyclonal) | Invitrogen, Thermo-Fisher Scientific | Cat#A6455; RRID:AB_221570 | IF(1:1000) |
| Antibody | anti-GFP (Mouse monoclonal) | Abcam | Cat#Ab38689; RRID:AB_732715 | IF(1:100)Not available anymore |
| Antibody | anti-RFP (Rabbit polyclonal) | Acris | Cat# AP09229PU-N; RRID:AB_2035909 | IF(1:1000) |
| Antibody | anti-pSmad1/5/8 (guinea pig polyclonal) | Ed Laufer | N/A | IF(1:300) |
| Antibody | anti-pSmad1/5/9 (Rabbit monoclonal) | Cell Signaling Technology | Cat#CST13820; RRID:AB_2493181 | IF(1:500) |
| Antibody | anti-H3-pS10 (Mouse monoclonal) | Abcam | Cat#Ab14955; RRID:AB_443110 | IF(1:400) |
| Antibody | anti-Laminin (Rabbit polyclonal) | Sigma, Israel | Cat#L9393; RRID:AB_477163 | IF(1:100) |
| Antibody | anti-Sox9 (Rabbit polyclonal) | Millipore | Cat#AB5535; RRID:AB_2239761 | IF(1:150) |
| Antibody | anti-SNAI2 (Rabbit monoclonal) | Cell Signaling Technology | Cat#CST9585; RRID:AB_2239535 | IF(1:500) |
| Antibody | anti-CD57(HNK1) (Mouse monoclonal) | BD Biosciences | Cat#559048; RRID:AB_397184 | IF(1:500) |
| Antibody | anti-BarHL1 (Rabbit polyclonal) | Sigma, Israel | Cat# HPA004809; RRID:AB_1078266 | IF(1:300) |
| Antibody | anti-Pax7(Mouse monoclonal) | DHSB | Cat# pax7; RRID:AB_528428 | IF(1:10) |
| Antibody | anti-Hb9 (mouse monoclonal) | DHSB | Cat# 81.5C10; RRID:AB_2145209 | IF(1:200) |
| Recombinant DNA reagent | pCAGG(plasmid) | Krispin et al., 2010b | ||
| Recombinant DNA reagent | pCAGGS-EGFP(plasmid) | Krispin et al., 2010b | ||
| Recombinant DNA reagent | pCAG-mGFP(plasmid) | Addgene | RRID:Addgene_14757 | |
| Recombinant DNA reagent | pCAGGS-RFP(plasmid) | Ofek et al., 2021 | ||
| Recombinant DNA reagent | pCAGGS-RARα403(plasmid) | This paper | Subcloned as described in Methods section | |
| Recombinant DNA reagent | pCAGGS-Cyp26A1(plasmid) | This paper | Subcloned as described in Methods section | |
| Recombinant DNA reagent | pCAB-cSmad6(plasmid) | Nitzan et al., 2016 | ||
| Recombinant DNA reagent | pCAG-VP16-RARα-IRES-eGFP(plasmid) | Novitch et al., 2003 | From S. Sockanathan | |
| Recombinant DNA reagent | pGL3-RARE-SV40-AP(plasmid) | Gupta and Sen, 2015 | From J. Sen | |
| Recombinant DNA reagent | pGL3-RARE-SV40-RFP(plasmid) | This paper | Subcloned as described in Methods section | |
| Recombinant DNA reagent | pGL3-RARE-SV40-d2EGFP (plasmid) | This paper | Subcloned as described in Methods section | |
| Recombinant DNA reagent | 12XTOPFLASH‐d2EGFP (plasmid) | Rios et al., 2010 | ||
| Recombinant DNA reagent | cRaldh2 (plasmid) | Diez del Corral et al., 2003 | From K. StoreyTemplate for probe synthesis | |
| Recombinant DNA reagent | cBAMBI (plasmid) | Casanova et al., 2012 | EST 603482731F1 | From A. Sanz-EzquerroTemplate for probe synthesis |
| Recombinant DNA reagent | cCyp26A1 (plasmid) | Wilson et al., 2007 | From R. WingateTemplate for probe synthesis | |
| Recombinant DNA reagent | cHairy1 (plasmid) | Jouve et al., 2000; Nitzan et al., 2016 | From D. HenriqueTemplate for probe synthesis | |
| Recombinant DNA reagent | cfoxd3 (plasmid) | Dottori et al., 2001 | EST 603374321F1 | From M. CheungTemplate for probe synthesis |
| Recombinant DNA reagent | cRARα (plasmid) | Diez del Corral et al., 2003 | From K. StoreyTemplate for probe synthesis | |
| Recombinant DNA reagent | cRARβ (plasmid) | Diez del Corral et al., 2003 | From K. StoreyTemplate for probe synthesis | |
| Recombinant DNA reagent | cRARγ(plasmid) | A.Graham | Template for probe synthesis | |
| Recombinant DNA reagent | cRXRα (plasmid) | A.Graham | Template for probe synthesis | |
| Recombinant DNA reagent | cRXRγ (plasmid) | A.Graham | Template for probe synthesis | |
| Sequence-based reagent | qCyp1B1_F | This paper | PCR primers | GTGTTGTGACTGCTGGGATG |
| Sequence-based reagent | qCyp1B1_R | This paper | PCR primers | AGATTGACCAGTGAGCCAGG |
| Sequence-based reagent | qsox9_F | This paper | PCR primers | TCGAAGGAAACTGGCTGACC |
| Sequence-based reagent | qsox9_R | This paper | PCR primers | ATCAATGTGGGGAGGTTGGC |
| Sequence-based reagent | qRspo1_F | This paper | PCR primers | AAACCACCGGTCTCTGTGTC |
| Sequence-based reagent | qRspo1_R | This paper | PCR primers | AGCAGGAGGGAAGGAAGAAG |
| Sequence-based reagent | qdraxin_F | This paper | PCR primers | TGTGCTGGATGTGGTTGTTT |
| Sequence-based reagent | qdraxin_R | This paper | PCR primers | TGGTTTGCAGAGATGCTCAC |
| Sequence-based reagent | qGrem1_F | This paper | PCR primers | AGGCTGCTTTTGGAGAACAA |
| Sequence-based reagent | qGrem1_R | This paper | PCR primers | GAATGGGTTTTGGTTGATG |
| Sequence-based reagent | qCRABP1_F | This paper | PCR primers | ACCTGGAAGATGAGGAGCAG |
| Sequence-based reagent | qCRABP1_R | This paper | PCR primers | CACACGGTCACATACAACACC |
| Sequence-based reagent | qNorrin(NDP)_F | This paper | PCR primers | GCACTGTCCTAAAGCAGCCT |
| Sequence-based reagent | qNorrin(NDP)_R | This paper | PCR primers | TTCAGGCCCCGGGAGATATT |
| Sequence-based reagent | qsnai2_F | This paper | PCR primers | TGAGATACGGGGAAAGACGC |
| Sequence-based reagent | qsnai2_R | This paper | PCR primers | AGGCACTTGGAGGGGTAATG |
| Commercial assay or kit | KAPA2G Fast ReadyMix PCR | Sigma, Israel | Cat#KK5101 | |
| Chemical compound, drug | NBT | Roche | Cat#11383213001 | |
| Chemical compound, drug | BCIP | Sigma, Israel | Cat#B8503 | |
| Chemical compound, drug | Fast Red | Sigma, Israel | Cat#F4648 | |
| Software, algorithm | FIJI | Schindelin et al., 2009 | https://imagej.net/software/fiji/ | |
| Software, algorithm | R and R-Studio | https://www.R-project.org; http://www.rstudio.com | RRID:SCR_000432 | R Version 4.0.3 |
| Software, algorithm | Adobe Photoshop and Indesign CS6 | Adobe | https://www.adobe.com/ | |
| Software, algorithm | Graphpad Prism | Graphpad https://www.graphpad.com | RRID:SCR_002798 | Version 7.0 |
| Other | BTX square wave electroporator | BTX, San Diego, CA, USA | Cat#45–0662 | |
| Other | DP73 cooled CCD digital camera | Olympus | https://www.olympus-global.com/ | |
| Other | BX51 microscope | Olympus | https://www.olympus-global.com/ | |
| Other | Nikon Eclipse 90i microscope | Nikon | https://www.nikon.com/ | |
| Other | D-Eclipse c1 confocal system | Nikon | https://www.nikon.com/ | |
| Other | DIG RNA mix | Roche | Cat#11277073910 | |
| Other | anti-digoxigenin-AP | Roche | Cat#11093274910 | |
| Other | Hoechst 33,258 stain | Sigma, Israel | Cat#14,530 | (125 ng/ml) |
Additional files
Download links
A two-part list of links to download the article, or parts of the article, in various formats.
Downloads (link to download the article as PDF)
Open citations (links to open the citations from this article in various online reference manager services)
Cite this article (links to download the citations from this article in formats compatible with various reference manager tools)
Completion of neural crest cell production and emigration is regulated by retinoic-acid-dependent inhibition of BMP signaling
eLife 11:e72723.
https://doi.org/10.7554/eLife.72723


