Ontogeny of circulating lipid metabolism in pregnancy and early childhood – a longitudinal population study
- Metabolomics Laboratory, Baker Heart and Diabetes Institute, Australia
- Singapore Lipidomics Incubator, Life Sciences Institute, National University of Singapore, Singapore
- Department of Biochemistry, Yong Loo Lin School of Medicine, National University of Singapore, Singapore
- Singapore Institute for Clinical Sciences, A*STAR, Singapore
- School of Medicine, Deakin University, Australia
- Child Health Research Unit, Barwon Health, Australia
- Murdoch Children's Research Institute, Royal Children’s Hospital, Australia
- Dept of Paediatrics, University of Melbourne, Australia
- The Florey Institute of Neuroscience and Mental Health, Australia
Figures
Figure 1
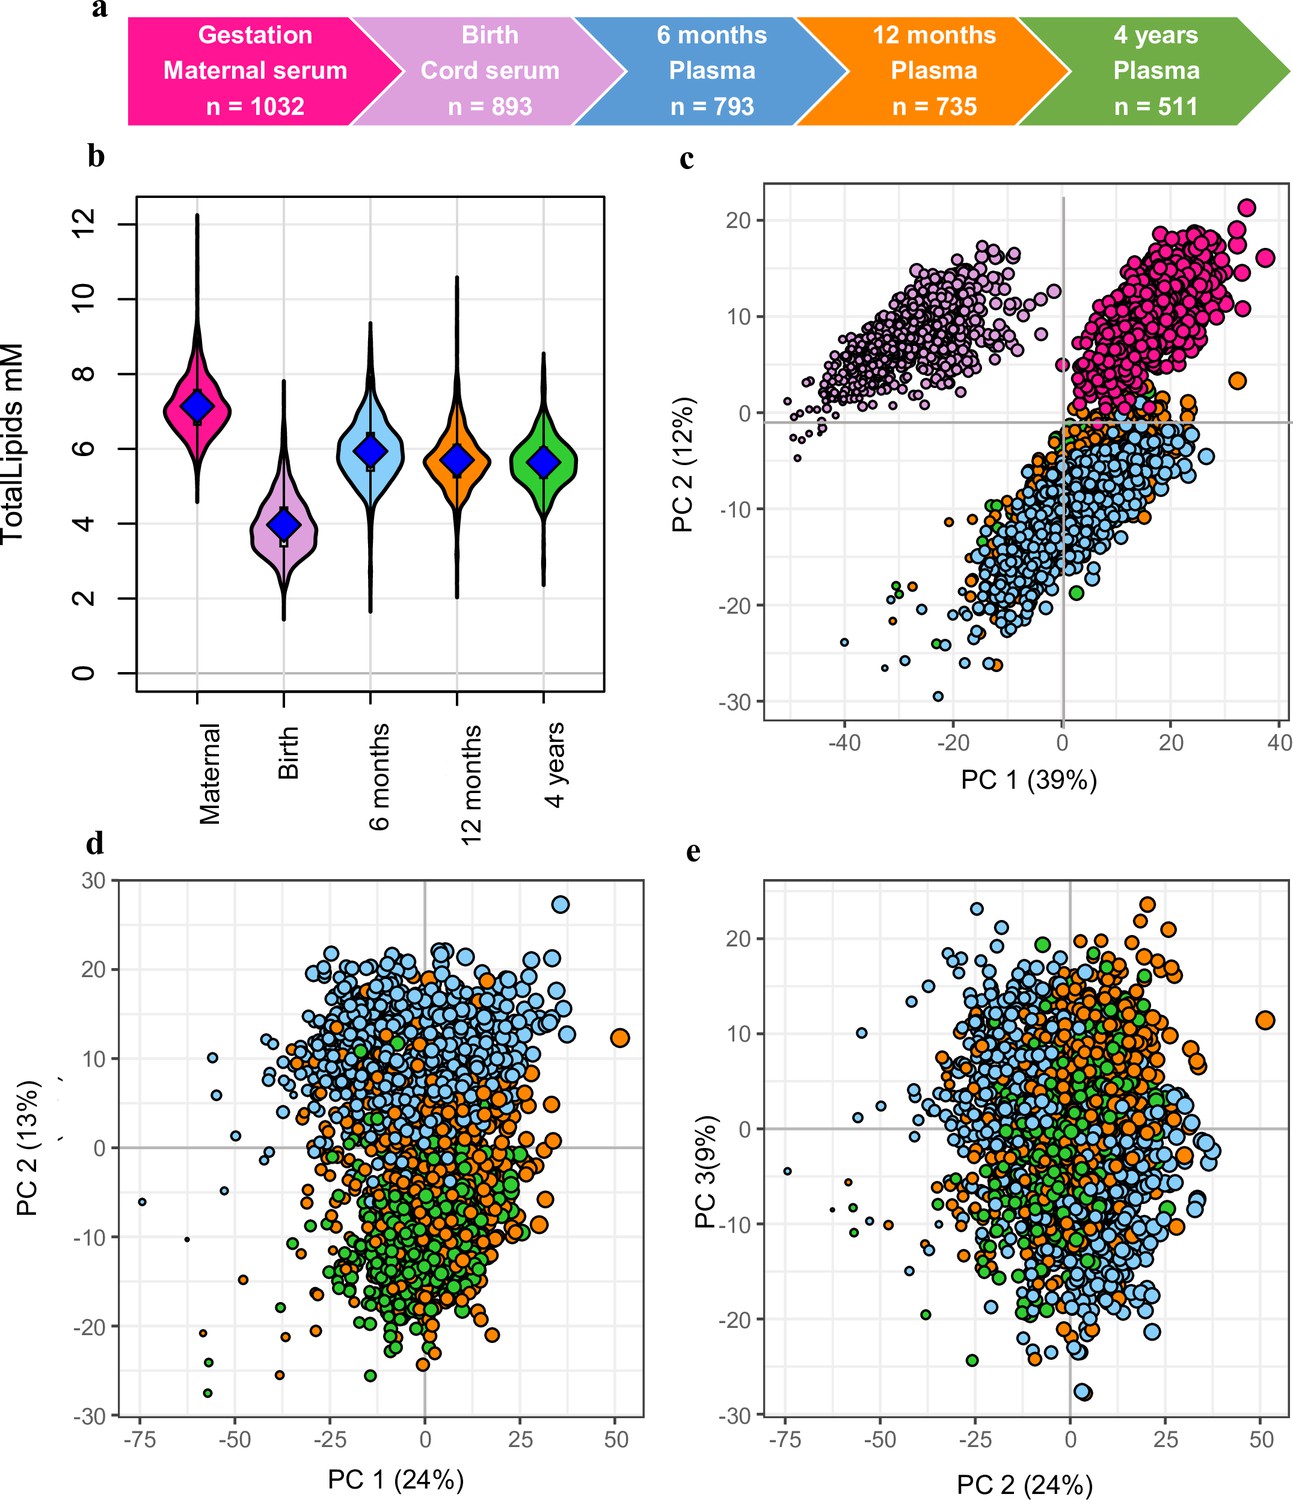
Snapshot of the Barwon Infant Study (BIS) lipidomics.
(a) The BIS timeline and final lipidomic sample numbers at each time point. (b) Total lipid concentration in maternal and infant sample groups. (c) Principal component analysis (PCA) of the lipidomic measures at all the time points, marker size is proportional to the median log total lipid level (%). (d) PCA (PC1 vs. PC2) of the lipidomic measures at 6 months, 12 months, and 4 years, marker size as previously stated. (e) PCA (PC2 vs. PC3) of the lipidomic measures at 6 months, 12 months, and 4 years, marker size as previously stated. For all panels: Maternal serum, M28, pink colour; newborn cord serum, birth, purple colour; 6-month plasma, blue colour; infant 12-month plasma, orange colour; 4-year plasma, green colour.
Figure 2 with 3 supplements

The newborn cord serum lipidome is influenced by gestational age (GA) and birth weight (BW).
( a) Estimated percentage difference of the lipid species per day increase in gestational age, determined using linear regression, adjusted for weight, sex, mode of birth, duration of labour, maternal pre-pregnancy BMI, gestational diabetes mellitus (GDM), maternal education, birth order, and lipidomics run batch. (b), Estimated percentage difference of the individual lipid species per kilogram increase in birth weight, determined using the same model as (a).
Figure 2—figure supplement 1
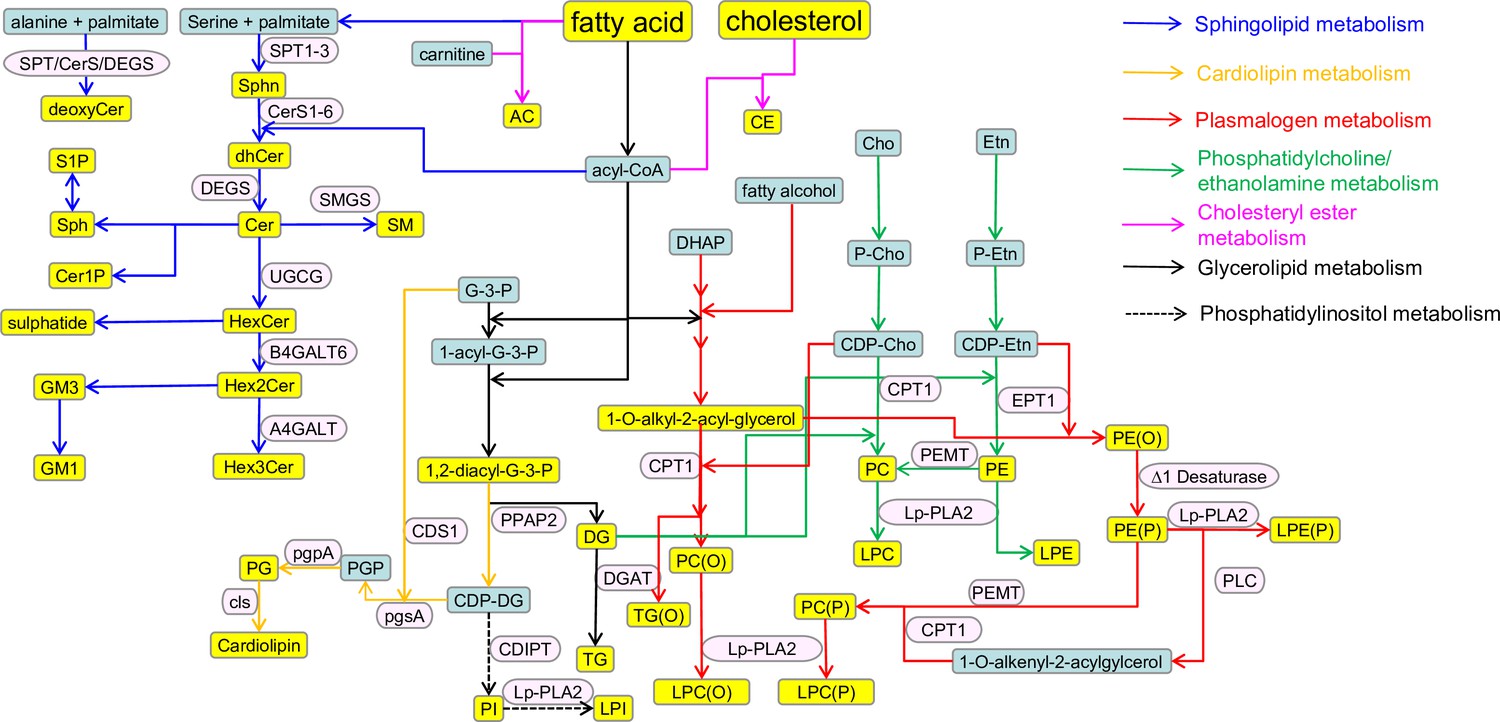
Schematic representation of the lipid metabolism and related pathways.
Lipid classes are shown in yellow: AC, acylcarnitine; CE, cholesterol ester; Cer, ceramide; Cer1P, ceramide-1-phosphate; deoxyCer, deoxyceramides; DG, diacylglycerol; dhCer, dihydroceramide; GM3, GM3 ganglioside; GM1, GM1 ganglioside; Hex1Cer, hexosyl-1-cermaide; Hex2Cer, hexosyl-2-ceramide; Hex3Cer, hexosyl-3-ceramide; LPC, lysophosphatidylcholine; LPC(O), lysoalkylphosphatidylcholine; LPE, lysophospahtidylethanolamine; LPE(P), lyso-alkenylphosphatidylethanolamine; LPI, lysophosphatidylinsoitol; PC, phosphatidylcholine; PC(O), alkylphospahtidylcholine; PE, phosphatidylethanolamine; PE(O), alkylphosphatidylethanolamine; PE(P), alkenylphosphatidylethanolamine; PG, phosphatidylglycerol; PI, phosphatidylinositol; Sphn, sphingonine; SM, sphingomyelin; S1P, sphingosine-1-phosphate; Sph, sphingosine; TG, triacylglycerol; TG(O), alkyldiacylglycerol; 1,2-diacyl G3P, 1,2-diacyl glycerol-3-phosphate. Key intermediates are shown in green: Acyl-CoA, acyl-coenzymeA; Cho, choline; Etn, ethanolamine; CDP-Cho, cytidine 5ʹ-diphosphate (CDP)-choline; CDP-Etn, CDP-ethanolamine; CDP-DG, CDP-diacylglcyerol; DHAP, di-hydroxy acetone phosphate; G-3-P, glycerol-3-phosphate; P-Etn, phosphoethanolamine; P-Cho, phosphocholine; 1-acyl-G-3-P, 1-acyl-glcyerol-3-phosphate; PGP, phosphatidylglycerol phosphate. Enzymes are shown in pink: A4GALT6, lactosylceramide 4-α-galactosyltransferase; B4GALT6, β-1,4-galactosyltransferase 6; CDIPT, CDP-DAG-inositol 3-phosphatidyltransferase; CDS1, CDP-diacylglycerol synthase 1; CerS1-6, ceramide synthase 1–6; CLS, cardiolipin synthase; CPT-1, CDP choline:1,2-diacylglycerol cholinephosphotransferase; DEGS, dihydroceramide desaturase; DGAT, diacylglycerolacyltransferase; EPT-1: CDP-ethanolamine:1,2-diacylglycerol ethanolaminephosphotransferase; Lp-PLA-2, lipoprotein-associated phospholipase A2; PEMT, phosphatidylethanolamine N-methyltransferase; pgpA, phosphatidylglycerophosphatase A; pgsA, phosphatidylglycerol phosphate synthase; PLC, phospholipase C; PPAP2, phosphatidate phosphatase; SPT1–3, serine palmitoyltransferase; SMGS, sphingomyelin synthase; UGCG, ceramide glucosyltransferase.
Figure 2—figure supplement 2
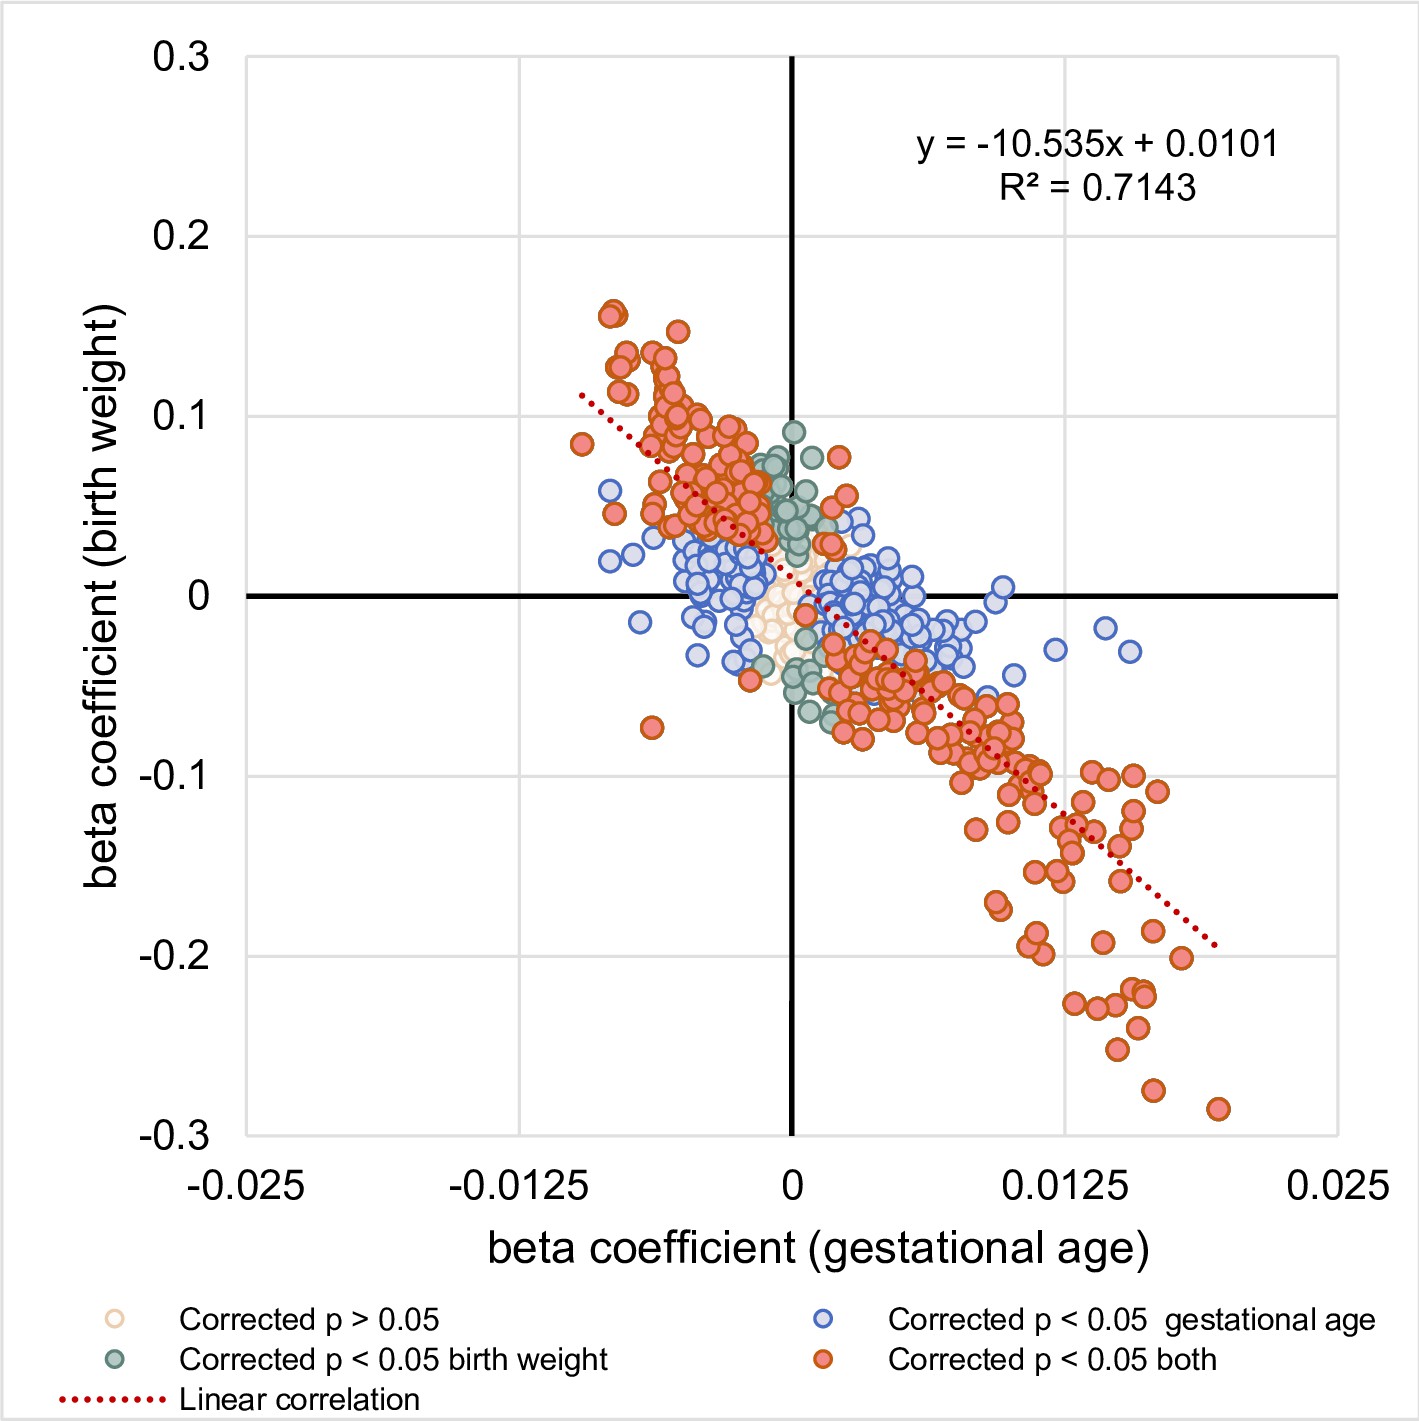
Relationship between the associations of lipid species with gestational age and birth weight.
The correlation between regression coefficients of each lipid species associated with gestational age (x-axis) and lipid species associated with birth weight (y-axis) was examined.
Figure 2—figure supplement 3
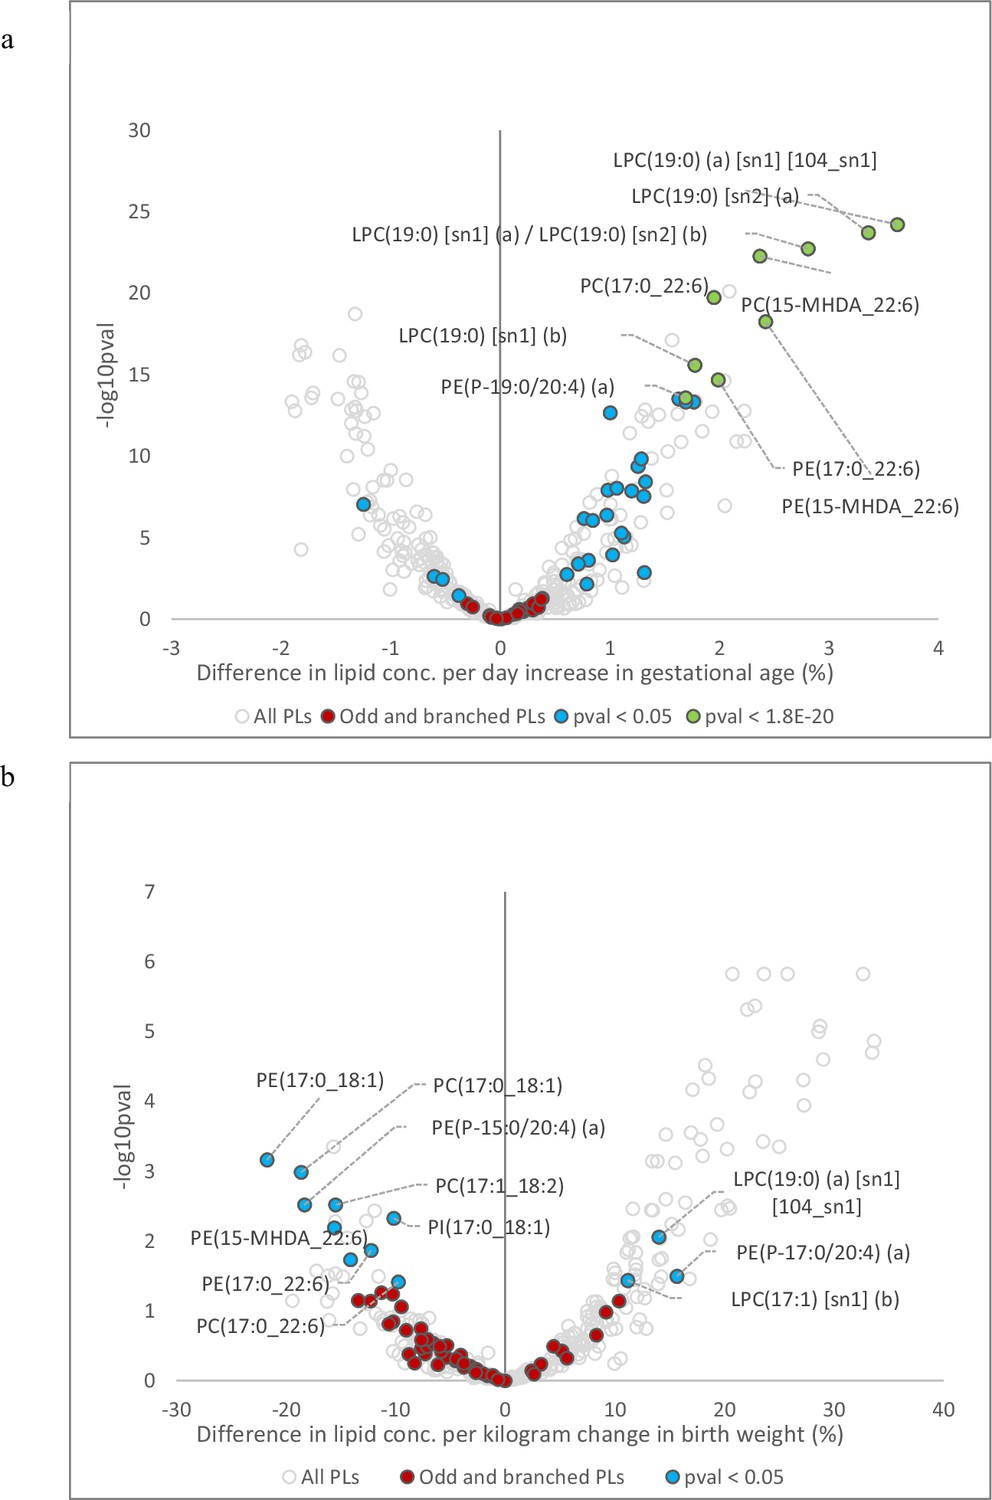
Association of cord serum phospholipids with gestational age and birth weight.
(a) Volcano plot showing newborn phospholipids associated with gestational age. (b) Volcano plot showing newborn plasma phospholipids associated with birth weight. Open circles represent all phospholipids (PL) and lysophospholipid (LPL) species. Coloured circles represent PL and LPL containing odd- and branched-chain fatty acids. Red circles represent non-significant associations, blue circles represent significant lipids (p < 0.05), green circles represent 10 most significant lipids (lowest p-values).
Figure 3 with 1 supplement
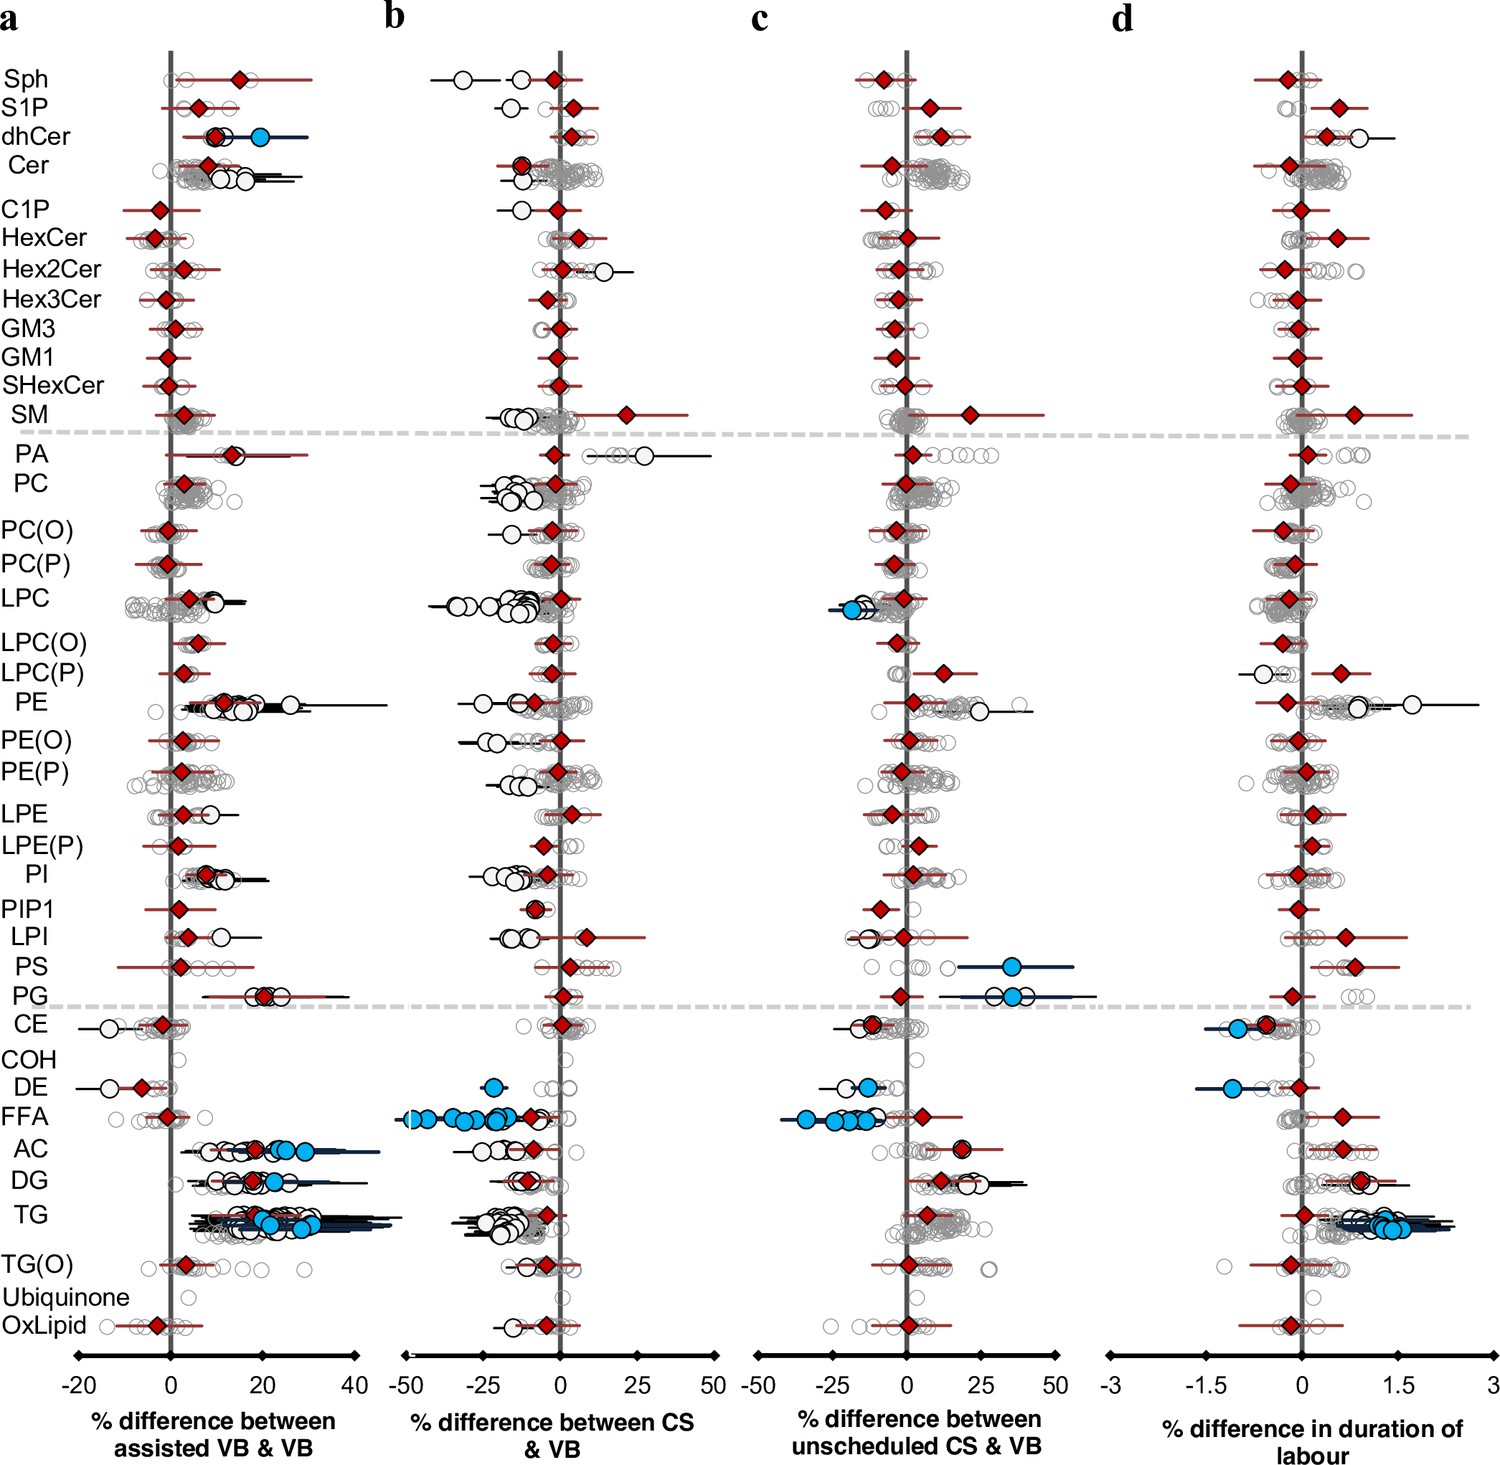
Mode of birth influences the newborn cord serum lipidome.
Linear regression of the lipidome on delivery mode, each mode: assisted vaginal birth (assisted VB), scheduled caesarean (CS), unscheduled caesarean (unscheduled CS) being compared to unassisted vaginal birth (VB), adjusting for birth weight, gestational age, sex, duration of labour, maternal pre-pregnancy BMI, gestational diabetes mellitus (GDM), maternal education, birth order, and lipidomics run batch. Results are shown as % difference in lipids between each mode and VB. (a) Lipid species associated with assisted vaginal delivery. (b) Lipid species associated with scheduled caesarean delivery. (c) Lipid species associated with unscheduled caesarean delivery. (d) Lipid species associated with duration of labour, independent of the mode of delivery. Each circle on the plot represents a lipid species, grey open circles show non-significant lipid species (p > 0.05), white closed circles show significant lipid species (p < 0.05), the top 10 lipid species (10 lowest p-values) are shown in blue circles. Each red diamond represents a lipid class. All p-values were corrected for multiple comparisons. The horizontal bars (error bars) are shown for the significant lipid species (white closed circles), the top 10 lipid species (blue circles), Corrected p-value < 1.64 × 10–03, 2.16 × 10⁻¹², 2.27 × 10–03, 1.8 × 10–02, respectively, and the lipid classes (red diamonds). The error bars represent 95% confidence intervals. Grey dotted lines separate sphingolipids, phospholipids, and other lipids.
Figure 3—figure supplement 1
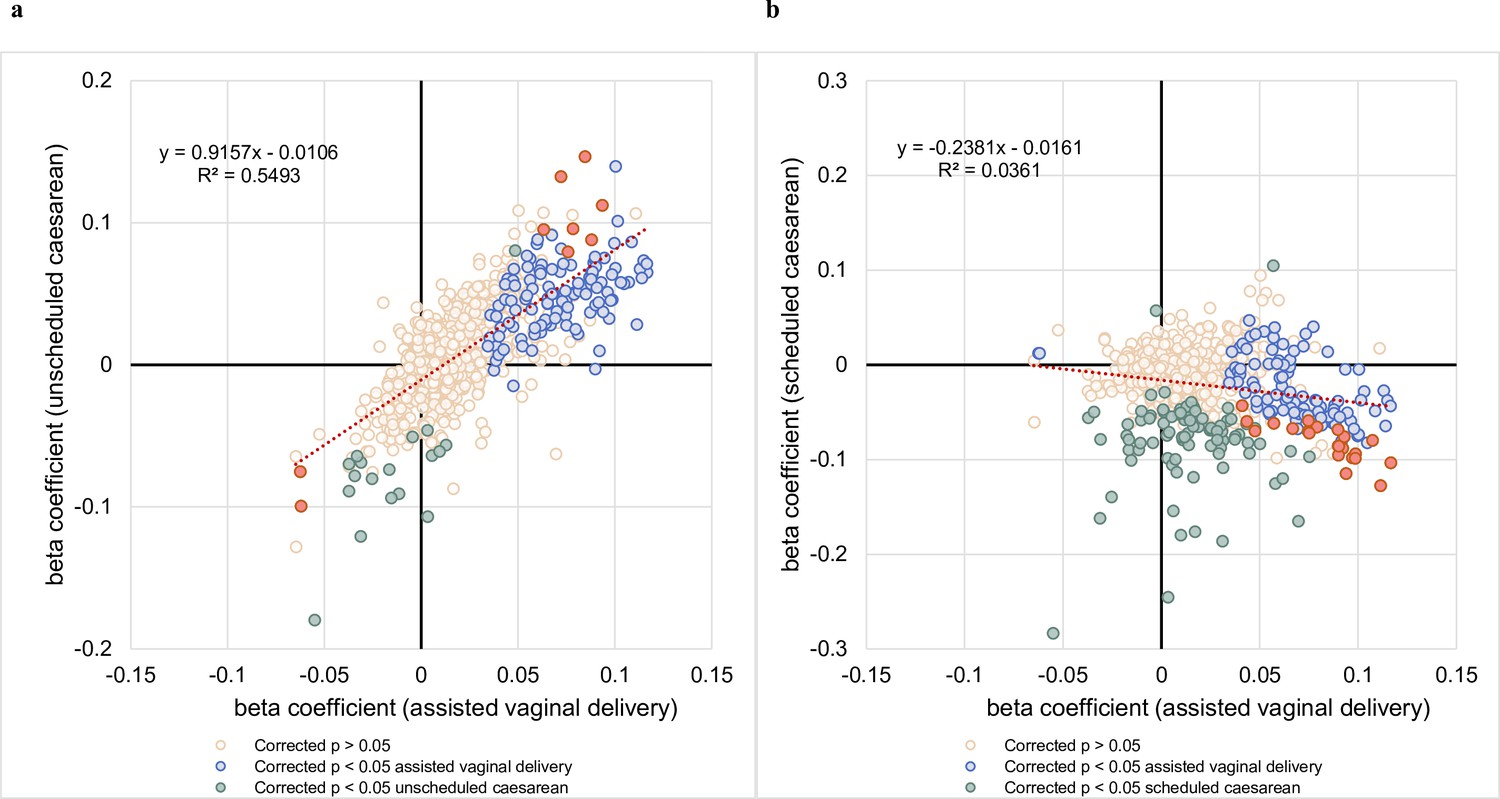
Comparison of beta coefficients of lipids associated with assisted vaginal birth vs unscheduled and scheduled caesarean births.
(a) The correlation between regression coefficients of each lipid species associated with assisted vaginal delivery (x-axis) and lipid species associated with unscheduled,caesarean delivery (y-axis) was examined. (b) The correlation between regression coefficients of each lipid species associated with assisted vaginal delivery (x-axis) and lipid species associated with scheduled caesarean delivery (y-axis) was examined.
Figure 4
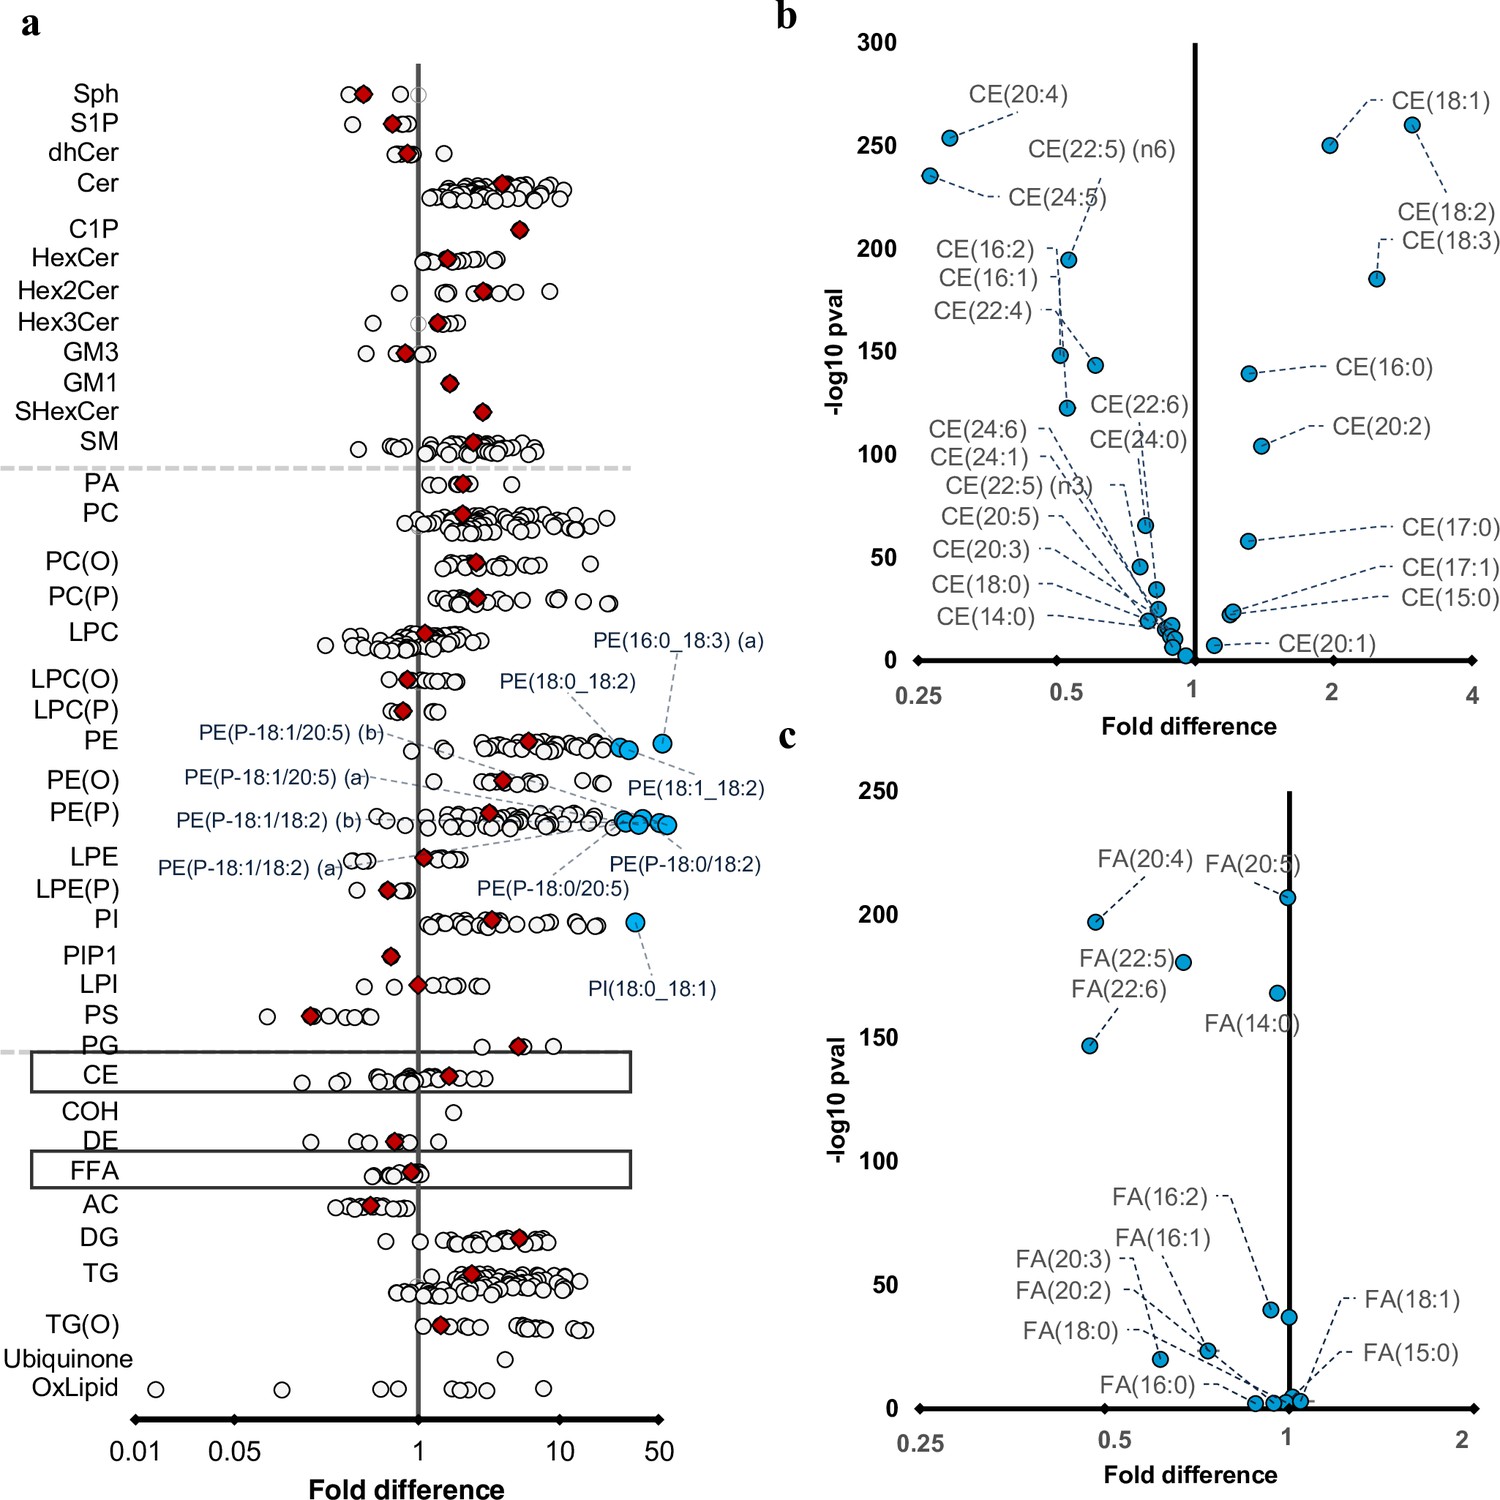
Differences in maternal and cord serum lipid species.
Paired Wilcoxon tests were performed, and results are shown as fold differences of mothers relative to infants. (a) Fold differences in lipid concentrations between maternal and cord serum. Cholesteryl esters and free fatty acid (FFA) classes are highlighted in boxes. (b) Selective enrichment of cholesteryl esters containing long chain polyunsaturated fatty acids in cord serum. (c) Selective enrichment of long chain polyunsaturated fatty acids in cord serum. Each circle on the plot represents a lipid species, grey open circles show non-significant lipid species (p > 0.05), white closed circles show significant lipid species (p < 0.05), the top 10 lipid species (10 lowest p-values) are shown in blue circles. Each red diamond represents a lipid class. All p-values were corrected for multiple comparisons. The horizontal bars (error bars) are shown for the significant lipid species (white closed circles), the top 10 lipid species (blue circles), corrected p-value < 5.06 × 10–261, and the lipid classes (red diamonds). The error bars represent 95% confidence intervals. Grey dotted lines separate sphingolipids, phospholipids, and other lipids.
Figure 5 with 2 supplements
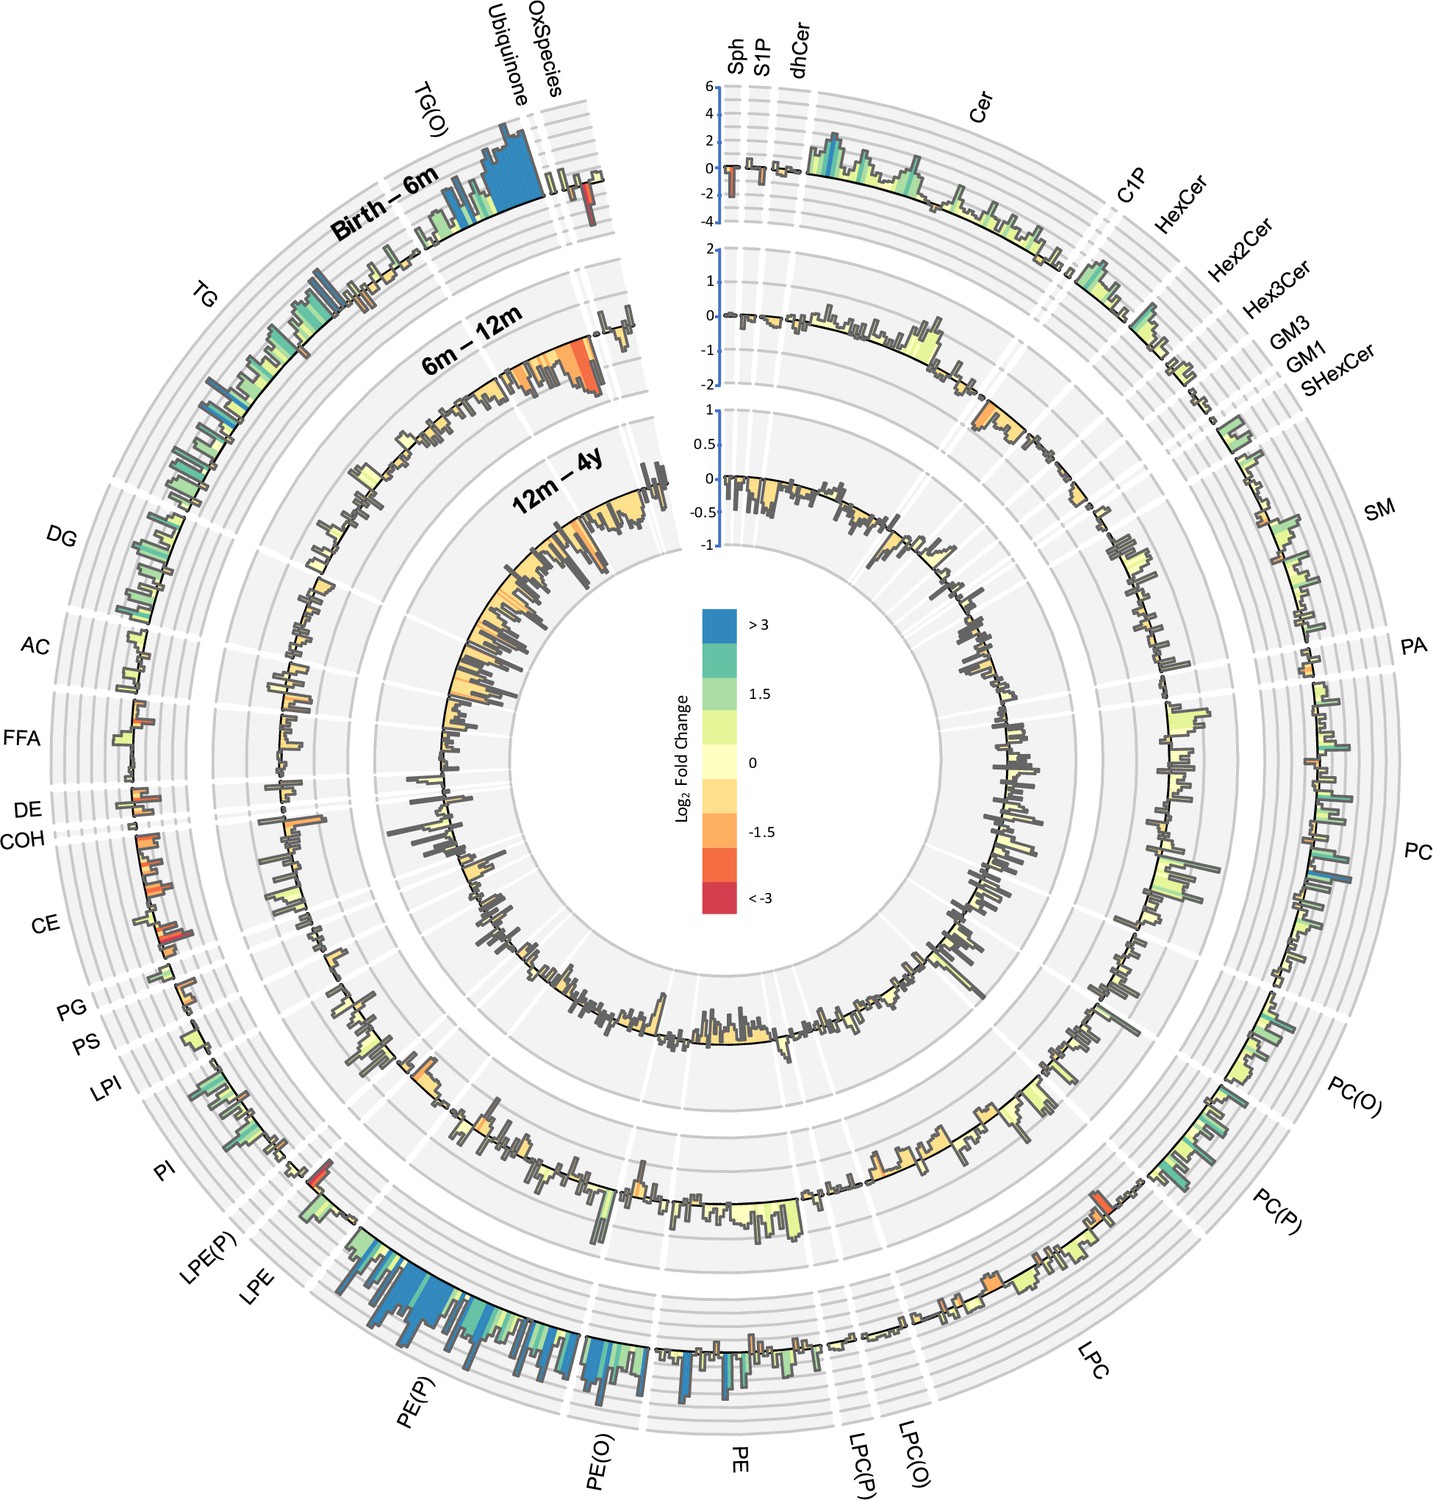
Lipidomic profile changes in the first 4 years.
Paired t-tests were performed in infants with repeat measures (birth to 6 months n = 646, 6–12 months n = 628, 12 months to 4 years n = 418), and results are shown as log2 fold change (FC). The outermost circle represents the changes in lipid concentration from birth to 6 months (axis range: –4 to 6), middle circle represents changes in lipid concentration 6–12 months (axis range: –2 to 2), and the inner most circle represents the changes in lipid concentration from 12 months to 4 years (axis range: –1 to 1).
Figure 5—figure supplement 1
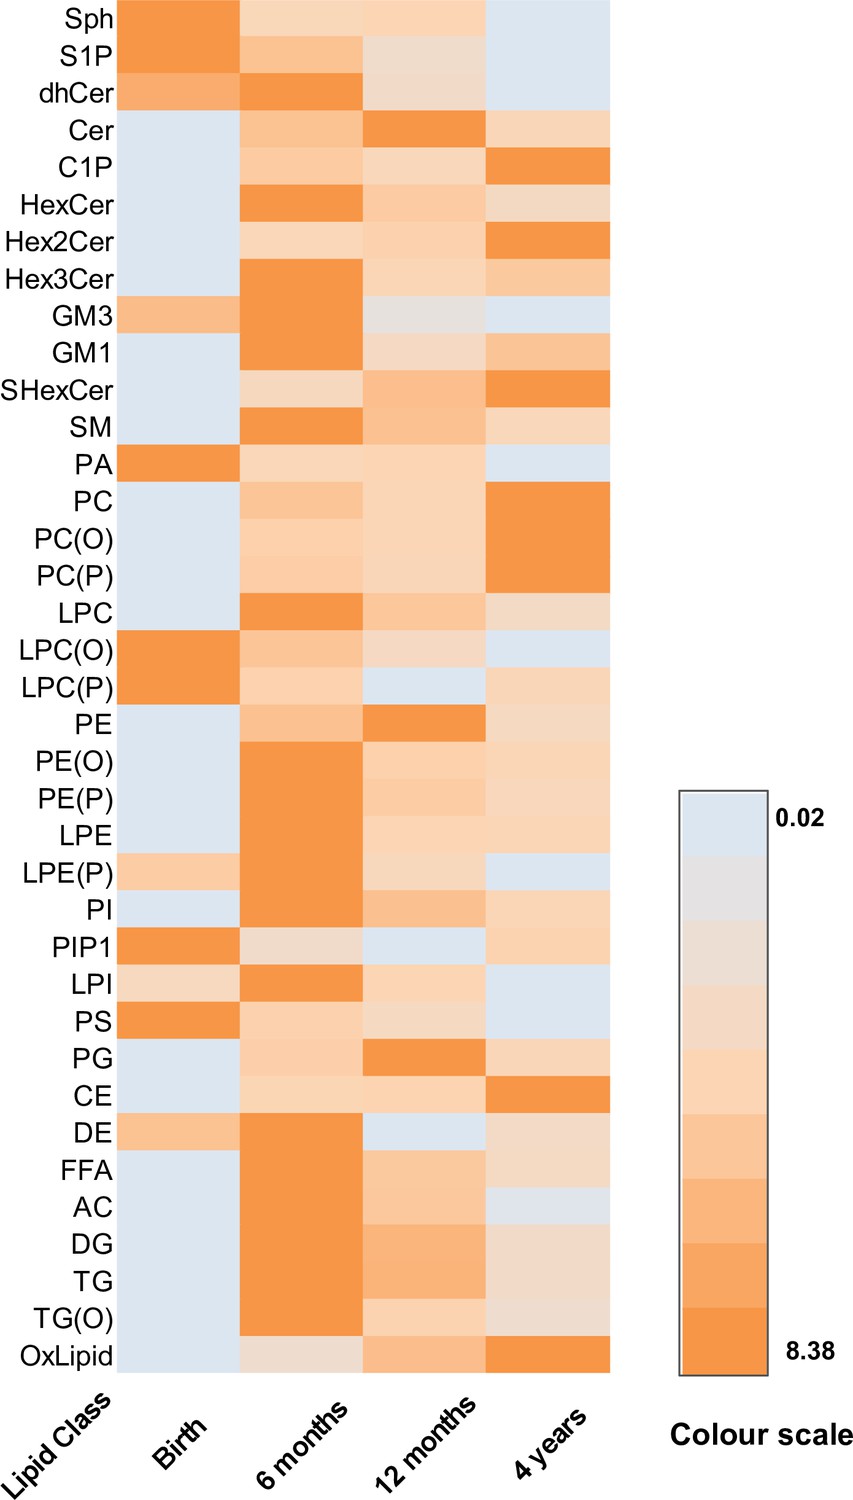
The serum/plasma concentration of lipid classes over time.
A heat map showing the mean concentration of each lipid class at each time point. Orange: highest value, teal: lowest value.
Figure 5—figure supplement 2
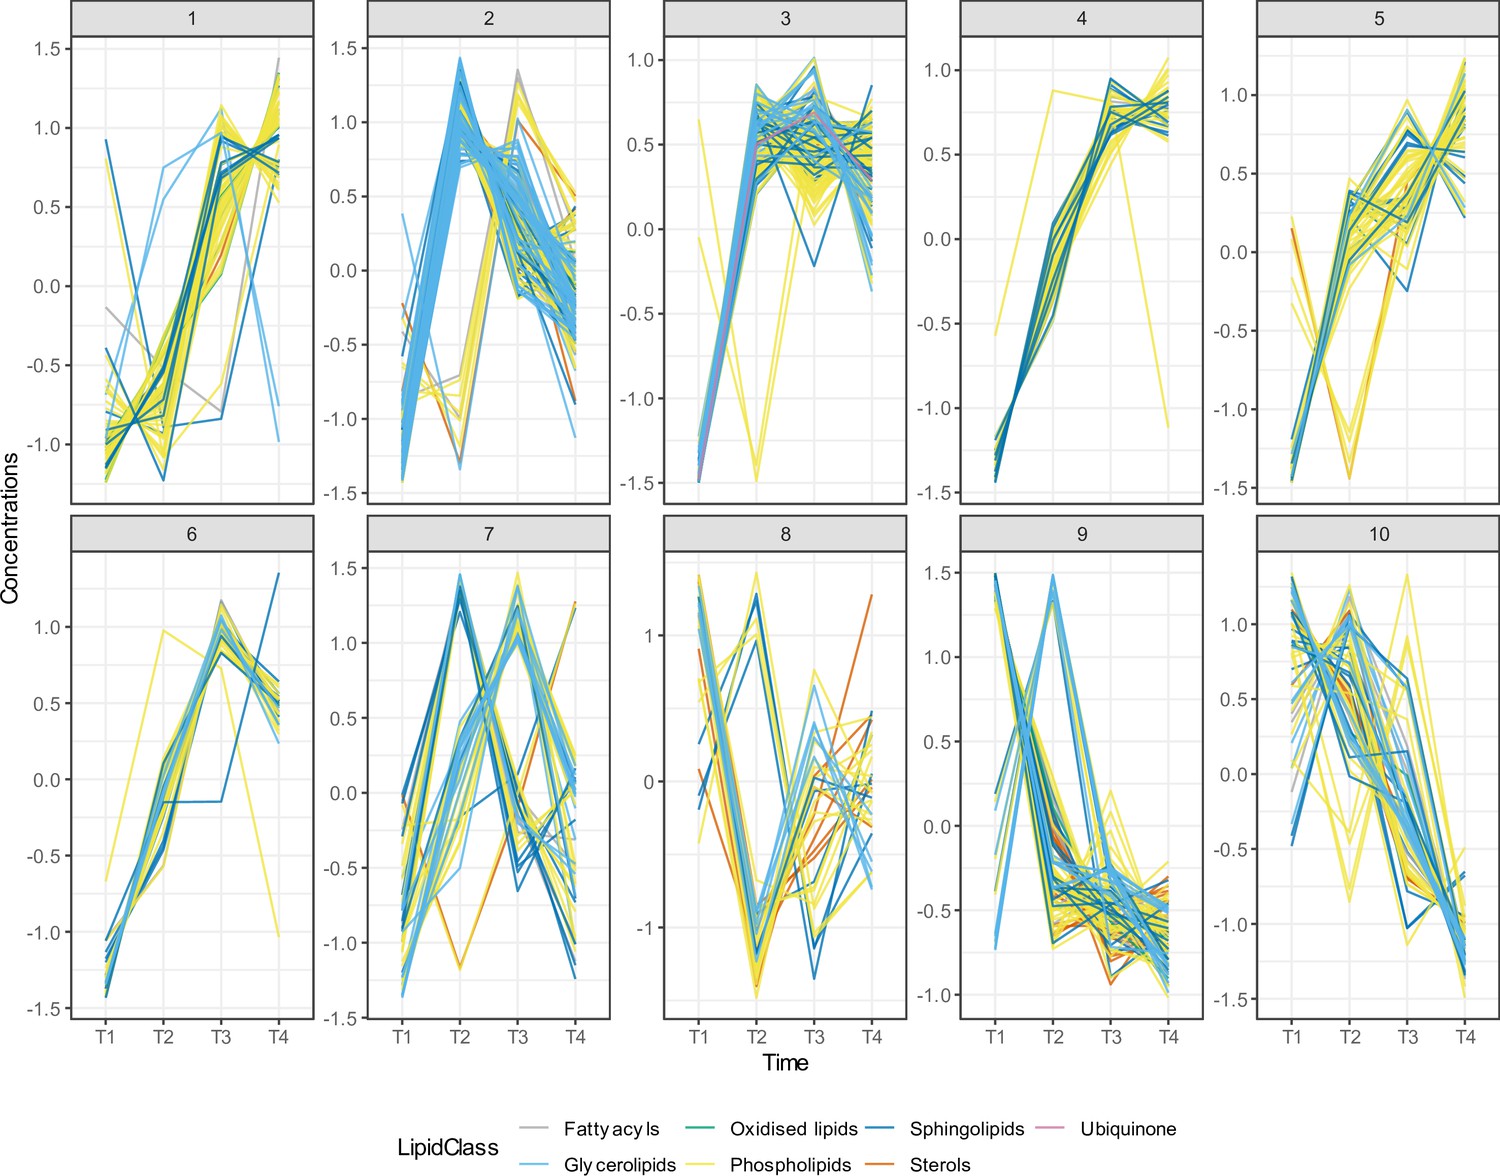
Time series clustering on lipid species identified 10 different lipid clusters.
We utilised dynamic time warping (DTW) distance as a dissimilarity measurement. We used the partitional clustering method with partitions around medoids (PAM) to cluster the lipid species. We identified 10 different lipid clusters, each of them showing unique lipid trajectories over the first 4 years of life. Different lipid categories are shown in different colours.
Figure 6
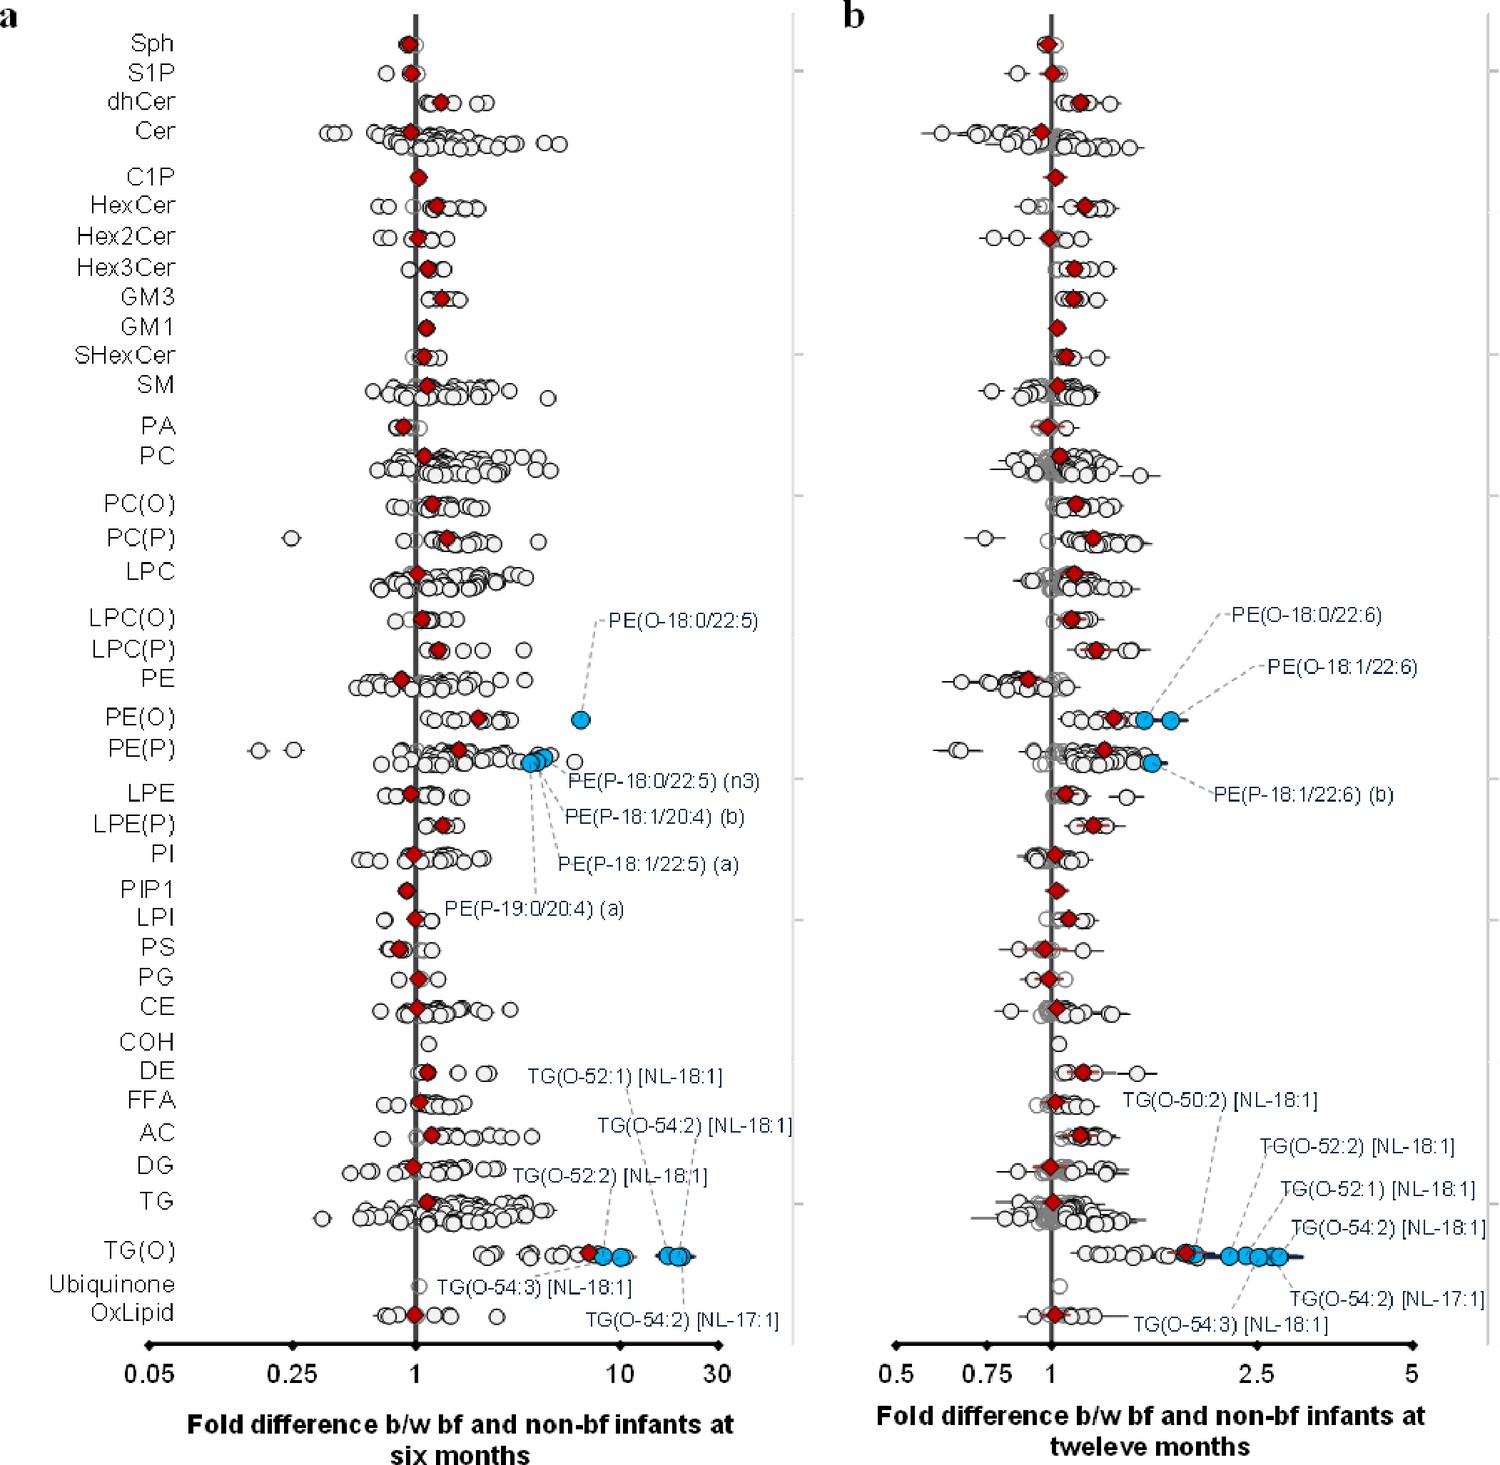
Breastfeeding influences the infant plasma lipidome.
Linear regression of the lipidome on breastfeeding status at 6 and 12 months adjusting for age, sex, birth weight, gestational age (at 6 months), maternal pre-pregnancy BMI, gestational diabetes mellitus (GDM), maternal education, birth order. Results are shown as fold difference in lipids between breastfed and non-breastfed infants. (a) Lipid species associated with breastfeeding at 6 months. (b) Lipid species associated with breastfeeding at 12 months. Each circle on the plot represents a lipid species, grey open circles show non-significant lipid species (p > 0.05), white closed circles show significant lipid species (p < 0.05), the top 10 lipid species (10 lowest p-values) are shown in blue circles. Each red diamond represents a lipid class. All p-values were corrected for multiple comparisons. The horizontal bars (error bars) are shown for the significant lipid species (white closed circles), the top 10 lipid species (blue circles), Corrected p-value < 5.96 × 10–189, 1.04 × 10–38 respectively. The error bars represent 95% confidence intervals.
Additional files
-
Supplementary file 1
Supplemetary data for the analyses.
- https://cdn.elifesciences.org/articles/72779/elife-72779-supp1-v2.xlsx
-
Transparent reporting form
- https://cdn.elifesciences.org/articles/72779/elife-72779-transrepform1-v2.docx
Download links
A two-part list of links to download the article, or parts of the article, in various formats.
Downloads (link to download the article as PDF)
Open citations (links to open the citations from this article in various online reference manager services)
Cite this article (links to download the citations from this article in formats compatible with various reference manager tools)
Ontogeny of circulating lipid metabolism in pregnancy and early childhood – a longitudinal population study
eLife 11:e72779.
https://doi.org/10.7554/eLife.72779


