A B-cell actomyosin arc network couples integrin co-stimulation to mechanical force-dependent immune synapse formation
- Cell and Developmental Biology Center, National Heart, Lung and Blood Institute, National Institutes of Health, United States
- Light Microscopy Core, National Heart, Lung and Blood Institute, National Institutes of Health, United States
- B Cell Molecular Immunology Section, National Institutes of Allergy and Infectious Diseases, National Institutes of Health, United States
Figures
Figure 1 with 1 supplement
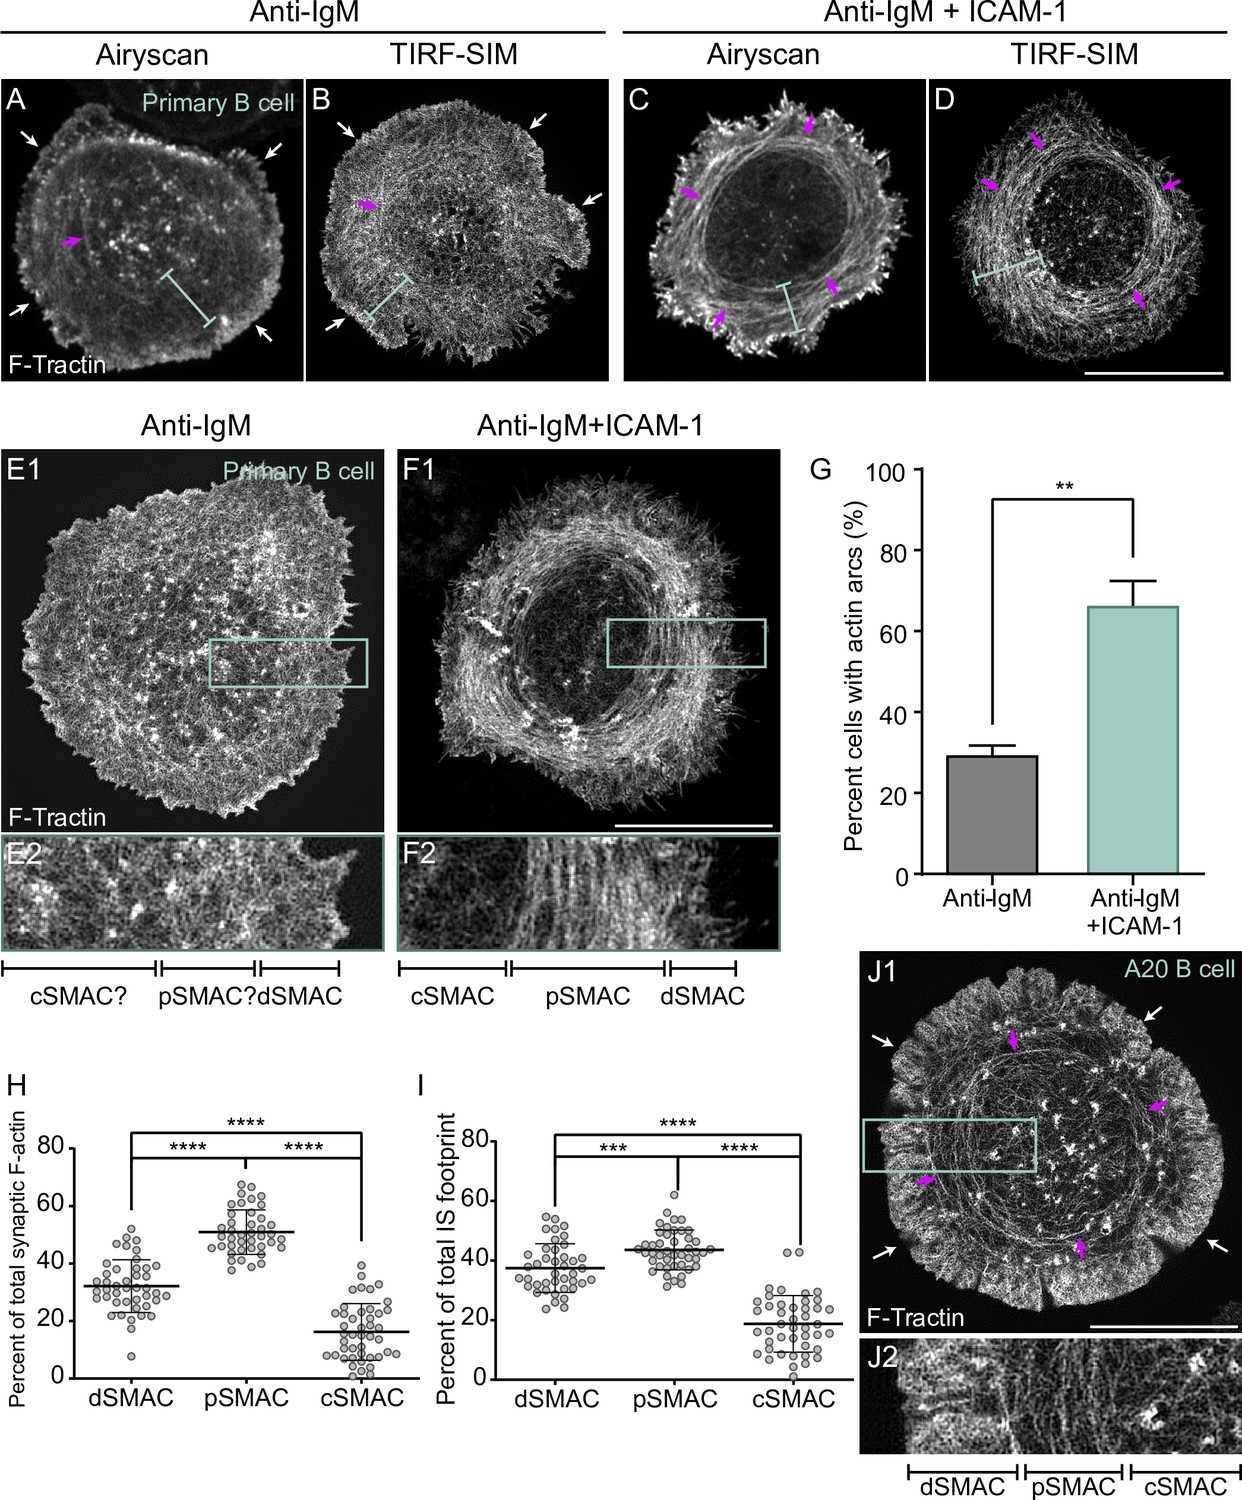
ICAM-1 co-stimulation promotes the formation of actin arcs at the B-cell immune synapse.
(A–F) GFP-F-Tractin-expressing primary B cells on glass coated with anti-IgM alone (A, B, E1, E2) or with anti-IgM + ICAM-1 (C, D, F1, F2) and imaged using Airyscan (A, C) or TIRF-SIM (B, D, E1, E2, F1, F2). The white arrows in (A) and (B) indicate the thin outer rim of dendritic actin in the dSMAC. The blue bars in (A–D) indicate the pSMAC. (E2) and (F2) correspond to the boxed regions in (E1) and (F1), respectively. Of note, the cell shown in (E1/E2) is representative of ~70% of anti-IgM-stimulated cells, while the cell shown in (F1/F2) is representative of ~70% of anti-IgM + ICAM-1-stimulated cells. (G) Percent of cells with pSMAC actin arcs (N > 67 cells/condition from three experiments). (H, I) Percent of total synaptic F-actin (H) and percent of total IS footprint (I) contained within the dSMAC, pSMAC, and cSMAC portions of the synapse for primary B cells on anti-IgG/ICAM-1-coated glass (N = 44 cells/condition from six experiments). (J1, J2) GFP-F-Tractin-expressing A20 B cell on anti-IgG/ICAM-1-coated glass. (J2) corresponds to the boxed region in (J1). The magenta arrows in (A–D) and (J1) indicate actin arcs. Scale bars: 10 µm.
Figure 1—figure supplement 1
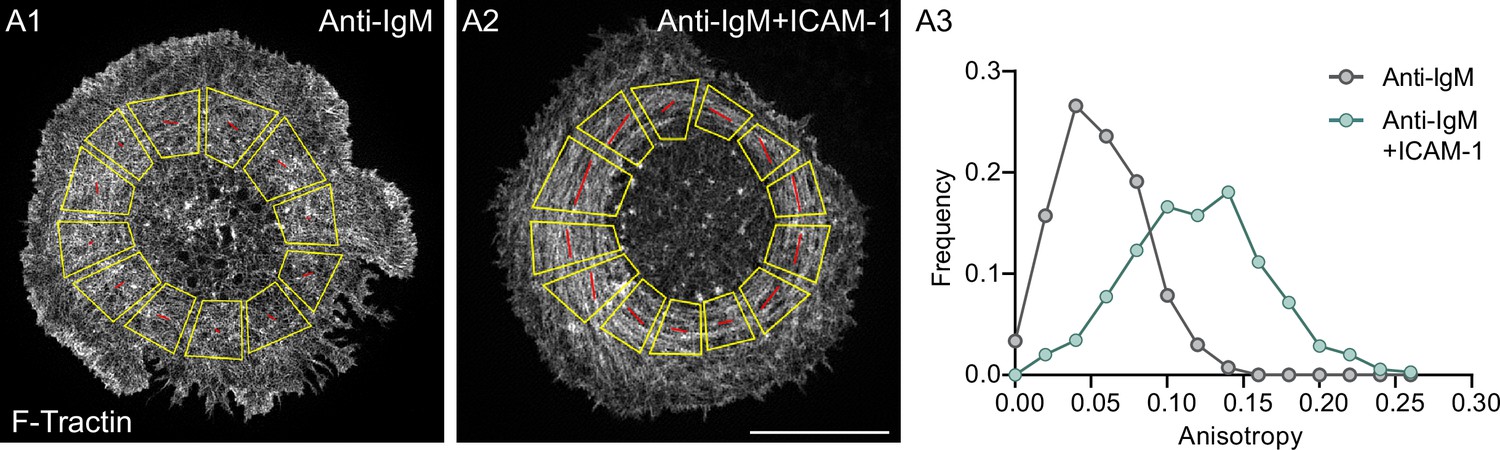
Degree of alignment between the actin filaments in the pSMAC of B cells stimulated with anti-IgM alone versus anti-IgM and ICAM-1.
(A1, A2) Shown are examples of how FibrilTool (Boudaoud et al., 2014) was used to measure pSMAC actin arc anisotropy by dividing the radially symmetric pSMAC into 10–12 trapezoid-shaped regions of interest (ROIs) of similar size so as to ‘linearize’ it (A1, stimulated with anti-IgM alone; A2, stimulated with anti-IgM and ICAM-1) (see also Murugesan et al., 2016). FibrilTool measures how well structures of interest (here actin filaments) within a given ROI (here the pSMAC) are arranged in parallel. Anisotropy values range from 0 when the orientation of the structures is completely random to 1.0 when all of the structures are perfectly aligned/parallel to each other. The red lines indicate the average orientation of actin in the ROI. Scale bar: 10 µm. All panels: TIRF-SIM. (A3) Frequency of measured anisotropy values. N = 267–358 ROIs from 22 to 23 cells from three experiments.
Figure 2 with 2 supplements
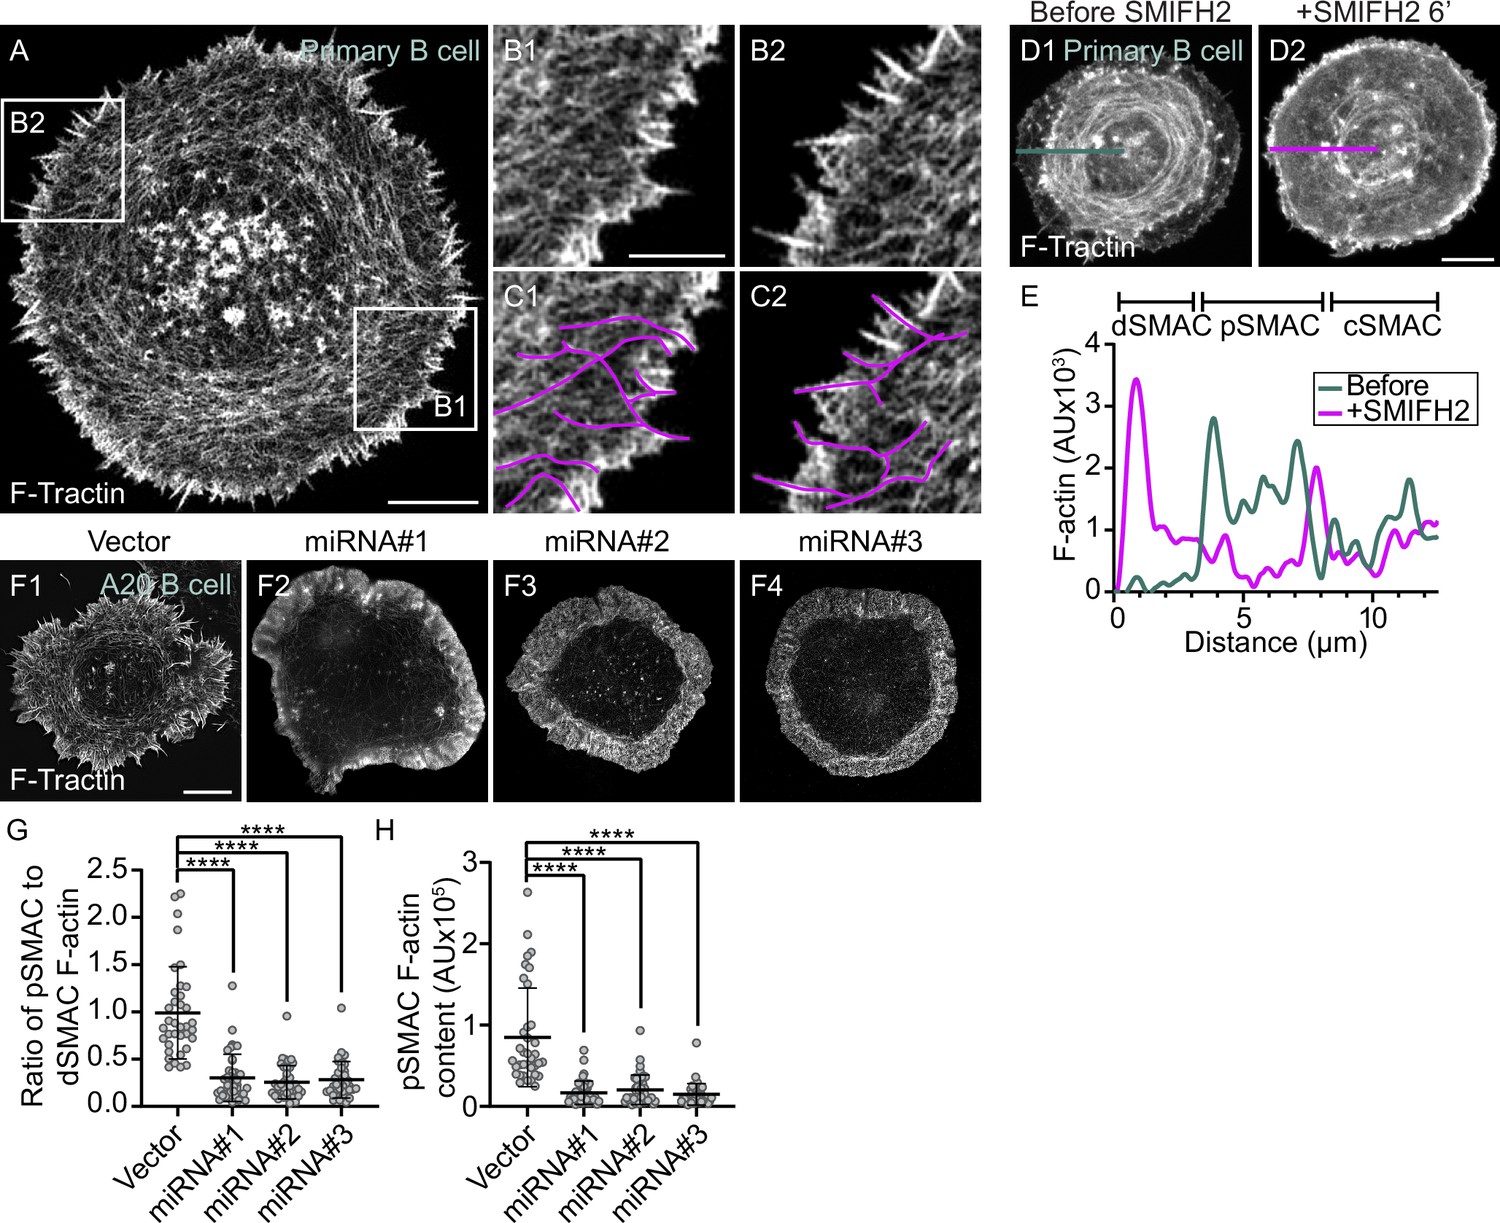
The actin arcs are created by the formin mDia1 acting at the outer edge of the immune synapse.
(A) GFP-F-Tractin-expressing primary B cell on anti-IgG/ICAM-1-coated glass. (B1, B2) Boxed regions in (A). (C1, C2) B1 and B2 with magenta lines applied to highlight linear actin filaments/bundles arising from surface spikes at the IS edge that are contiguous with actin arcs in the pSMAC. (D1, D2) GFP-F-Tractin-expressing primary B cell on anti-IgG/ICAM-1-coated glass before (D1) and 6 min after SMIFH2 addition (D2). (E) F-actin intensity profiles corresponding to the line scans in (D1) (blue, before SMIFH2 addition) and (D2) (magenta, after SMIFH2 addition). (F1–F4) F-Tractin mNeonGreen-expressing A20 B cells transfected with vector only or the indicated mDia1 miRNA constructs and activated on anti-IgG/ICAM-1-coated glass. (G) Ratio of pSMAC to dSMAC F-actin (N > 20 cells/condition from two experiments). (H) pSMAC F-actin content (N = 20–26 cells/condition from two experiments). (A–C, F) TIRF-SIM images; (D) Airyscan images. Scale bars: 5 µm in (A, D2, F1); 2 µm in (B1).
Figure 2—figure supplement 1
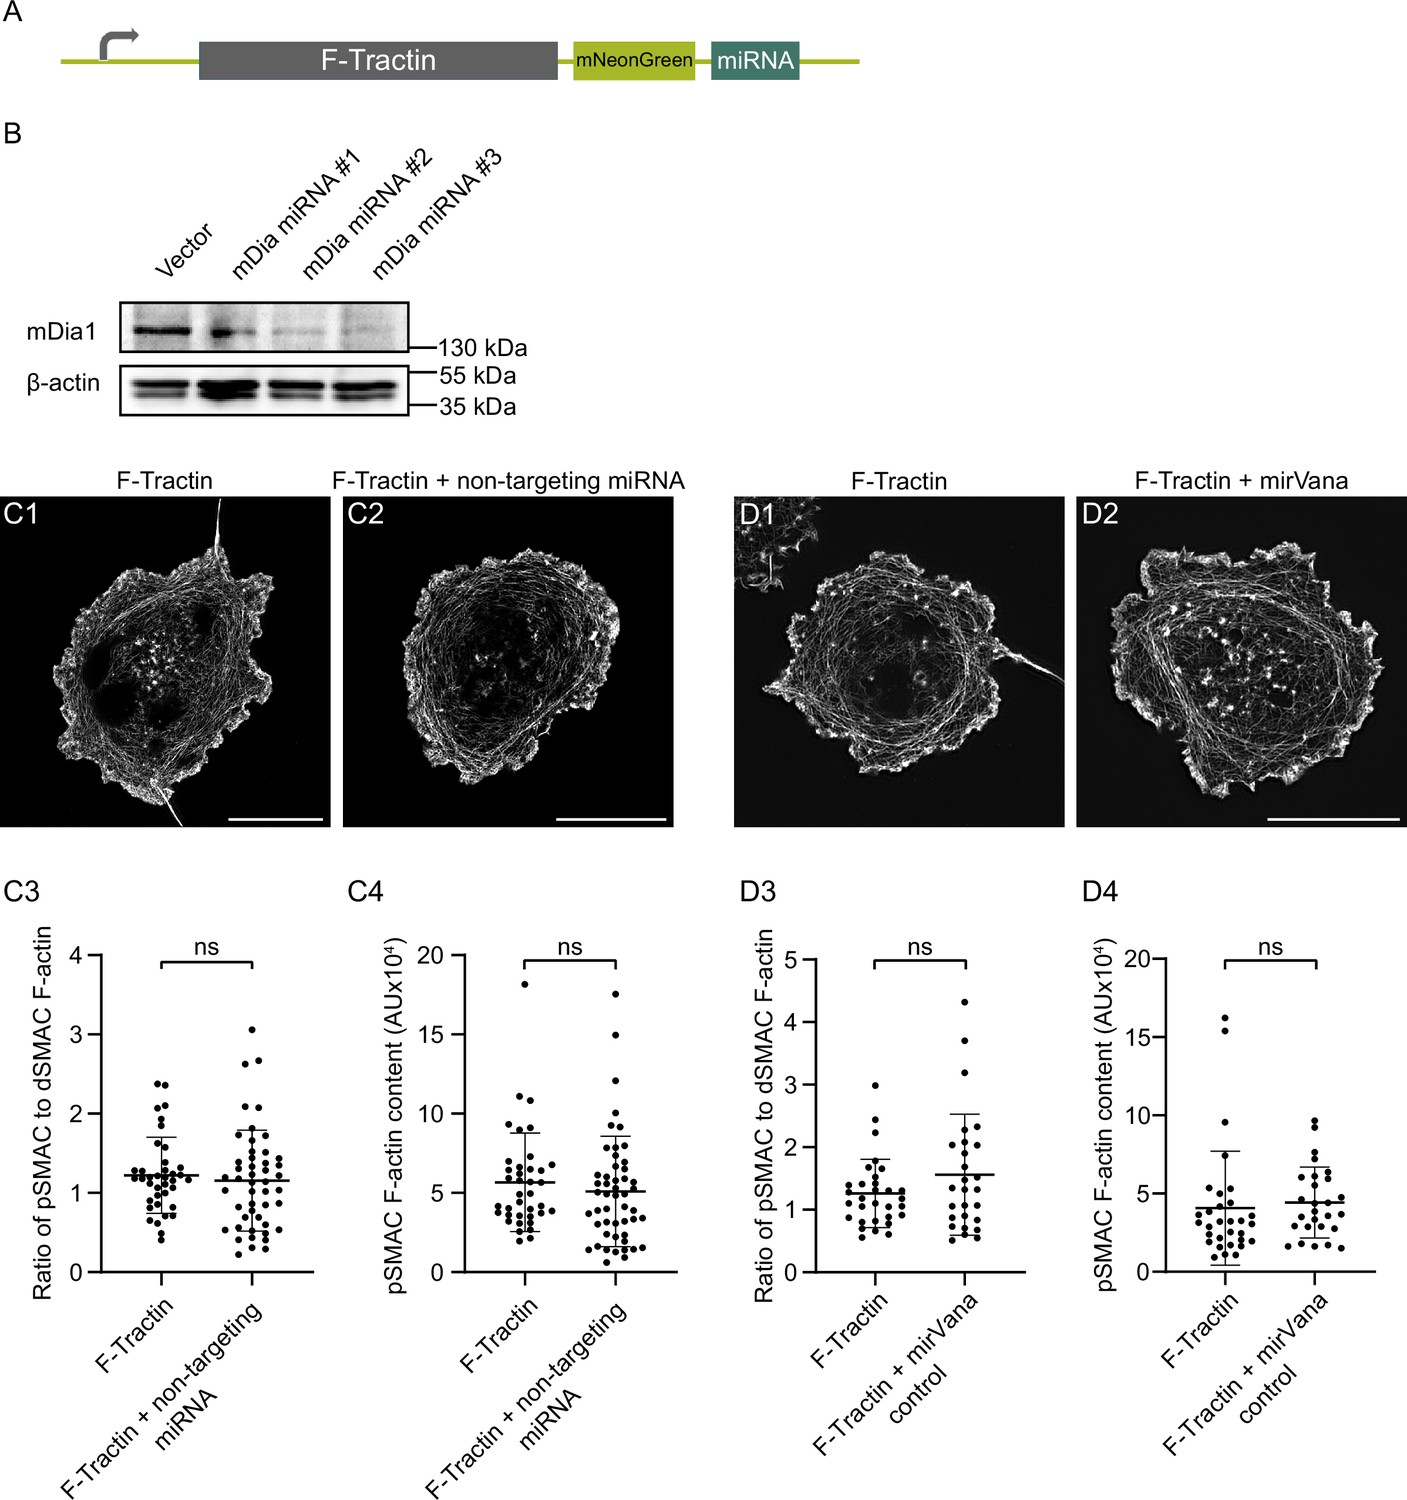
miRNA-mediated knockdown (KD) of mouse mDia1 in A20 B cells.
(A) Diagram of the plasmid in which mDia1 miRNA sequences are C-terminal to F-Tractin mNeonGreen. The target sequences used to generate the three mDia1 miRNA KD plasmids are indicated in Appendix 1. Positive transfectants were identified based on the expression of F-Tractin-mNeonGreen and used in subsequent quantitative analyses. (B) Immunoblot of the entire population of A20 B cells that had undergone AMAXA nucleofection with either the F-Tractin-mNeonGreen vector control or with the indicated mDia1 miRNA plasmids. Of note, while the lysates used for immunoblotting were made from samples containing both positive and negative transfectants, only positive transfectants (i.e., mNeonGreen-positive cells) were used for the quantitation presented in Figure 2. (C1, C2) Representative F-actin images show F-Tractin mNeonGreen-expressing A20 B cells transfected with vector only (C1) or with a non-targeting miRNA (C2) and activated on anti-IgG/ICAM-1-coated glass. (C3) Ratio of pSMAC to dSMAC F-actin (N > 38 cells/condition from two experiments). (C4) pSMAC F-actin content (N > 38 cells/condition from two experiments). (D1, D2) Representative F-actin images show F-Tractin-expressing A20 B cells transfected with vector only (D1) or with a non-targeting mirVana-negative control (D2) and activated on anti-IgG/ICAM-1-coated glass. (D3) Ratio of pSMAC to dSMAC F-actin (N > 27 cells/condition from two experiments). (D4) pSMAC F-actin content (N > 27 cells/condition from two experiments). Scale bars: 10 µm in (C1, C2, D2).
-
Figure 2—figure supplement 1—source data 1
Western blots of miRNA-mediated knockdown (KD) of mouse mDia1 in A20 B cells.
(A) Entire immunoblot using rabbit anti-mDia1 followed by goat anti-rabbit-HRP secondary. (B) Entire immunoblot using mouse anti-β-actin-HRP. (C) Blot showing the molecular weight ladder Thermo Fisher Page Ruler Plus. Arrows indicate the relevant bands.
- https://cdn.elifesciences.org/articles/72805/elife-72805-fig2-figsupp1-data1-v2.zip
Figure 2—figure supplement 2
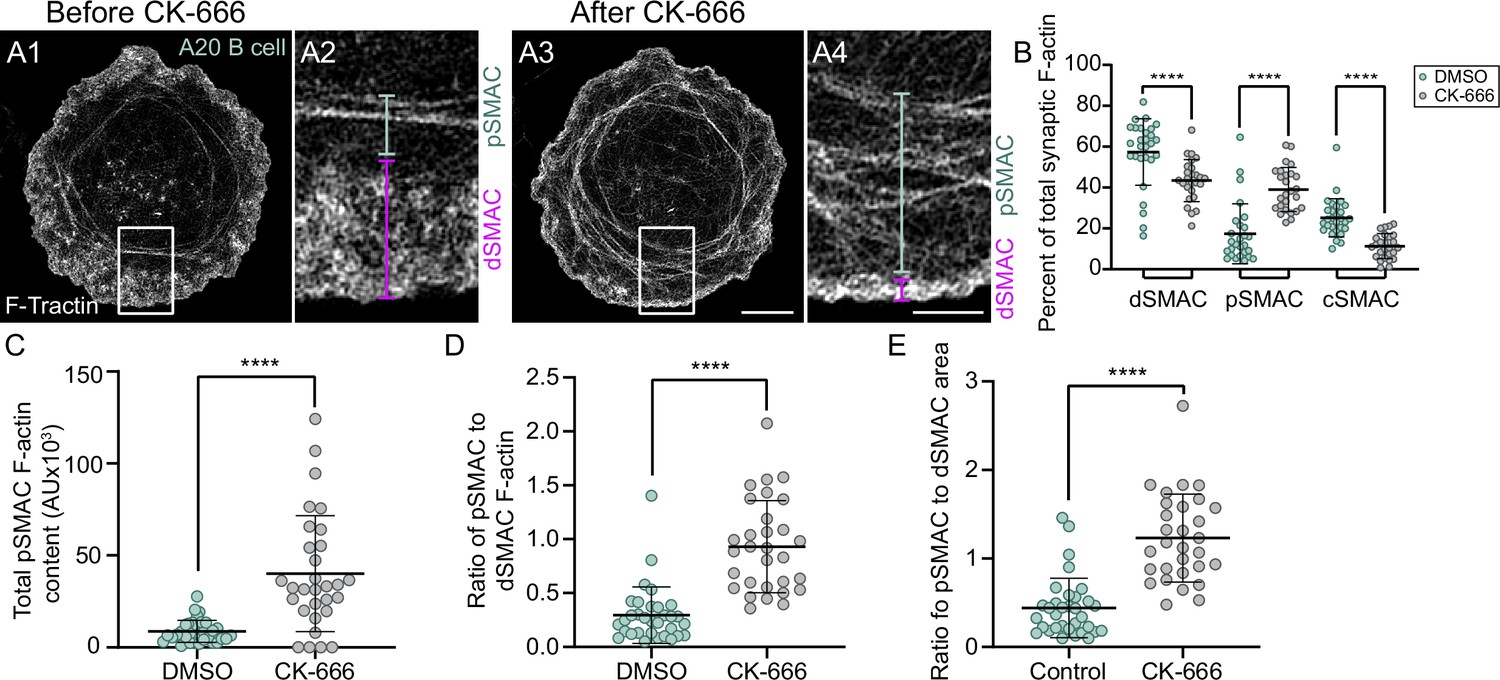
Arp2/3 inhibition shifts the balance between the dSMAC branched actin network and the pSMAC actin arc network.
(A1–A4) TIRF-SIM images of GFP-F-Tractin-expressing A20 cells on anti-IgG/ICAM-1-coated glass before (A1, A2) and 5 min after CK-666 addition (A3, A4). (A2) and (A4) correspond to the boxed regions in (A1) and (A3), respectively. The magenta and blue bars in (A2) and (A4) correspond to the dSMAC and pSMAC portions of the synapse, respectively. (B–E) Percent of total synaptic F-actin within each SMAC (B), total pSMAC F-actin content (C), ratio of pSMAC to dSMAC F-actin (D), and ratio of pSMAC to dSMAC area (E) for DMSO-treated and CK-666-treated A20 B cells (N > 30 cells/condition from three experiments). Scale bar: 2 µm in (A4).
Figure 3 with 2 supplements
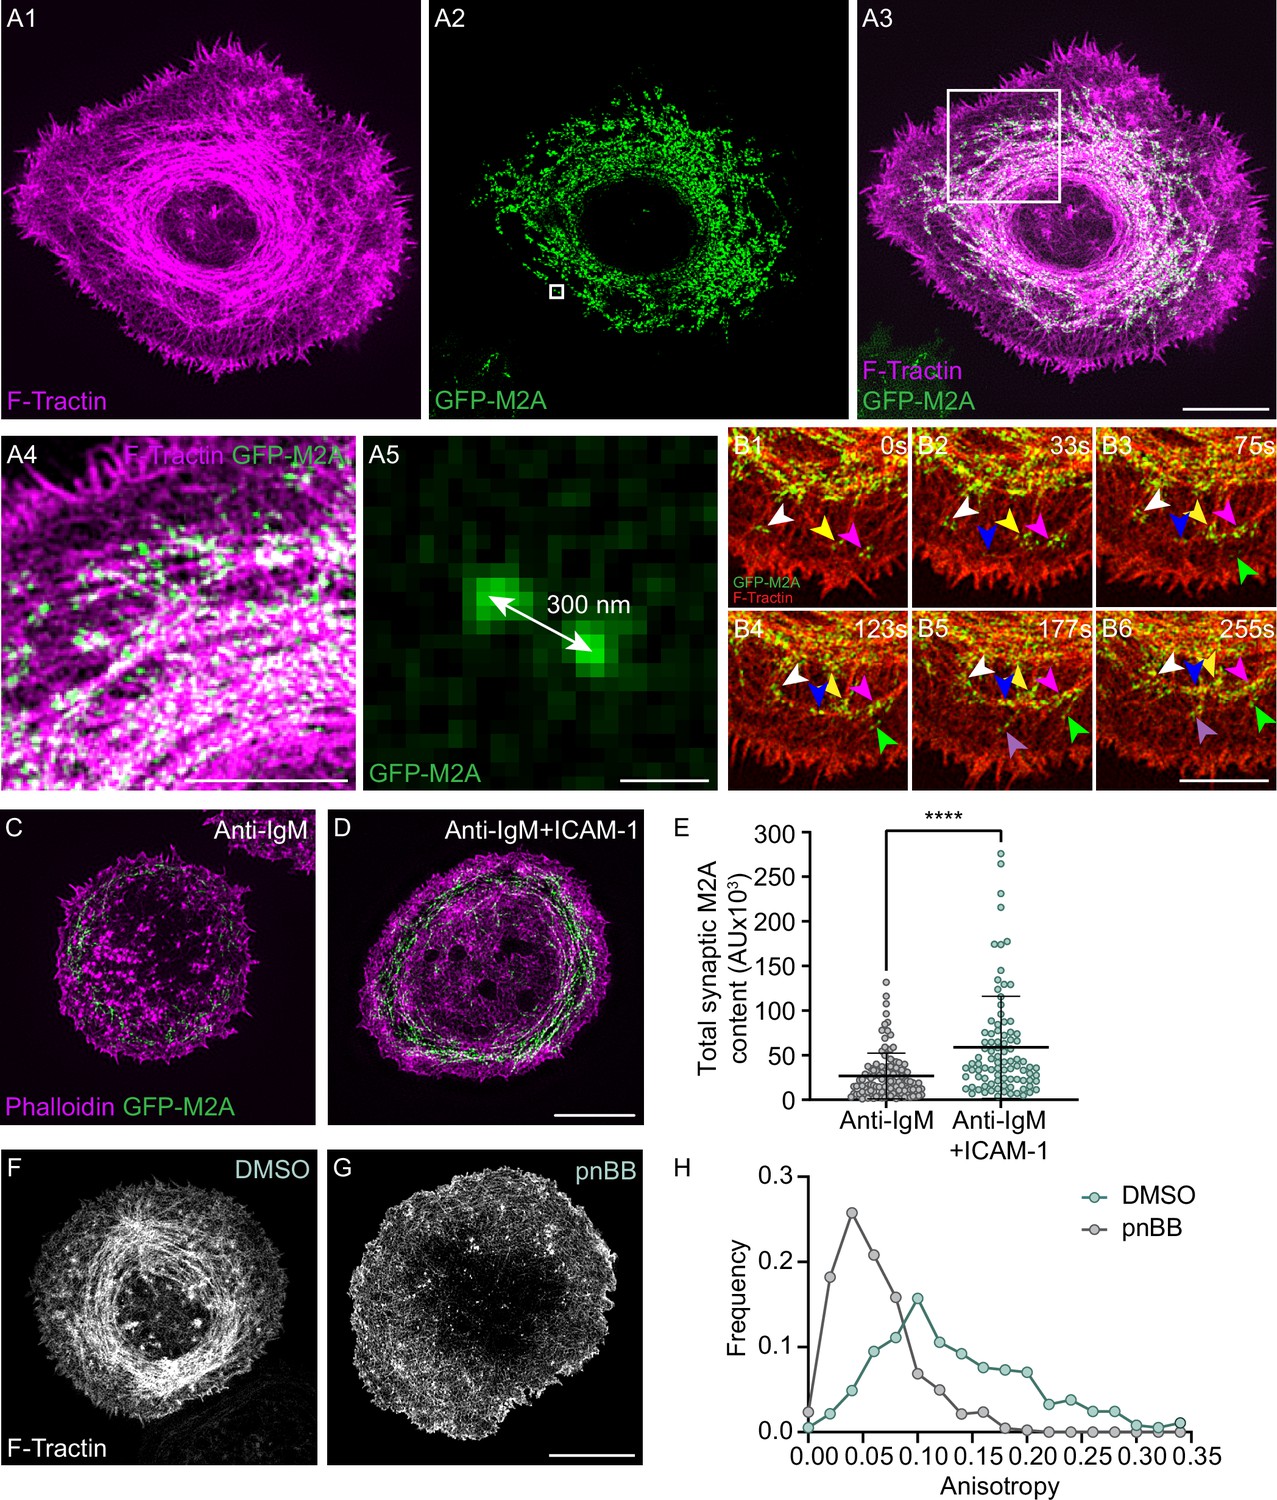
Myosin 2A decorates the actin arcs and is required for their concentric organization.
(A1–A5) Td-Tomato-F-Tractin-expressing primary B cell from the M2A-GFP knockin mouse on anti-IgM/ICAM-1-coated glass. (A4) and (A5) correspond to the boxed regions in (A1) and (A2), respectively. (B1–B6) Still images at the indicated time points taken from a region within Video 7 of a Td-Tomato-F-Tractin-expressing primary B cell from the M2A-GFP knockin mouse. Different color arrowheads mark the formation and centripetal movement of individual M2A bipolar filaments (see text for details). (C, D) Phalloidin-stained primary B cell from the M2A-GFP knockin mouse on glass coated with anti-IgM alone (C) or with anti-IgM + ICAM-1 (D). (E) Total synaptic M2A content (N = 91–115 cells/condition from three experiments). (F, G) GFP-F-Tractin-expressing primary B cells that had been pretreated with DMSO (F) or pnBB (G) for 30 min and activated on anti-IgM/ICAM-1-coated glass. (H) Anisotropy of the actin filaments/bundles present within the pSMAC (N = 369–423 regions of interest [ROIs] from 30 to 37 cells from three experiments). All panels: TIRF-SIM images. Scale bars: 5 µm in (A3, D, G); 3 µm in (A4, B6); 250 nm in (A5).
Figure 3—figure supplement 1
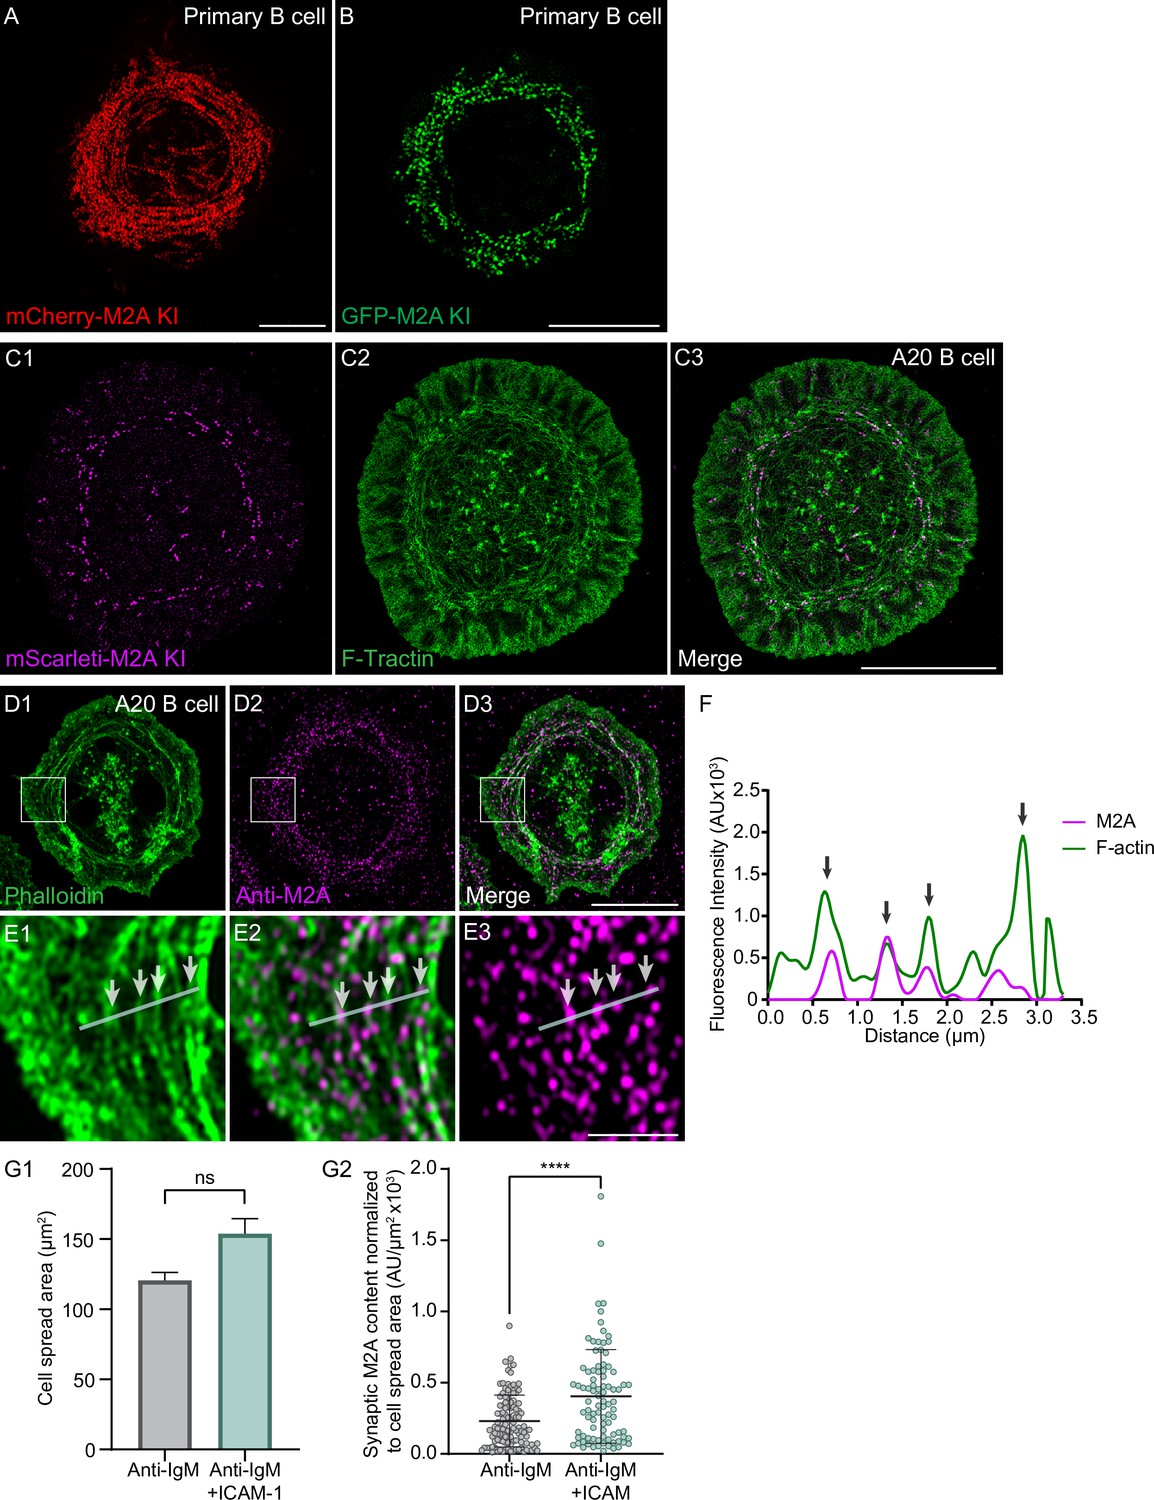
Endogenous M2A decorates the actin arcs in both primary B cells and A20 B cells.
(A) Primary B cell isolated from an mCherry-M2A KI mouse. (B) Primary B cell in which GFP was knocked in at the N-terminus of the M2A heavy chain using ex vivo CRISPR. (C1–C3) GFP-F-Tractin-expressing A20 B cell in which mScarleti was knocked in at the N-terminus of M2A heavy chain using CRISPR. (D1–D3) A20 B cell that was stained with phalloidin and an antibody to the C-terminus of myosin 2A. (E1–E3) Enlargements of the boxed regions in (D1–D3). The position of the line scan used to generate the intensity profile in (F) is shown in white. The white arrows mark the positions in the image that are marked by the black arrows in (F). (F) Fluorescence intensity profile for endogenous M2A and F-actin across the line scan shown in (E1–E3). The black arrows point to regions of marked overlap between the signals for endogenous M2A and actin arcs. (G1, G2) Shown is the cell spread area (G1) and the synaptic content of M2A normalized for cell spread area (G2) for primary B cells isolated from the GFP-M2A KI mouse (N = 91–115 cells/condition from three experiments). (A, B, C1–C3, H) TIRF-SIM images. (D1–D3) Airyscan images. All of the cells shown or quantified in (A–H) were activated on glass coated with anti-IgM and ICAM-1. Scale bars: 5 µm in (A, B, C3); 10 µm in (D3, H); 2 µm in (E3).
Figure 3—figure supplement 2
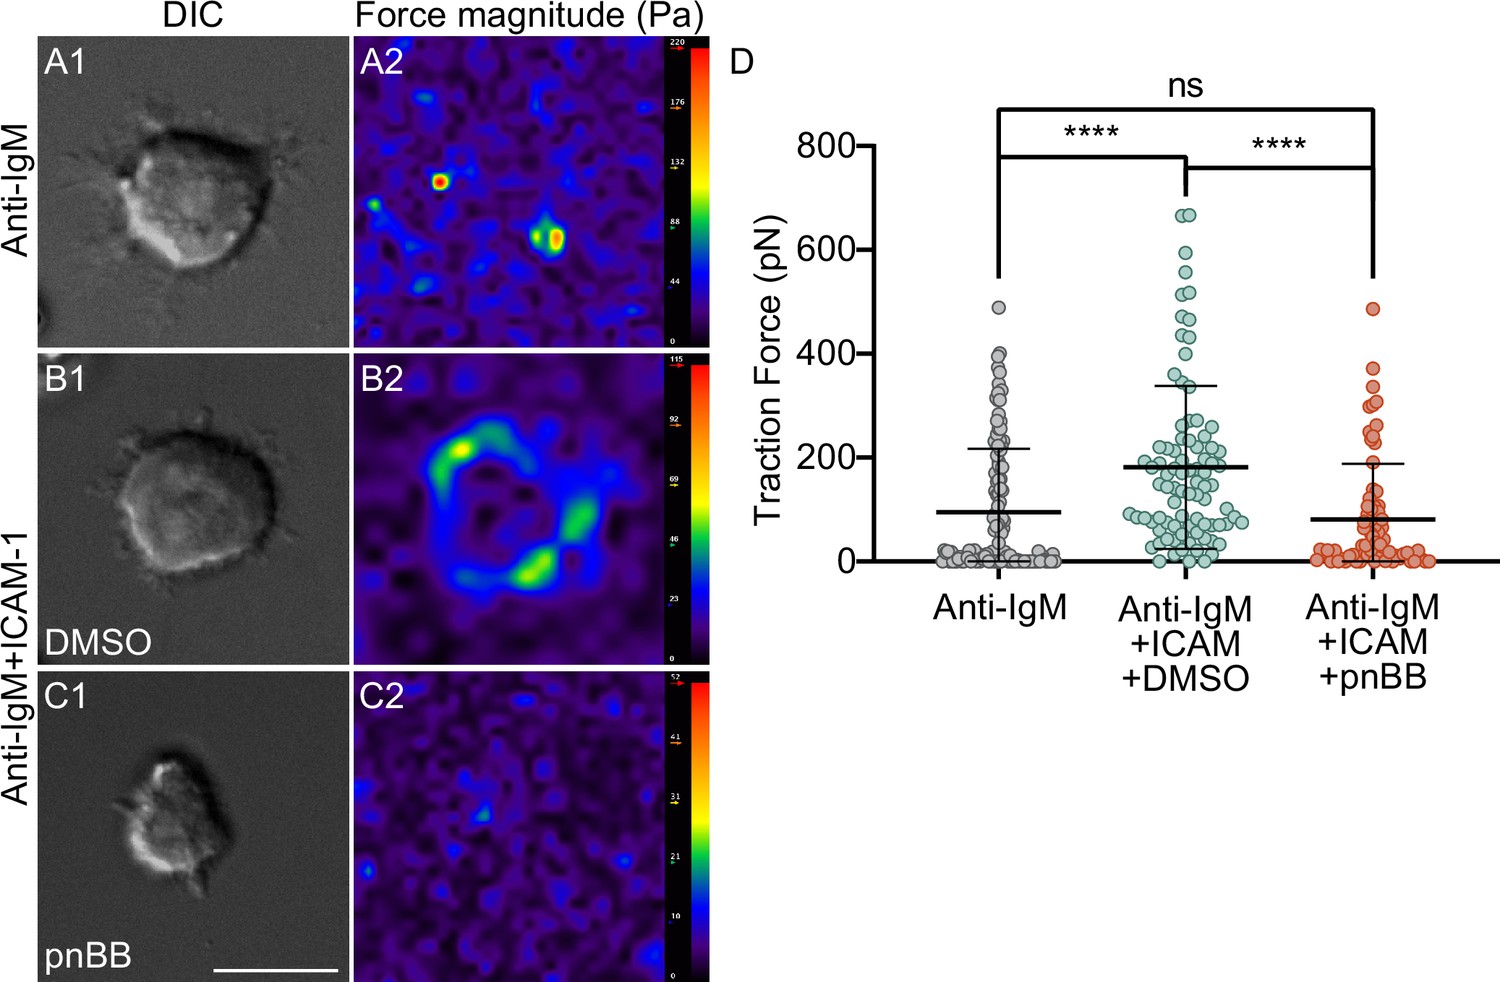
Integrin-dependent traction forces exerted by primary B cells require M2A contractility.
(A1, A2) Representative primary B cell engaged with a PAA gel coated with anti-IgM (A1) and its force magnitude plot (A2). (B1, B2) Representative, DMSO-treated primary B cell engaged with a PAA gel coated with anti-IgM and ICAM-1 (B1) and its force magnitude plot (B2). (C1, C2) Representative, pnBB-treated primary B cell engaged with a PAA gel coated with anti-IgM and ICAM-1 (C1) and its force magnitude plot (C2). (D) Traction forces exerted by B cells under these three conditions (N = 72–121 cells/per condition from three experiments). Scale bar: 10 µm.
Figure 4 with 1 supplement
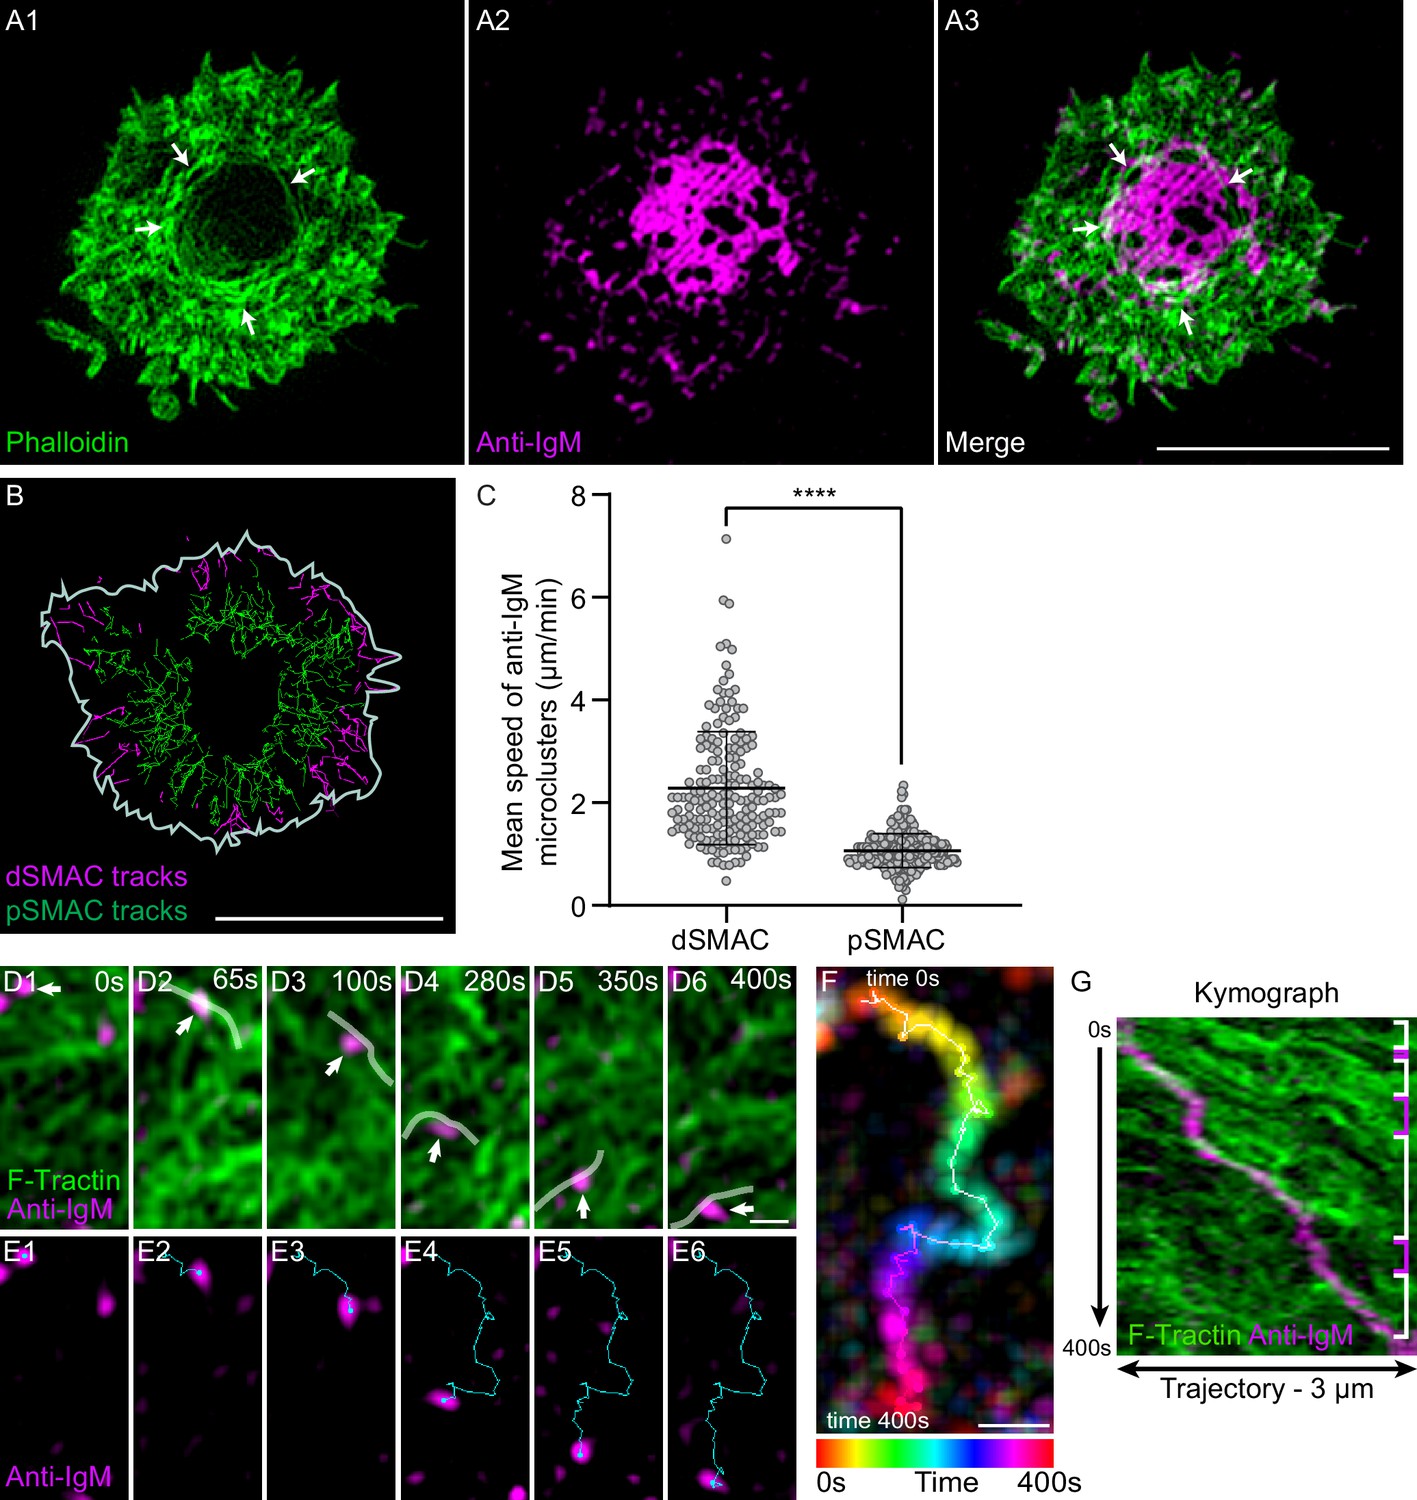
Actin arcs sweep antigen clusters centripetally.
(A1–A3) Phalloidin-stained (green) primary B cell 15 min after engagement with a PLB containing unlabeled ICAM-1 and limiting anti-IgM (magenta). The white arrows in (A1) and (A3) mark the actin arcs. (B) Tracks of single anti-IgM microclusters traveling centripetally across the dSMAC (magenta tracks) and pSMAC (green tracks) acquired from Video 9. The white line indicates the outer edge of this cell. (C) Mean speed of single anti-IgM microclusters moving centripetally across the dSMAC and pSMAC (N = 180–273 tracks from three well-spread cells). (D1–D6) Still images at the indicated time points from Video 10 showing the centripetal movement of actin arcs and a representative anti-IgM microcluster (white arrows) (the center of the synapse is directly below the images). Transparent white lines highlight the actin arcs that moved the microcluster centripetally. (E1–E6) Same as (D1–D6) except showing only the anti-IgM microcluster and indicating its centripetal path in blue. (F) Temporally pseudo-colored, projected image of the anti-IgM microcluster in (D) and (E). (G) Kymograph of the 3-µm-long paths taken by the microcluster and the actin arcs in (D) and (E) over a period of 400 s. The white brackets on the right indicate where actin arcs overlapped with and moved the microcluster, while the magenta brackets indicate where the movement of the microcluster stalled. (A) Airyscan images; (D–G) TIRF-SIM images. Scale bars: 5 µm in (A3, B); 300 nm in (D6, F).
Figure 4—figure supplement 1
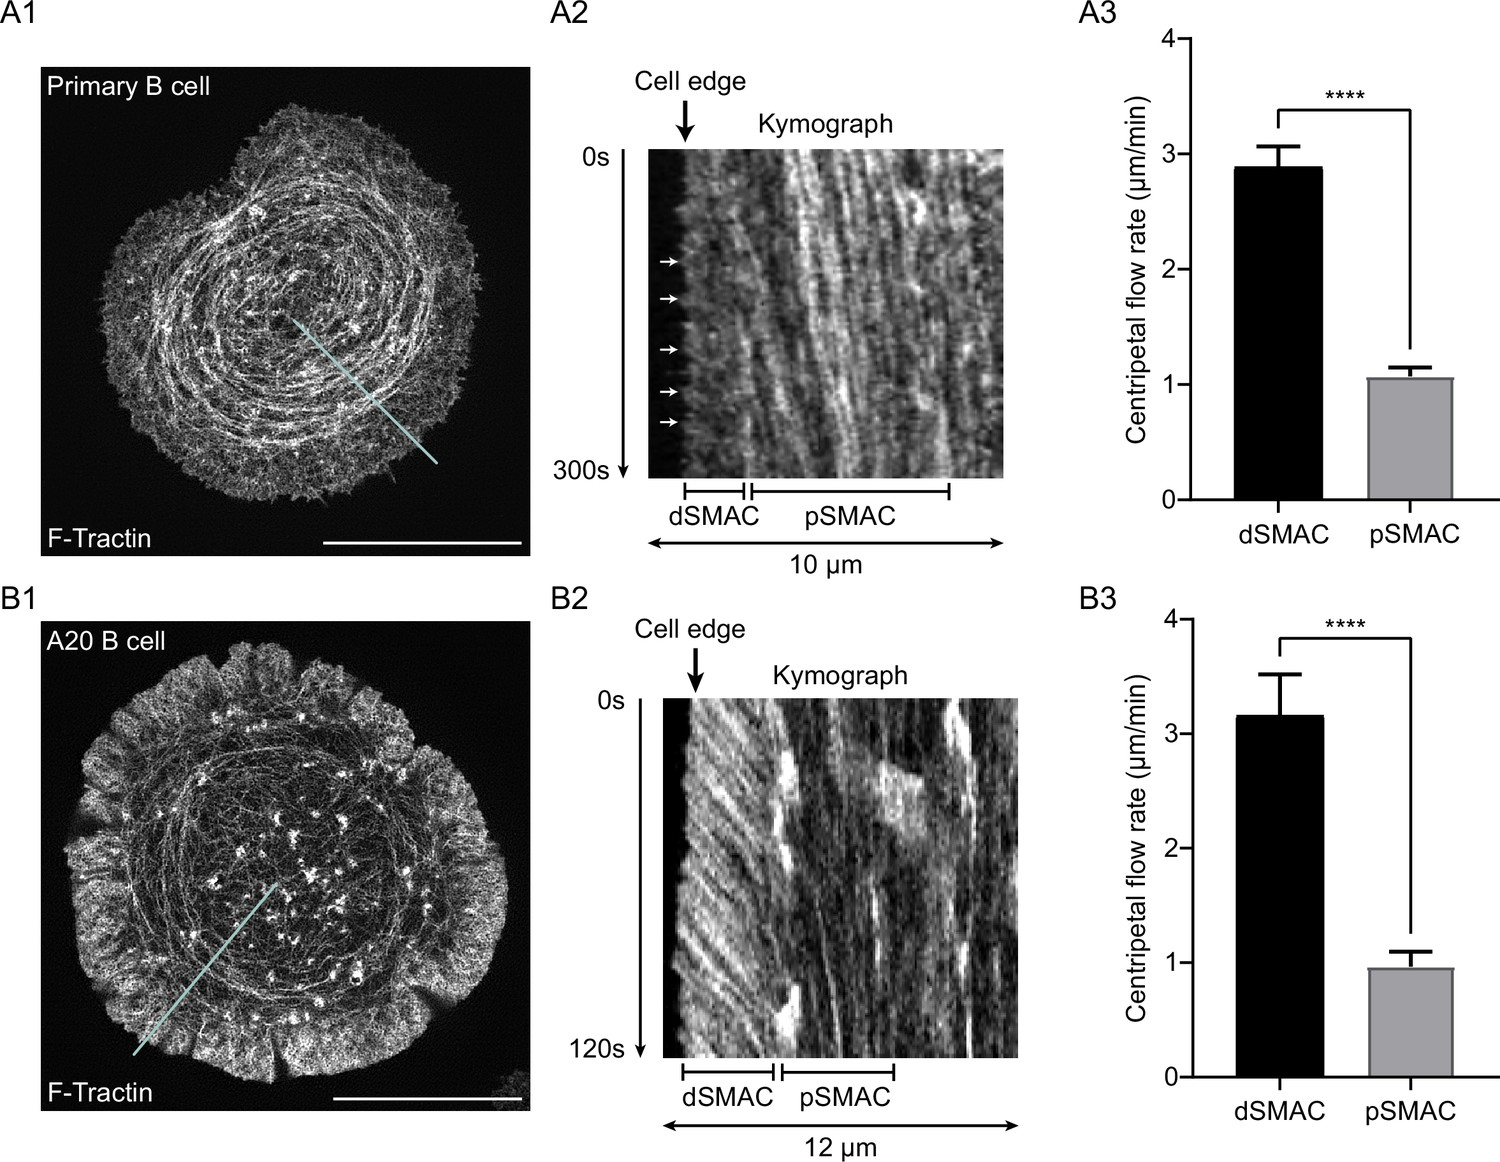
Centripetal actin flow rates across the dSMAC and pSMAC portions of synapses made by primary B cells and A20 B cells.
(A1–A3) Shown is a representative, GFP-F-Tractin-expressing primary B cell (A1), a kymograph showing the centripetal flow of F-actin in the dSMAC and pSMAC portions of this cell’s synapse over 300 s (A2; reconstructed from the blue line in A1; the white arrowheads mark several of the faint diagonals within the dSMAC used to calculate its flow rate), and the average rates of centripetal F-actin actin flow in the dSMAC and pSMAC (A3; approximately seven measurements per cell for each SMAC from 21 cells over three experiments, presented as standard error of the means). (B1–B3) Same as (A1–A3) except using A20 B cells (N = 14 cells from three experiments). In every case, the cells were activated using glass coated with anti-Igs and ICAM-1. All panels:TIRF-SIM. Scale bars: 10 µm.
Figure 5 with 2 supplements
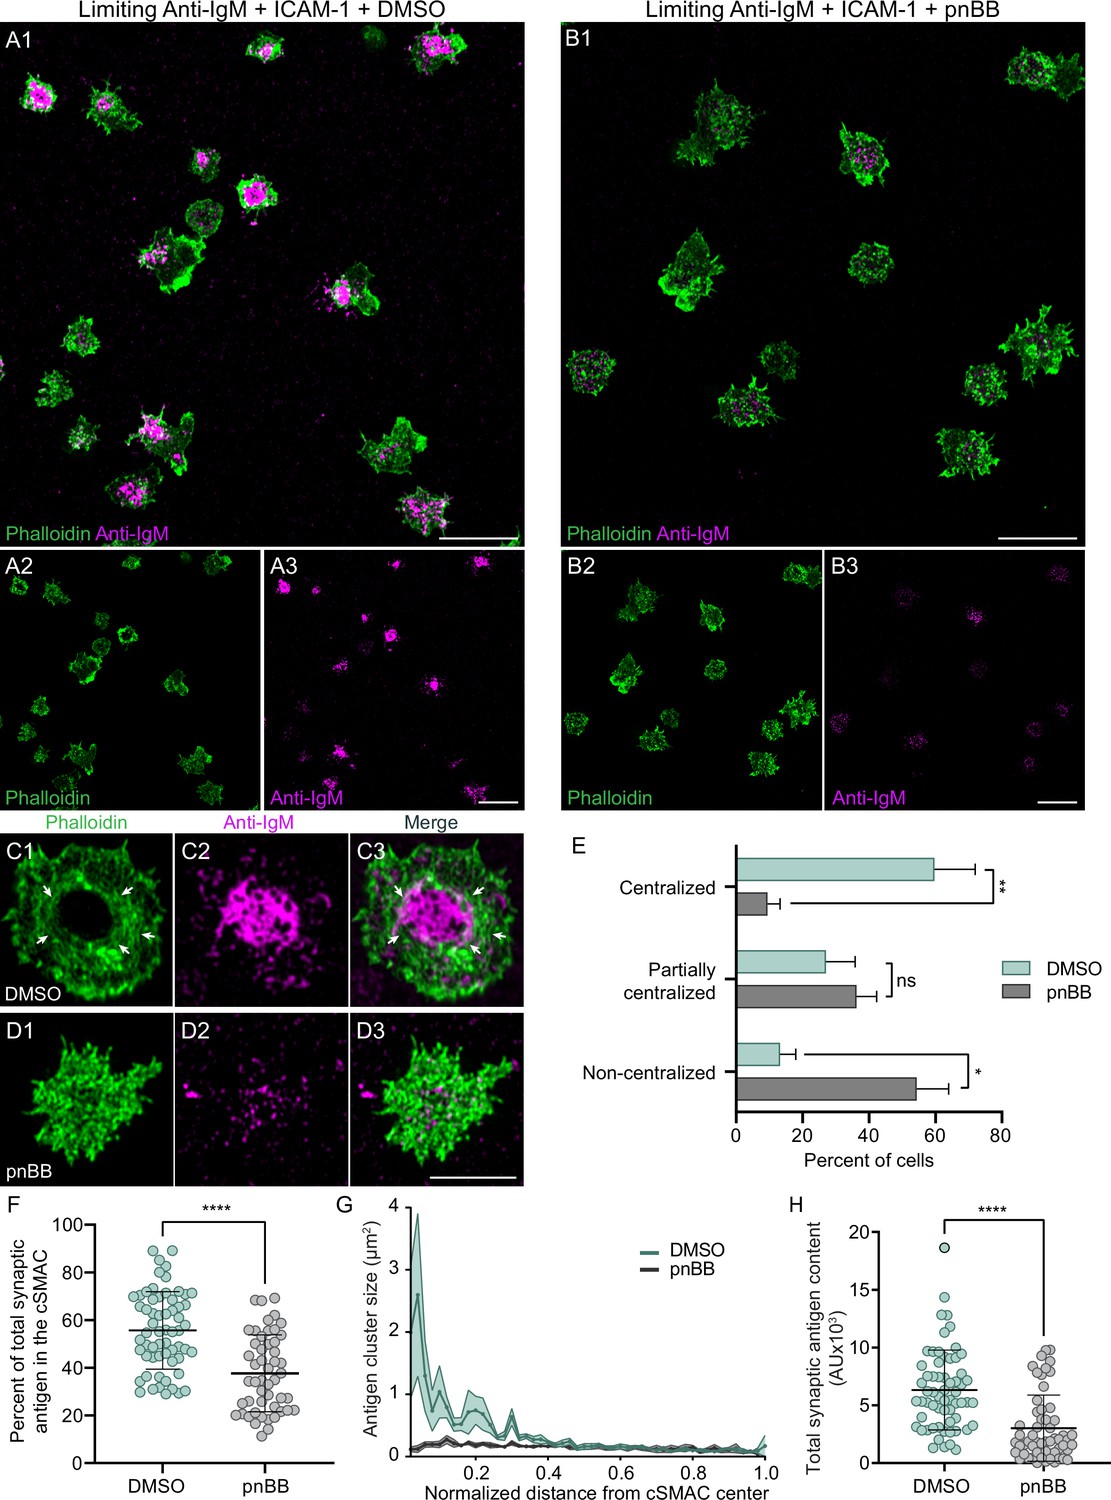
Integrin ligation-dependent immune synapse (IS) formation requires myosin 2A contractility.
(A1–A3) DMSO-treated, phalloidin-stained primary B cells 15 min after engagement with a PLB containing ICAM-1 and limiting anti-IgM. (B1–B3) Same as (A1–A3) except the B cells were treated with pnBB. (C1–C3) Images of a representative, DMSO-treated primary B cell (white arrows mark actin arcs). (D1–D3) Images of a representative, pnBB-treated primary B cell. (E) Percent of cells exhibiting centralized, partially centralized, and noncentralized antigen (see Figure 5—figure supplement 1D1–D3 for representative examples of these three types of antigen distribution) (N = 126–144 cells/condition from three experiments). (F) Percent of total synaptic antigen in the cSMAC (N = 81–86 cells/condition from three experiments). (G) Antigen cluster size as a function of normalized distance from the cSMAC center (N = 113–144 cells/condition from three experiments). (H) Total synaptic antigen content (N = 56–62 cells/condition from three experiments). All panels: Airyscan images. Scale bars: 10 µm in (A1, B1, A3, B3); 5 µm in (D3).
Figure 5—figure supplement 1
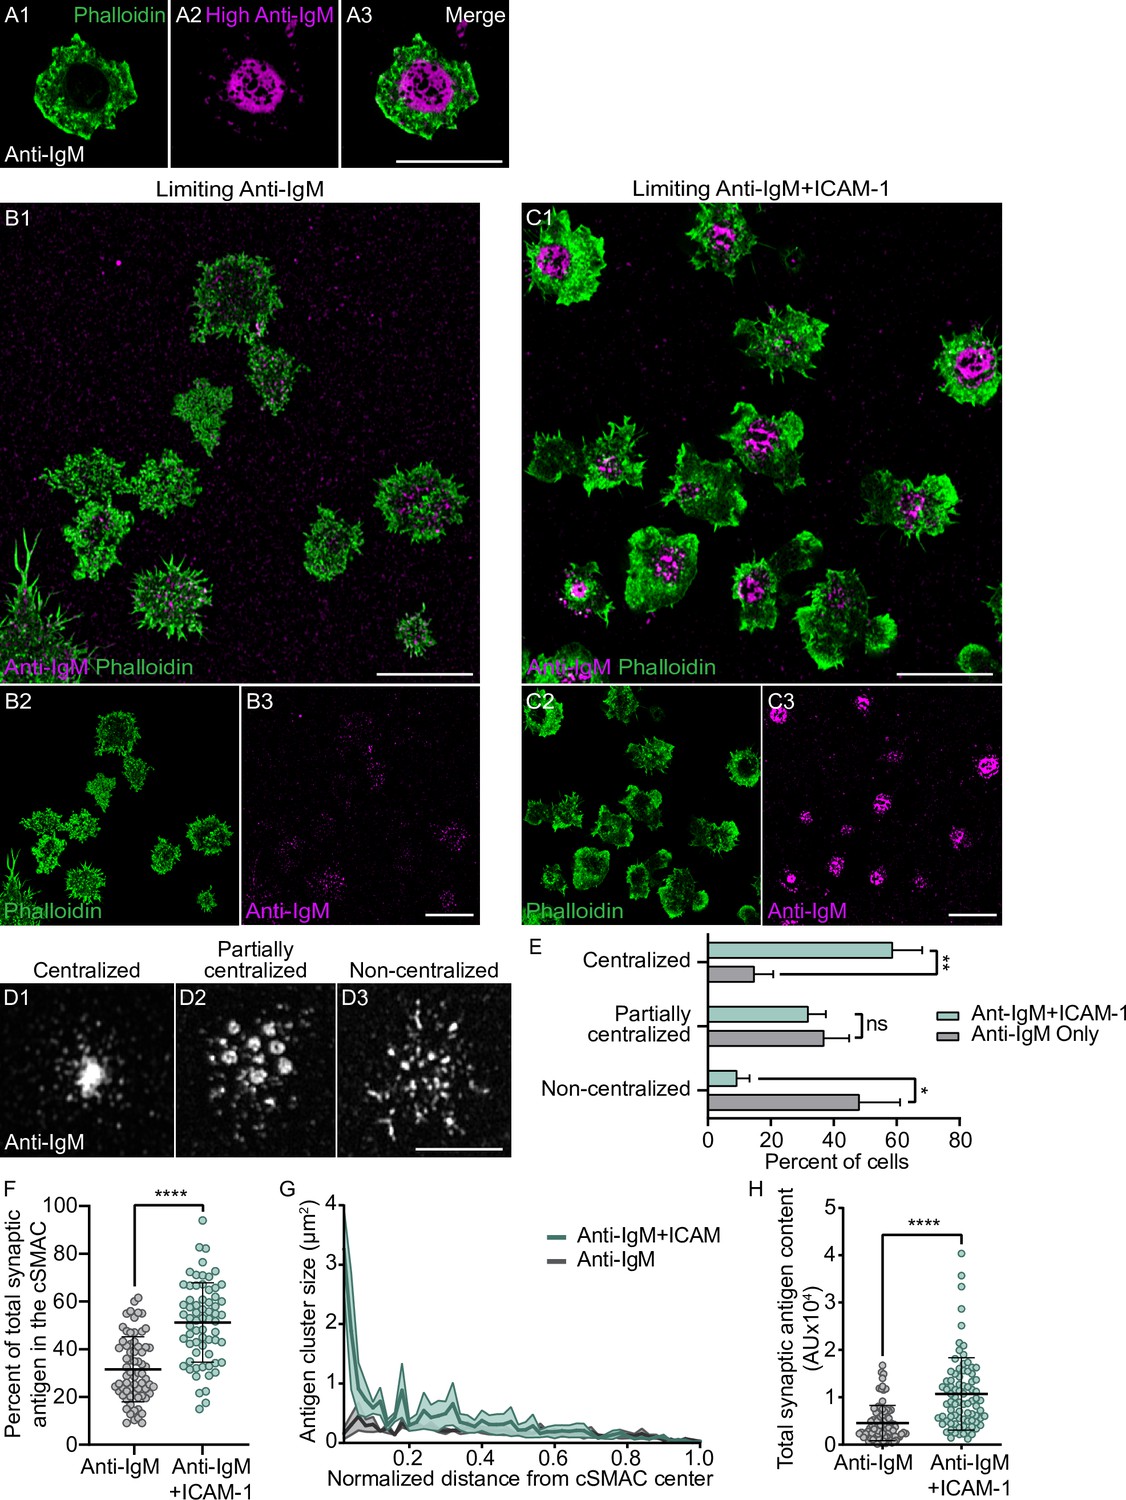
ICAM-1 co-stimulation promotes antigen centralization and immune synapse (IS) formation when antigen is limiting.
(A1–A3) Representative, phalloidin-stained primary B cell 15 min after engagement with a PLB containing fluorescent anti-IgM at high density. (B1–B3) Phalloidin-stained primary B cells 15 min after engagement with a PLB containing a limiting amount of anti-IgM. (C1–C3) Same as (B1–B3) except the PLB also contained ICAM-1. (D1–D3) Representative images of centralized, partially centralized, and noncentralized antigen. (E) Percent of cells exhibiting the three types of antigen distribution shown in (D1–D3) (N = 151 cells/condition from four experiments). (F) Percent of total synaptic antigen in the cSMAC (N = 66–68 cells/condition from three experiments). (G) Antigen cluster size as a function of normalized distance from the cSMAC center (N = 62–69 cells/condition from three experiments). (H) Total synaptic antigen content (N = 83–87 cells/condition from three experiments). All panels: Airyscan images. Scale bars: 10 µm.
Figure 5—figure supplement 2
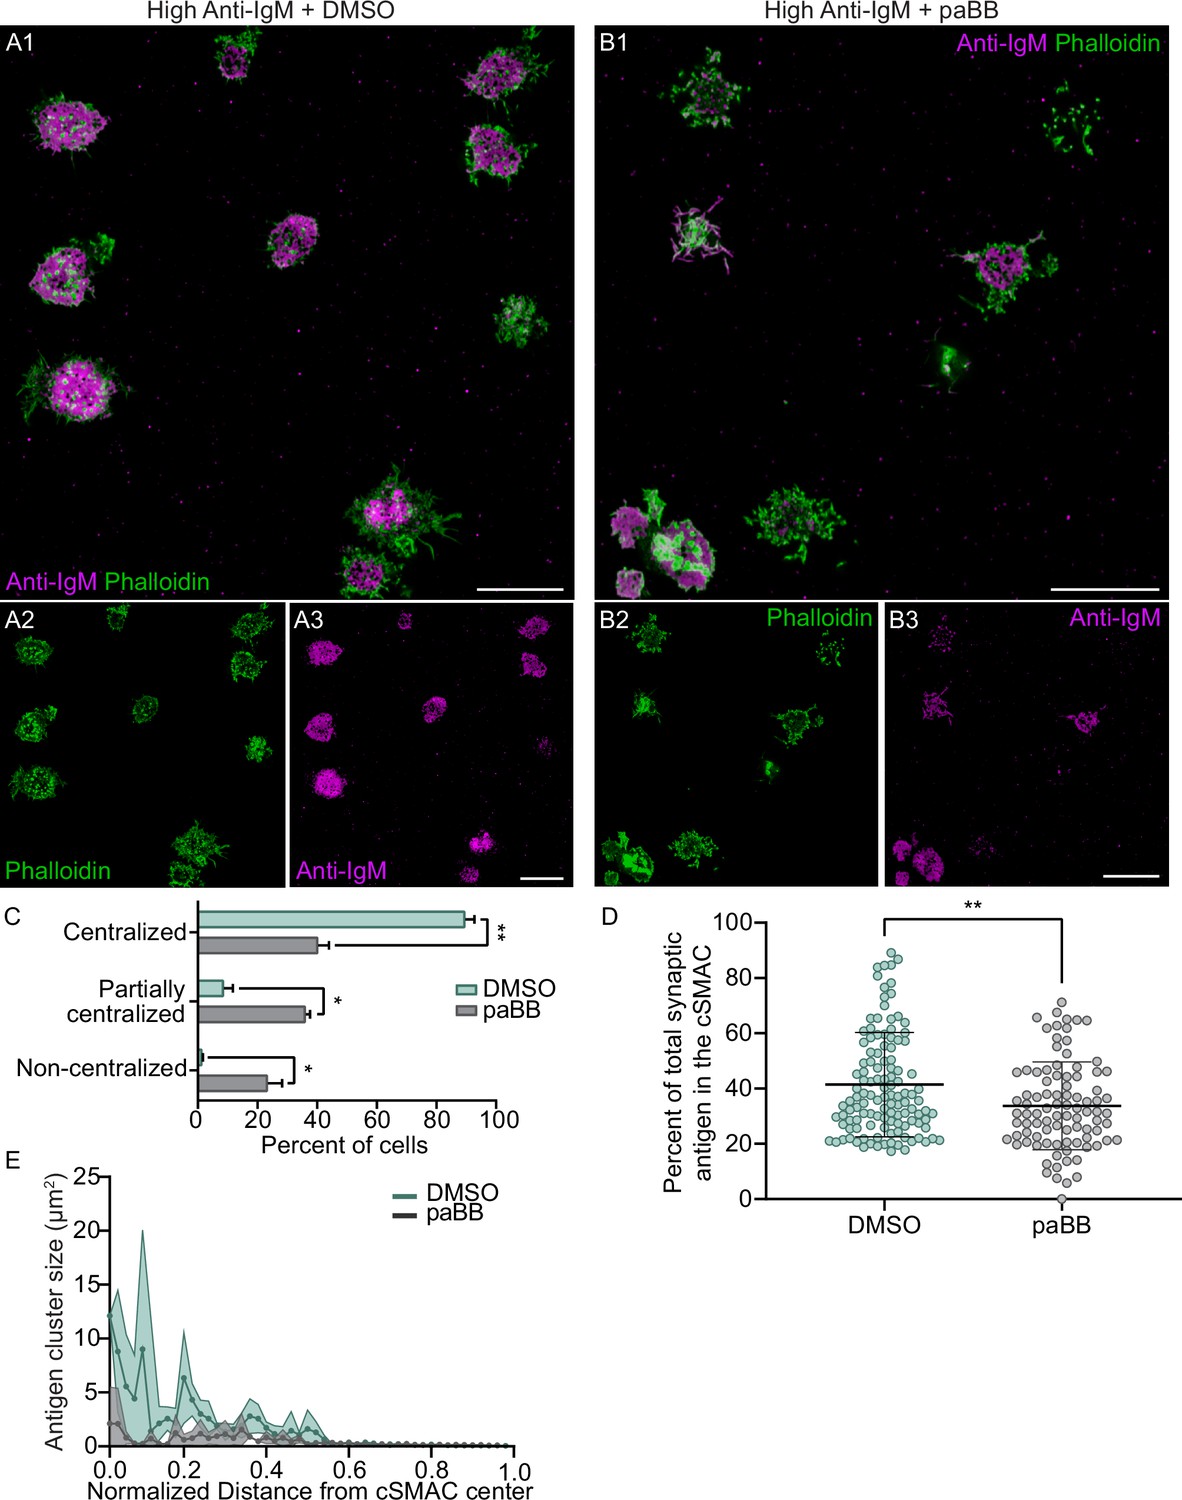
M2A contractility potentiates antigen centralization even when antigen density is high.
(A1–A3) Phalloidin-stained, DMSO-treated primary B cells 15 min after engagement with a PLB containing high-density anti-IgM. (B1–B3) Same as (A1–A3) except the cells were treated with paBB. (C) Percent of cells exhibiting centralized, partially centralized, and noncentralized antigen (N = 137–198 cells/condition from three experiments). (D) Percent of total synaptic antigen in the cSMAC (N = 91–121 cells/condition from three experiments). (E) Antigen cluster size as a function of normalized distance from the cSMAC center (N = 86–130 cells/condition from three experiments). All panels: Airyscan images. Scale bars: 10 µm.
Figure 6 with 1 supplement
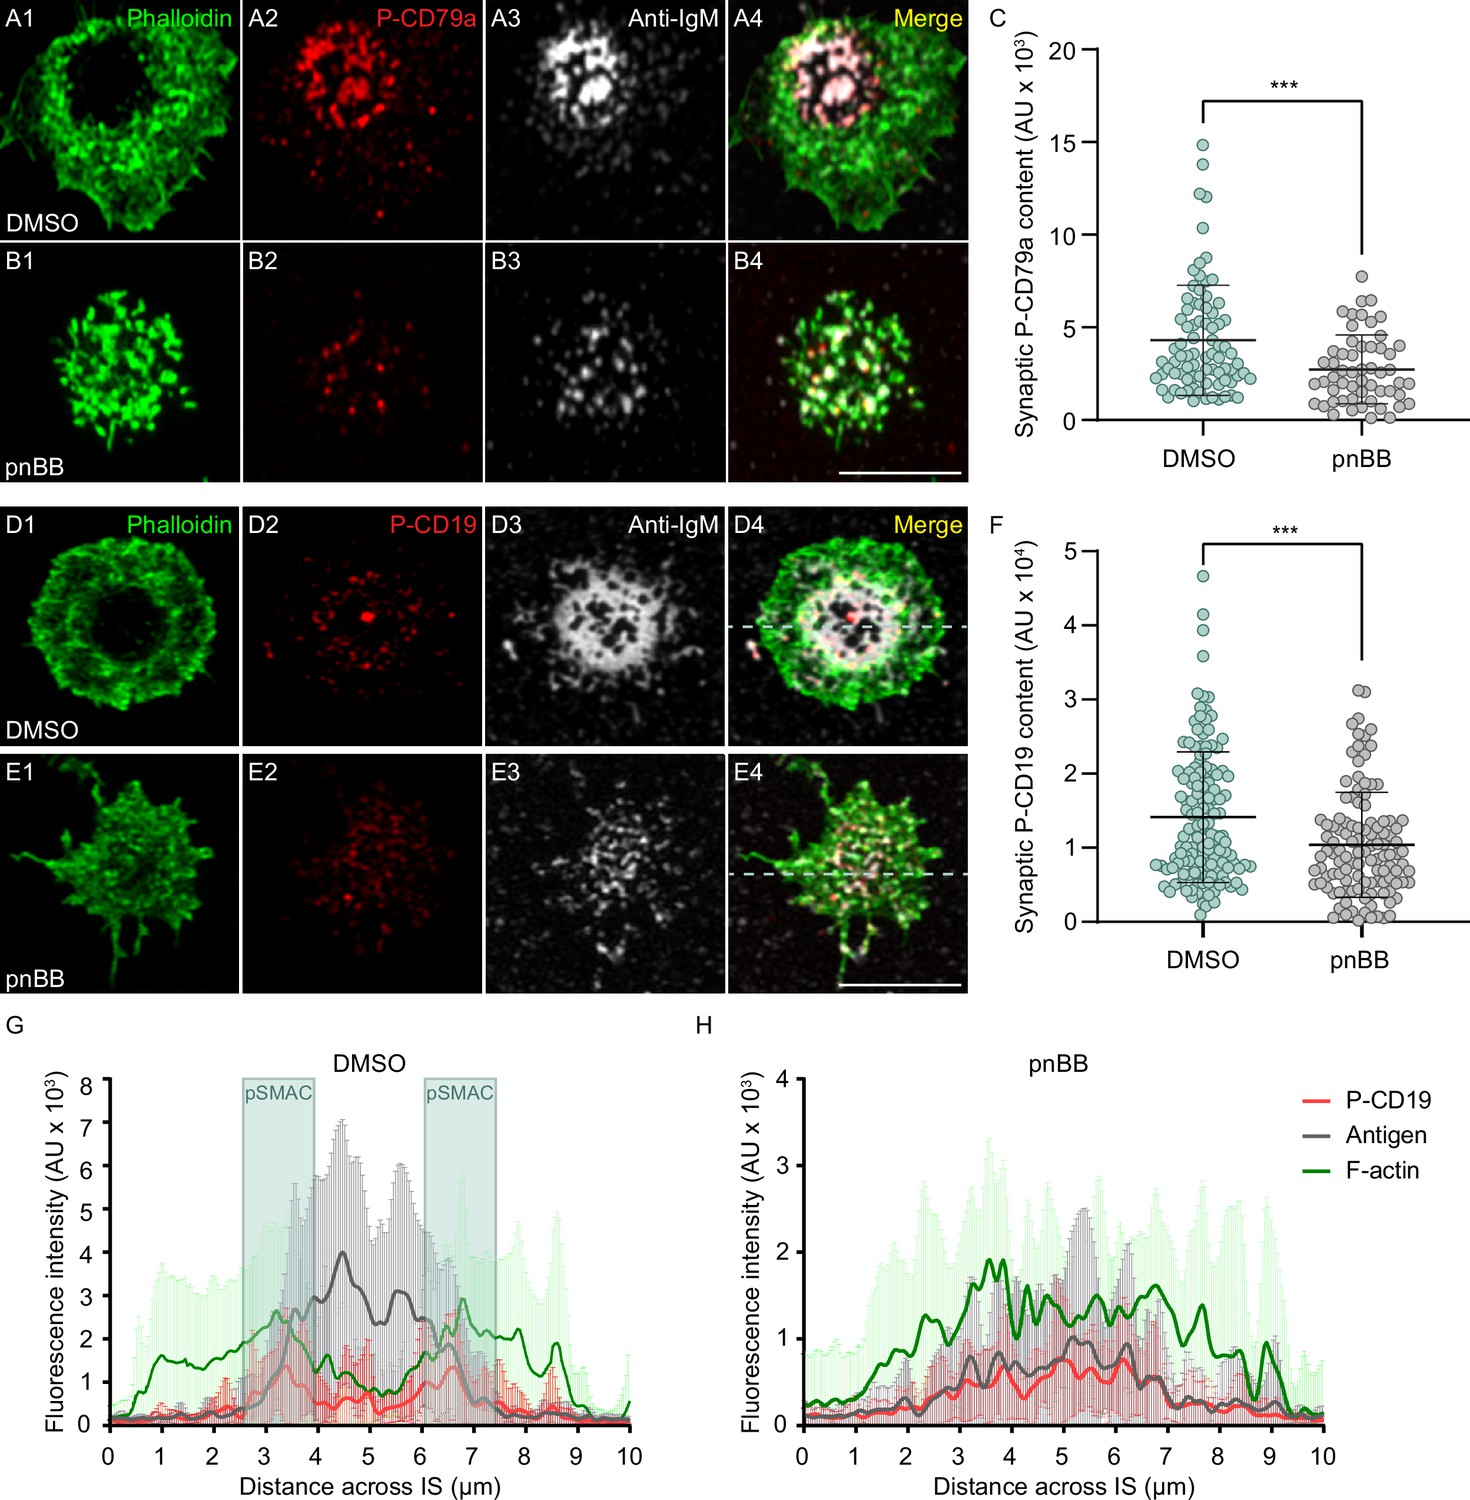
Myosin 2A contractility promotes B-cell receptor (BCR) signaling.
(A1–A4) DMSO-treated primary B cell 10 min after engagement with a PLB containing ICAM-1 and limiting anti-IgM, and stained for F-actin and P-CD79a. (B1–B4) Same as (A1–A4) except the B cell was treated with pnBB. (C) Synaptic P-CD79a content (N = 55–81 cells/condition from three experiments). (D1–D4) DMSO-treated primary B cell 10 min after engagement with a PLB containing ICAM-1 and limiting anti-IgM, and stained for F-actin and P-CD19. (E1–E4) Same as (D1–D4) except the cell was treated with pnBB. (F) Synaptic P-CD19 content (N = 115–140 cells/condition from three experiments). (G) Fluorescence intensities across synapses for P-CD19 (red), antigen (gray), and F-actin (green) in B cells treated with DMSO (N = 22 cells from two experiments). The position of the pSMAC is highlighted in blue. (H) Same as (G) except the cells were treated with pnBB (N = 16 cells from two experiments). All panels: Airyscan images. Scale bars: 5 µm in (B4); 3 µm in (E4).
Figure 6—figure supplement 1
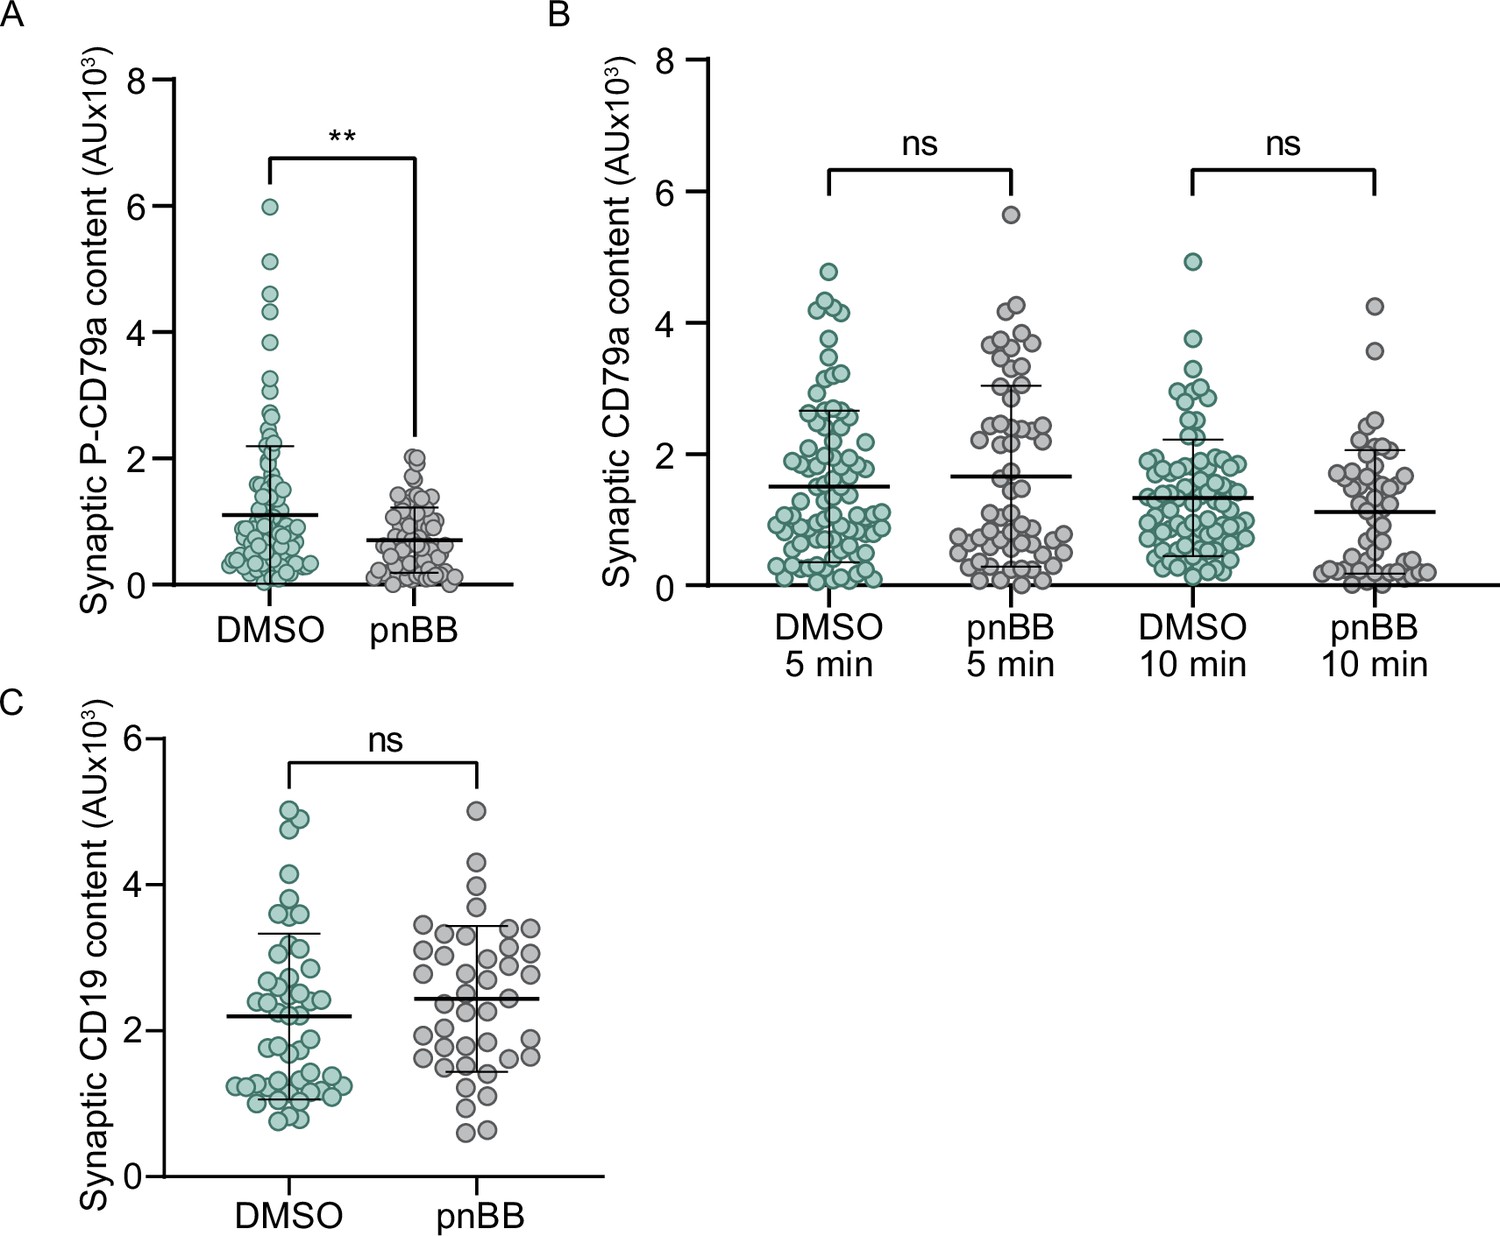
Myosin 2A contractility promotes B-cell receptor (BCR) signaling.
(A) Synaptic content of P-CD79a in DMSO-treated or pnBB-treated primary B cells 5 min after engaging PLBs containing ICAM-1 and a limiting amount of anti-IgM. (B) Same as (A) except showing the synaptic content of CD79a at 5 and 10 min. (C) Same as (A) except showing the synaptic content of CD19 at 10 min. N = 41–53 cells/condition from three experiments.
Figure 7 with 1 supplement
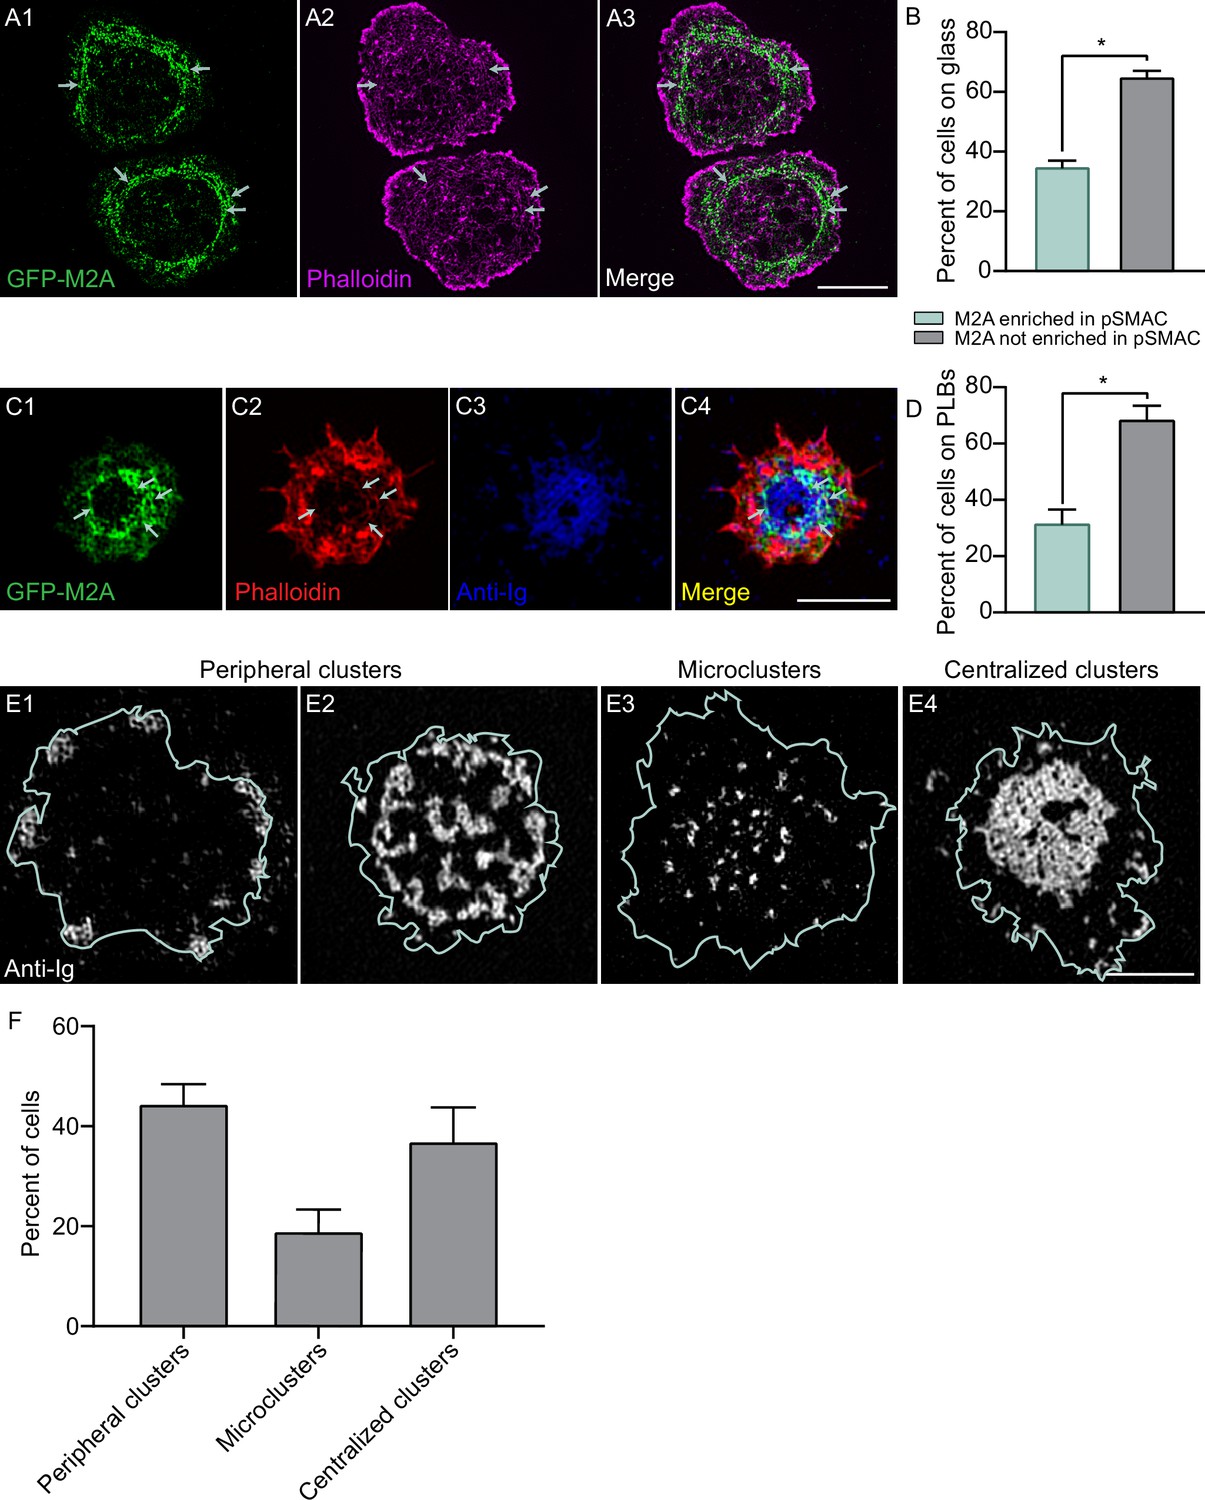
Germinal center B cells make actomyosin arcs.
(A1–A3) Phalloidin-stained primary GC B cell from the M2A-GFP knockin mouse on anti-IgM/anti-IgG/ICAM-1-coated glass. White arrows mark the actomyosin arcs. (B) Percent of cells on glass that did or did not show M2A enrichment in the pSMAC (N = 140 cells from four experiments). (C) Phalloidin-stained primary GC B cell from the M2A-GFP knockin mouse 15 min after engagement with a PLB containing anti-IgM, anti-IgG, and ICAM-1. (D) Percent of cells on PLBs that did or did not show M2A enrichment in the pSMAC (N = 89 cells from four experiments). (E1–E4) Representative images of the three types of anti-Ig distribution exhibited by GC B cells 15 min after engagement with a PLB containing anti-IgG and ICAM-1 (cell outlines are shown in blue). (F) Percent of GC cells displaying the three types of anti-Ig distribution shown in (E1–E4) (N = 157 cells from six experiments). All panels: TIRF-SIM images. Scale bars: 5 µm in (A3); 3 µm in (C4, E4).
Figure 7—figure supplement 1
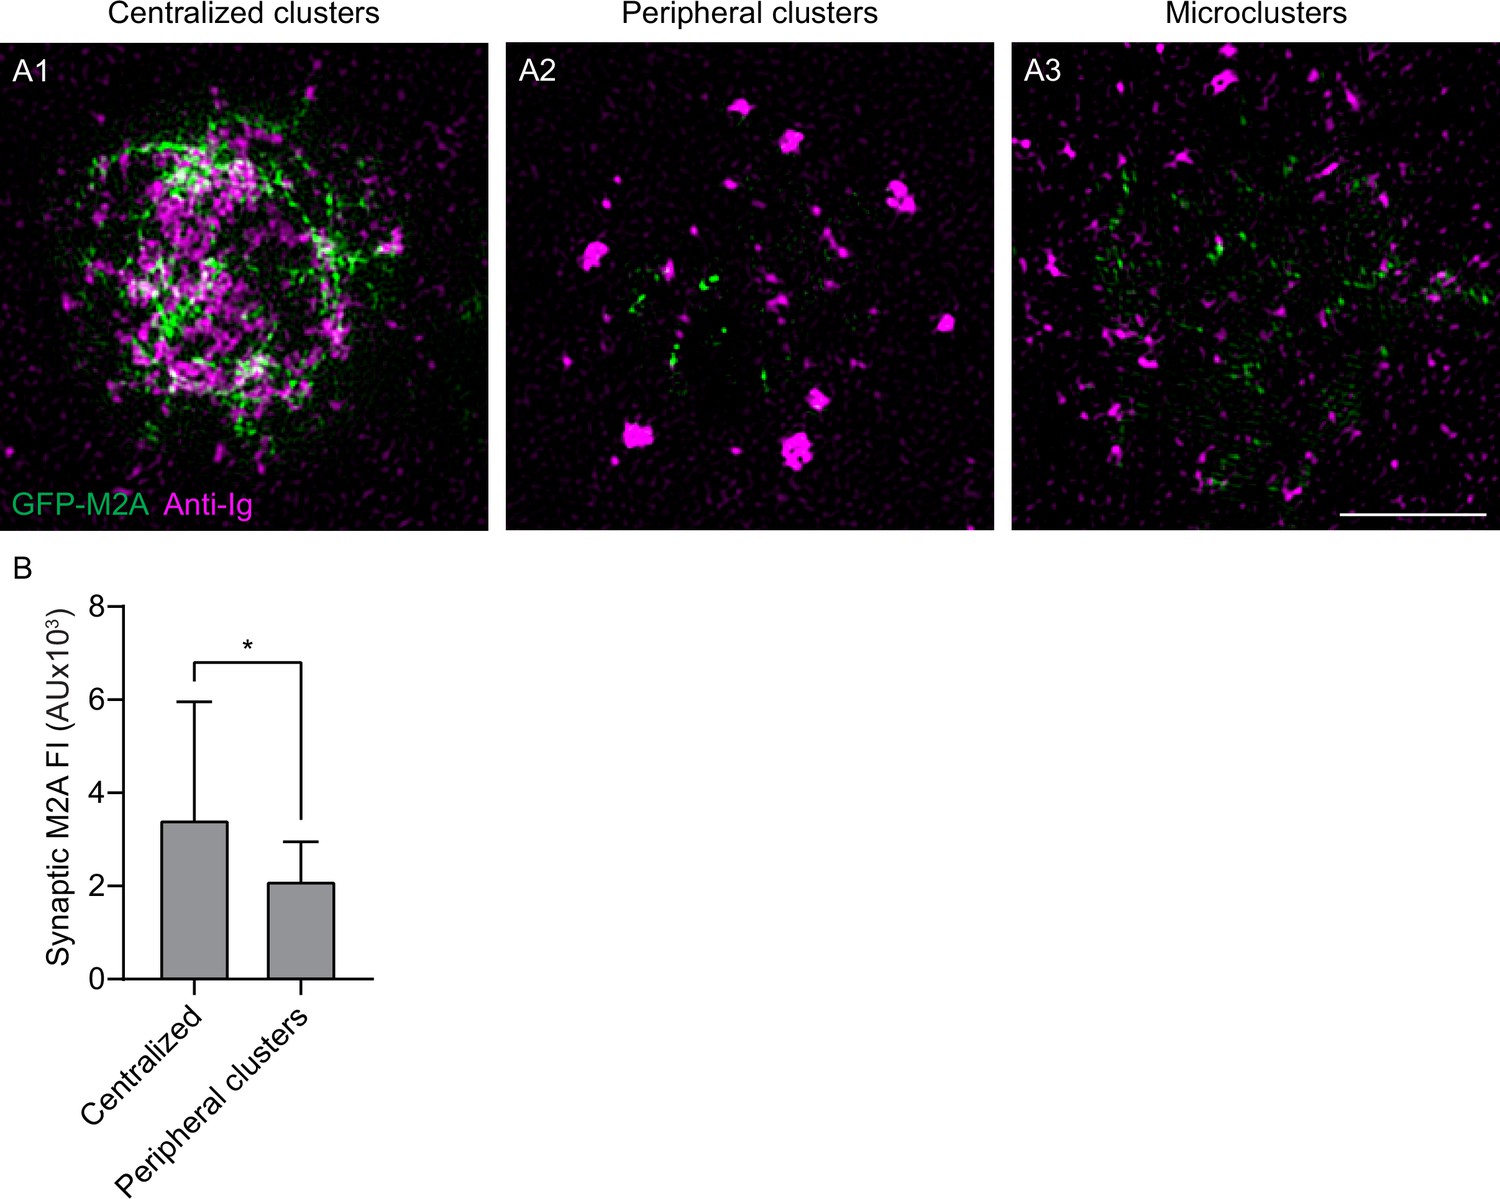
Distribution of GFP-M2A in synapses formed by PLB-engaged germinal center B cells.
(A1–A3) Shown are images of the distribution of GFP-M2A (green) and anti-Igs (magenta) in GC B cell synapses exhibiting centralized antigen clusters (A1), peripheral antigen clusters (A2), or microclusters (A3). The distribution of GFP-M2A shown in (A1) is representative of 16 out of 21 cells with centralized antigen. The distribution of GFP-M2A shown in (A2) is representative of 20 out of 22 cells with peripheral antigen clusters. The distribution of GFP-M2A shown in (A3) is representative of 12 out of 13 cells with microclusters. See also Videos 12 and 13. All panels: TIRF-SIM images. Scale bars: 5 µm. (B) The synaptic content of M2A-GFP in GC B cells engaged with PLBs for 10 min that exhibited centralized antigen or peripheral antigen clusters (N > 20 cells).
Videos
Video 1
Representative primary B cells expressing GFP-F-Tractin on glass coated with anti-IgM that were imaged every 3 s for 120 s using Airyscan (A) and TIRF-SIM (B).
Played back at 10 fps. Scale bar: 5 μm.
Video 2
Representative primary B cells expressing GFP-F-Tractin on glass coated with anti-IgM and ICAM-1 that were imaged every 2 s for 120 s using Airyscan (A) and every 5 s for 600 s using TIRF-SIM (B).
Played back at 10 fps. Scale bars: 5 μm.
Video 3
A representative primary B cell expressing GFP-F-Tractin on glass coated with anti-IgM and ICAM-1 that was imaged every 3 s for 300 s using TIRF-SIM (A).
A magnified view of the region boxed in white in (A) is shown in (B).Played back at 10 fps. Scale bars: 5 μm (A), 1 μm (B).
Video 4
A representative A20 B cell expressing mEOS-actin on glass coated with anti-IgG and ICAM-1 that was imaged every 1.8 s for 70 s using Airyscan.
Played back at 7 fps. Scale bar: 5 μm.
Video 5
A representative A20 B cell expressing GFP-F-Tractin on glass coated with anti-IgG and ICAM-1 that was imaged every 1.5 s for 120 s using TIRF-SIM (A).
A representative A20 B cell in which we had inserted mScarleti at the N-terminus of M2A using CRISPR (magenta) that was transfected with GFP-F-Tractin (green), activated on glass coated with anti-IgG and ICAM-1, and imaged every 3 s for 120 s using TIRF-SIM (B). Played back at 10 fps. Scale bars: 5 μm.
Video 6
A representative primary B cell from a M2A-GFP knockin mouse expressing Td-Tomato-F-Tractin on glass coated with anti-IgM and ICAM-1 that was imaged every 3 s for 300 s using TIRF-SIM.
Played back at 10 fps. Scale bar: 5 μm.
Video 7
A magnified view of a region within Video 6.
The applied arrowheads mark various aspects of M2A filament assembly and organization as explained in the text for Figure 3B1–B6. Scale bar: 1 μm.
Video 8
Representative primary B cells expressing GFP-F-Tractin on PLBs containing anti-IgM and ICAM-1 (A) or anti-IgM alone (B) that were imaged every 5 s for 300 s using TIRF-SIM and played back at 8 fps.
Scale bar: 5 μm.
Video 9
A representative primary B cell on a PLB containing fluorescent anti-IgM (white) and unlabeled ICAM-1 that was imaged every 5 s for 345 s using TIRF-SIM.
Played back at 10 fps. Scale bar: 5 μm.
Video 10
A region within the pSMAC of a representative primary B cell expressing GFP-F-Tractin (green), engaged with a PLB containing fluorescent anti-IgM (red) and unlabeled ICAM-1, and imaged every 5 s for 400 s using TIRF-SIM.
The applied white lines mark actin arcs that are sweeping an antigen cluster centripetally, as explained in the text for Figure 4D1–D6. The inward tracks of this cluster and two other clusters are then shown in blue, green, and red, respectively. Played back at 10 fps. Scale bar: 1 μm.
Video 11
A representative primary GC B cell isolated from the GFP-M2A knockin mouse that was stained with CellMask Deep Red (magenta) to label its plasma membrane, activated on glass coated with anti-IgM and ICAM-1, and imaged every 5 s for 300 s using TIRF-SIM.
The first 11 frames show a still image of the magenta cell membrane. Played back at 10 fps. Scale bar: 5 μm.
Video 12
A representative primary GC B cell isolated from the GFP-M2A knockin mouse that exhibited centralized antigen clusters on a PLB containing anti-Igs (magenta), imaged every 5 s for 300 s using TIRF-SIM and played back at 7 fps.
Scale bar: 3 μm.
Video 13
A representative primary GC B cell isolated from the GFP-M2A knockin mouse that exhibited peripheral antigen clusters on a PLB containing anti-Igs (magenta), imaged every 5 s for 180 s using TIRF-SIM and played back at 7 fps.
Scale bar: 5 μm.
Tables
Appendix 1—key resources table
| Reagent type (species) or resource | Designation | Source or reference | Identifiers | Additional information |
|---|---|---|---|---|
| Strain, strain background (Mus musculus) | C57BL/6 | Jackson Laboratories | Cat# 002595; RRID:MGI:5656552 | |
| Strain, strain background (M. musculus) | M2A-GFP KI | Robert Adelstein, NHLBI/NIH | ||
| Cell line (M. musculus) | A20 | American Type Culture Collection | ATCC TIB-208; RRID:CVCL_1940 | IgG+ B cell line |
| Recombinant DNA reagent | GFP-F-Tractin | Michael Schell (Uniformed Services University, MD) | ||
| Recombinant DNA reagent | tdTomato-F-Tractin | Michael Schell (Uniformed Services University, MD) | ||
| Chemical compound, drug | Alexa Fluor 488 Phalloidin | Thermo Fisher Scientific | Cat# A12379 | Fluorescence labeling (1:500) |
| Chemical compound, drug | Alexa Fluor 568 Phalloidin | Thermo Fisher Scientific | Cat# A12380 | Fluorescence labeling (1:500) |
| Chemical compound, drug | CellMask Deep Red Plasma Membrane Stain | Thermo Fisher Scientific | Cat# C10046 | Cell labeling (1:10000) |
| Chemical compound, drug | DMSO | MilliporeSigma | Cat# D4540 | |
| Chemical compound, drug | SMIFH2 | MilliporeSigma | Cat# 344092 | 25 μM |
| Chemical compound, drug | CK-666 | MilliporeSigma | Cat# 182515 | 100 μM |
| Chemical compound, drug | (S)-nitro- blebbistatin (pnBB) | Cayman Chemicals | Cat# 24171 | 25 μM |
| Chemical compound, drug | Para-amino blebbistatin | Cayman Chemicals | Cat# 22699 | 25 μM |
| Chemical compound, drug | Zombie Yellow viability stain | BioLegend | Cat# 423103 | Dead cell staining (1:300) |
| Chemical compound, drug | 18:1 Biotinyl Cap PE IN CHLOROFORM 1,2-dioleoyl- sn-glycero-3-phosphoethanolamine- N-(cap biotinyl) | Avanti Polar Lipids | Cat# 870273C | |
| Chemical compound, drug | 18:1 DGS-NTA(Ni) in Chloroform 1,2-dioleoyl-sn-glycero- 3-[(N-(5-amino-1-carboxypentyl) iminodiacetic acid)succinyl] (nickel salt) | Avanti Polar Lipids | Cat# 790404C | |
| Chemical compound, drug | 18:1 (9-Cis) PC (DOPC) in CHLOROFORM 1,2-dioleoyl-sn-glycero- 3-phosphocholine | Avanti Polar Lipids | Cat# 850375C | |
| Chemical compound, drug | TransFluoSpheres (633/720) | Thermo Fisher Scientific | Cat# T8870 | |
| Other | Escherichia coli O111:B4 LPS | MilliporeSigma | Cat# L2630 | Cell culture 2.5 µg/ml |
| Biological sample (Ovis aries) | Sheep’s red blood cells | Innovative Research Novi | Cat# ISHRBC100P15ML | Injection 2 × 10⁸ cells |
| Antibody | Alexa Fluor 488- conjugated goat, anti-rabbit, polyclonal | Jackson Immuno Research | Cat# 111-545-003; RRID:AB_2338046 | Immunofluorescence (1:500) |
| Antibody | Alexa Fluor 594 conjugated goat, anti-rabbit, polyclonal | Jackson Immuno Research | Cat# 111-585-003; RRID:AB_2338059 | Immunofluorescence (1:500) |
| Antibody | Alexa Fluor 647- conjugated goat, anti-rabbit, polyclonal | Jackson Immuno Research | Cat# 111-605-003; RRID:AB_2338072 | Immunofluorescence (1:500) |
| Antibody | Goat anti-mouse IgG, Fcγ fragment-specific, polyclonal | Jackson Immuno Research | Cat# 115-005-008; RRID:AB_2338449 | Coverslip coating 2.5 µg/cm2 |
| Antibody | Goat anti-mouse IgM, µ-chain-specific, polyclonal | Jackson Immuno Research | Cat# 115-005-020; RRID:AB_2338450 | Coverslip coating 2.5 µg/cm2 |
| Antibody | Goat anti-rabbit IgG (H + L) Poly-HRP, polyclonal | Thermo Fisher | Cat# 32260; RRID:AB_1965959 | Western blot (1:3000) |
| Antibody | Rabbit anti-DIAPH1, polyclonal | Thermo Fisher | Cat# PA5-27607; RRID:AB_2545083 | Western blot (1:250) |
| Antibody | β-actin antibody (C4), mouse monoclonal | Santa Cruz | Cat# SC-47778 HRP; RRID:AB_2714189 | Western blot (1:5000) |
| Antibody | Rabbit anti-CD79a, polyclonal | Cell Signaling Technologies | Cat# 3351; RRID:AB_2075745 | Immunofluorescence (1:250) |
| Antibody | Rabbit anti-phospho-CD79a, polyclonal | Cell Signaling Technologies | Cat# 5173; RRID:AB_10694763 | Immunofluorescence (1:250) |
| Antibody | Rabbit anti-CD19, polyclonal | Cell Signaling Technologies | Cat# 3574; RRID:AB_2275523 | Immunofluorescence (1:250) |
| Antibody | Rabbit anti-phospho-CD19, polyclonal | Cell Signaling Technologies | Cat# 3571; RRID:AB_2072836 | Immunofluorescence (1:250) |
| Antibody | Rabbit anti-M2A, polyclonal | MilliporeSigma | Cat# M8064; RRID:AB_260673 | Immunofluorescence (1:200) |
| Antibody | TruStain FcX PLUS (anti-mouse CD16/32) antibody, rat monoclonal | BioLegend | Cat# 156604; RRID:AB_2783138 | FcR block (0.25 μg/106 cells) |
| Antibody | Pacific Blue anti-mouse CD38, rat monoclonal | BioLegend | Cat# 102719; RRID:AB_10613289 | FACS (1:100) |
| Antibody | PerCP/Cyanine5.5 anti-mouse/human CD45R/B220, rat monoclonal | BioLegend | Cat# 103235; RRID:AB_893356 | FACS (1:100) |
| Antibody | APC anti-MU/HU GL7 antigen, rat monoclonal | BioLegend | Cat# 144617; RRID:AB_2800674 | FACS (1:200) |
| Recombinant DNA reagent | mNeonGreen-F-Tractin | This paper | See Materials and methods | |
| Sequence-based reagent | Non-targeting miRNA | This paper | miRNA | ACCTAAGGTTA AGTCGCCCTCG; see also Materials and methods |
| Sequence-based reagent | mDia1 miRNA #1 | This paper | miRNA | CAGCATGGCT AAATGGTCA; see also Materials and methods |
| Sequence-based reagent | mDia1 miRNA #2 | This paper | miRNA | GGGTCCGTTT GCTGCCTTA; see also Materials and methods |
| Sequence-based reagent | mDia1 miRNA #3 | This paper | miRNA | GGGTAGCAAT GCTGTGTTT; see also Materials and methods |
| Sequence-based reagent | mirVana miRNA Mimic, Negative Control #1 | Thermo Fisher Scientific | Cat# 4464058 | |
| Sequence-based reagent | MYH9 sgRNA | Synthego | sgRNA | AAACUUCAUCA AUAACCCGC |
| Recombinant DNA reagent | Mouse GFP-M2A | Jordan Beach (Loyola University, Chicago) | CRISPR GFP- M2A template | |
| Recombinant DNA reagent | Mouse Scarleti-M2A | Jordan Beach (Loyola University, Chicago) | mScarleti-CRISPR M2A template | |
| Peptide, recombinant protein | Alt-R S.p. HiFi Cas9 Nuclease V3 | IDT | Cat# 1081060 | |
| Peptide, recombinant protein | BAFF | R&D Systems | Cat# 8876-BF-010 | Cell culture 5 ng/ml |
| peptide, recombinant protein | Streptavidin | MilliporeSigma | Cat# 189730 | |
| peptide, recombinant protein | Mouse histidine-tagged ICAM-1 | Sino Biological | Cat# 50440-M08H | |
| Commercial assay or kit | Nucleofector Kit V | Lonza | Cat# VCA-1003 | |
| Commercial assay or kit | In-Fusion HD Cloning | Takara | Cat# 638911 | |
| Commercial assay or kit | Mini-extruder kit | Avanti Polar Lipids | Cat# 610000 | |
| Commercial assay or kit | Sticky-Slide VI0.4 Luer closed chambers | Ibidi | Cat# 80608 | |
| Commercial assay or kit | Alexa Fluor 647 Antibody Labeling Kit | Thermo Fisher Scientific | Cat# A20186 | |
| Commercial assay or kit | EZ-Link Micro Sulfo-NHS-Biotinylation Kit | Thermo Fisher Scientific | Cat# 21925 | |
| Software, algorithm | ImageJ | NIH | ||
| Software, algorithm | Fiji | Schindelin et al., 2012 | RRID:SCR_002285 | https://imagej.net/Fiji |
| Software, algorithm | Softworx | Applied Precision Ltd.; GE Healthcare Life Sciences | RRID:SCR_019157 | |
| Software, algorithm | ZEN | Zeiss | RRID:SCR_018163 | |
| Software, algorithm | FibrilTool | Boudaoud et al., 2014 | RRID:SCR_016773 | |
| Software, algorithm | BLOCK-iT RNAi Designer | Thermo Fisher Scientific | RRID:SCR_002794 | https://rnaidesigner.thermofisher.com/rnaiexpress/ |
| Software, algorithm | Prism | GraphPad | RRID:SCR_002798 | |
| Software, algorithm | Traction Force plugin | Martiel et al., 2015 |
Additional files
Download links
A two-part list of links to download the article, or parts of the article, in various formats.
Downloads (link to download the article as PDF)
Open citations (links to open the citations from this article in various online reference manager services)
Cite this article (links to download the citations from this article in formats compatible with various reference manager tools)
A B-cell actomyosin arc network couples integrin co-stimulation to mechanical force-dependent immune synapse formation
eLife 11:e72805.
https://doi.org/10.7554/eLife.72805


