Label-free imaging of M1 and M2 macrophage phenotypes in the human dermis in vivo using two-photon excited FLIM
- Charité – Universitätsmedizin Berlin, corporate member of Freie Universität Berlin, Humboldt- Universität zu Berlin, and Berlin Institute of Health, Department of Dermatology, Venerology and Allergology, Germany
- Lomonosov Moscow State University, Faculty of Physics, Russian Federation
Figures
Figure 1
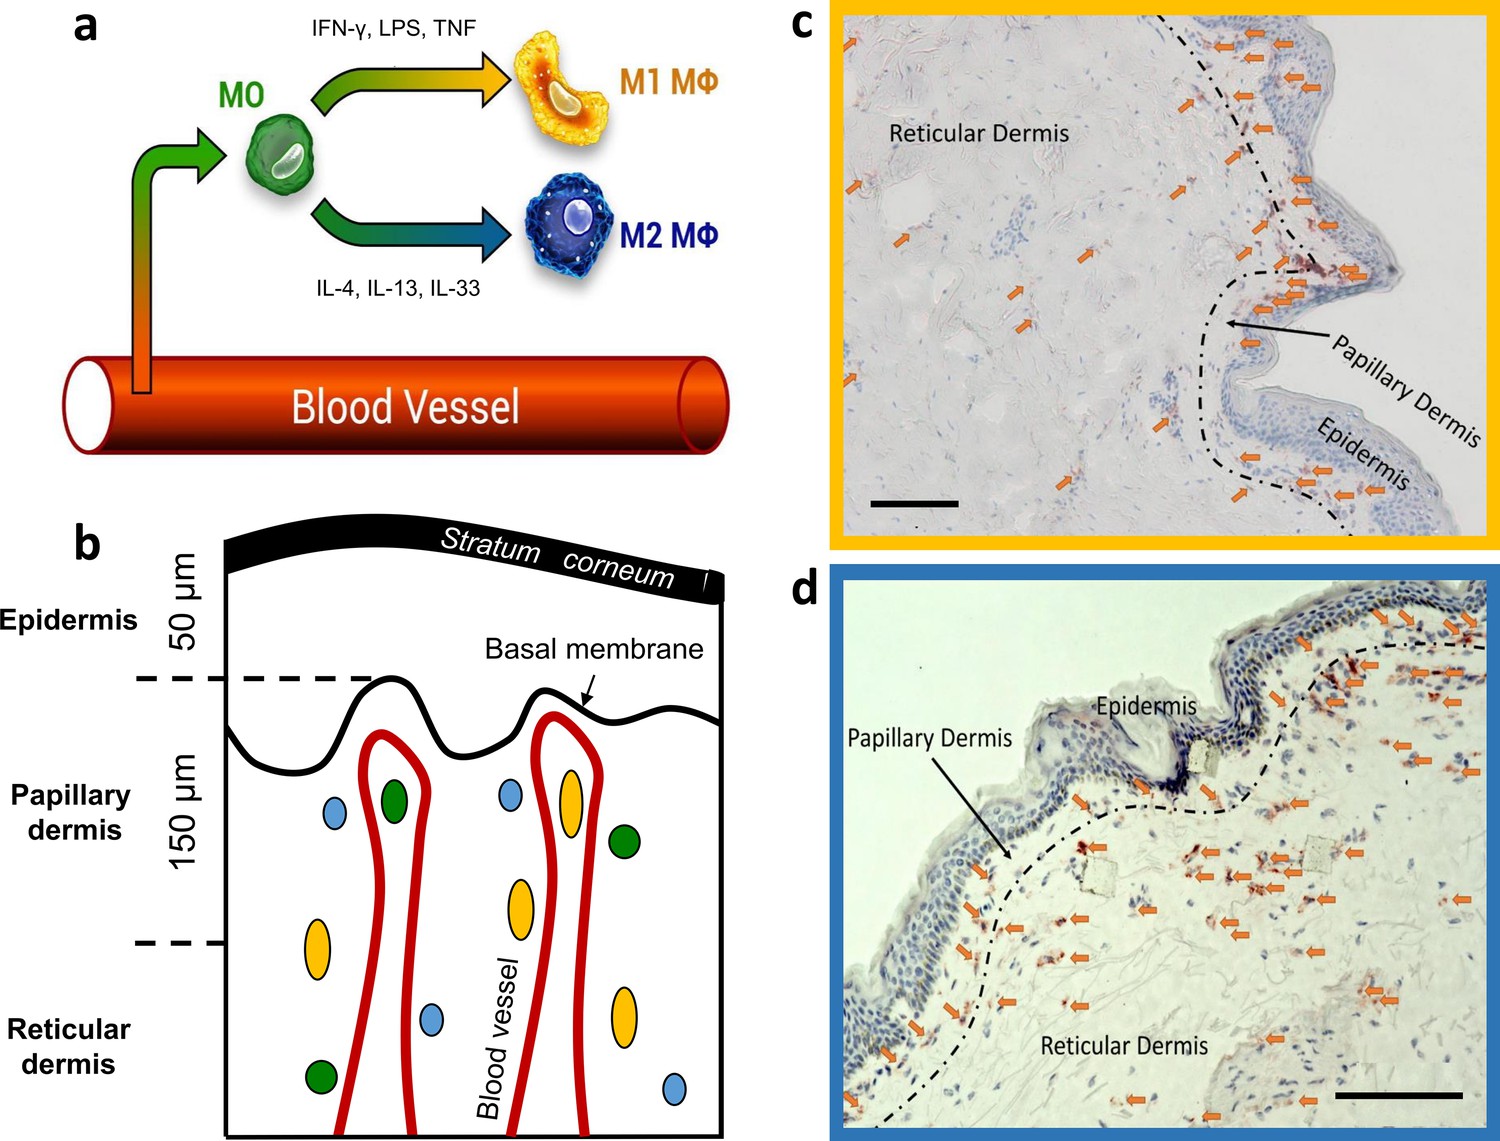
Dermal monocyte skin infiltration and CD68 stained M1 and CD163 stained M2 ΜΦs distribution in excised human skin.
Schematic illustration of monocyte (MO) (green) infiltration into tissues and macrophage (ΜΦ)-polarization into M1 ΜΦs (yellow) via IFN-γ, LPS, and TNF and M2 ΜΦs (blue) via IL-4, IL-13, and IL-33 (a). Schematic of skin with exemplary locations of monocytes (green), M1 ΜΦs (yellow), and M2 ΜΦs (blue) (b). Density of M1 ΜΦs (marked with arrows) stained with CD68 (c) and M2 ΜΦs (marked with arrows) stained with CD163 (d) in 10 µm thick cryo-section. Scale bar: 100 µm. The terms M1 and M2 ΜΦs are simplistic, as many signals modulate MФ functions, resulting in a spectrum between the M1 and M2 MФ phenotypes.
Figure 2 with 4 supplements
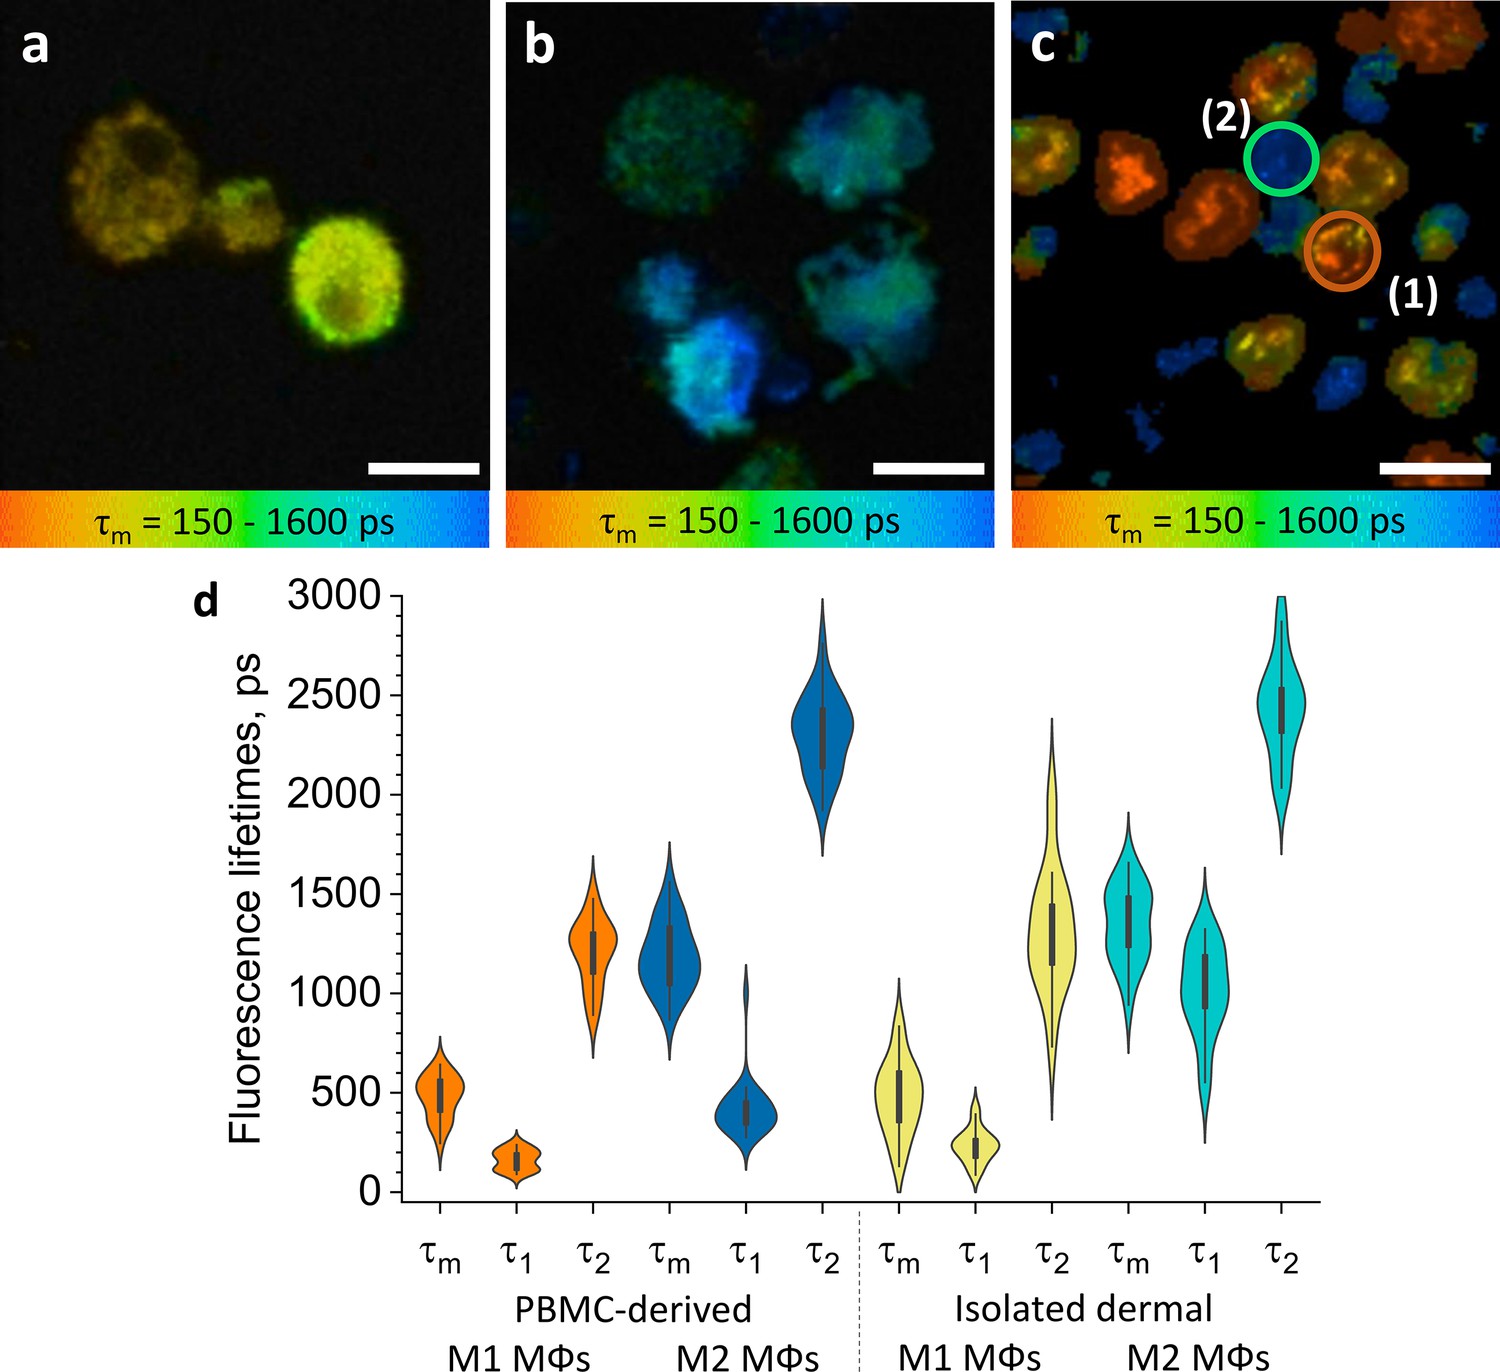
ΜΦs polarised from PBMC and isolated dermal ΜΦs show distinct TPE-FLIM signatures.
TPE-FLIM τm images (mean fluorescence lifetime τm in the 150–1600 ps range) of monocyte-derived M1-polarised (IFN-γ) ΜΦs (a), monocyte-derived M2-polarised (IL-4) ΜΦs (b), and isolated human dermal M1 ΜΦs (1) and M2 ΜΦs (2) (c). Scale bar: 10 µm. The distribution of TPE-FLIM parameters τ1, τ2, and τm for monocyte-derived M1-polarised ΜΦs (n=21, orange), M2-polarised ΜΦs (n=27, dark blue), and isolated dermal M1 ΜΦs (n=34, yellow), M2 ΜΦs (n=28, light blue) (d). The boxplot represents 25–75% of the values. PBMC, peripheral blood mononuclear cell; TPE-FLIM, two-photon excited fluorescence lifetime imaging.
Figure 2—figure supplement 1
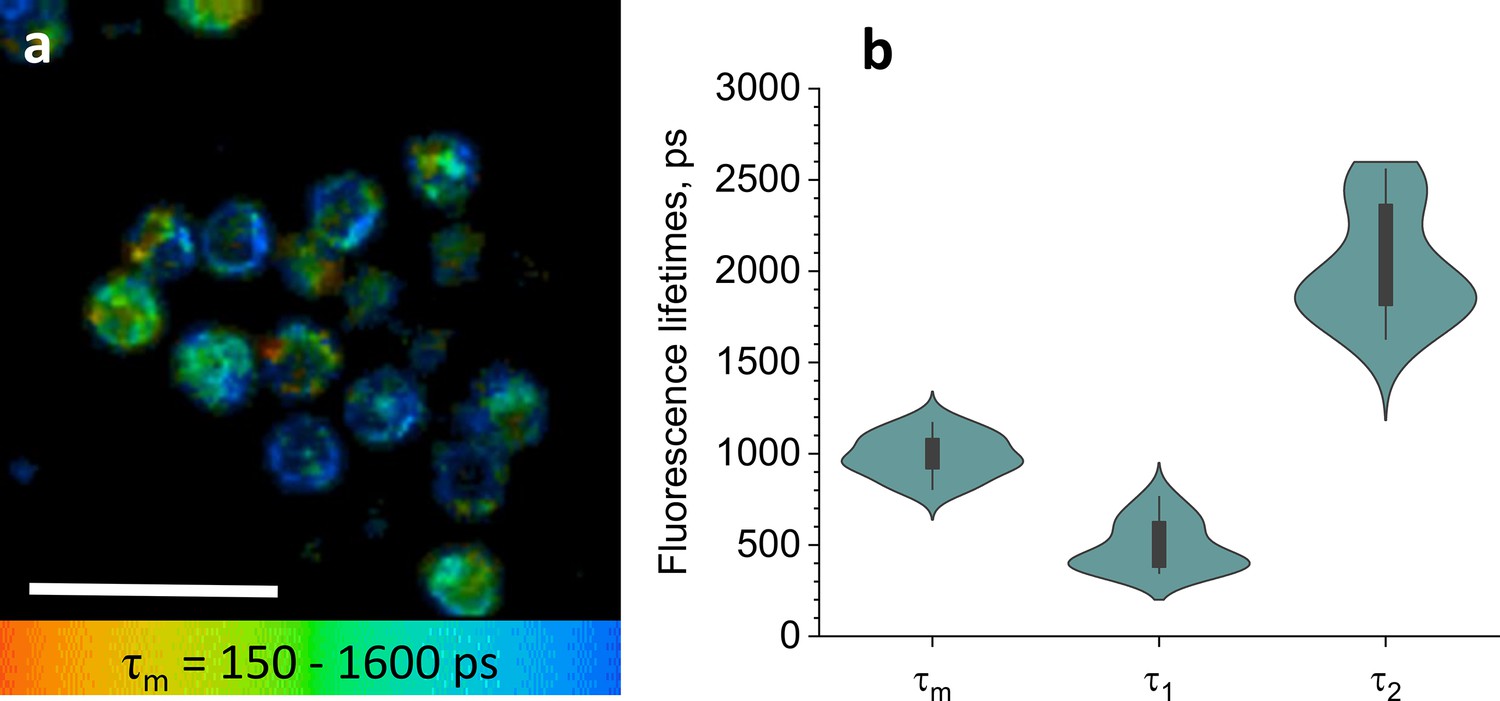
TPE-FLIM visualization of PBMC and histogram of TPE-FLIM parameter.
TPE-FLIM τm images (mean fluorescence lifetime τm in the 150–1600 ps range) of PBMC (a) Scale bar: 10 µm. The distribution of TPE-FLIM parameters τ1, τ2, and τm for PBMC (n=15) (b).
Figure 2—figure supplement 2
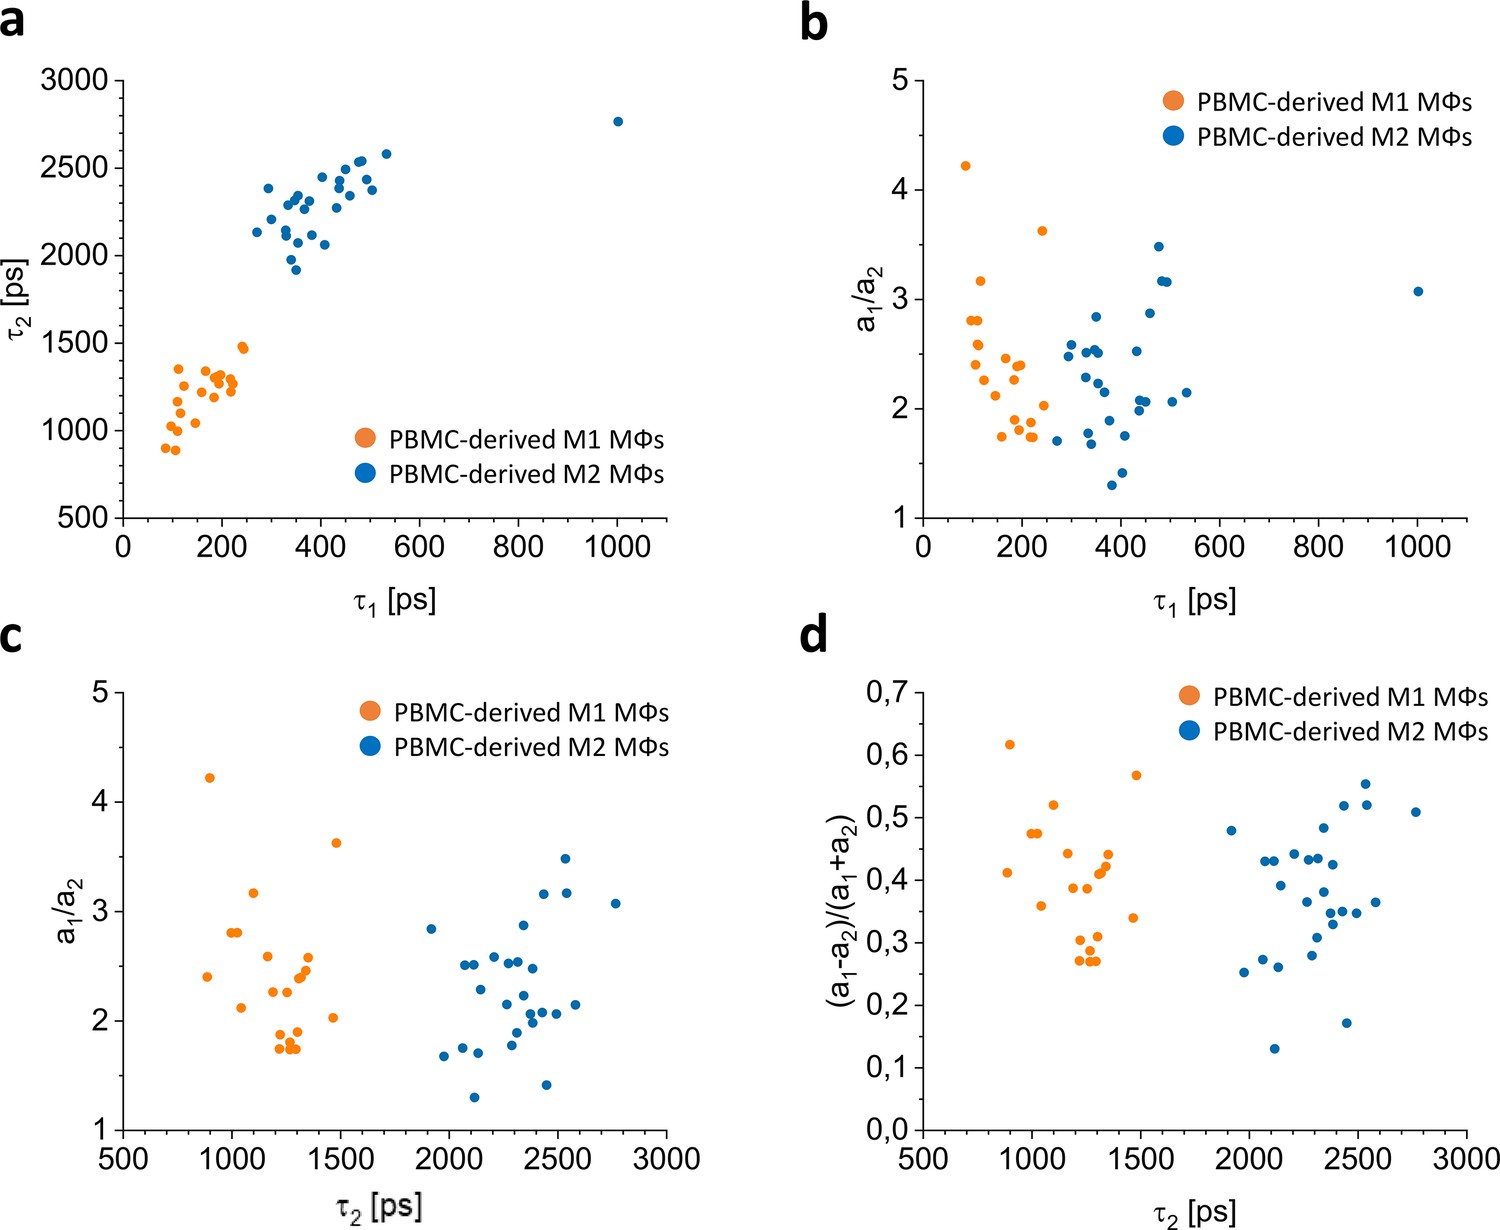
In vitro 2D segmentation for ΜΦs from PBMC.
2D segmentation of the τ1(τ2) (a), τ1(a1/a2) (b), τ2(a1/a2) (c), and τ2((a1–a2)/(a1+a2)) (d) TPE-FLIM parameters of the M1 ΜΦs (n=21, orange circles) and M2 ΜΦs (n=27, blue circles) measured in vitro.
Figure 2—figure supplement 3
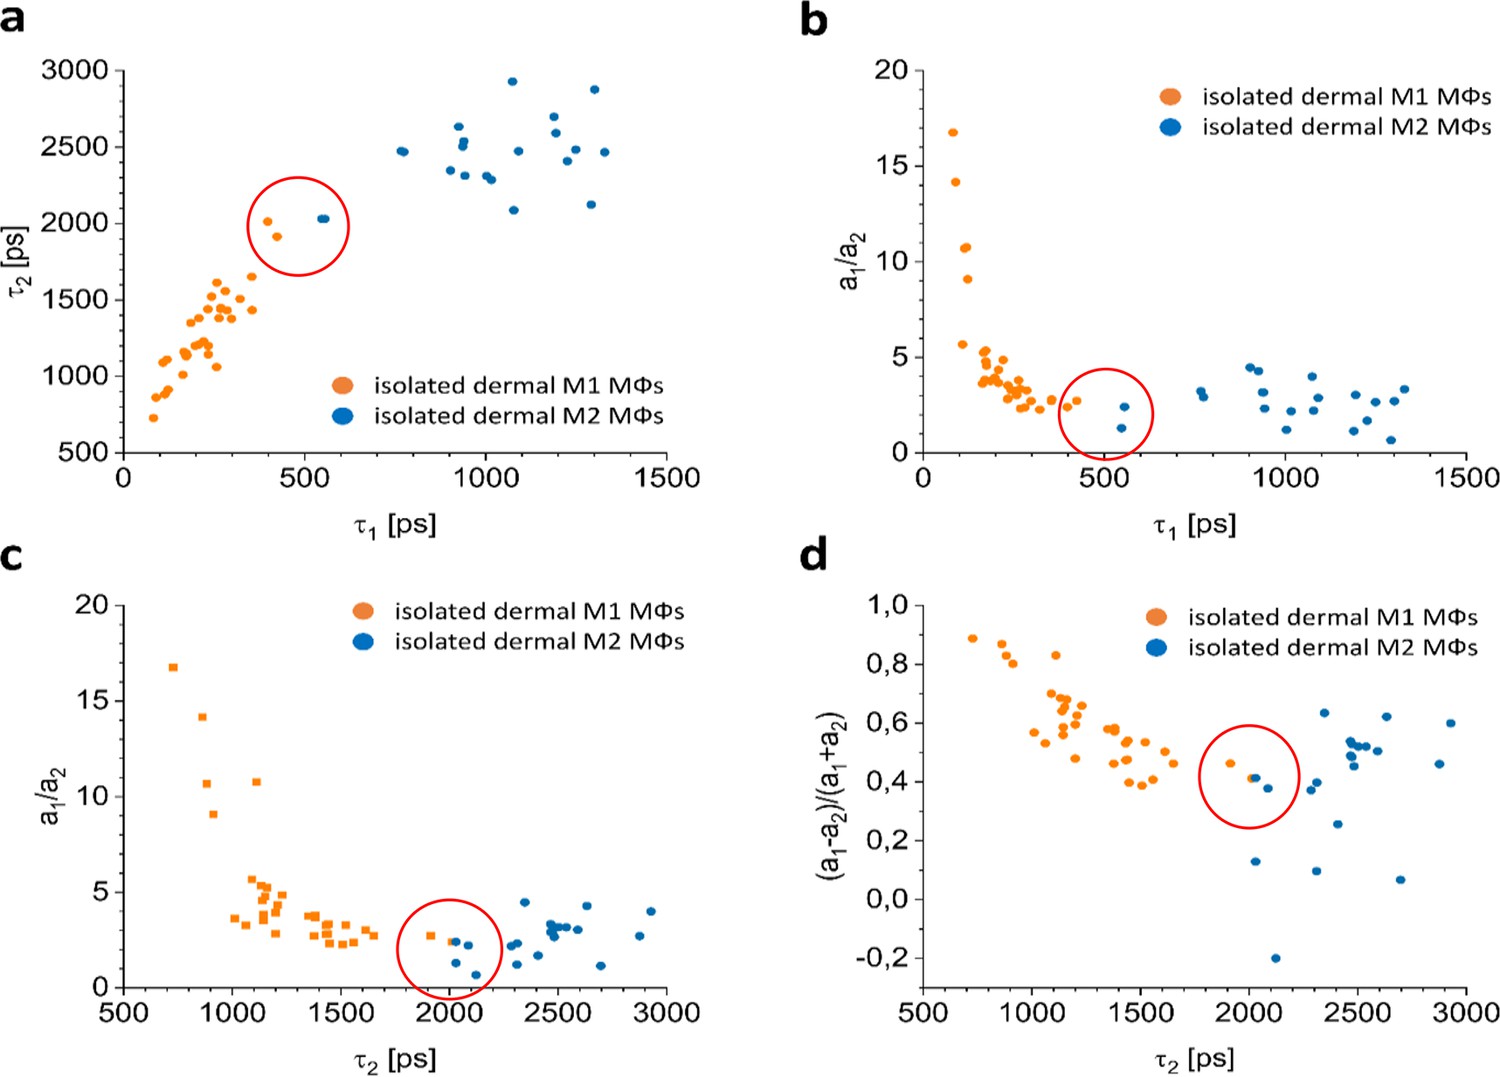
In vitro segmentation for ΜΦs from dermal tissue.
2D segmentation of the τ1(τ2) (a), τ1(a1/a2) (b), τ2(a1/a2) (c), and τ2((a1–a2)/(a1+a2)) (d) TPE-FLIM parameters of the M1 ΜΦs (n=34, orange circles) and M2 ΜΦs (n=28, blue circles) measured in vitro. Cells shown in red-marked areas were misidentified by the decision tree.
Figure 2—figure supplement 4
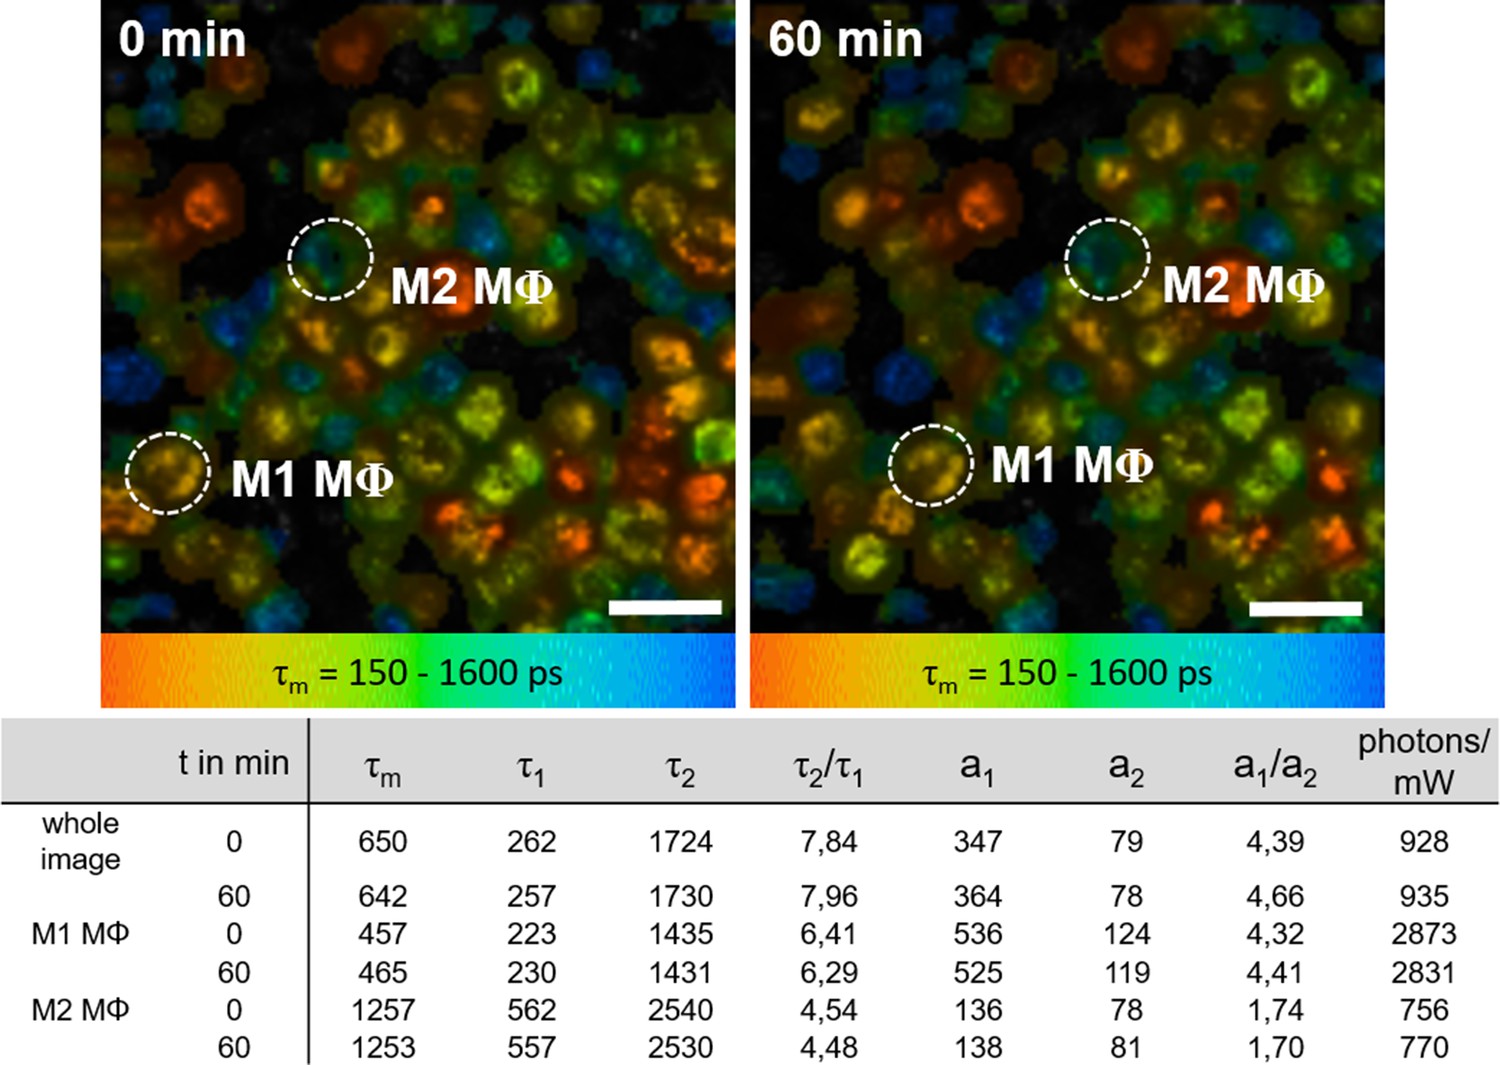
Time stability of TPE-FLIM parameters for ΜΦs isolated from periocular skin in vitro.
TPE-FLIM images of M1 and M2 ΜΦs in vitro (shown in dotted ovals) showing mean fluorescence lifetime τm in color gradient from 150 to 1600 ps recorded with the time interval of 60 min. Scale bar: 15 µm. The images were recorded at 760 nm excitation wavelength, 6 mW laser power and 6.8 s acquisition time. Additionally, the TPE-FLIM parameters shown below the images are in agreement with M1 and M2 ΜΦs shown in the Table 1.
Figure 3 with 2 supplements
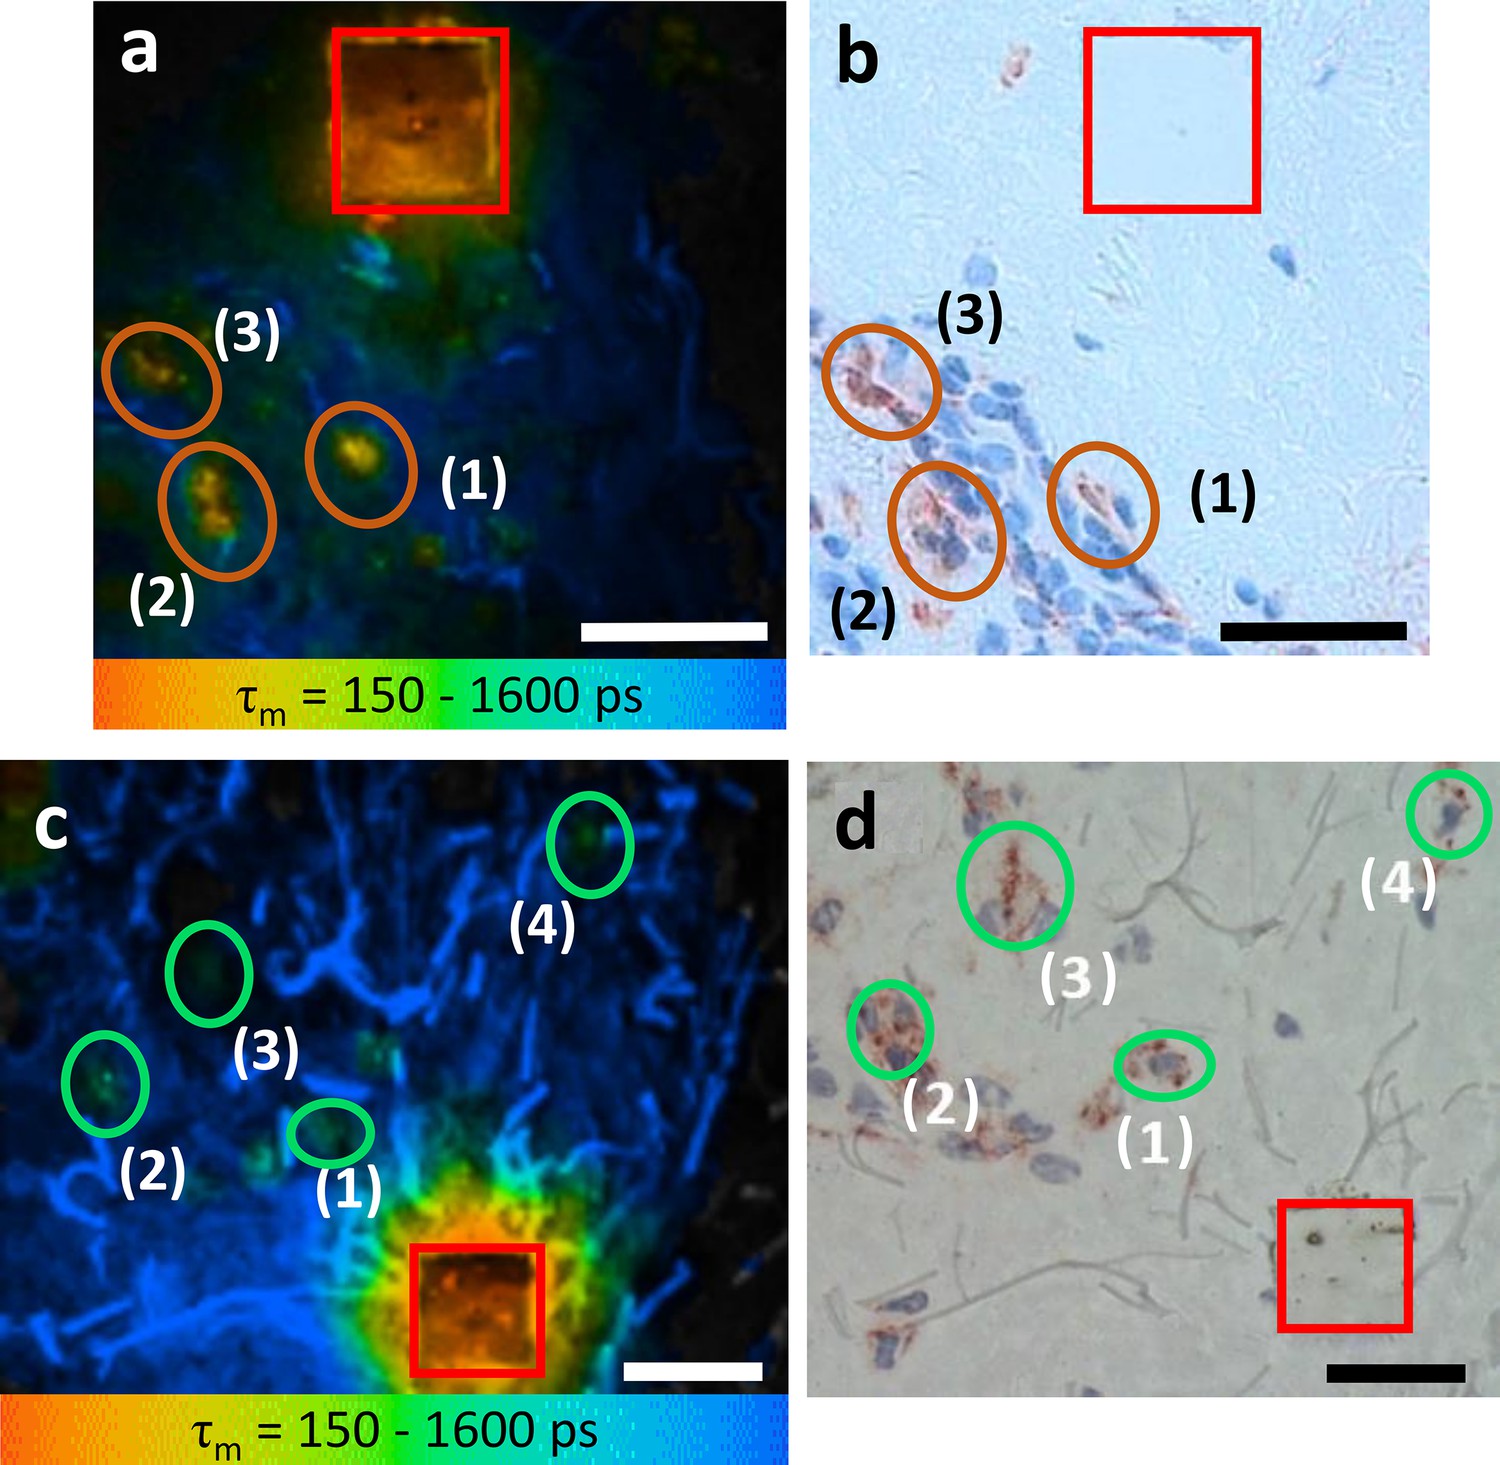
M1 and M2 ΜΦs ex vivo verified using TPE-FLIM parameters and immunohistochemistry-based bright field microscopy.
Side by side comparison of TPE-FLIM τm images (mean fluorescence lifetime τm in the 150–1600 ps range), which were measured label-free and then stained with CD68-antibody for M1 ΜΦs (a), and CD163-antibody for M2 ΜΦs (c) and corresponding bright field microscopic images (b) and (d). The excitation wavelength is 760 nm and laser power is 4 mW (a) and 2 mW (c). The M1 and M2 ΜΦs are marked with ellipses in (a, b) and in (c, d), respectively. The laser-burned labels (28×28 µm2) are marked in red. The suspected (a, c) and staining-proved (b, d) ΜΦs are marked with number (1, 2, 3, and 4). More M2 ΜΦs are observed in (d) compared to (c) due to the staining and visualization of the entire biopsy volume in (d) and limited imaging plane of the two-photon tomograph (1.2–2.0 µm) in (c). Images have been rotated and zoomed to match their orientation and size. Scale bar: 30 µm. TPE-FLIM, two-photon excited fluorescence lifetime imaging.
Figure 3—figure supplement 1
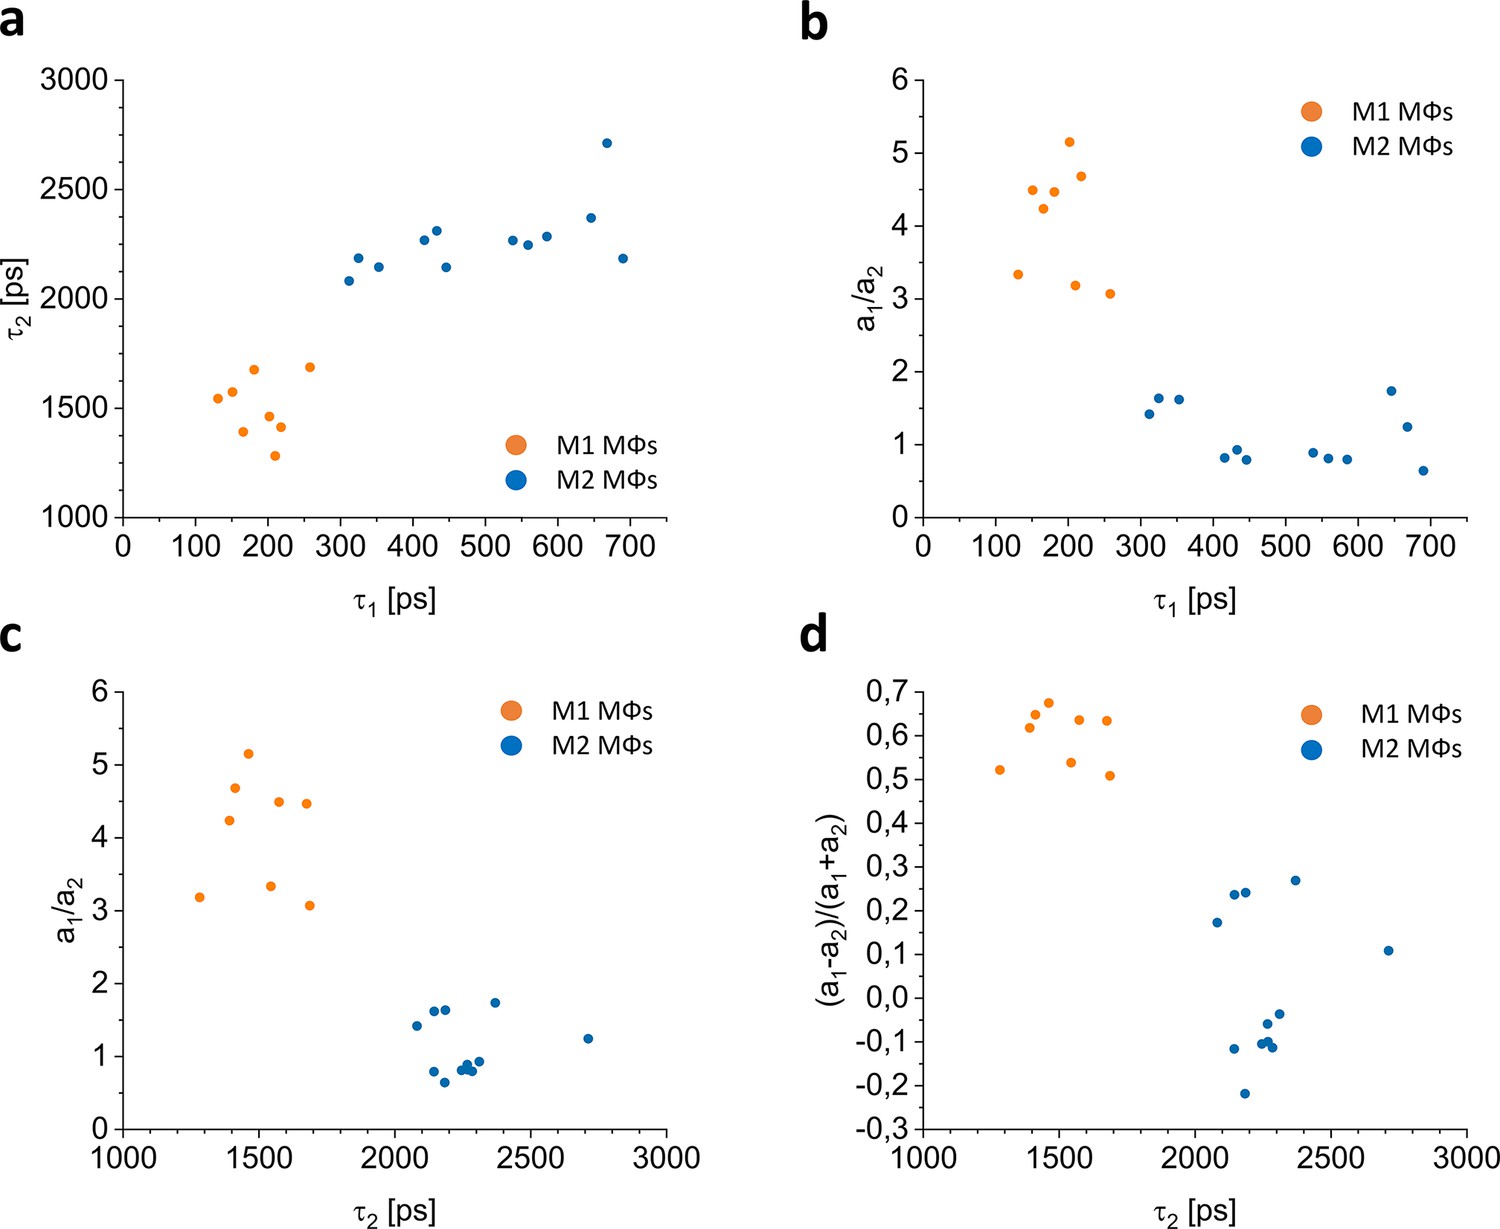
Ex vivo segmentation for ΜΦs from skin biopsies.
2D segmentation of the τ1(τ2) (a), τ1(a1/a2) (b), τ2(a1/a2) (c), and τ2((a1–a2)/(a1+a2)) (d) TPE-FLIM parameters of the M1 ΜΦs (n=8, orange circles) and M2 ΜΦs (n=12, blue circles) measured ex vivo.
Figure 3—figure supplement 2
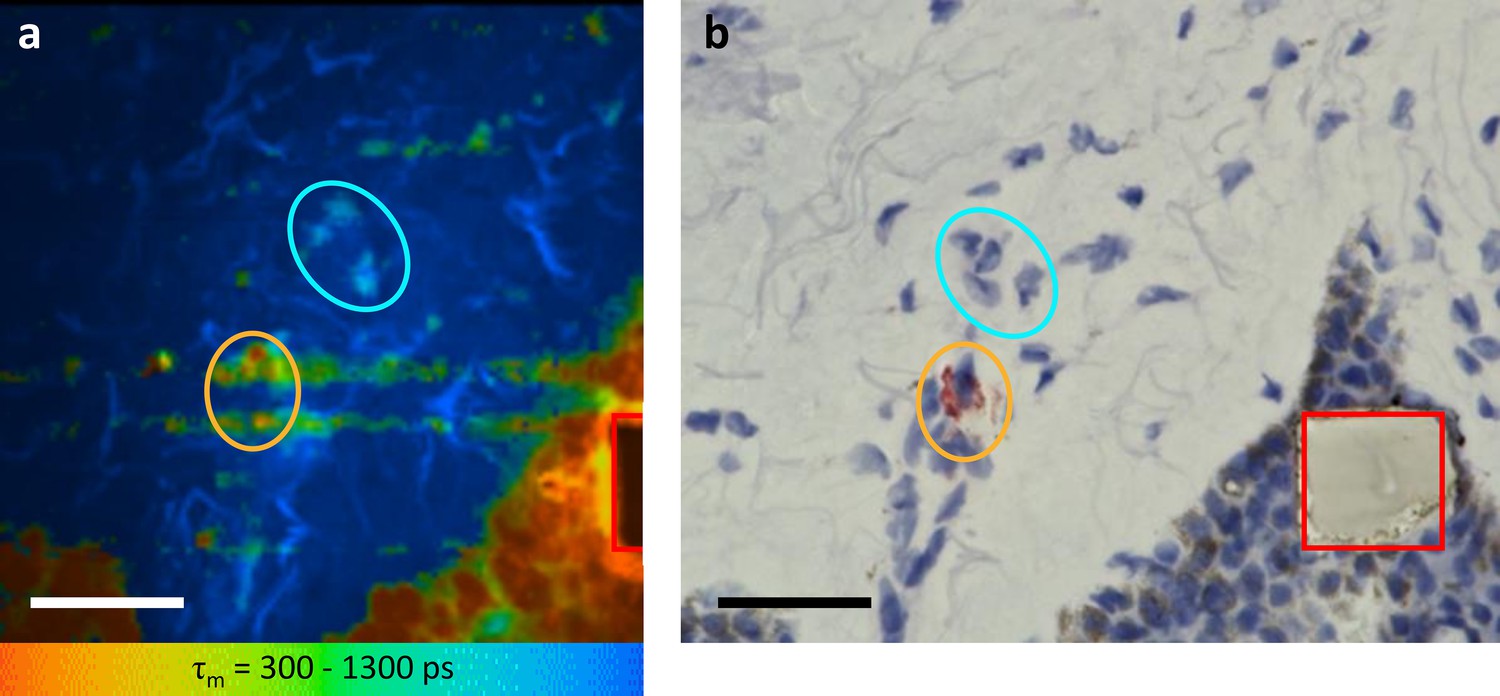
Mast cell-specific staining with tryptase ex vivo – negative control.
Side by side comparison of TPE-FLIM image (average lifetime τm in the 300–1300 ps range) (a) and corresponding light microscopic image after staining of human skin biopsy cryo-sections for MCs (b). Laser power is 3 mW, excitation at 760 nm. The MCs are marked with orange ellipses, suspected ΜΦs are marked with blue ellipses, and the laser burned squares (28×28 µm2) used for labeling are marked in red. Images have been rotated and zoomed to match the same orientation and size. Scale bar: 30 µm.
Figure 4 with 6 supplements
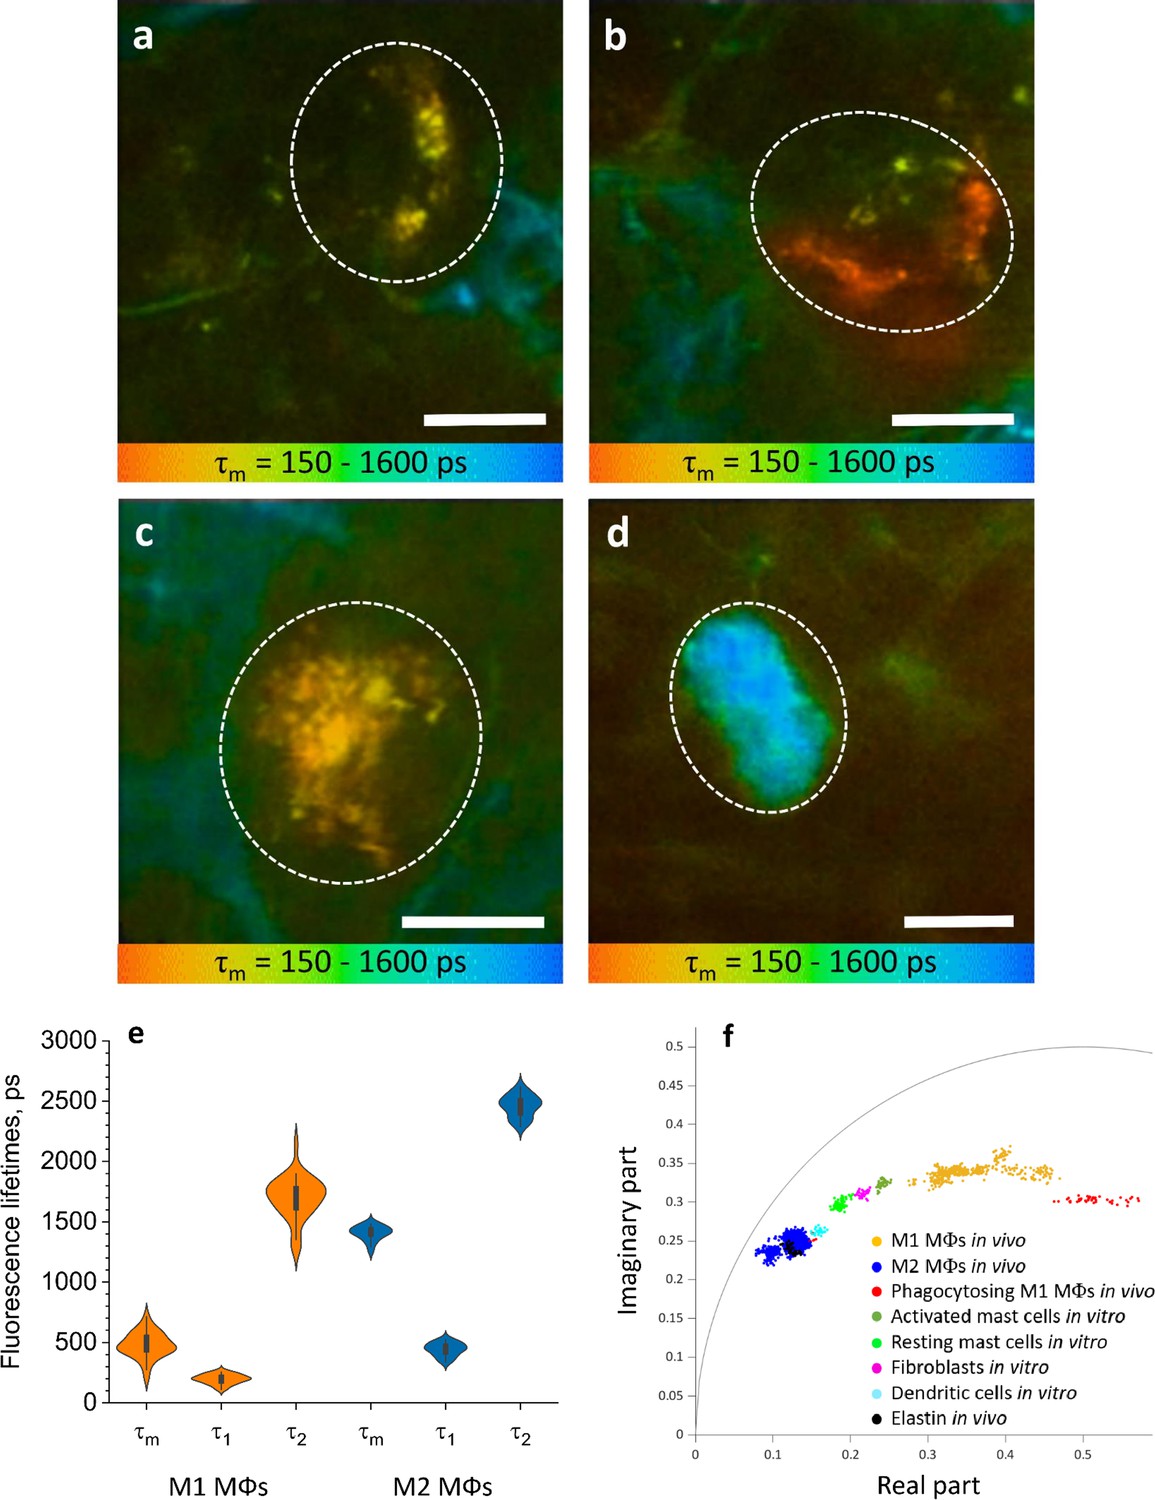
ΜΦs are visualized and categorised by TPE-FLIM signatures in vivo.
TPE-FLIM in vivo images of potential perivascular flat spindle shaped M1 ΜΦ (a), of suspected slightly dendritic M1 ΜΦ in the depth 90 µm (b) large intervascular M1 ΜΦ with membrane extensions (c) and in vivo dermal cells resembling M2 ΜΦ were observed with a significantly longer mean fluorescence lifetime τm compared to M1 ΜΦs and less pronounced TPE-AF intensity (d), showing mean fluorescence lifetime τm in color gradient from 150 to 1600 ps. Scale bar: 10 µm. The histogram shows the distribution of TPE-FLIM parameters for M1 ΜΦs (n=35, orange) and M2 ΜΦs (n=25, blue) measured in vivo in human skin (e). The boxplot represents 25–75% of the values. The phasor plot has a threshold at 0.9 of the maximum intensity and shows a summary of 12 M1, 2 phagocytosing M1 ΜΦs and 12 M2 ΜΦs in vivo (f), where M1 ΜΦs are in orange and M2 ΜΦs in blue and phagocytosing M1 ΜΦs in red, the other dermal components are shown from in vitro measurements. The in vivo images (a–d) were recorded at 760 nm excitation wavelength, 50 mW laser power and 6.8 s acquisition time, in the depth of 80–100 µm on the volar forearm skin area of 25 healthy human subjects. TPE-AF, two-photon excited autofluorescence; TPE-FLIM, two-photon excited fluorescence lifetime imaging.
Figure 4—figure supplement 1
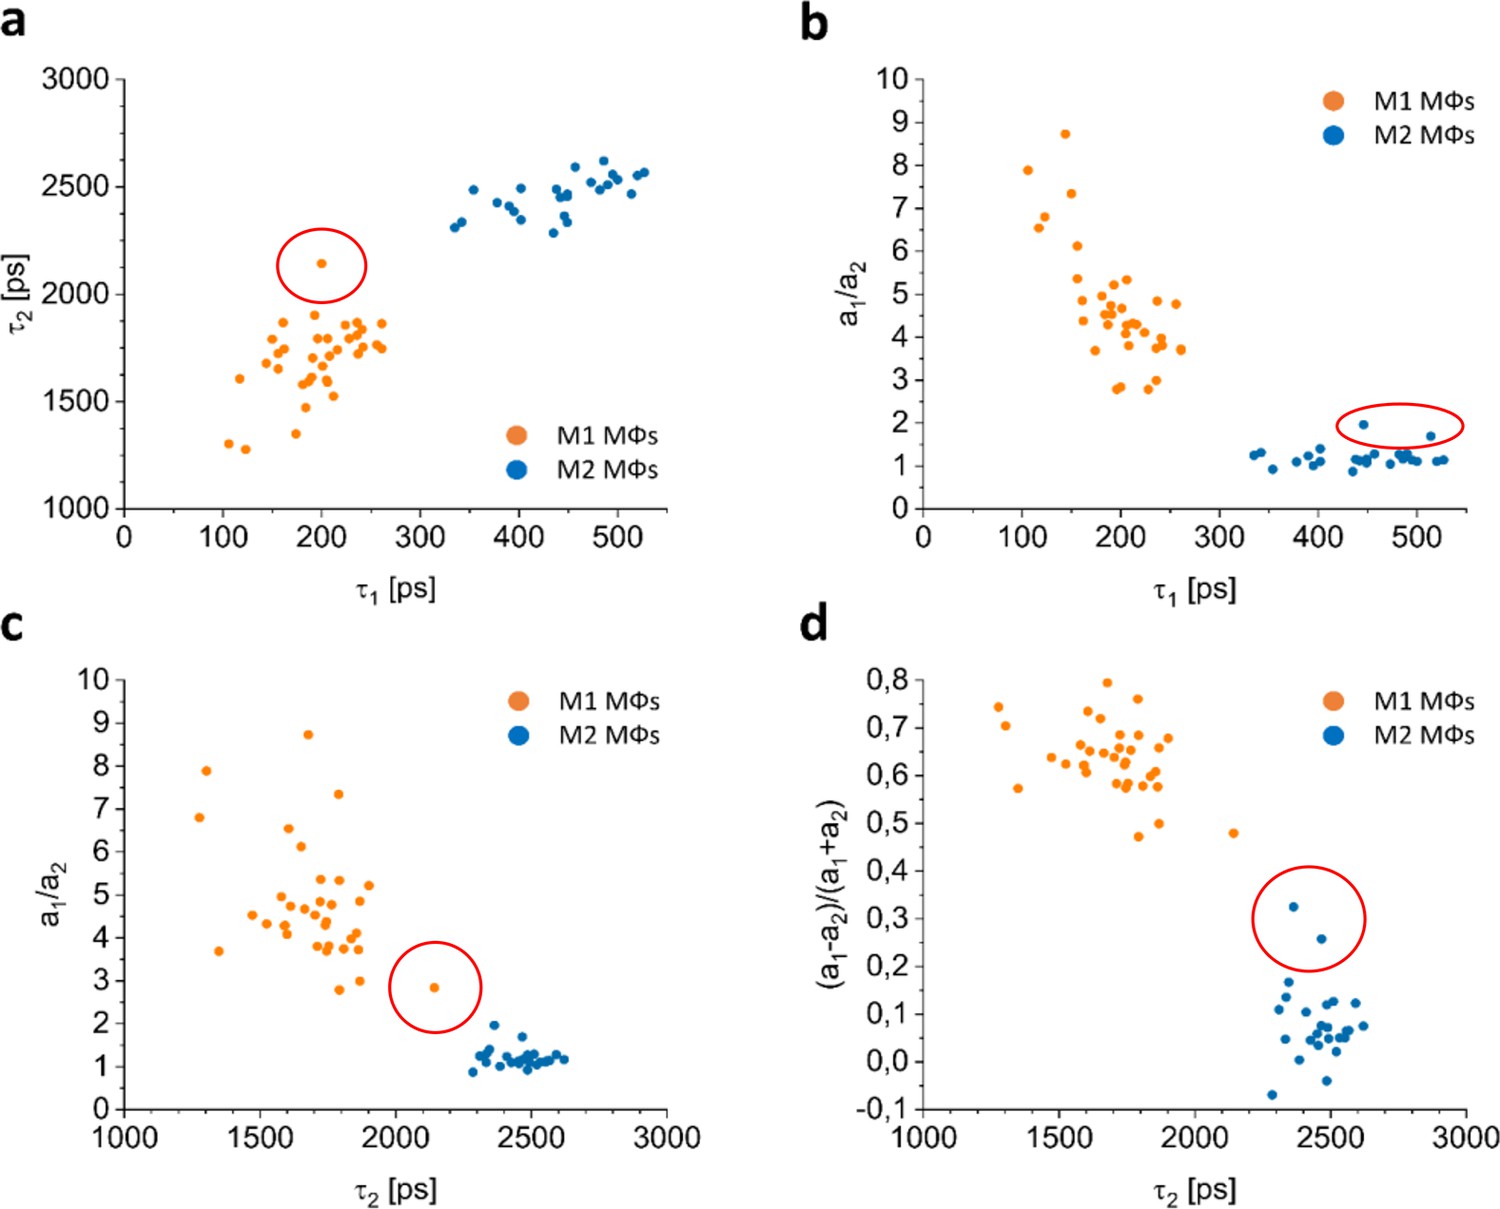
In vivo segmentation for ΜΦs in human skin.
2D segmentation of the τ1(τ2) (a), τ1(a1/a2) (b), τ2(a1/a2) (c), and τ2((a1–a2)/(a1+a2)) (d) TPE-FLIM parameters of the M1 ΜΦs (orange circles) and M2 ΜΦs (blue circles) measured in vivo. Cells shown in red-marked areas were misidentified by the decision tree.
Figure 4—figure supplement 2
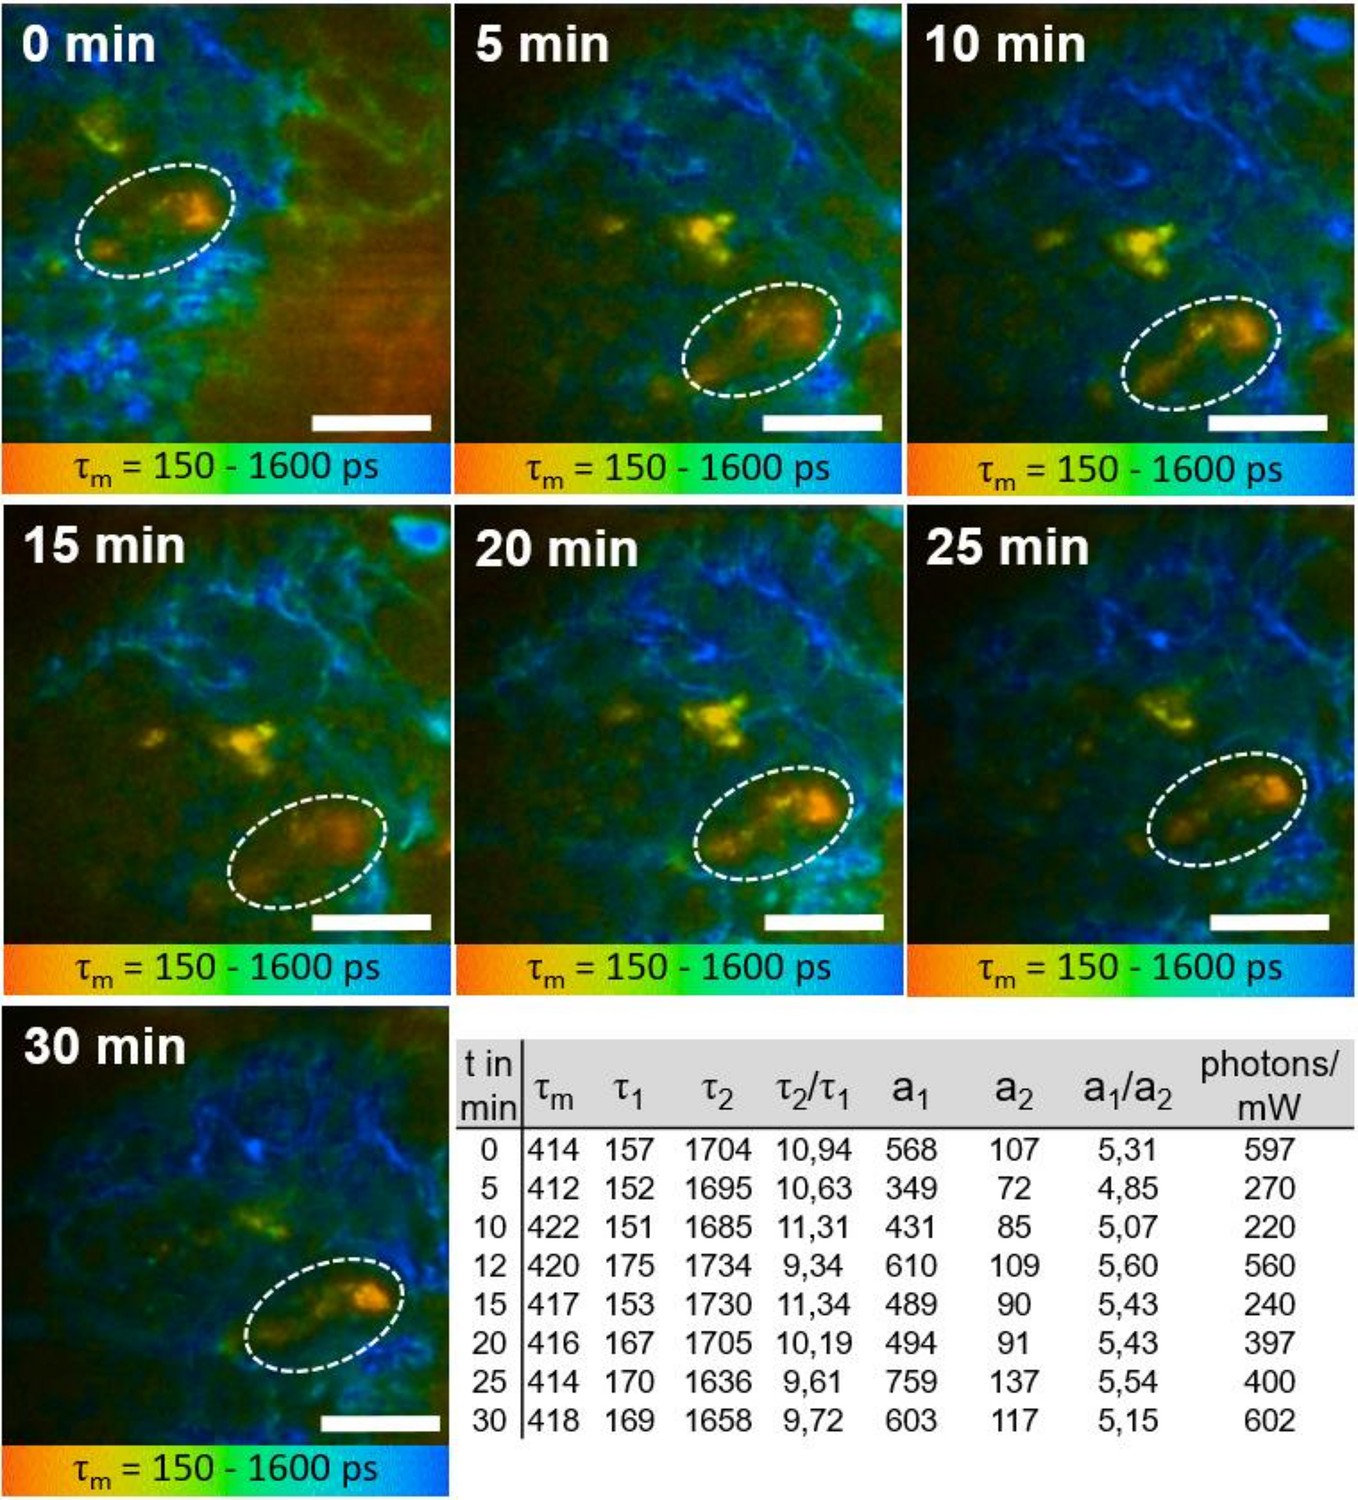
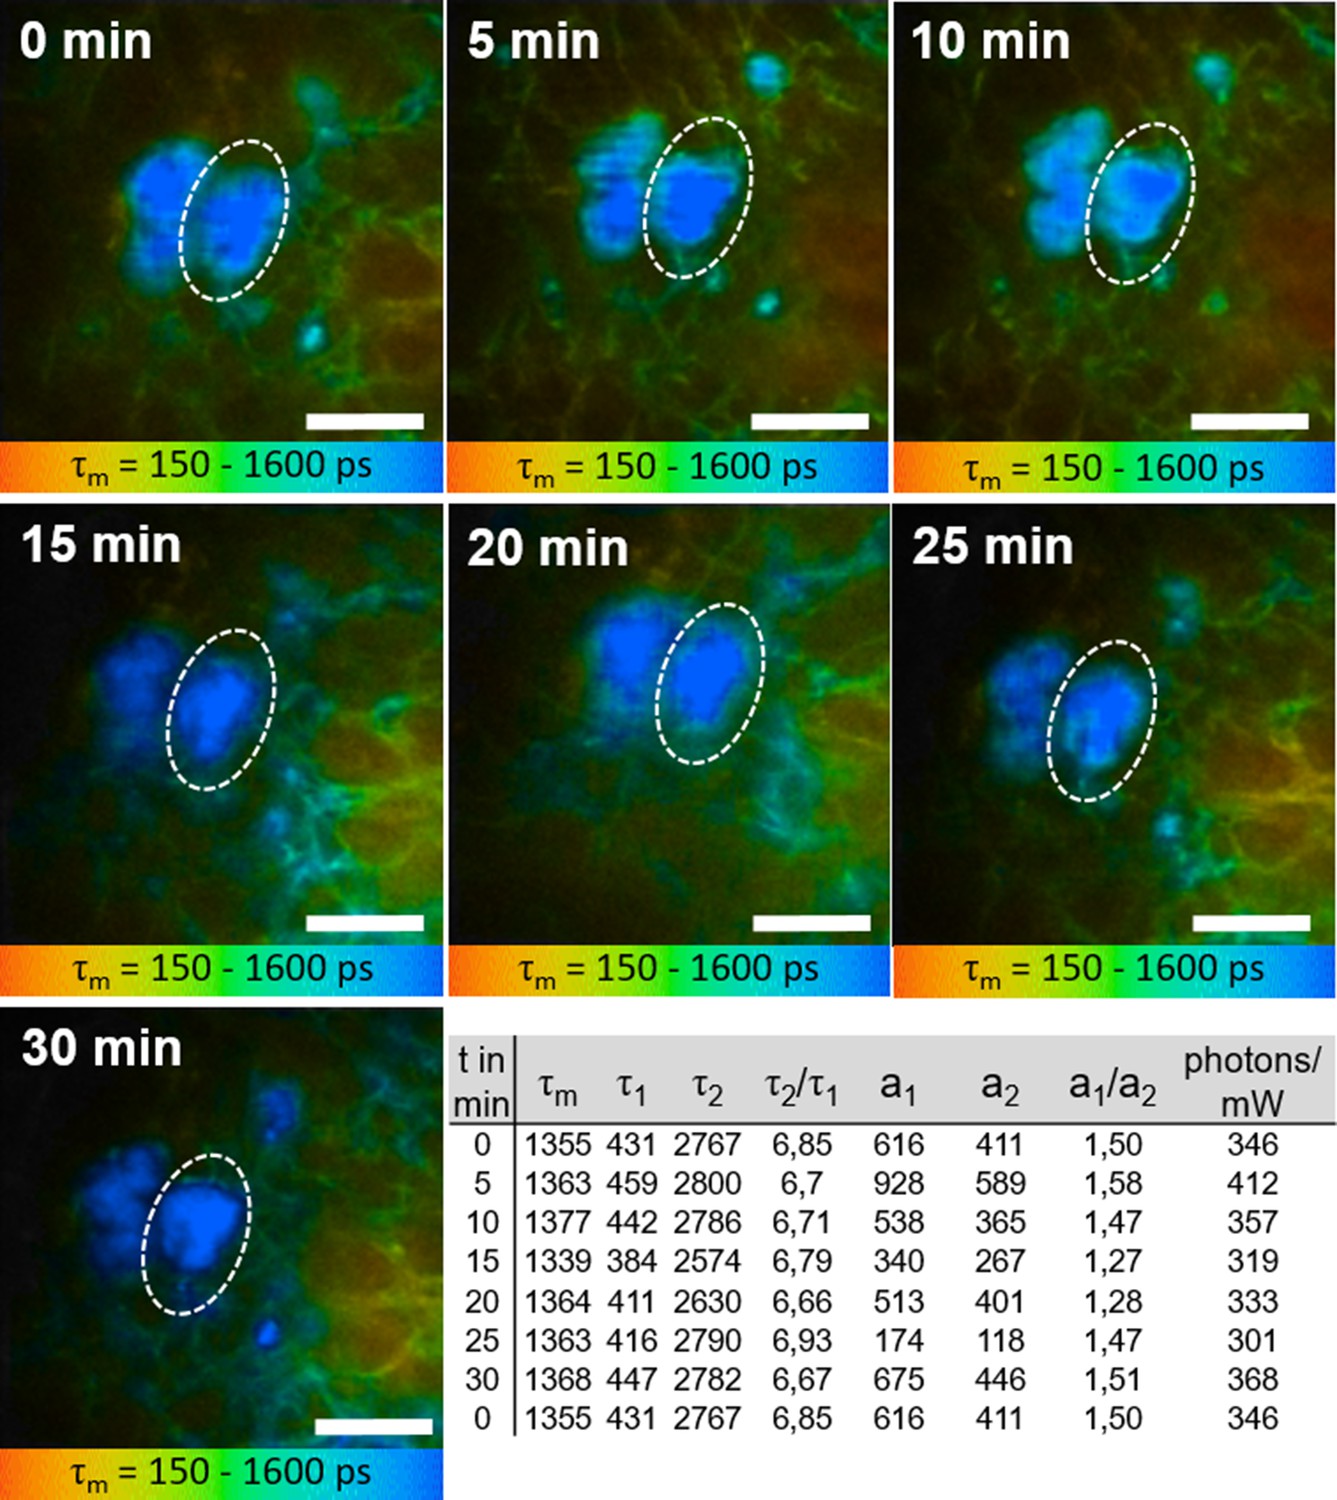
Time stability of TPE-FLIM parameter for M1 ΜΦ in vivo.
TPE-FLIM images recorded in 5-min interval for 30 min of M1 ΜΦ measured in vivo in human papillary dermis at the depth 90 µm showing mean fluorescence lifetime τm in color gradient from 150 to 1600 ps. The M1 ΜΦ is marked with the white dotted ellipse. Scale bar: 20 µm. The images were recorded at 760 nm excitation wavelength, 50 mW laser power, and 6.8 s acquisition time on the plantar forearm. Additionally, the TPE-FLIM parameters shown below the images are in agreement with M1 ΜΦs shown in the Table 1.
Figure 4—figure supplement 3
Time stability of TPE-FLIM parameter for M2 ΜΦ in vivo.
TPE-FLIM images recorded in 5-min interval for 30 min of M2 ΜΦ measured in vivo in human papillary dermis at the depth 96 µm showing mean fluorescence lifetime τm in colour gradient from 150 to 1600 ps. The M2 ΜΦ is marked with the white dotted ellipse. Scale bar: 20 µm. The images were recorded at 760 nm excitation wavelength, 50 mW laser power, and 6.8 s acquisition time on the plantar forearm. Additionally, the TPE-FLIM parameters shown below the images are in agreement with M2 MΦs shown in the Table 1.
Figure 4—figure supplement 4
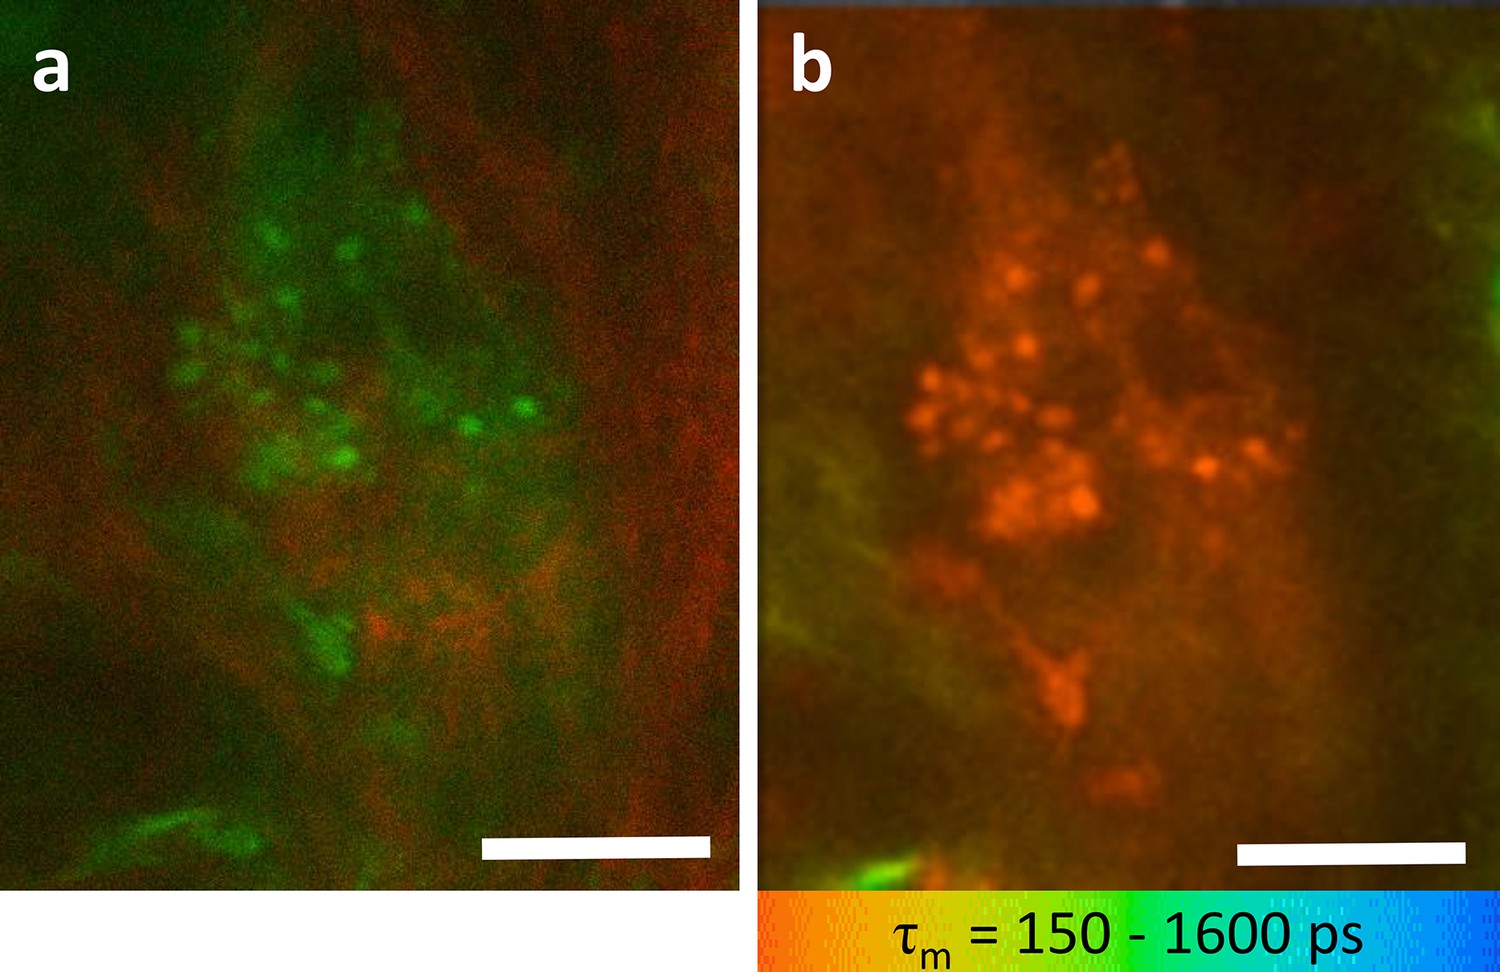
TPE-FLIM allows for visualization of potentially phagocytosing M1 ΜΦs in vivo.
Merged TPE-AF (green) and SHG (red) image of possibly activated (phagocytosing) M1 ΜΦ measured in vivo in human papillary dermis at the depth 105 µm (a) and corresponding TPE-FLIM image (b), showing mean fluorescence lifetime τm in color gradient from 150 to 1600 ps. Scale bar: 10 µm. The images were recorded at 760 nm excitation wavelength, 50 mW laser power, and 6.8 s acquisition time on the plantar forearm.
Figure 4—figure supplement 5

Decision tree model.
Decision tree model for classification of M1 and M2 ΜΦs with the parameters entropy impurity, minimal samples for split is 2, maximum depth of the tree is 9, and the samples had equal weight. The text of the decision tree is readable when zoomed in.
Figure 4—figure supplement 6
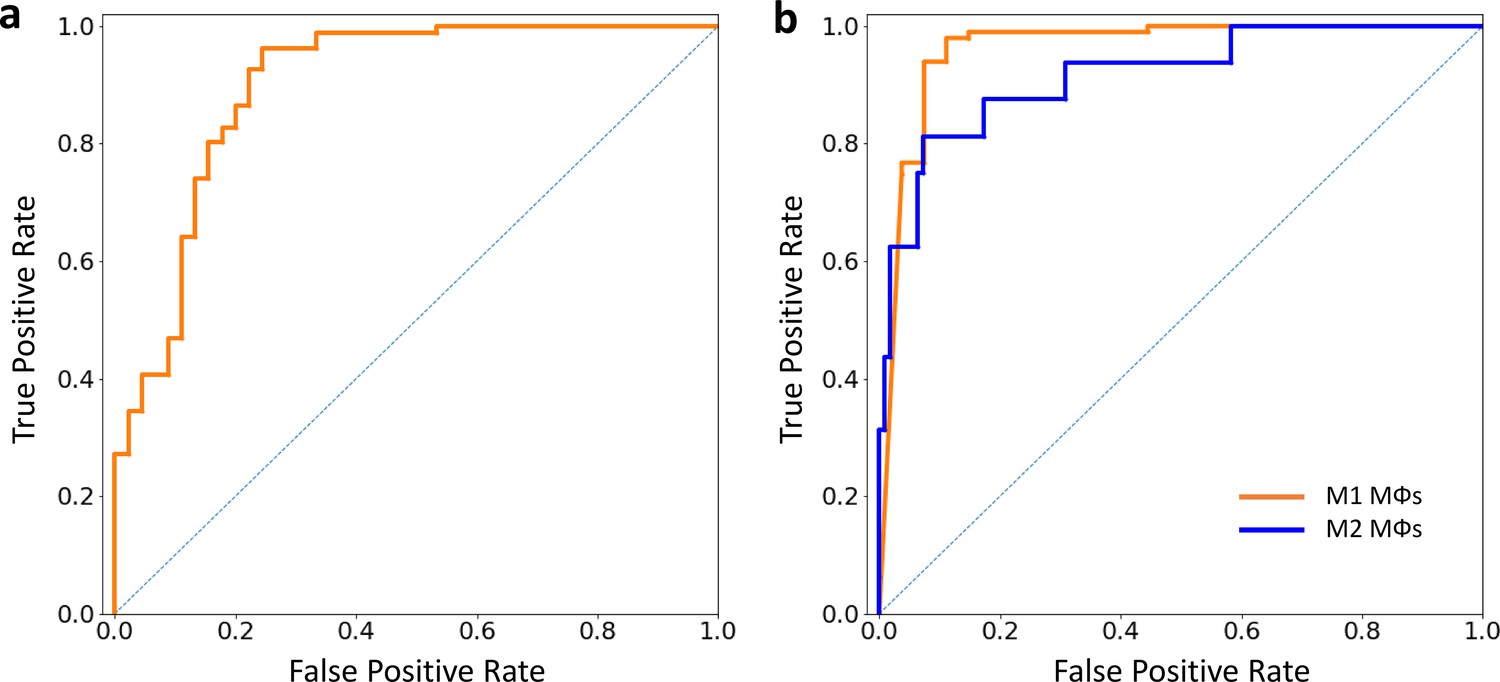
ROC curves of decision tree models.
ROC curves of false positive to false negative rates for classification of ΜΦs versus other dermal cells (a) and for classification of M1 ΜΦs (orange line) versus M2 ΜΦs and other dermal cells and for classification of M2 ΜΦs (blue line) versus M1 ΜΦs and other dermal cells (b) generated from the decision tree classifier (Figure 4—figure supplement 5).
Appendix 1—figure 1
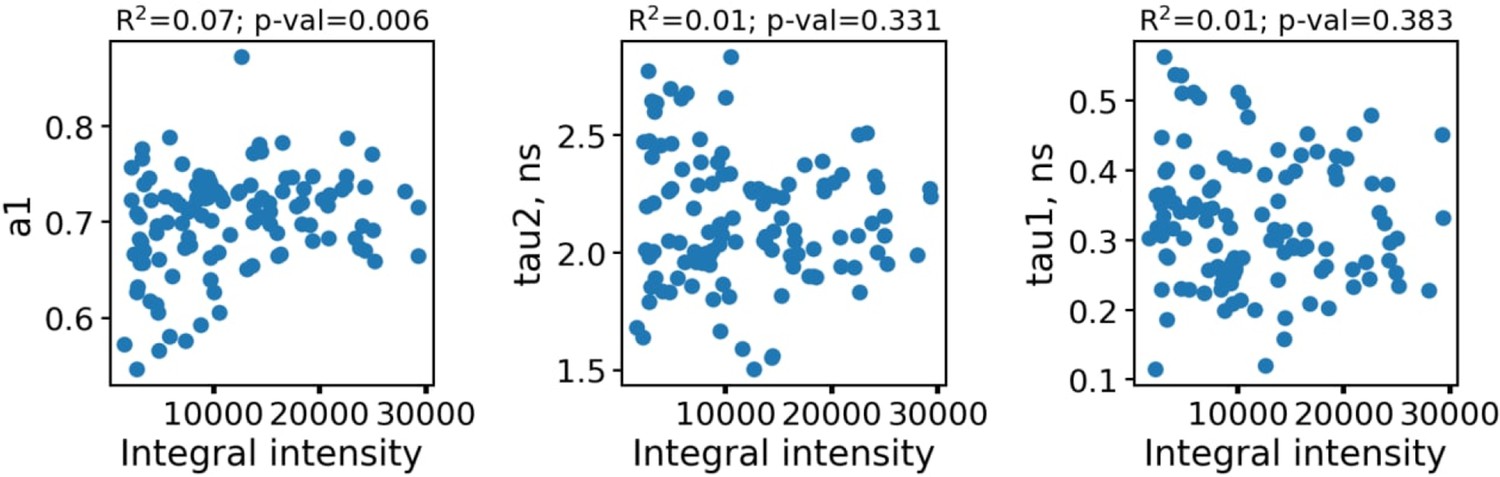
The dependence of fluorescence decay parameters for individual macrophages (n=110) on the integral fluorescence intensity (area under the fluorescence decay curve, upper row).
As can be seen, the fluorescence decay parameters were independent on the intensity. To further confirm the absence of artefacts connected with parameters dependence on the FLIM data quality and processing algorithms, in Appendix 1—figure 2 the dependence of fluorescence decay curves parameters on χ2 is shown.
Appendix 1—figure 2
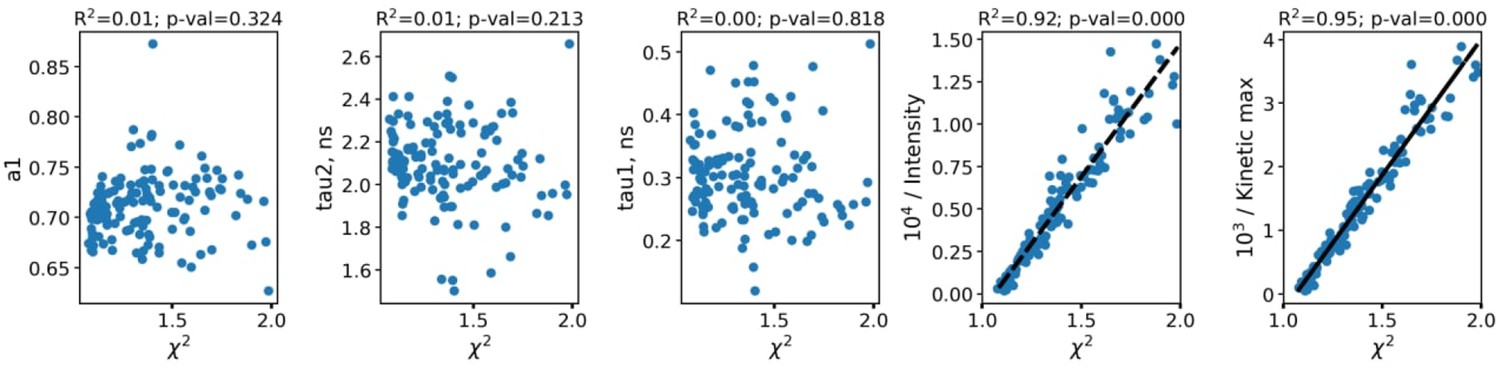
The dependence of fluorescence decay curves parameters on χ2.
Each point corresponds to an individual macrophage cell (n=110). The dependence of χ2 on fluorescence intensity (both integral intensity per pixel and amplitude of the fluorescence decay curve, kinetic max) is a textbook knowledge—lower signal-to-noise ratio results in a worse fitting quality and higher χ2. Importantly, there was no correlation between the fluorescence decay parameters obtained from the decay curves and χ2; hence, there were no artifacts like lower fitting quality results in lower (or higher) values of fluorescence decay parameters. Summarizing, the fluorescence decay parameters obtained from bi-exponential fitting were independent on intensity (number of photons per pixel) and fitting quality, thus making it possible to use them as the descriptors for classification of cells. The comparison of fitting of the fluorescence decay for macrophages with two and three exponents ( Appendix 1—figure 3). As can be seen, an increase of the number of components does not result in an increase of the fitting quality.
Appendix 1—figure 3
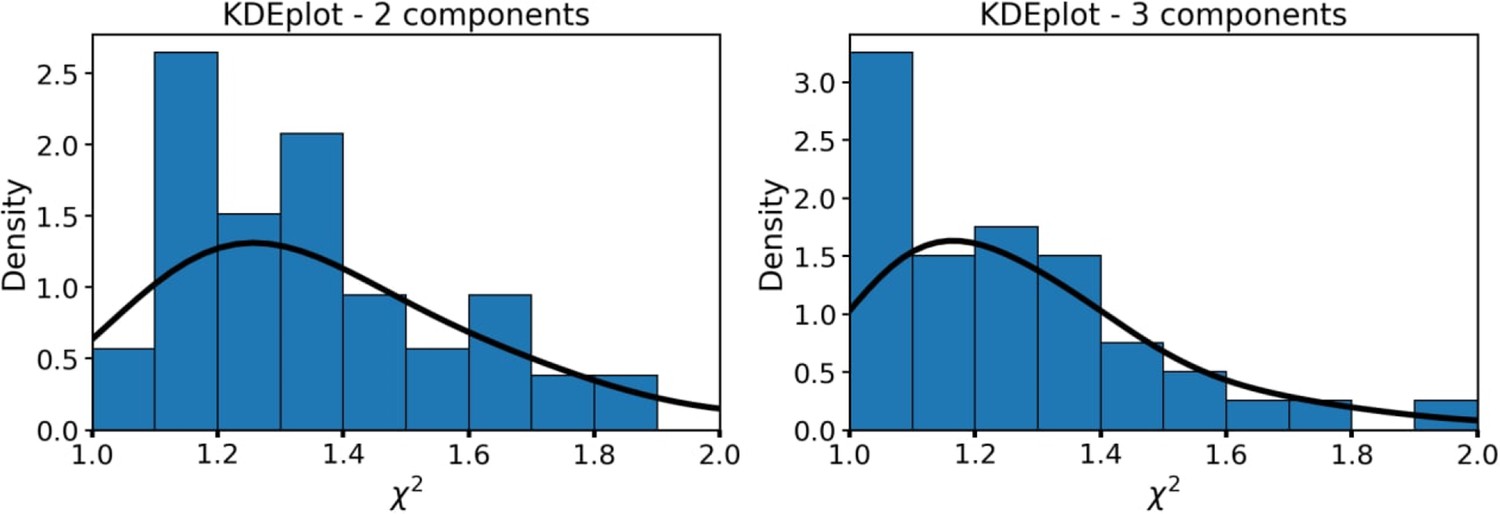
Distribution of the χ² for the bi-exponential (left) model and three-exponential (right) decay models.
Author response image 1

Fluorescence decay curves for individual macrophages, from which the values of τ1 < 300 ps (left) and τ1 > 300 ps (right) were obtained using the biexponential decay model.
The black curve corresponds to IRF of the setup. The curves were normalized to the maximum.
Author response image 2
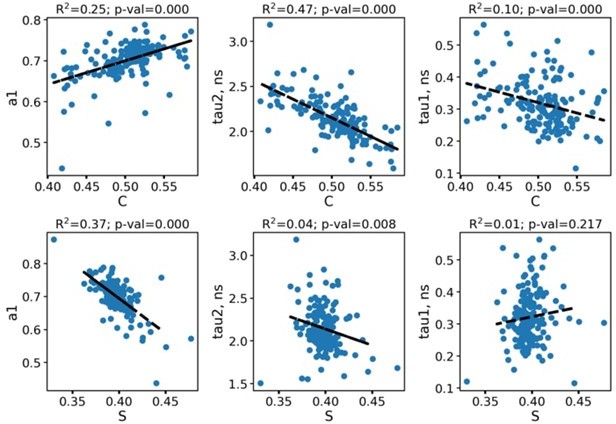
Correlations between the phasor plot parameters (c and s) and fluorescence decay parameters obtained from the biexponential fitting.
Each point corresponds to an individual macrophage.
Tables
Table 1
TPE-FLIM parameters for investigated dermal and epidermal cells.
TPE-FLIM parameters τ1, τ2, τm, a1/a2 and TPE-AF intensity of monocyte-derived M1 and M2 ΜΦs; dermal M1 and M2 ΜΦs isolated from the skin measured in vitro; M1 (CD68) and M2 (CD163) ΜΦs measured ex vivo in human skin cryo-sections; M1 and M2 ΜΦs observed on the forearm of healthy volunteers in vivo; monocytes; resting and activated human skin mast cells; dendritic cells; fibroblasts and neutrophils in vitro.
| Number of cells | τm in ps | τ1in ps | τ2in ps | a1/a2 | TPE-AF intensity, photons /mW | |||
|---|---|---|---|---|---|---|---|---|
| in vitro | Monocyte-derived M1-polarised ΜΦs | 21 | 479±106 | 163±50 | 1,209±161 | 2.4±0.6 | 600±100 | |
| in vitro | Monocyte-derived M2-polarised ΜΦs | 27 | 1,185±170 | 417±134 | 2,305±194 | 2.3±0.5 | 500±100 | |
| in vitro | M1 isolated dermal ΜΦs | 34 | 461±175 | 225±84 | 1,289±278 | 4.8±3.4 | 3,000±500 | |
| in vitro | M2 isolated dermal ΜΦs | 28 | 1,281±155 | 807±250 | 2,352±229 | 2.2±1.1 | 800±200 | |
| ex vivo | M1 ΜΦs (CD68) | 8 | 458±50 | 190±38 | 1,504±133 | 4.1±0.7 | 3,000±500 | |
| ex vivo | M2 ΜΦs (CD163) | 12 | 1,369±201 | 498±129 | 2,267±155 | 1.1±0.4 | 700±300 | |
| in vivo | M1 ΜΦs | 35 | 477±105 | 196±40 | 1,698±172 | 5.0±2.8 | 686±165 | |
| in vivo | Phagocytosing M1 ΜΦs | 2 | 195±44 | 105±10 | 1,272±89 | 14.7±4.5 | 1,100±150 | |
| in vivo | M2 ΜΦs | 25 | 1,407±60 | 442±54 | 2,458±90 | 1.2±0.2 | 360±155 | |
| in vitro | PBMC-derived monocytes | 15 | 989±111 | 491±130 | 2,025±301 | 1.8±0.5 | 700±130 | |
| in vitro | Resting mast cells | 43 | 1,248±287 | 533±266 | 2,289±317 | 1.5±0.5 | 1,300±400 | |
| in vitro | Activated mast cells | 13 | 862±268 | 288±130 | 1,920±287 | 2.5±2.0 | 900±200 | |
| in vitro | Dendritic cells | 14 | 1,265±180 | 434±188 | 2,578±328 | 1.6±0.2 | 538±258 | |
| in vitro | Fibroblasts | 6 | 921±81 | 429±51 | 1,983±137 | 0.5±0.1 | 469±137 | |
| in vitro | Neutrophils | 21 | 1,074±109 | 714±250 | 1,795±600 | 1.5±0.5 | 500±115 | |
Additional files
Download links
A two-part list of links to download the article, or parts of the article, in various formats.
Downloads (link to download the article as PDF)
Open citations (links to open the citations from this article in various online reference manager services)
Cite this article (links to download the citations from this article in formats compatible with various reference manager tools)
Label-free imaging of M1 and M2 macrophage phenotypes in the human dermis in vivo using two-photon excited FLIM
eLife 11:e72819.
https://doi.org/10.7554/eLife.72819


