Neurotoxin-mediated potent activation of the axon degeneration regulator SARM1
- John van Geest Centre for Brain Repair, Department of Clinical Neurosciences, University of Cambridge, United Kingdom
- Department of Clinical Sciences (DISCO), Section of Biochemistry, Polytechnic University of Marche, Italy
- School of Chemistry and Molecular Biosciences, Institute for Molecular Bioscience and Australian Infectious Diseases Research Centre, University of Queensland, Australia
- Institute for Glycomics, Griffith University, Australia
- Neuroscience, BioPharmaceuticals R and D, AstraZeneca, United States
Figures
Figure 1
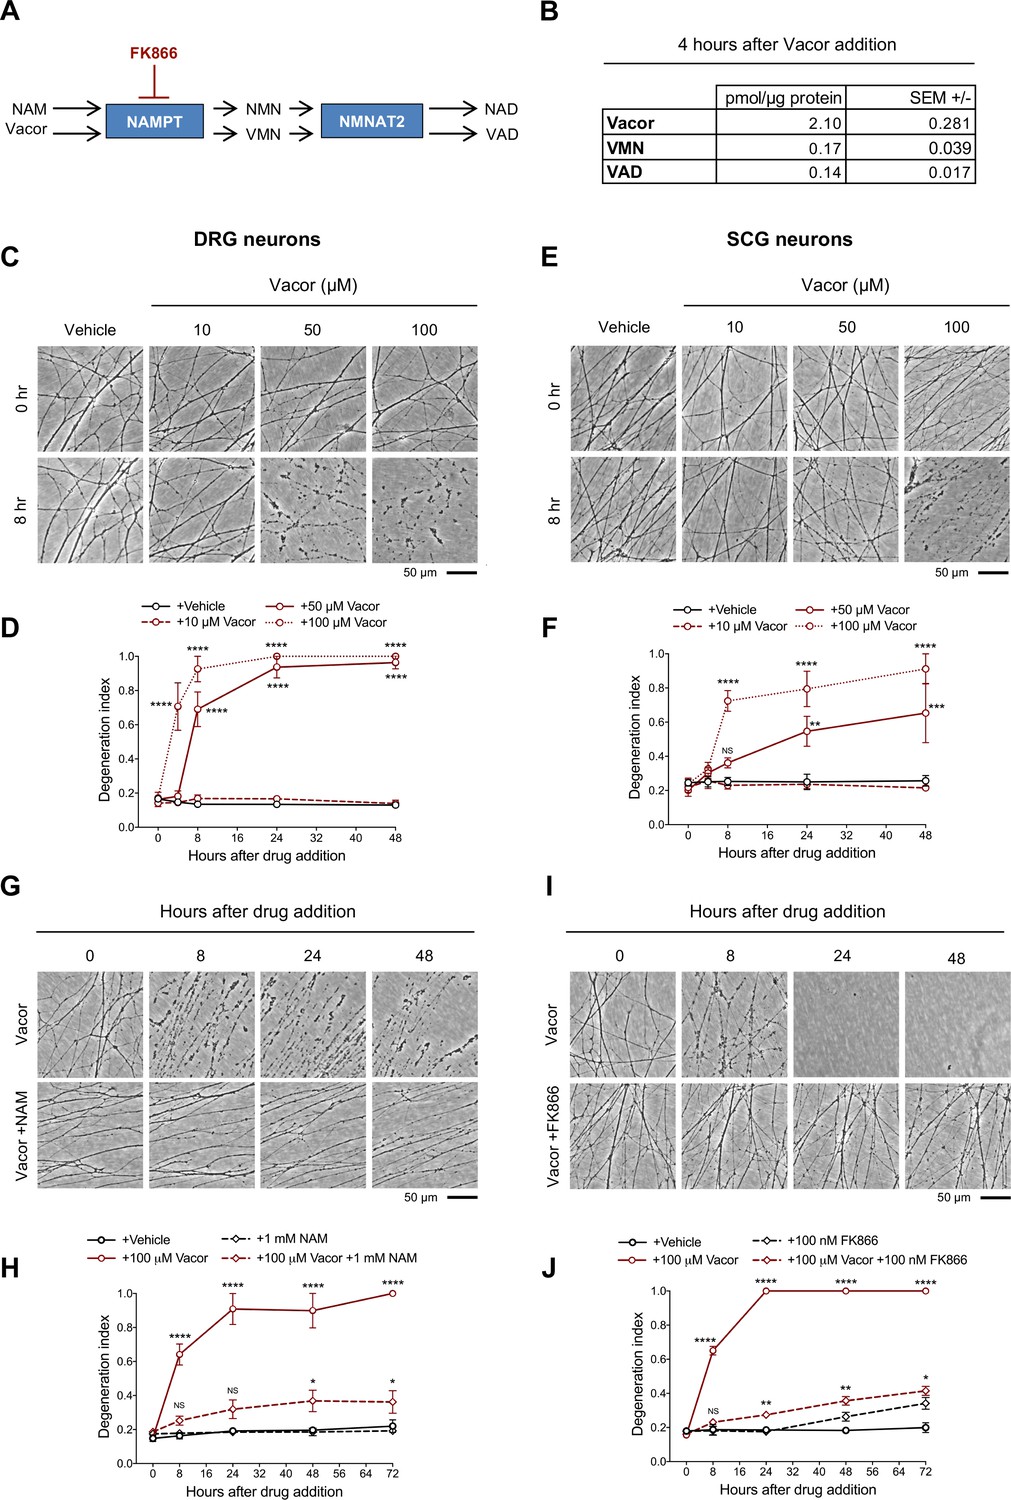
Vacor causes neurite degeneration in primary mouse neurons.
(A) Schematic representation of vacor conversion into VMN and VAD by NAMPT and NMNAT2, respectively. VAD has been reported to inhibit NMNAT2 (Buonvicino et al., 2018). Vacor competes with NAM for NAMPT. High doses of NAM or inhibition of NAMPT with FK866 prevent vacor conversion into downstream metabolites (NAM, nicotinamide; NMN, nicotinamide mononucleotide; NAD, nicotinamide adenine dinucleotide; NAMPT, nicotinamide phosphoribosyltransferase; NMNAT2, nicotinamide mononucleotide adenylyltransferase 2; VMN, vacor mononucleotide; VAD, vacor adenine dinucleotide). (B) Vacor, VMN and VAD levels in wild-type DRG whole explant cultures (neurites and cell bodies) 4 hr after 50 µM vacor treatment (mean ± SEM; n = 3). (C) Representative images of neurites from wild-type DRG explant cultures treated with 10, 50, 100 µM vacor or vehicle. (D) Quantification of the degeneration index in experiments described in (C) (mean ± SEM; n = 3; repeated measures two-way ANOVA followed by Tukey’s multiple comparison test; ****, p < 0.0001; statistical significance shown relative to +Vehicle). (E) Representative images of neurites from wild-type SCG explant cultures treated with 10, 50, 100 µM vacor or vehicle. (F) Quantification of the degeneration index in experiments described in (E) (mean ± SEM; n = 3; repeated measures two-way ANOVA followed by Tukey’s multiple comparison test; ****, p < 0.0001; ***, p < 0.001; **, p < 0.01; NS, not-significant; statistical significance shown relative to +Vehicle). (G) Representative images of neurites from wild-type SCG explant cultures treated with 100 µM vacor or 100 µM vacor +1 mM NAM. (H) Quantification of the degeneration index in experiments described in (G) (mean ± SEM; n = 3; repeated measures two-way ANOVA followed by Tukey’s multiple comparison test; ****, p < 0.0001; *, p < 0.05; NS, not-significant; statistical comparisons shown are: +100 µM Vacor vs +100 µM Vacor +1 mM NAM and +1 mM NAM vs +100 µM Vacor +1 mM NAM). (I) Representative images of neurites from wild-type SCG explant cultures treated with 100 µM vacor, 100 nM FK866 or vehicle. (J) Quantification of the degeneration index in experiments described in (I) (mean ± SEM; n = 3; repeated measures two-way ANOVA followed by Tukey’s multiple comparison test; ****, p < 0.0001; **, p < 0.01; *, p < 0.05; NS, not-significant; statistical comparisons shown are: +100 µM Vacor vs +100 µM Vacor +100 nM FK866 and +100 nM FK866 vs +100 µM Vacor +100 nM FK866). Source data for Figure 1—source data 1.
-
Figure 1—source data 1
Vacor causes neurite degeneration in primary mouse neurons.
- https://cdn.elifesciences.org/articles/72823/elife-72823-fig1-data1-v2.xlsx
Figure 2 with 2 supplements
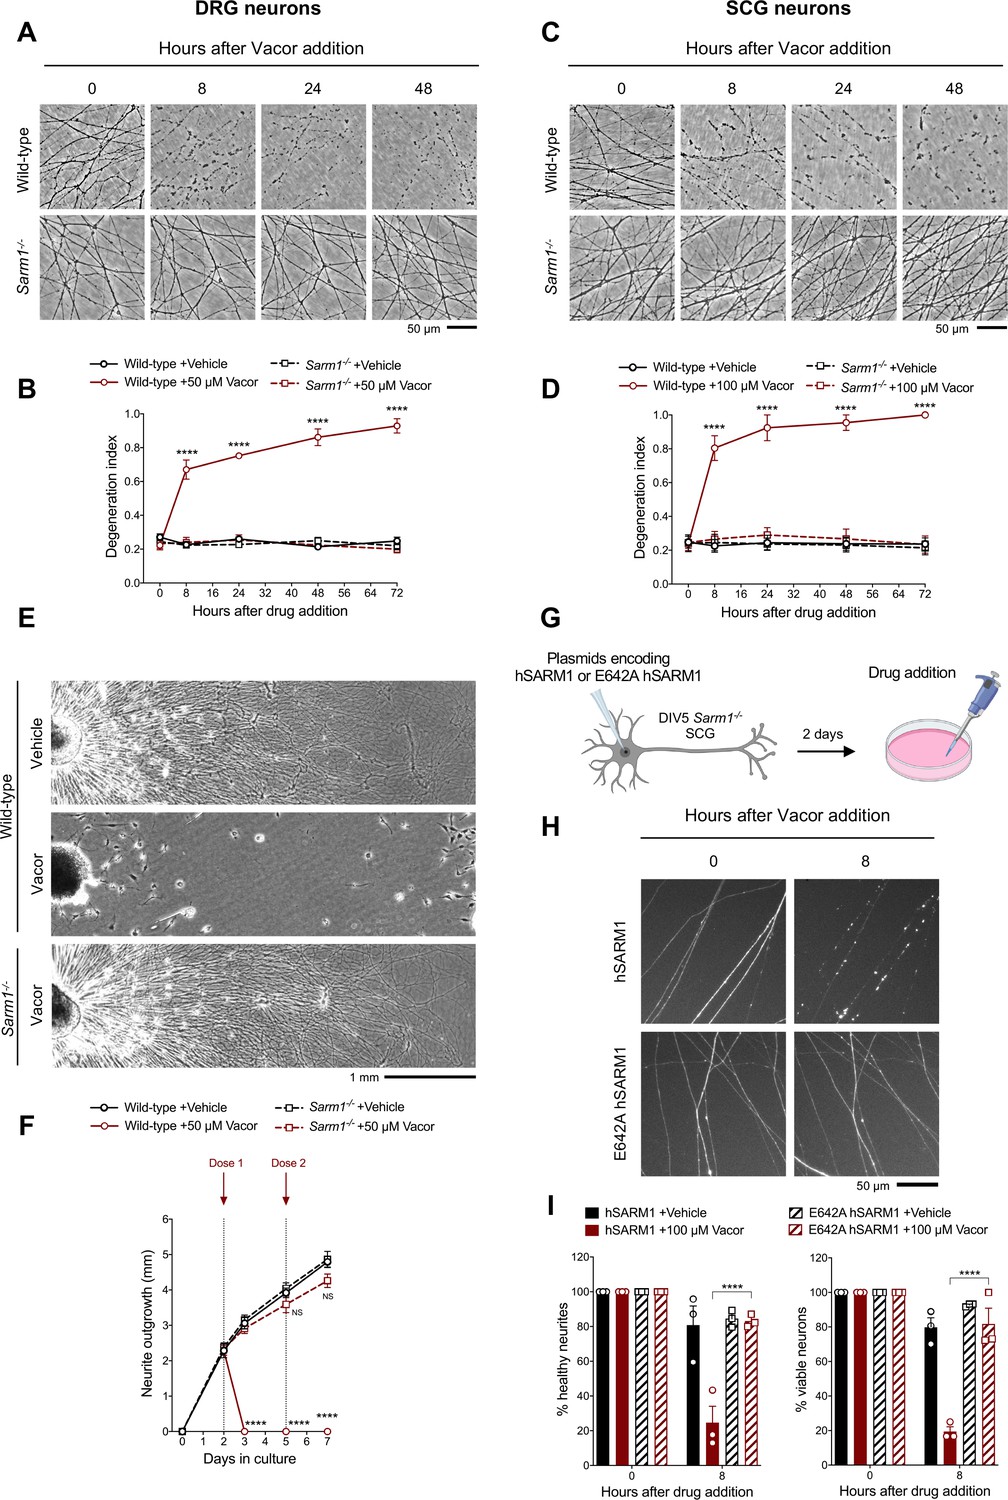
Vacor causes SARM1-dependent neurite and cell death.
(A) Representative images of neurites from wild-type and Sarm1-/- DRG (littermates) explant cultures treated with 50 µM vacor. (B) Quantification of the degeneration index in experiments described in (A) (mean ± SEM; n = 4; repeated measures three-way ANOVA followed by Tukey’s multiple comparison test; ****, p < 0.0001; statistical significance shown relative to Sarm1-/- +50 µM Vacor). (C) Representative images of neurites from wild-type and Sarm1-/- SCG explant cultures treated with 100 µM vacor. (D) Quantification of the degeneration index in experiments described in (C) (mean ± SEM; n = 4; repeated measures three-way ANOVA followed by Tukey’s multiple comparison test; ****, p < 0.0001; statistical significance shown relative to Sarm1-/- +100 µM Vacor). (E) Representative images of neurite outgrowth at DIV7 from wild-type and Sarm1-/- DRG explant cultures treated with 50 µM vacor or vehicle. Multiple doses of vacor or vehicle were added at DIV2 and DIV5. (F) Quantification of neurite outgrowth in (E) (mean ± SEM; n = 5; repeated measures three-way ANOVA followed by Tukey’s multiple comparison test; ****, p < 0.0001; NS, not-significant; statistical significance shown relative to Wild-type +Vehicle). (G) Schematic representation of the experimental design for (H) (‘Created with BioRender’). (H) Representative images of neurites from Sarm1-/- SCG dissociated neurons co-injected with plasmids encoding wild-type or E642A hSARM1 and DsRed (to label neurites) and treated with 100 µM vacor. (I) Quantification of healthy neurites and viable neurons in experiments in (H) is shown as a percentage relative to 0 hr (time of drug addition) (mean ± SEM; n = 3; repeated measures three-way ANOVA followed by Tukey’s multiple comparison test; ****, p < 0.0001). Source data for Figure 2—source data 1.
-
Figure 2—source data 1
Vacor causes SARM1-dependent neurite and cell death.
- https://cdn.elifesciences.org/articles/72823/elife-72823-fig2-data1-v2.xlsx
Figure 2—figure supplement 1
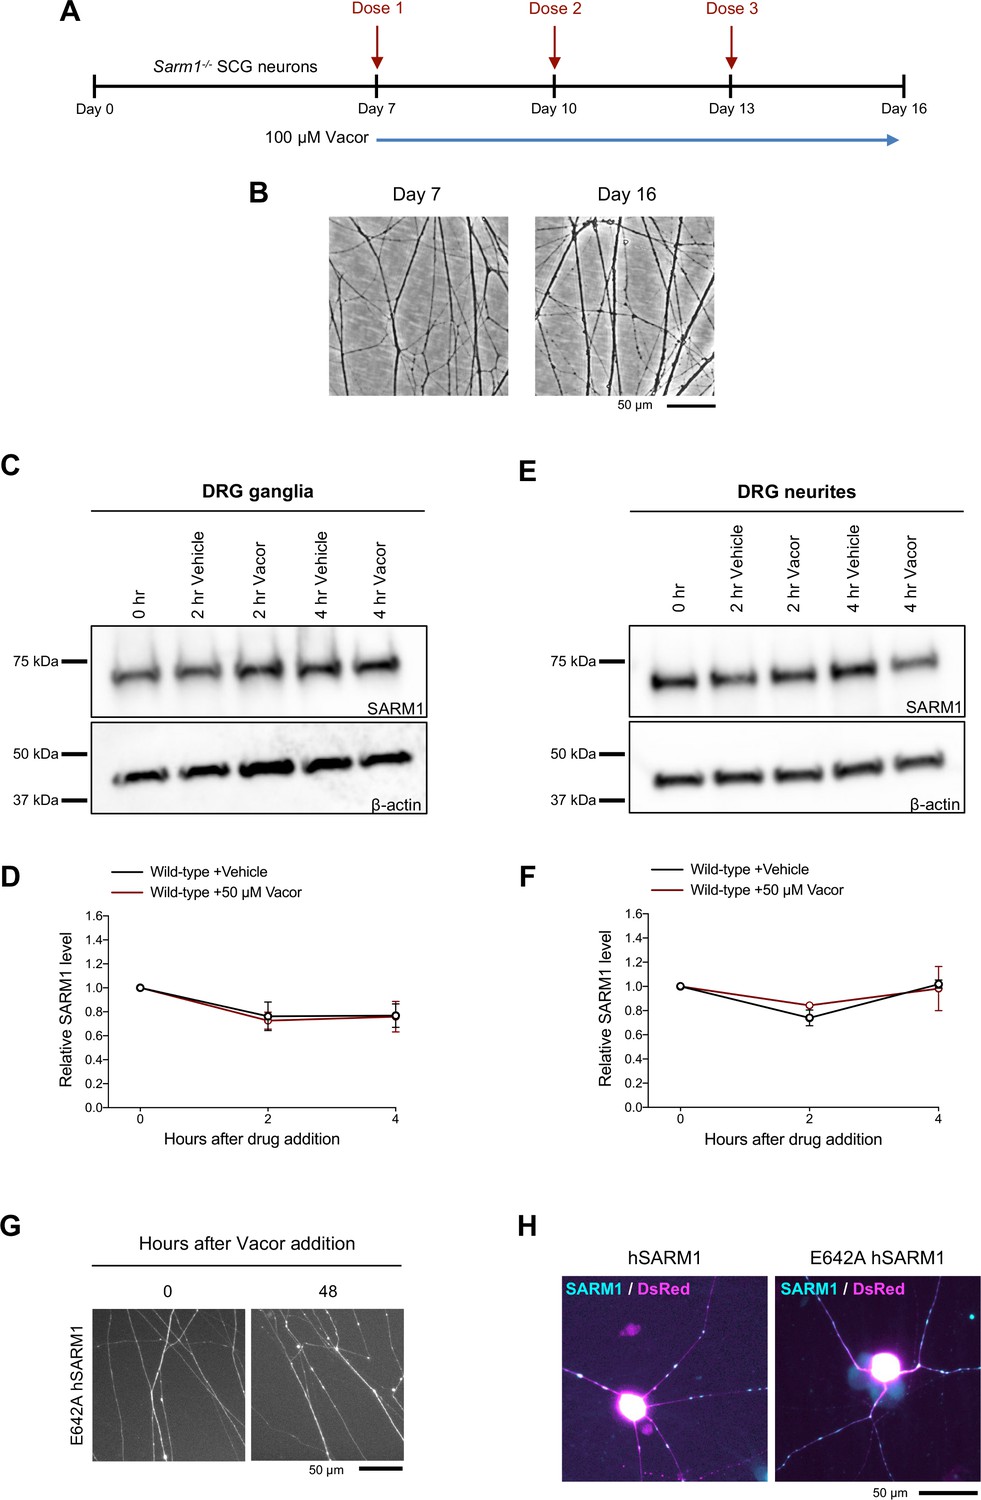
Long-term survival of Sarm1-/- SCG neurites following multiple vacor doses.
(A) Schematic representation of the experimental design. Sarm1-/- SCG explant cultures were treated with 100 µM vacor at DIV7. Multiple doses of vacor were administered by replacing the media every 3 days with fresh media containing vacor. (B) Representative images of neurites from Sarm1-/- SCG explant cultures showing no degeneration at 16 days, after treatment with three doses of 100 µM vacor. (C) Representative immunoblots of the ganglia fraction from wild-type DRG explant cultures at the indicated time points after 50 µM vacor or vehicle probed for SARM1 and β-actin (loading control). (D) Quantification of normalised SARM1 level (to β-actin) is shown, with data presented relative to 0 hr (mean ± SEM; n = 4; two-way ANOVA followed by Tukey’s multiple comparison test). (E) Representative immunoblots of the neurite fraction from wild-type DRG explant cultures at the indicated time points after 50 µM vacor or vehicle probed for SARM1 and β-actin (loading control). (F) Quantification of normalised SARM1 level (to β-actin) is shown, with data presented relative to 0 hr (mean ± SEM; n = 4; two-way ANOVA followed by Tukey’s multiple comparison test). (G) Representative images showing long-term survival of neurites from Sarm1-/- SCG dissociated neurons co-injected with plasmids encoding E642A hSARM1 and DsRed (to label neurites) and treated with 100 µM vacor. (H) Representative images showing expression of both wild-type and E642A hSARM1 for microinjection experiments in (Figure 2G-I). The absence of vacor-induced toxicity in neurons expressing E642A hSARM1 is therefore due to loss of enzymatic activity, rather than the lack of protein expression. Source data for Figure 2—figure supplement 1—source data 1.
-
Figure 2—figure supplement 1—source data 1
Long-term survival of Sarm1-/- SCG neurites following multiple vacor doses.
- https://cdn.elifesciences.org/articles/72823/elife-72823-fig2-figsupp1-data1-v2.xlsx
Figure 2—figure supplement 2
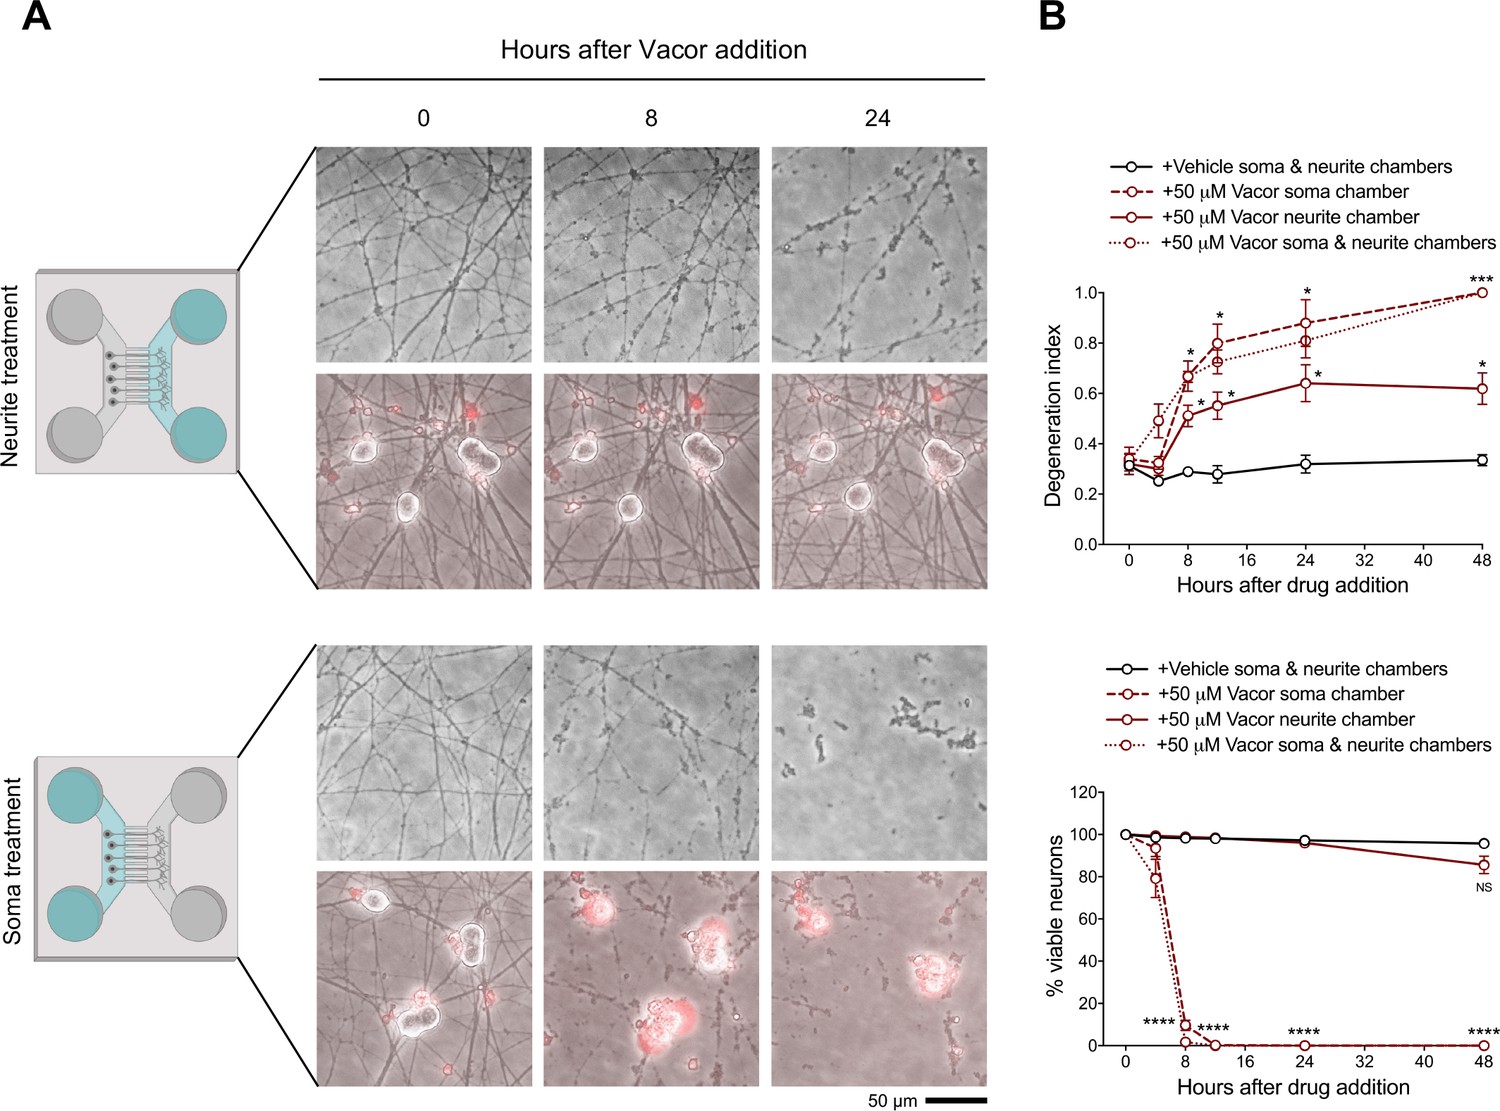
Local death of neurites and cell bodies caused by vacor.
(A) Representative images of neurites and cell bodies from wild-type DRG dissociated neurons cultured in microfluidic chambers and treated with 50 µM vacor or vehicle (‘Created with BioRender’). (B) Quantification of the degeneration index and viable neurons (shown as a percentage relative to 0 hr) in experiments described in (A) (mean ± SEM; n = 4; repeated measures two-way ANOVA followed by Tukey’s multiple comparison; ***, p < 0.001; *, p < 0.05; statistical significance shown relative to +Vehicle soma & neurite chambers). Source data for Figure 2—figure supplement 2—source data 1.
-
Figure 2—figure supplement 2—source data 1
Local death of neurites and cell bodies caused by vacor.
- https://cdn.elifesciences.org/articles/72823/elife-72823-fig2-figsupp2-data1-v2.xlsx
Figure 3 with 1 supplement

Sarm1 deletion confers functional and morphological protection of neurons against vacor toxicity in vivo.
(A) Schematic representation of the experimental design for (C,D) (‘Created with BioRender’). (B) Graphic illustration of the different retinal layers (‘Created with BioRender’). (C) Quantification of the ERG responses (pSTR, B wave and A wave) from wild-type and Sarm1-/- mice injected with 100 mM vacor or DMSO (vehicle) (mean ± SEM; n = 6; two-way ANOVA followed by Tukey’s multiple comparison test; ****, p < 0.0001). (D) Representative images of RGC from wild-type and Sarm1-/- mice injected with 100 mM vacor or DMSO (vehicle). (E) Quantification of RGC numbers from wild-type and Sarm1-/- mice injected with 100 mM vacor or DMSO (vehicle) (mean ± SEM; n = 5; repeated measures two-way ANOVA followed by Tukey’s multiple comparison test; ****, p < 0.0001). Source data for Figure 3—source data 1.
-
Figure 3—source data 1
Sarm1 deletion confers functiona and morphological protection of neurons against vacor toxicity in vivo.
- https://cdn.elifesciences.org/articles/72823/elife-72823-fig3-data1-v2.xlsx
Figure 3—figure supplement 1
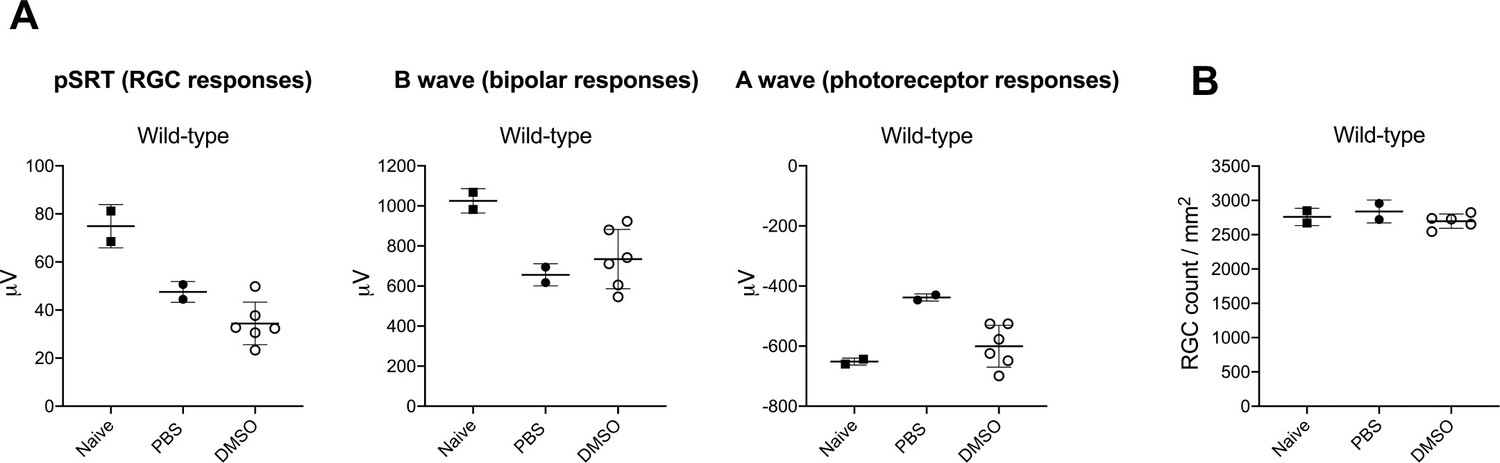
DMSO has no adverse effect on retinal cell survival or function compared to PBS-injected eyes.
(A) Quantification of the ERG responses (pSTR, B wave and A wave) from wild-type mice untreated (naive-no injection) or injected with PBS or DMSO (mean ± SD; n = 2–6). (B) Quantification of RGC numbers from wild-type mice untreated (naive-no injection) or injected with PBS or DMSO (mean ± SD; n = 2–5). Source data for Figure 3—figure supplement 1—source data 1.
-
Figure 3—figure supplement 1—source data 1
DMSO has no adverse effect on retinal cell survival or function compared to PBS-injected eyes.
- https://cdn.elifesciences.org/articles/72823/elife-72823-fig3-figsupp1-data1-v2.xlsx
Figure 4 with 1 supplement
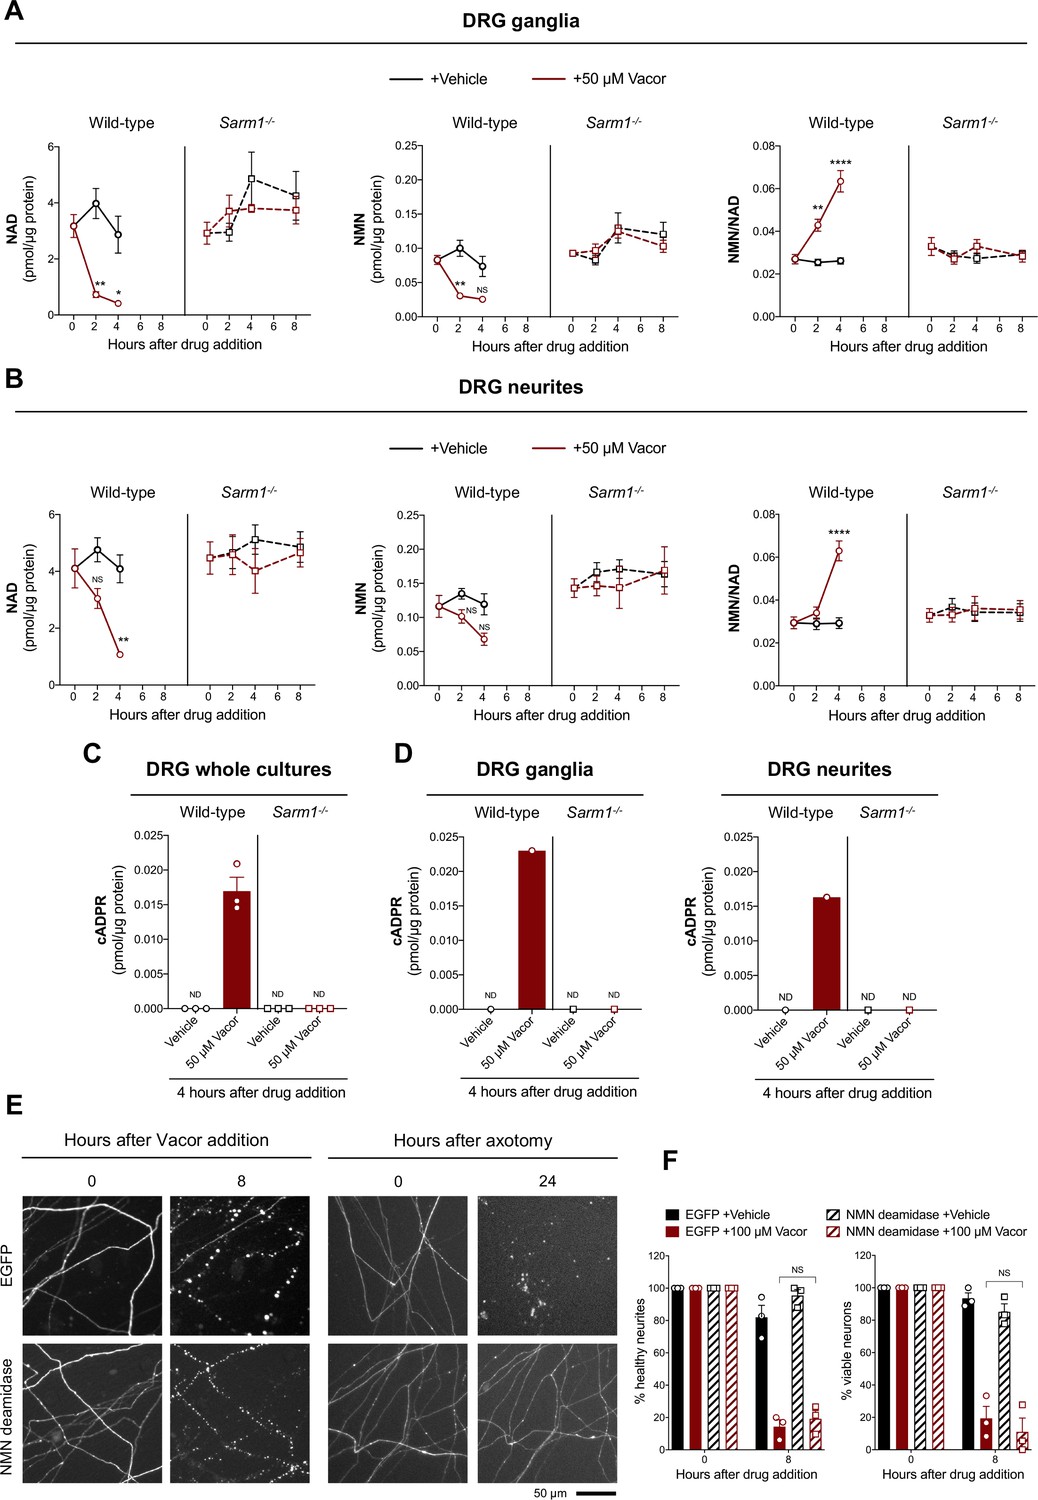
Vacor treatment leads to SARM1 activation.
(A,B) NMN and NAD levels and NMN/NAD ratio in ganglia (A) and neurite (B) fractions from wild-type and Sarm1-/- DRG explant cultures at the indicated time points after 50 µM vacor or vehicle treatment (mean ± SEM; n = 4; three-way ANOVA followed by Tukey’s multiple comparison test; ****, p < 0.0001; **, p < 0.01; *, p < 0.05; NS, not-significant). (C) cADPR levels in wild-type and Sarm1-/- DRG whole explant cultures (neurites and cell bodies) 4 hr after 50 µM vacor or vehicle treatment. cADPR levels were consistently above the detection limit (~1 fmol/µg protein) only in wild-type DRG explant cultures treated with vacor (mean ± SEM; n = 3; ND, not-detectable). (D) A single analysis of cADPR levels in ganglia and neurite fractions from wild-type and Sarm1-/- DRG explant cultures 4 hr after 50 µM vacor or vehicle treatment (n = 1). (E) Representative images of neurites from Sarm1-/- SCG dissociated neurons co-injected with plasmids encoding hSARM1, EGFP or EGFP-NMN deamidase and DsRed (to label neurites) and treated with 100 µM vacor. As an experimental control, Sarm1-/- SCG dissociated neurons injected with the same injection mixtures were axotomised. As expected, neurites expressing NMN deamidase were still intact 24 hr after axotomy. (F) Quantification of healthy neurites and viable neurons in experiments in (E) is shown as a percentage relative to 0 hr (time of drug addition) (mean ± SEM; n = 3; repeated measures three-way ANOVA followed by Tukey’s multiple comparison test; NS, not-significant). Source data for Figure 4—source data 1.
-
Figure 4—source data 1
Vacor treatment leads to SARM1 activation.
- https://cdn.elifesciences.org/articles/72823/elife-72823-fig4-data1-v2.xlsx
Figure 4—figure supplement 1
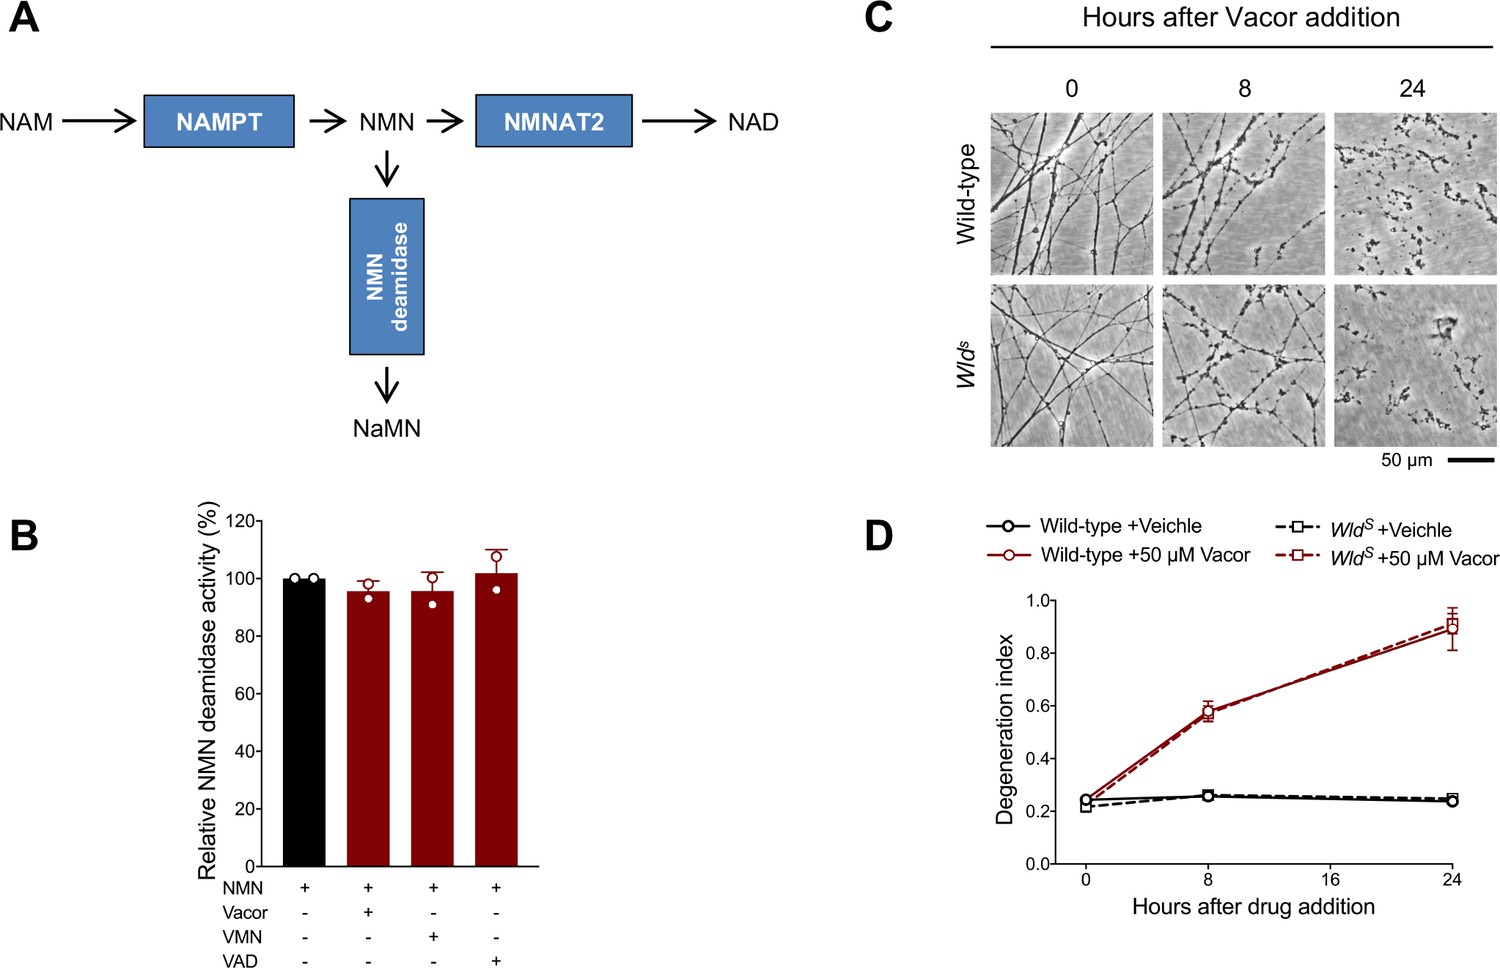
Effect of vacor, VMN and VAD on recombinant NMN deamidase activity and lack of protection after vacor treatment in WldS neurons.
(A) Schematic representation of NAD biosynthetic pathway from NAM and the side reaction catalysed by bacterial NMN deamidase, which prevents accumulation of the NMN intermediate. (B) Relative activity (%) (NMN conversion into NaMN) of purified, recombinant NMN deamidase in the presence of vacor, VMN and VAD (all 250 µM) (mean ± SD; n = 2). (C) Representative images of neurites from wild-type and WldS DRG explant cultures treated with 50 µM vacor. (D) Quantification of the degeneration index in experiments described in (C) (mean ± SEM; n = 4; repeated measures three-way ANOVA followed by Tukey’s multiple comparison test). Source data for Figure 4—figure supplement 1—source data 1.
-
Figure 4—figure supplement 1—source data 1
Effect of vacor, VMN and VAD on recombinant NMN deamidase activity and lack of protection after vacor treatment in WldS neurons.
- https://cdn.elifesciences.org/articles/72823/elife-72823-fig4-figsupp1-data1-v2.xlsx
Figure 5 with 2 supplements

Vacor metabolite VMN potently activates SARM1.
(A) Fold change of NADase activity of purified, recombinant hSARM1 in the presence of NMN and VMN (mean ± SEM; n = 3). hSARM1 average basal activity is 18.12 ± 3.02 milliU/mg (fold activation = 1). Rates are relative to controls measured with 250 µM NAD alone. Both NMN and VMN, once added to each reaction mixture, were not consumed during incubation. Experimental data were fitted to the modified Michaelis-Menten equation in Methods to calculate the kinetic parameters shown in the attached table. Hill coefficients for NMN and VMN indicate positive cooperativity in binding in both cases. Best fitting also revealed a Km for NAD of 70 µM. (B) Representative images of neurites from wild-type and Sarm1-/- DRG (littermates) explant cultures treated with 500 µM VMN. (C) Quantification of the degeneration index in experiments described in (B) (mean ± SEM; n = 3; repeated measures three-way ANOVA followed by Tukey’s multiple comparison test; ****, p < 0.0001; **, p < 0.01; *, p < 0.05; statistical significance shown relative to Sarm1-/- +500 µM VMN). Source data for Figure 5—source data 1.
-
Figure 5—source data 1
Vacor metabolite VMN potently activates SARM1.
- https://cdn.elifesciences.org/articles/72823/elife-72823-fig5-data1-v2.xlsx
Figure 5—figure supplement 1
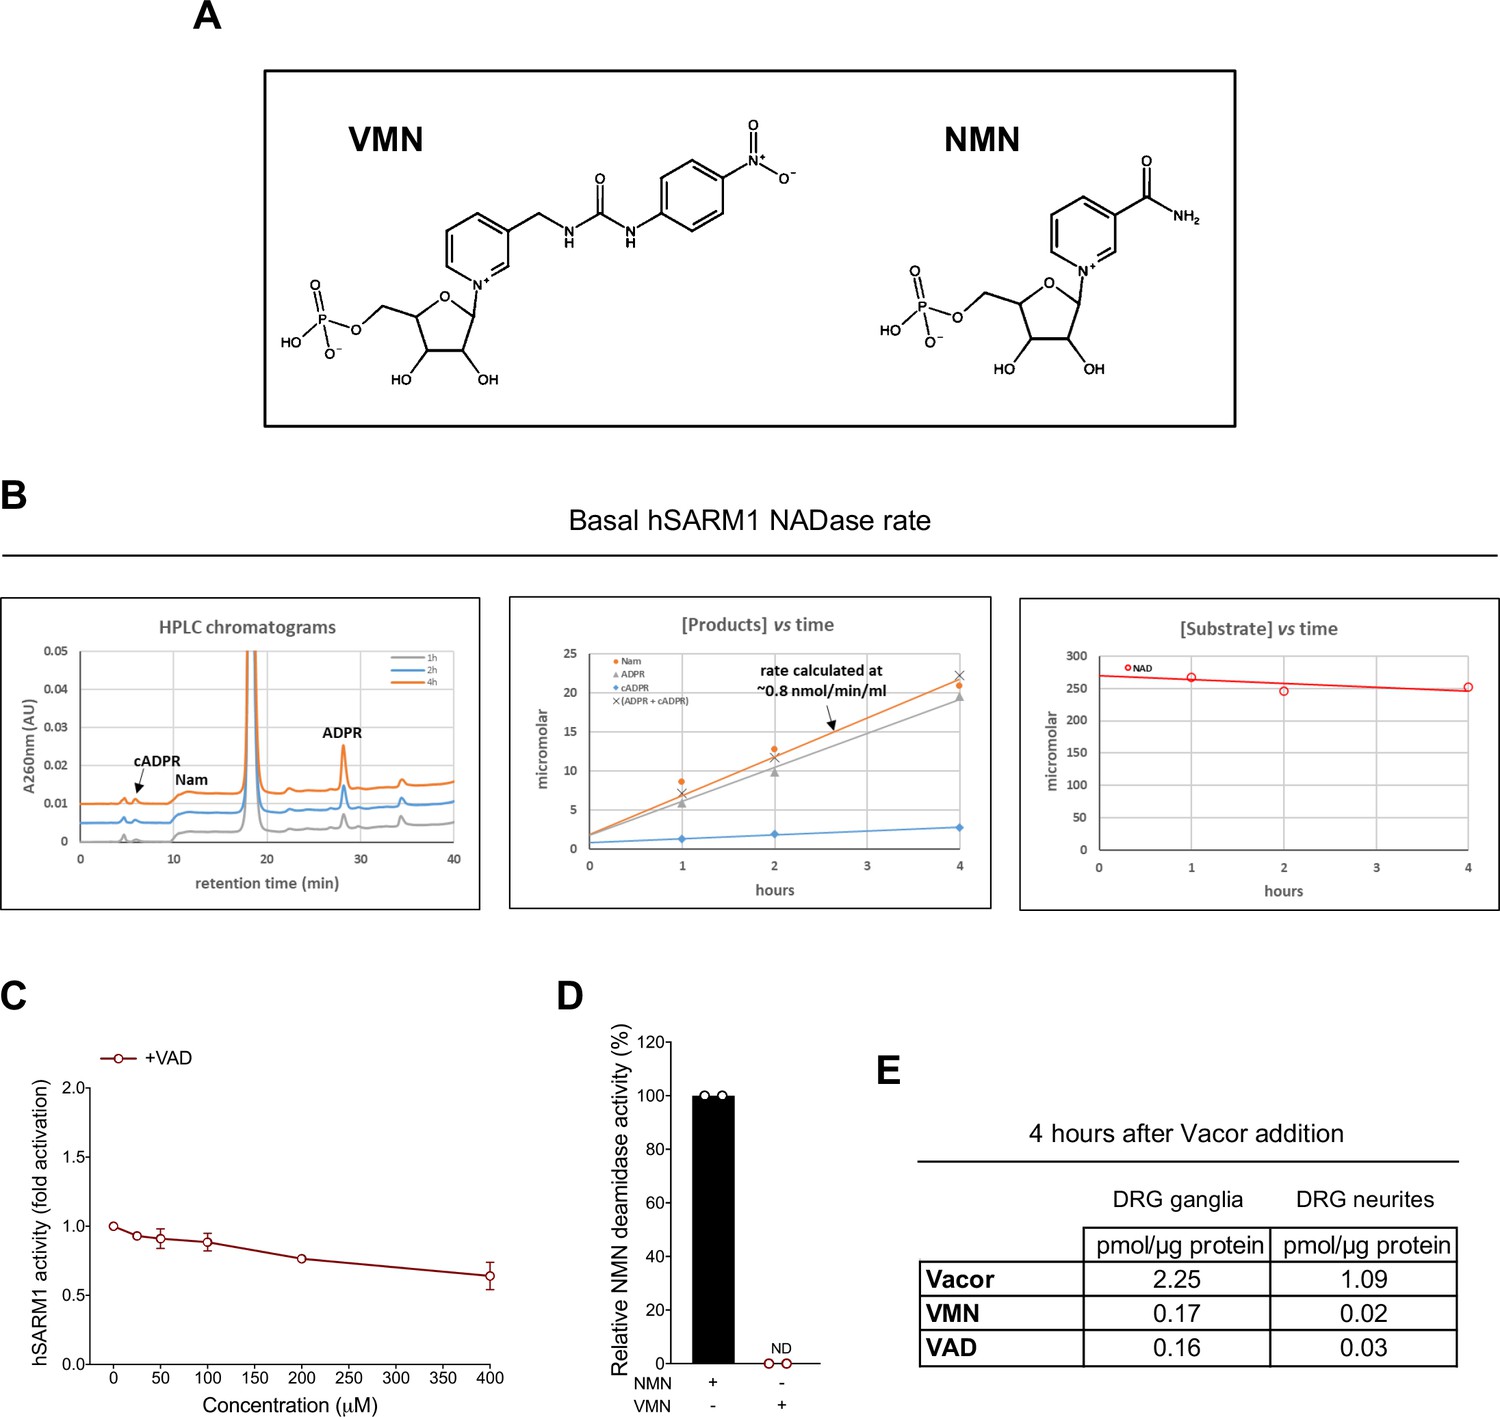
Representative basal NADase rate of recombinant hSARM1.
(A) Chemical structures of the two pyridine 5’ mononucleotides VMN and NMN. (B) Representative chromatogram and graphs showing basal NADase activity of purified, recombinant hSARM1 (40 μg/ml). The formed products after separation (left panel) are quantified by peak-area integration and evaluated for linearity (middle panel). The NADase rate is calculated from accumulating products ADPR and cADPR (middle panel). In every experiment, the sum of ADPR and cADPR fully matched the amount of NAM formed (middle panel), as well as the amount of NAD consumed (right panel). (C) Fold change of NADase activity of purified, recombinant hSARM1 in the presence of VAD (mean ± SD; n = 2). Rates are relative to control measured with 250 µM NAD alone. VAD, once added to the reaction mixture, was not consumed during incubation. (D) Relative activity (%) of purified, recombinant NMN deamidase with VMN as a substrate. NMN or VMN were assayed at 250 µM (mean ± SD; n = 2). (E) A single analysis of vacor, VMN and VAD levels in wild-type DRG ganglia and neurite fractions 4 hr after 50 µM vacor treatment (n = 1). Source data for Figure 5—figure supplement 1—source data 1.
-
Figure 5—figure supplement 1—source data 1
Representative basal NADase rate of recombinant hSARM1.
- https://cdn.elifesciences.org/articles/72823/elife-72823-fig5-figsupp1-data1-v2.xlsx
Figure 5—figure supplement 2
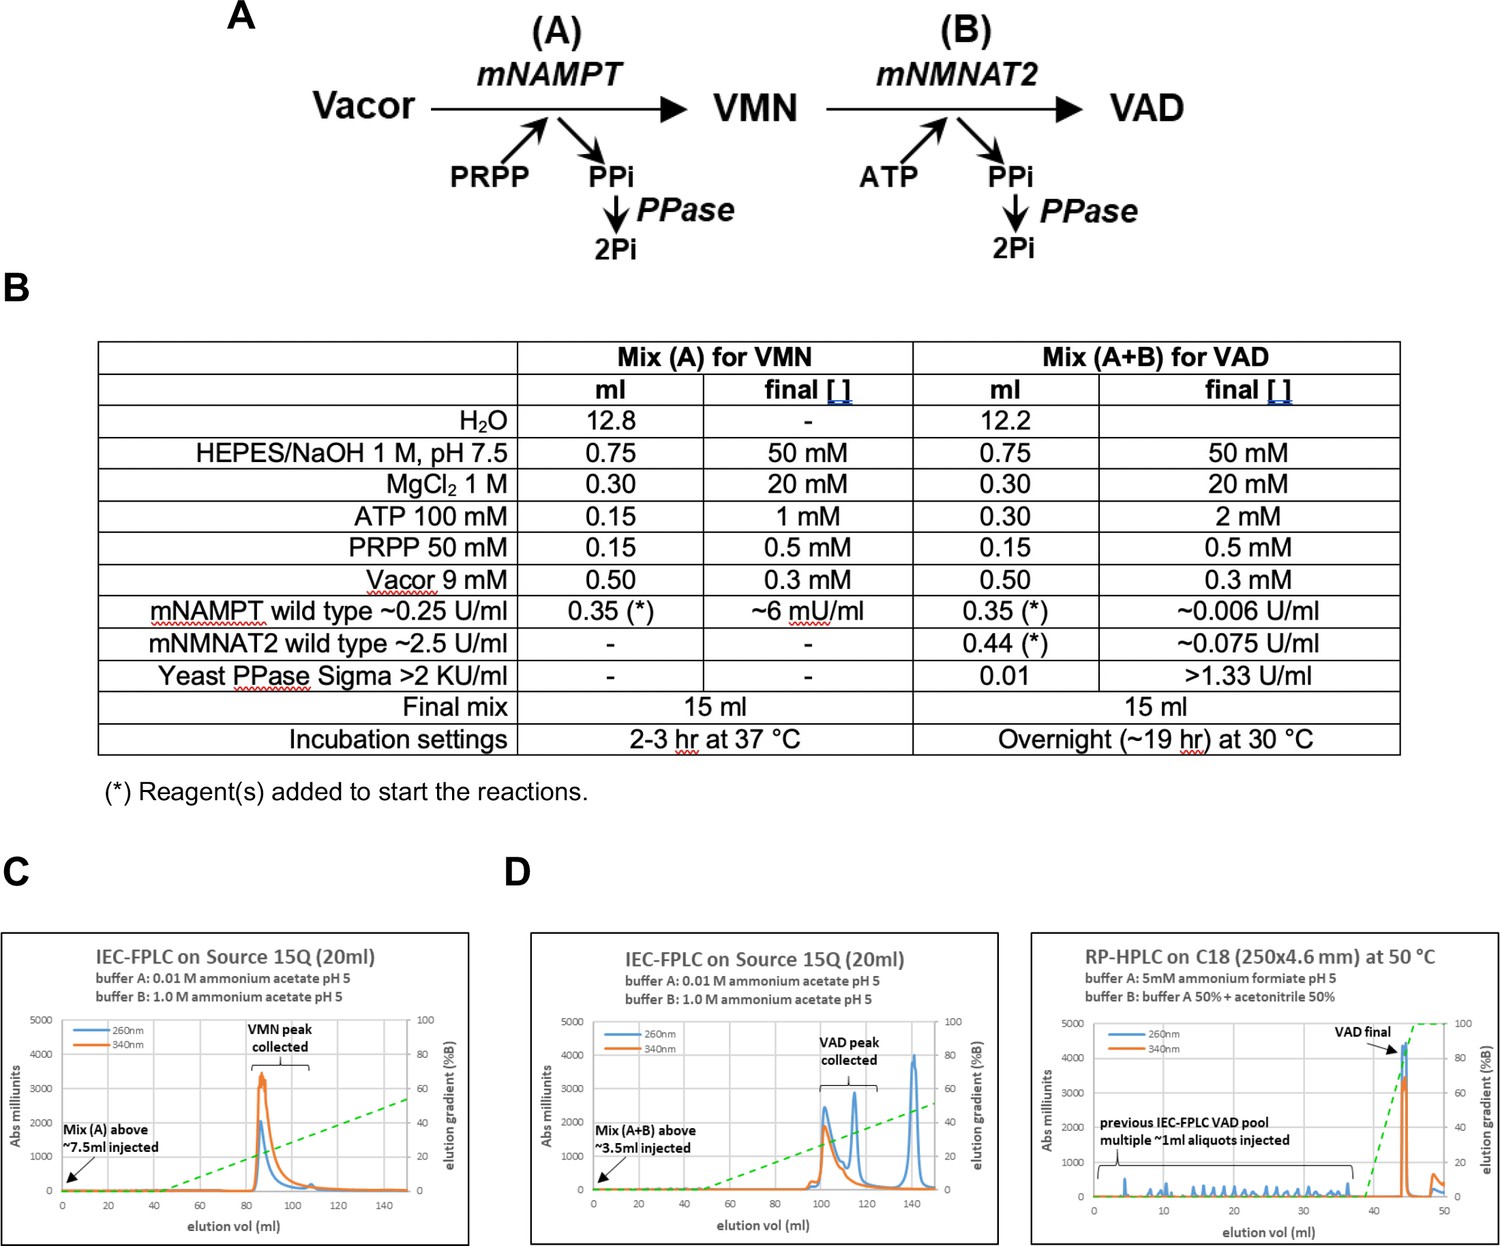
VMN and VAD synthesis and purification.
(A) Scheme of the reactions for VMN and VAD synthesis. (B) List of reagents used in mix (A) for VMN synthesis and mix (A + B) for VAD synthesis. (C) Representative IEC-FPLC purification of VMN from a typical mix (A). (D) Representative IEC-FPLC+ RP HPLC purification of VAD from a typical mix (A + B). Starting from vacor, typical conversion yields obtained via this protocol were 70 % for VMN and 50 % or less for VAD that required two chromatographic steps for purification.
Figure 6 with 2 supplements
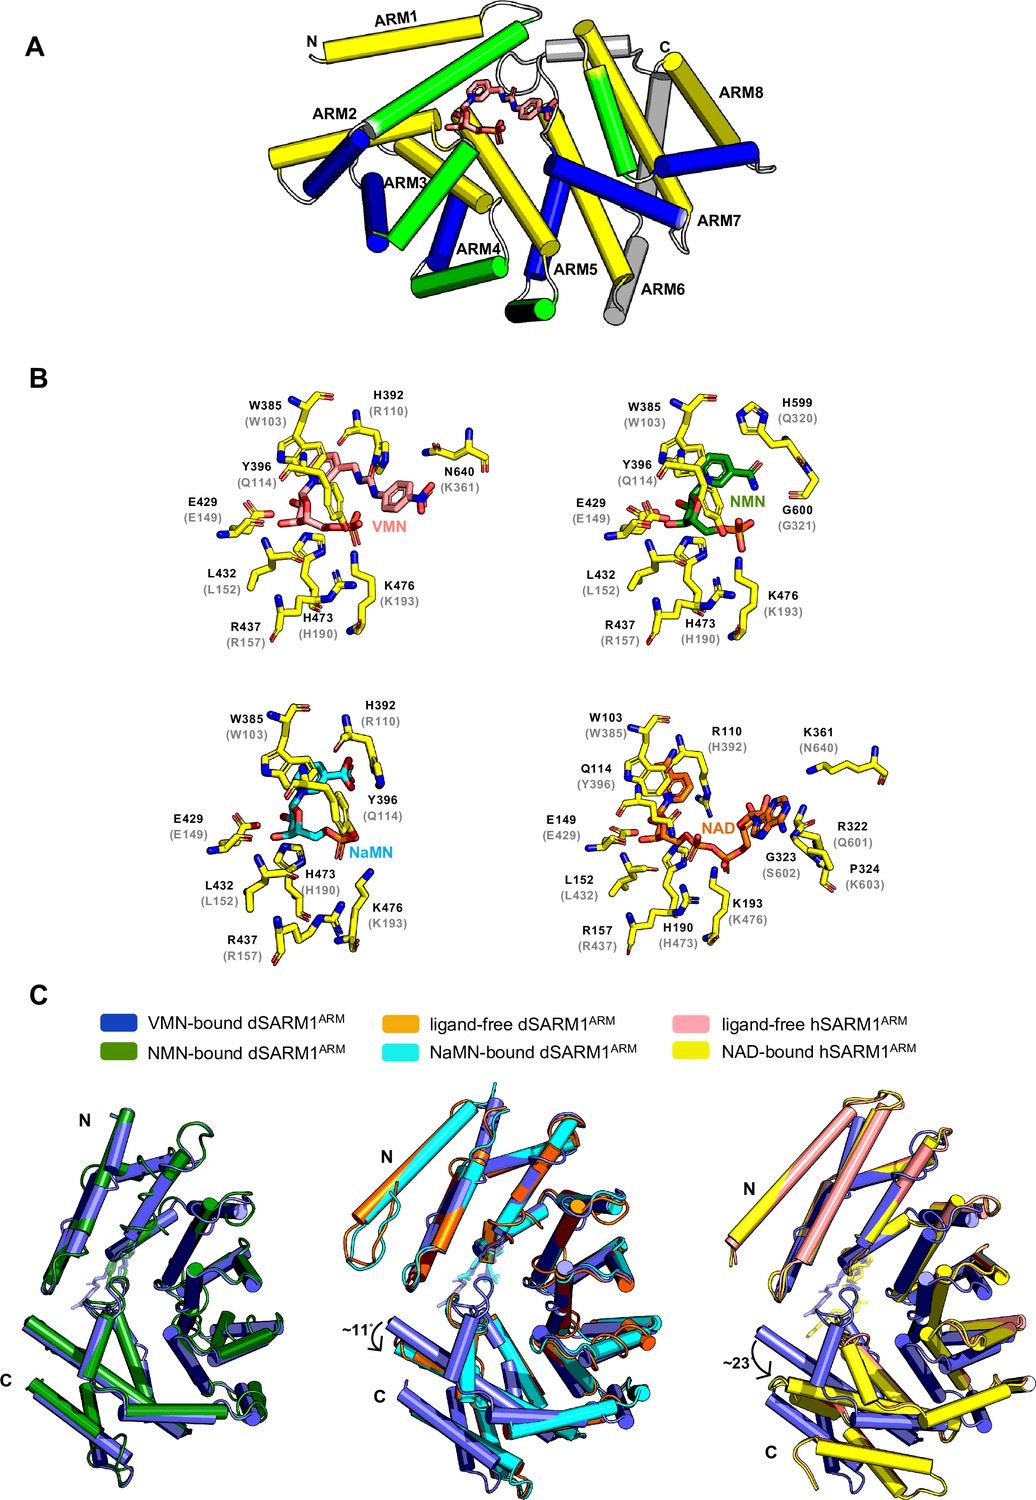
VMN activates SARM1 through direct binding to SARM1 ARM domain.
(A) Crystal structure of VMN-bound dSARM1ARM. dSARM1ARM contains eight armadillo motifs (ARM1-8). Except for ARM1 (containing only the H3 helix) and ARM7 (containing only H2 and H3 helices), other motifs consist of H1, H2, and H3 helices, coloured green, blue, and yellow, respectively. The unusual ARM6, which makes a sharp turn at its C-terminus, is coloured grey. Nitrogen, oxygen and phosphorous are coloured blue, red, and orange, respectively, in the VMN molecule. (B) Stick representation of the interaction of dSARM1ARM with VMN (pink), NMN (PDB: 7LCZ; green) and NaMN (PDB: 7RTC; cyan), and hSARM1 ARM domain with NAD (PDB: 7CM6; orange). The corresponding residues in Drosophila or human SARM1ARM are shown in parentheses. Nitrogen, oxygen, and phosphorous are coloured blue, red, and orange. (C) Structural comparison of the ARM domains bound to different ligands. The panel on the left shows the structural superposition of the N-terminal regions (residues 373–444) of VMN and NMN-bound dSARM1ARM (PDB: 7LCZ; RMSD is 0.4 Å over 304 Cα atoms). The middle panel shows the superposition of the N-terminal regions (residues 373–444) of VMN-bound dSARM1ARM, ligand-free (PDB: 7LCY) and NaMN-bound dSARM1ARM (PDB: 7RTC, RMSD between ligand-free and VMN-bound structures is 1.6 Å over 300 Cα atoms; RMSD between NaMN-bound and VMN-bound structures is 1.7 Å over 300 Cα atoms). Panel on the right shows the superposition of the N-terminal regions (residues 373–444 of dSARM1ARM and residues 91–164 of hSARM1ARM) of VMN-bound dSARM1ARM, unbound (PDB: 7CM5) and NAD-bound hSARM1ARM (PDB: 7CM6, RMSD between ligand-free and VMN-bound structures is 4.3 Å over 300 Cα atoms; RMSD between NAD-bound and VMN-bound structures is 4.3 Å over 300 Cα atoms).
Figure 6—figure supplement 1
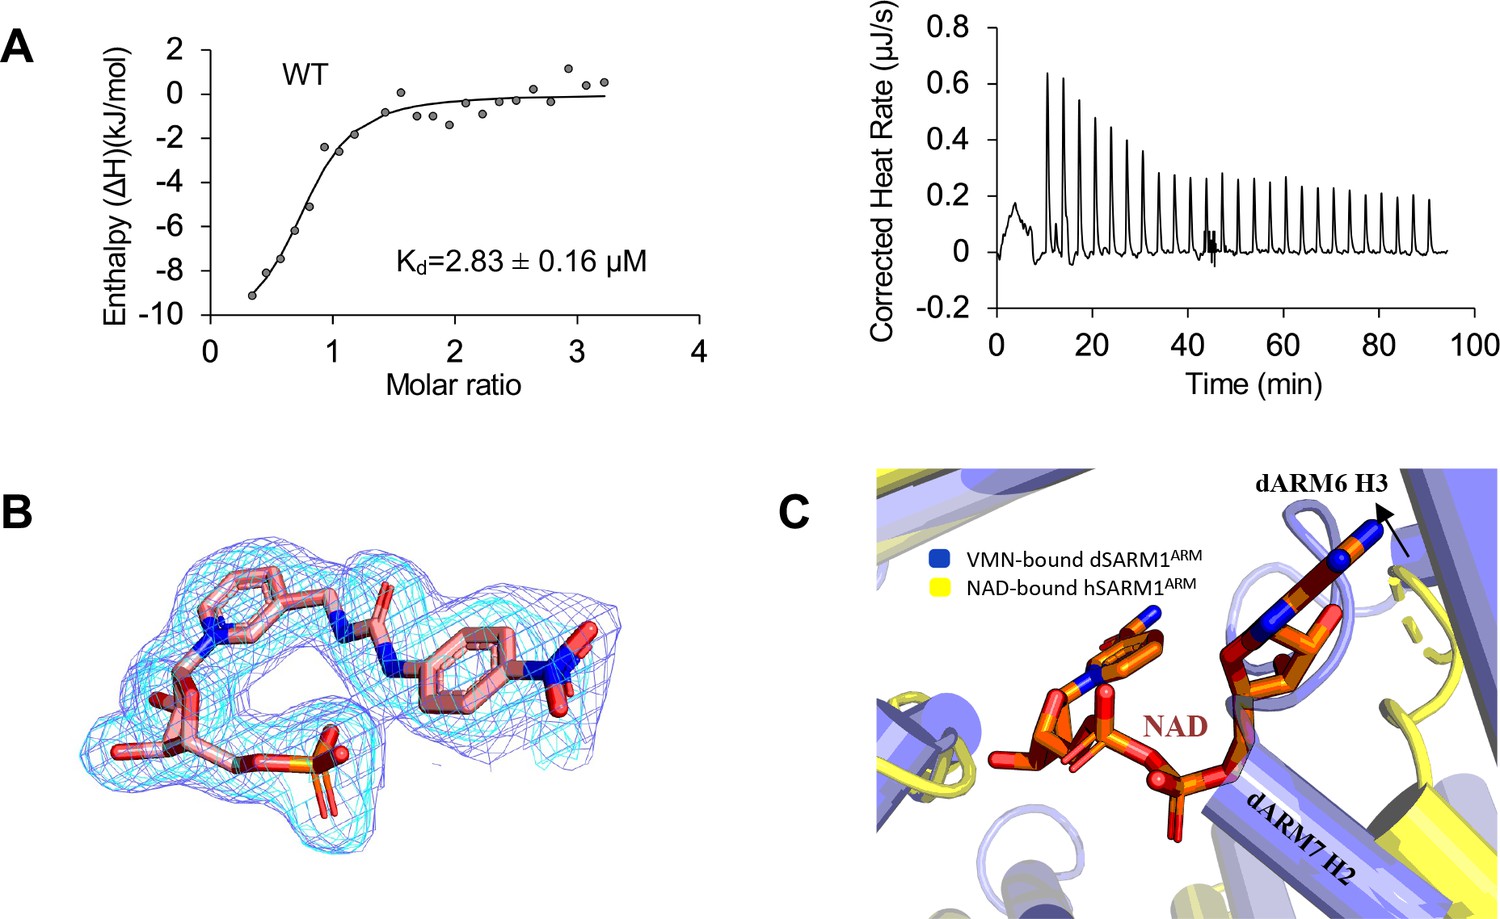
Analysis of dSARM1ARM: VMN interaction.
(A) Integrated (left) and raw (right) ITC data for the titration of 0.6 mM VMN with 45 µM dSARM1ARM. (B) Standard omit (cyan) and Polder (slate) mFo-DFc maps near the VMN molecule in dSARM1ARM crystals (chain A). (C) The adenine group and the adjacent ribose of NAD clash with the C-terminal region of the protein in the VMN-bound structure.
Figure 6—figure supplement 2
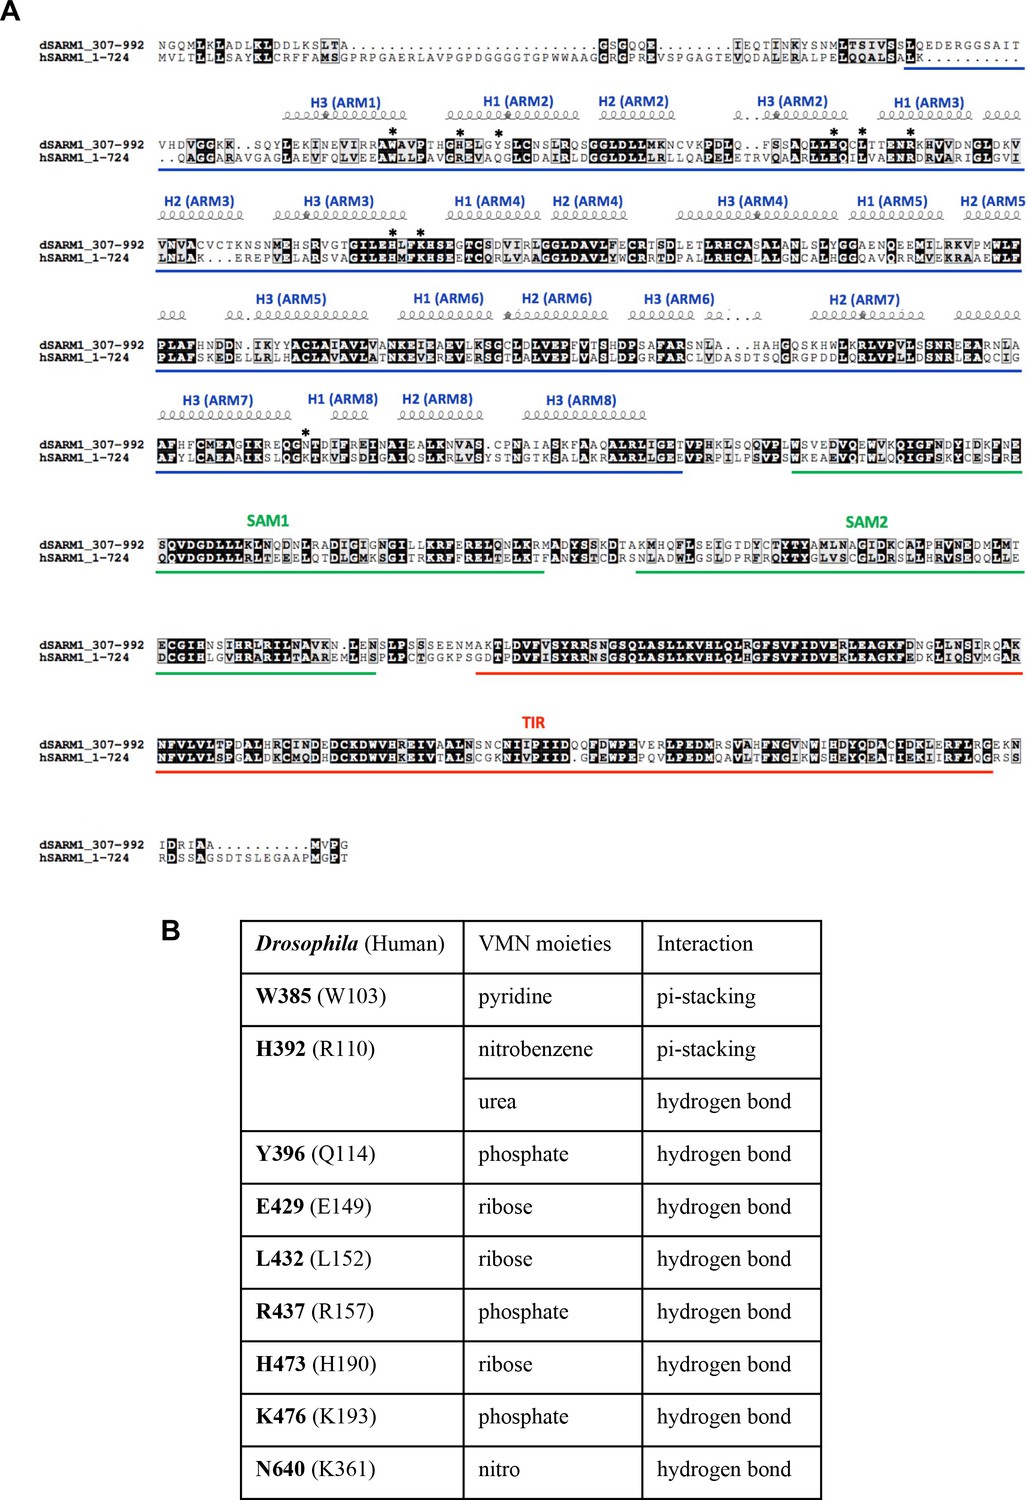
Sequence alignment of SARM1 orthologs.
(A) Sequence alignment of Drosophila and human SARM1. The alignment was performed and analysed using T-coffee Multiple Sequence Alignment Server (Expresso) (Notredame et al., 2000) and ESPript, respectively. Conserved residues are highlighted in black boxes. Residues important for VMN interaction are indicated by stars. (B) Detailed interaction between VMN and the residues indicted by stars in (A).
Figure 7 with 1 supplement
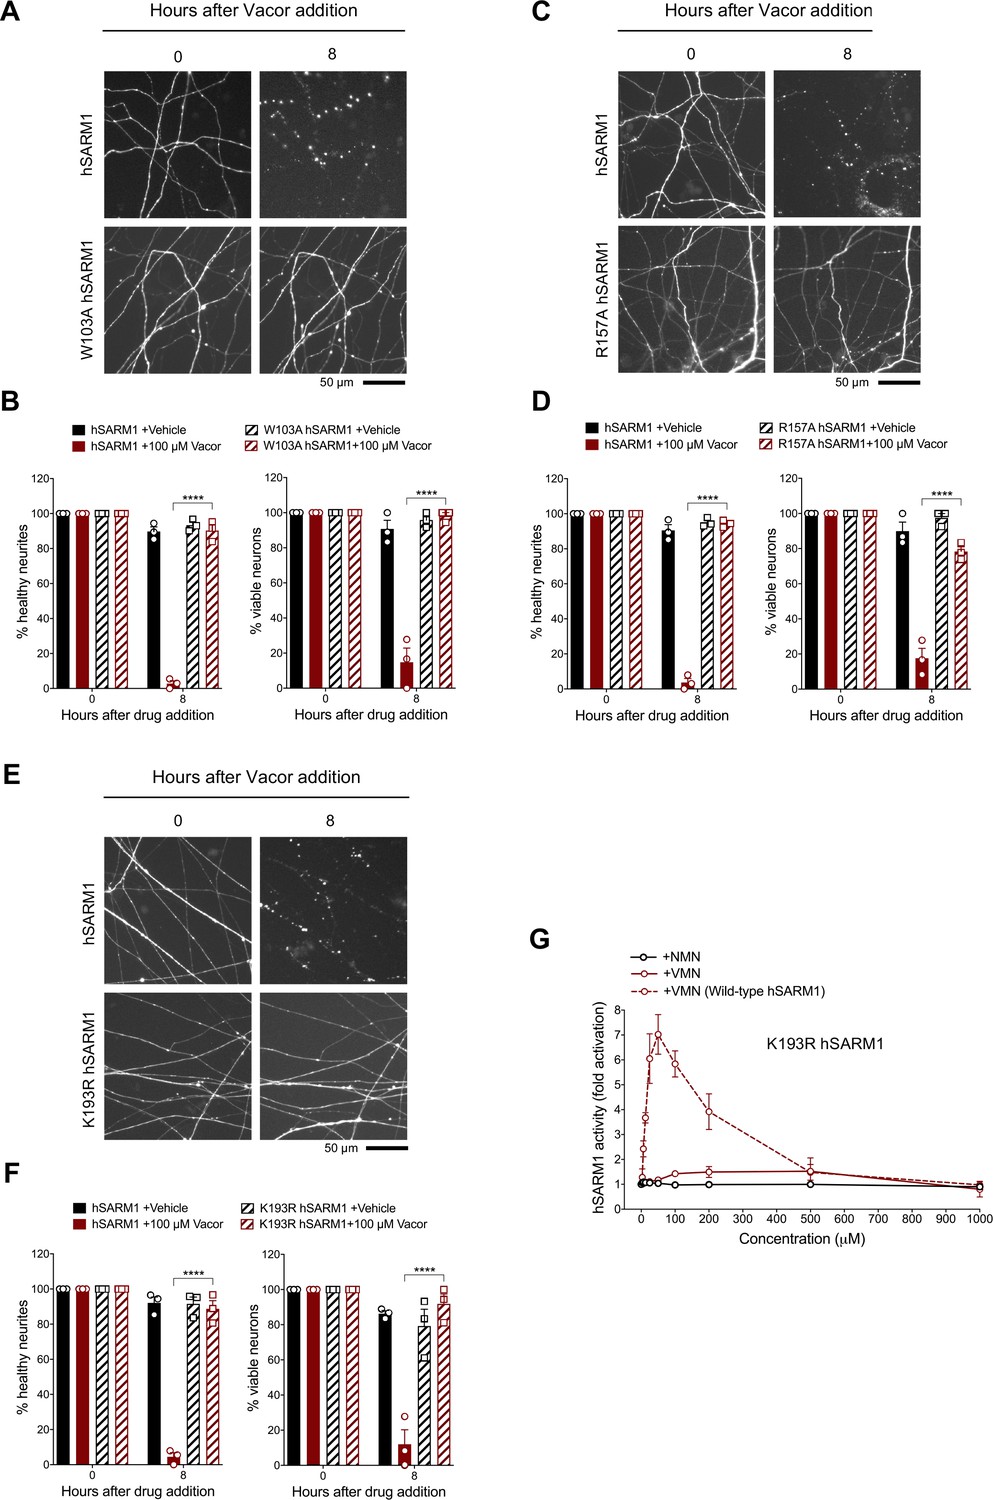
Mutations in the VMN binding pocket of hSARM1 ARM domain prevent vacor toxicity.
(A) Representative images of neurites from Sarm1-/- SCG dissociated neurons co-injected with plasmids encoding wild-type or W103A hSARM1 and DsRed (to label neurites) and treated with 100 µM vacor. (B) Quantification of healthy neurites and viable neurons in experiments in (A) is shown as a percentage relative to 0 hr (time of drug addition) (mean ± SEM; n = 3; repeated measures three-way ANOVA followed by Tukey’s multiple comparison test; ****, p < 0.0001). (C) Representative images of neurites from Sarm1-/- SCG dissociated neurons co-injected with plasmids encoding wild-type or R157A hSARM1 and DsRed (to label neurites) and treated with 100 µM vacor. (D) Quantification of healthy neurites and viable neurons in experiments in (C) is shown as a percentage relative to 0 hr (time of drug addition) (mean ± SEM; n = 3; repeated measures three-way ANOVA followed by Tukey’s multiple comparison test; ****, p < 0.0001). (E) Representative images of neurites from Sarm1-/- SCG dissociated neurons co-injected with plasmids encoding wild-type or K193R hSARM1 and DsRed (to label neurites) and treated with 100 µM vacor. (F) Quantification of healthy neurites and viable neurons in experiments in (E) is shown as a percentage relative to 0 hr (time of drug addition) (mean ± SEM; n = 3; repeated measures three-way ANOVA followed by Tukey’s multiple comparison test; ****, p < 0.0001). (G) Fold change of NADase activity of purified, recombinant K193R hSARM1 in the presence of NMN and VMN (wild-type hSARM1+ VMN is also shown for comparison) (mean ± SEM; n = 2–3). K193R hSARM1 average basal activity is 17.75 ± 2.47 milliU/mg (fold activation = 1). Source data for Figure 7—source data 1.
-
Figure 7—source data 1
Mutations in the VMN binding pocket of hSARM1 ARM domain prevent vacor toxicity.
- https://cdn.elifesciences.org/articles/72823/elife-72823-fig7-data1-v2.xlsx
Figure 7—figure supplement 1
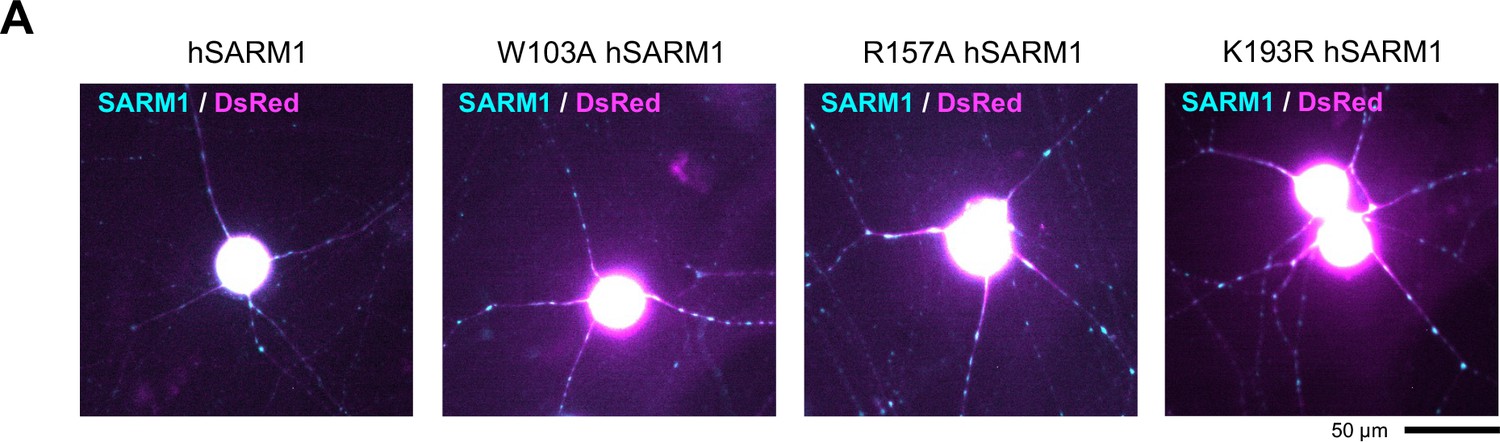
Expression of wild-type, W103A, R157A and K193R hSARM1 in SCG neurons.
(A) Representative images showing expression of wild-type, W103A, R157A and K193R hSARM1 for microinjection experiments in Figure 7.
Additional files
-
Supplementary file 1
X-ray data collection and structural refinement statistics.
- https://cdn.elifesciences.org/articles/72823/elife-72823-supp1-v2.docx
-
Transparent reporting form
- https://cdn.elifesciences.org/articles/72823/elife-72823-transrepform1-v2.docx
Download links
A two-part list of links to download the article, or parts of the article, in various formats.
Downloads (link to download the article as PDF)
Open citations (links to open the citations from this article in various online reference manager services)
Cite this article (links to download the citations from this article in formats compatible with various reference manager tools)
Neurotoxin-mediated potent activation of the axon degeneration regulator SARM1
eLife 10:e72823.
https://doi.org/10.7554/eLife.72823


