Protein phosphatase 1 in association with Bud14 inhibits mitotic exit in Saccharomyces cerevisiae
- Department of Molecular Biology and Genetics, Koç University, Turkey
Figures
Figure 1
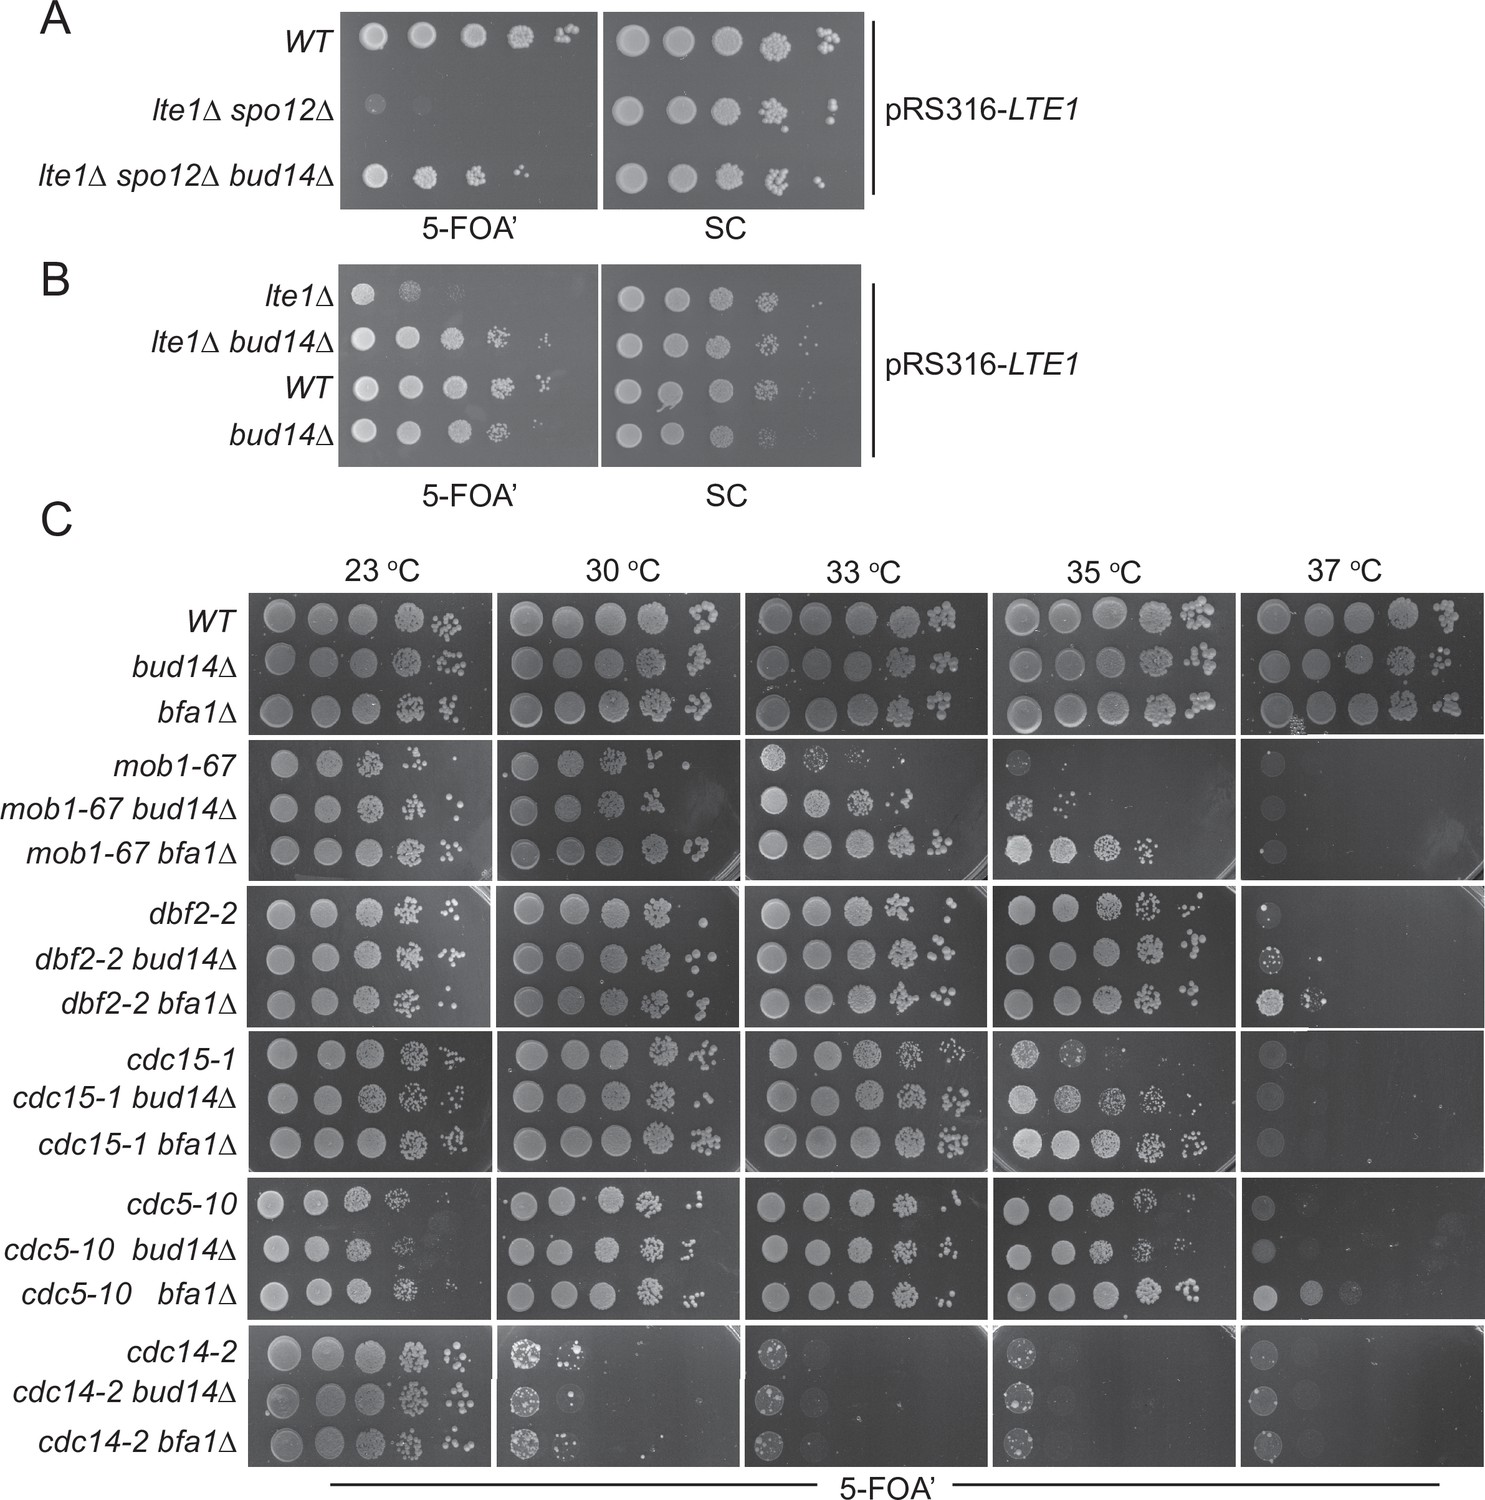
Bud14 deletion rescues growth of cells with impaired mitotic exit.
(A) bud14∆ cells rescue the synthetic lethality of lte1∆ spo12∆ cells. (B) bud14∆ cells rescue the lethality of lte1∆ cells at 18°C. (C) Comparison of growth rescue of mitotic exit network temperature-sensitive (MEN-ts) mutants upon deletion of BUD14 and BFA1. Serial dilutions of indicated strains were spotted on indicated plates and grown at given temperatures. 5-Fluoroorotic acid (5-FOA) plates negatively select for the URA3-based plasmids (pRS316 containing the LTE1 in A and B, pRS316 containing the wild-type gene copy of the corresponding MEN mutant in C). Thus, only cells that have lost these plasmids can grow on 5-FOA plates where genetic interactions can be observed.
Figure 2 with 1 supplement
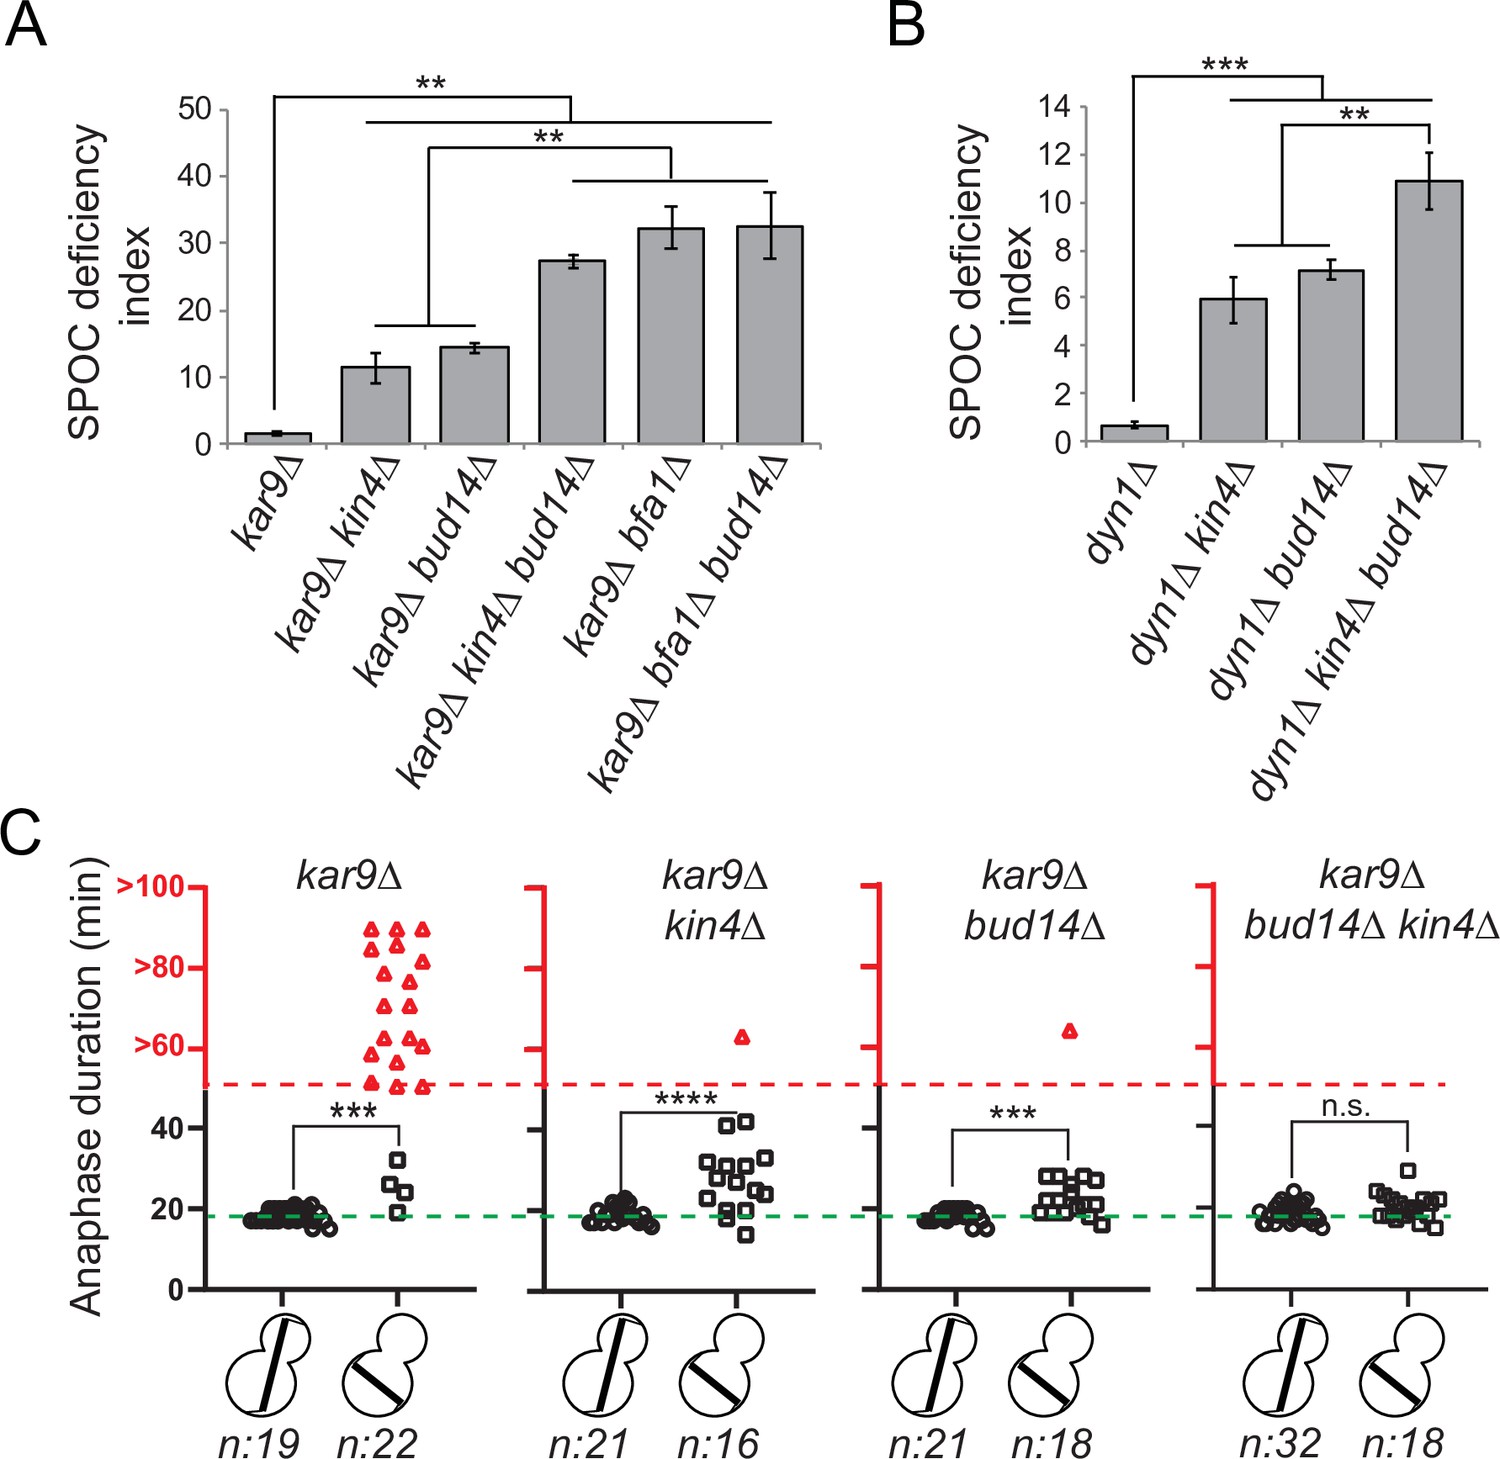
bud14∆ cells are spindle position checkpoint (SPOC) deficient.
(A, B) Endpoint analysis of SPOC integrity of indicated yeast strains in kar9∆ (A) and dyn1∆ (B) background. Cells were fixed with ethanol and stained with DAPI. Cells with normally aligned nuclei, mispositioned nuclei, and multinucleated cells that failed to correctly position their spindle before mitotic exit were counted by microscopy and their SPOC deficiency index percentages were plotted, where SPOC deficiency index = % cells with multinucleation ÷ % cells with mispositioned nuclei × 10. Graphs are average of three independent experiments. A minimum of 100 cells were counted from each strain in each experiment. Error bars show standard deviation. Two-tailed Student’s t-test was applied. **p<0.01, ***p<0.001. (C) Single-cell analysis of SPOC integrity in indicated strains. Duration of anaphase in cells with misaligned and normally aligned spindles was calculated as explained in the text and plotted as dotplots. Data points in red indicate the cells in which the spindle did not break down during the time-lapse movie. In this case, plotted values are the time duration during which these cells were observed in anaphase through the time-lapse movie. Consequently, the actual anaphase duration is greater than the value plotted in red. This fact is emphasized in the red part of the y-axis, indicated above the red dashed line, with addition of the ‘>’ symbol before the y-axis values. Green dash line indicates the mean value of the anaphase duration in cells with normally aligned spindles. One-way ANOVA with uncorrected Fisher’s LSD was applied for statistical analysis. ***p<0.001, ****p<0.0001. n: sample size. All pairwise comparisons and descriptive statistics are shown in the corresponding source data files, whereas only comparisons of normal and misaligned spindles are shown in the figure.
-
Figure 2—source data 1
Numerical data and statistics for Figure 2A.
- https://cdn.elifesciences.org/articles/72833/elife-72833-fig2-data1-v2.xlsx
-
Figure 2—source data 2
Numerical data and statistics for Figure 2B.
- https://cdn.elifesciences.org/articles/72833/elife-72833-fig2-data2-v2.xlsx
-
Figure 2—source data 3
Numerical data and statistics for Figure 2C.
- https://cdn.elifesciences.org/articles/72833/elife-72833-fig2-data3-v2.xlsx
Figure 2—figure supplement 1
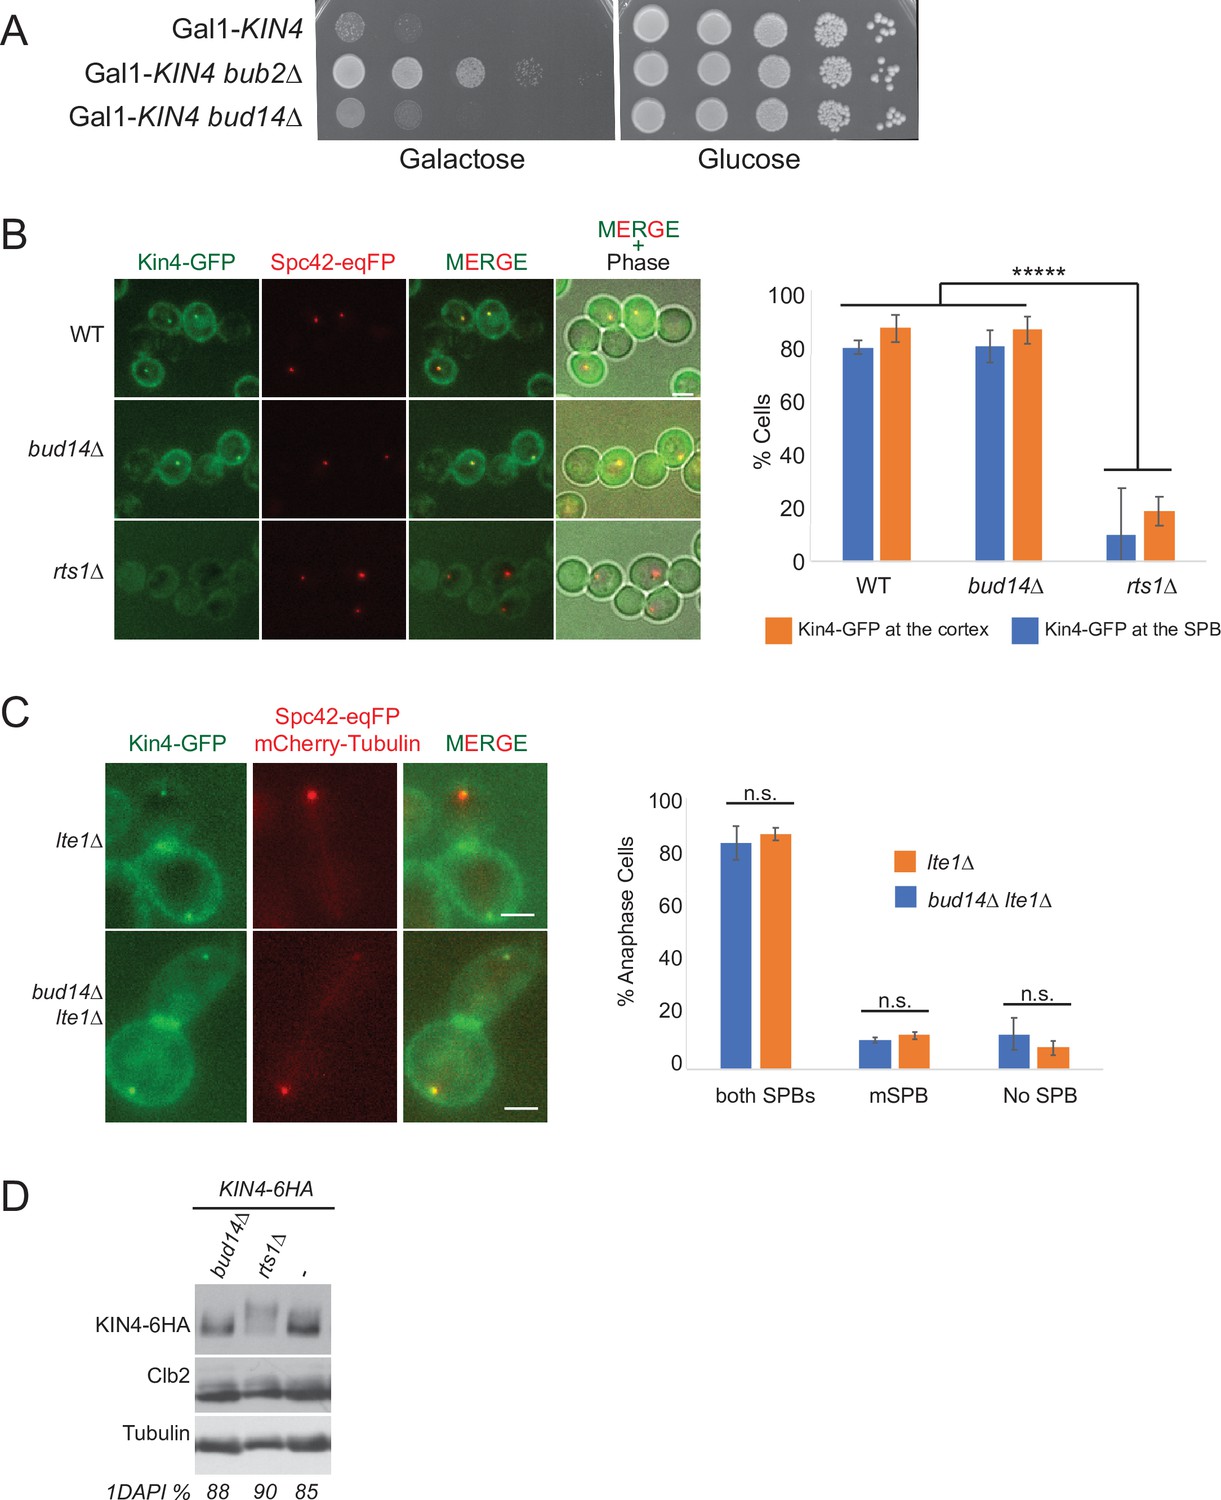
Bud14 does not influence Kin4 function.
(A) Serial dilutions of indicated strains were spotted on glucose-containing (YPD) and galactose-containing (YP Raf/Gal) agar plates. Gal1-Kin4 overexpression is induced on galactose-containing plates. (B) Logarithmic growing cultures bearing Kin4-GFP and Spc42-eqFP were treated with nocodazole for 2 hr and Kin4 spindle pole body (SPB) and cortex localization was analyzed by microscopy. rts1∆ cells were used as a control in which Kin4 fails to localize to SPBs and cortex. Graph is an average of three independent experiments. Error bars are standard deviation. At least 100 cells were counted from each sample in each experiment. Scale bar: 2 µm. (C) SPB localization of Kin4-GFP was analyzed in logarithmic growing lte1∆ and lte1∆ bud14∆ cultures. Spc42-eqFP and mCherry-Tub1 served as SPB and spindle markers. Only cells in anaphase were considered. Graphs were plotted as described in B. (D) Logarithmic growing cultures bearing Kin4-6HA and the indicated gene deletions were treated with nocodazole for 2.5 hr. Kin4 mobility shift was analyzed by western blotting using anti-HA antibodies. rts1∆ served as a control for hyperphosphorylated Kin4.
-
Figure 2—figure supplement 1—source data 1
Numerical data for Figure 2—figure supplement 1B.
- https://cdn.elifesciences.org/articles/72833/elife-72833-fig2-figsupp1-data1-v2.xlsx
-
Figure 2—figure supplement 1—source data 2
Numerical data for Figure 2—figure supplement 1C.
- https://cdn.elifesciences.org/articles/72833/elife-72833-fig2-figsupp1-data2-v2.xlsx
Figure 3 with 1 supplement
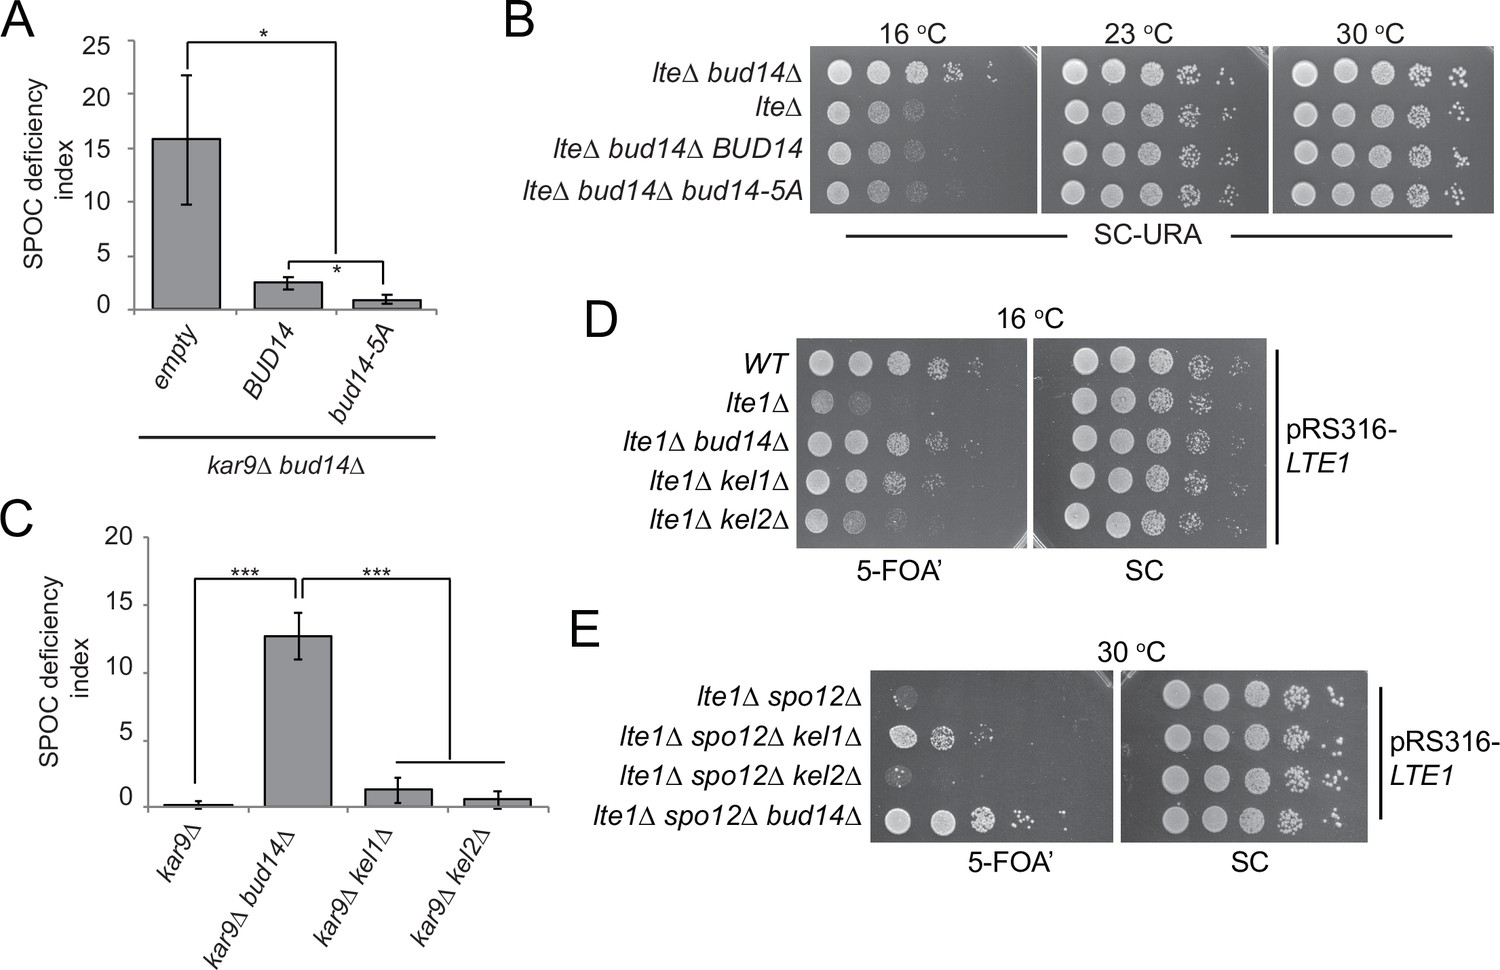
Function of Bud14 in actin regulation is dispensable for spindle position checkpoint (SPOC).
(A) Endpoint analysis of SPOC deficiency index in bud14∆ kar9∆ cells carrying URA3-based empty plasmid (empty) or BUD14-containing URA3-based plasmids (BUD14 and bud14-5A). Graphs are average of three independent experiments. A minimum of 100 cells were counted from each strain in each experiment. Error bars show standard deviation. *p<0.05 according to Student’s t-test. (B) Serial dilutions of indicated strains bearing URA3-based empty plasmid (not indicated on figure) or BUD14-containing URA3-based plasmids (BUD14 and bud14-5A) were spotted on SC-URA plate and grown at indicated temperatures. (C) Endpoint analysis of SPOC deficiency index in indicated cell types. Graphs are average of three independent experiments. A minimum of 100 cells were counted from each strain in each experiment. Error bars show standard deviation. ***p<0.001 according to Student’s t-test. (D, E) Serial dilutions of indicated strains bearing LTE1 on URA3-based pRS316 plasmid were spotted on 5-fluoroorotic acid (5-FOA) and SC plates and grown at indicated temperatures. 5-FOA negatively selects for URA3-containing plasmids, thus cells lose their pRS316-LTE1 plasmids on 5-FOA plates and genetic interactions can be observed on this plate.
-
Figure 3—source data 1
Numerical data and statistics for Figure 3A.
- https://cdn.elifesciences.org/articles/72833/elife-72833-fig3-data1-v2.xlsx
-
Figure 3—source data 2
Numerical data and statistics for Figure 3C.
- https://cdn.elifesciences.org/articles/72833/elife-72833-fig3-data2-v2.xlsx
Figure 3—figure supplement 1
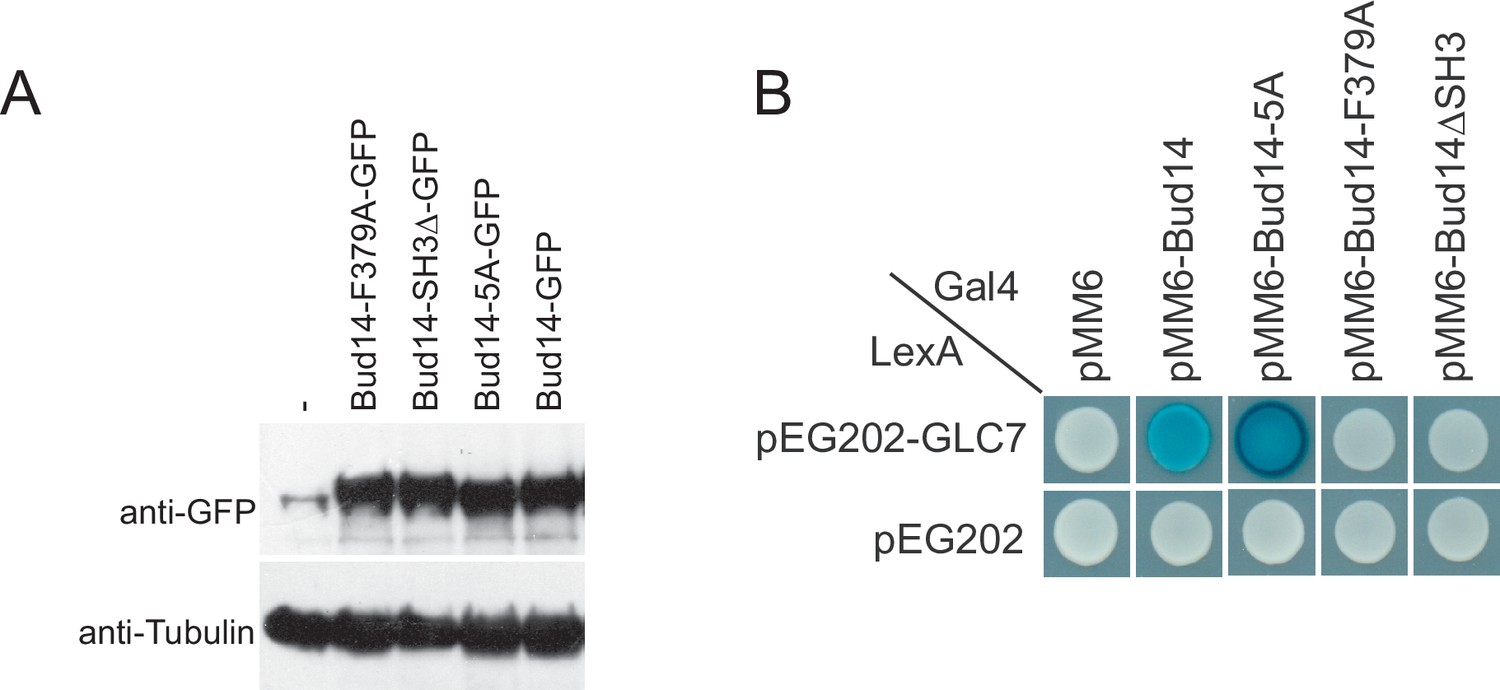
Expression and Glc7 binding of Bud14 mutants.
(A) Analysis of BUD14 expression in cells bearing pMK60 (pRS416-endogenous-BUD14-promoter-GFP-BUD14), pDKY001 (pRS416-endogenous-BUD14-promoter-GFP-bud14-5A), pHK002 (pRS416-endogenous-BUD14-promoter-GFP-bud14-F379A), pDKY003 (pRS416-endogenous-BUD14-promoter-GFP-bud14-ΔSH3) Bud14 was detected using anti-GFP antibodies. (B) Interaction of Glc7 with Bud14 and Bud14 mutants in yeast two hybrid system.
-
Figure 3—figure supplement 1—source data 1
Labeled uncropped blot images for Figure 3—figure supplement 1A.
- https://cdn.elifesciences.org/articles/72833/elife-72833-fig3-figsupp1-data1-v2.pdf
-
Figure 3—figure supplement 1—source data 2
Raw scans of the blot images for (A) Figure 3—figure supplement 1—source data 1, anti-GFP blot, upper panel, and (B) Figure 3—figure supplement 1—source data 1, anti-tublin blot, lower panel.
- https://cdn.elifesciences.org/articles/72833/elife-72833-fig3-figsupp1-data2-v2.zip
Figure 4 with 1 supplement
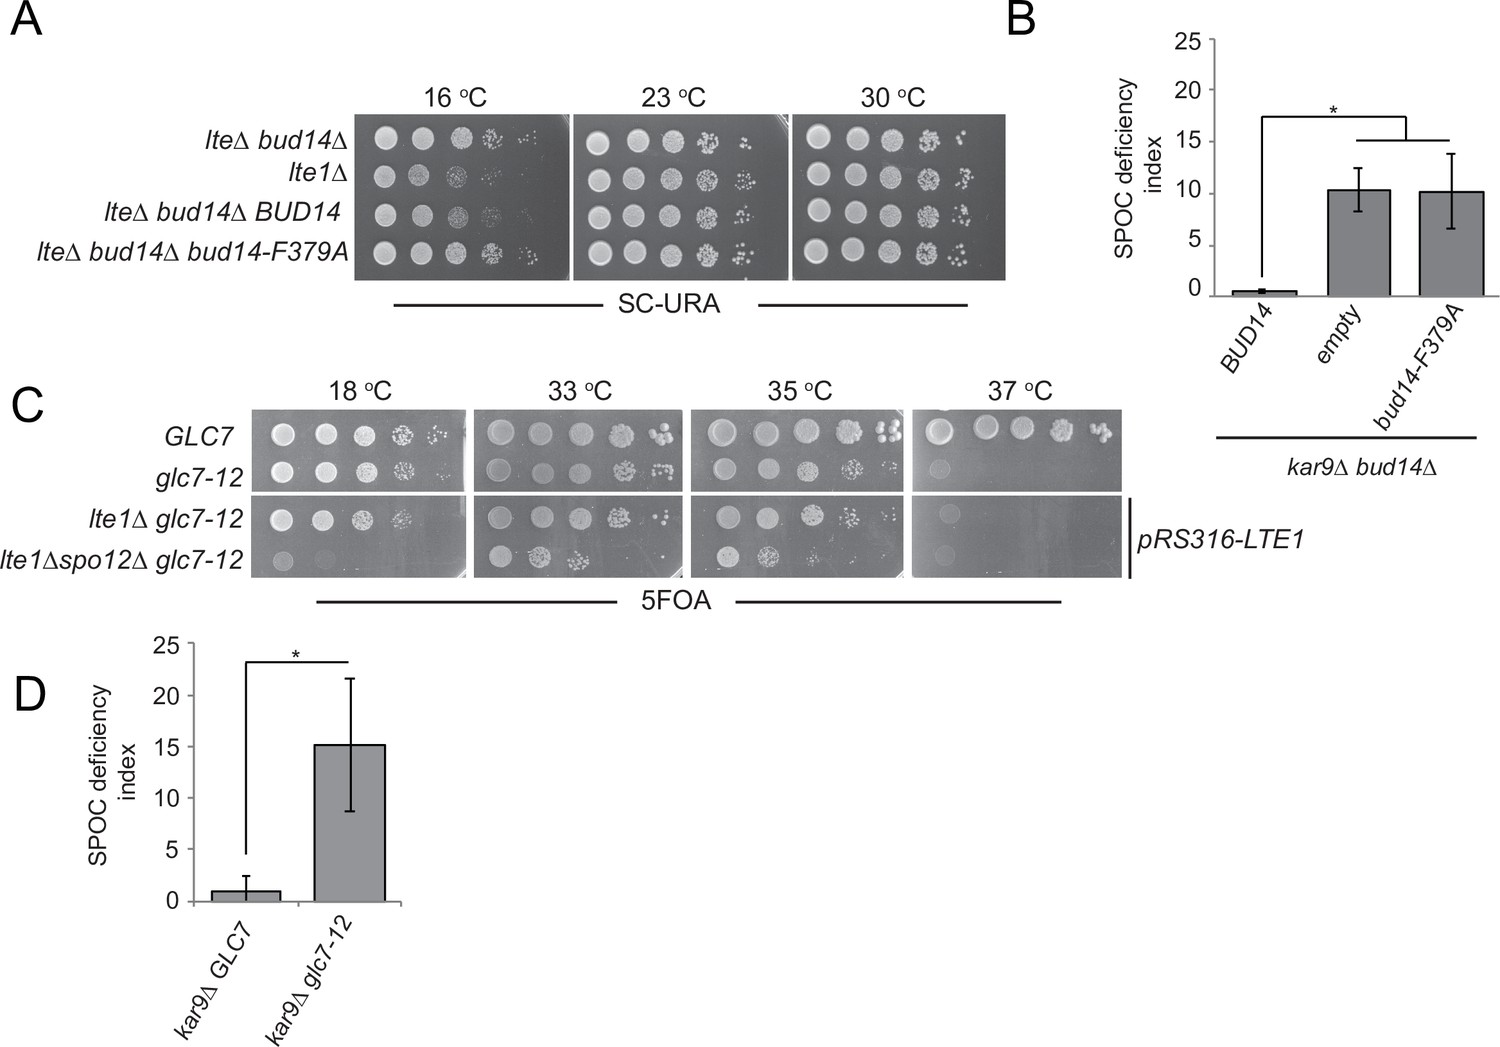
Glc7-Bud14 interaction is required for spindle position checkpoint (SPOC) regulatory function of Bud14.
(A) Serial dilutions of indicated strains bearing URA3-based empty plasmid (not indicated on figure) or BUD14-containing URA3-based plasmids (BUD14 and bud14-F379A) were spotted on SC-URA plate and grown at indicated temperatures. (B) SPOC deficiency indexes of indicated strains carrying URA3-based empty plasmid (empty) or BUD14-containing URA3-based plasmids (BUD14 and bud14-F379A). Graphs are average of three independent experiments. A minimum of 100 cells were counted from each strain in each experiment. Error bars show standard deviation. *p<0.05 according to Student’s t-test. (C) Serial dilutions of indicated strains were spotted on 5-fluoroorotic acid (5-FOA) plate and grown at indicated temperatures. Cells that contain LTE1 on a URA3-based plasmid are indicated with pRS316-LTE1. (D) SPOC deficiency indexes of indicated strains. *p<0.05 according to Student’s t-test.
-
Figure 4—source data 1
Numerical data and statistics for Figure 4B.
- https://cdn.elifesciences.org/articles/72833/elife-72833-fig4-data1-v2.xlsx
-
Figure 4—source data 2
Numerical data and statistics for Figure 4D.
- https://cdn.elifesciences.org/articles/72833/elife-72833-fig4-data2-v2.xlsx
Figure 4—figure supplement 1
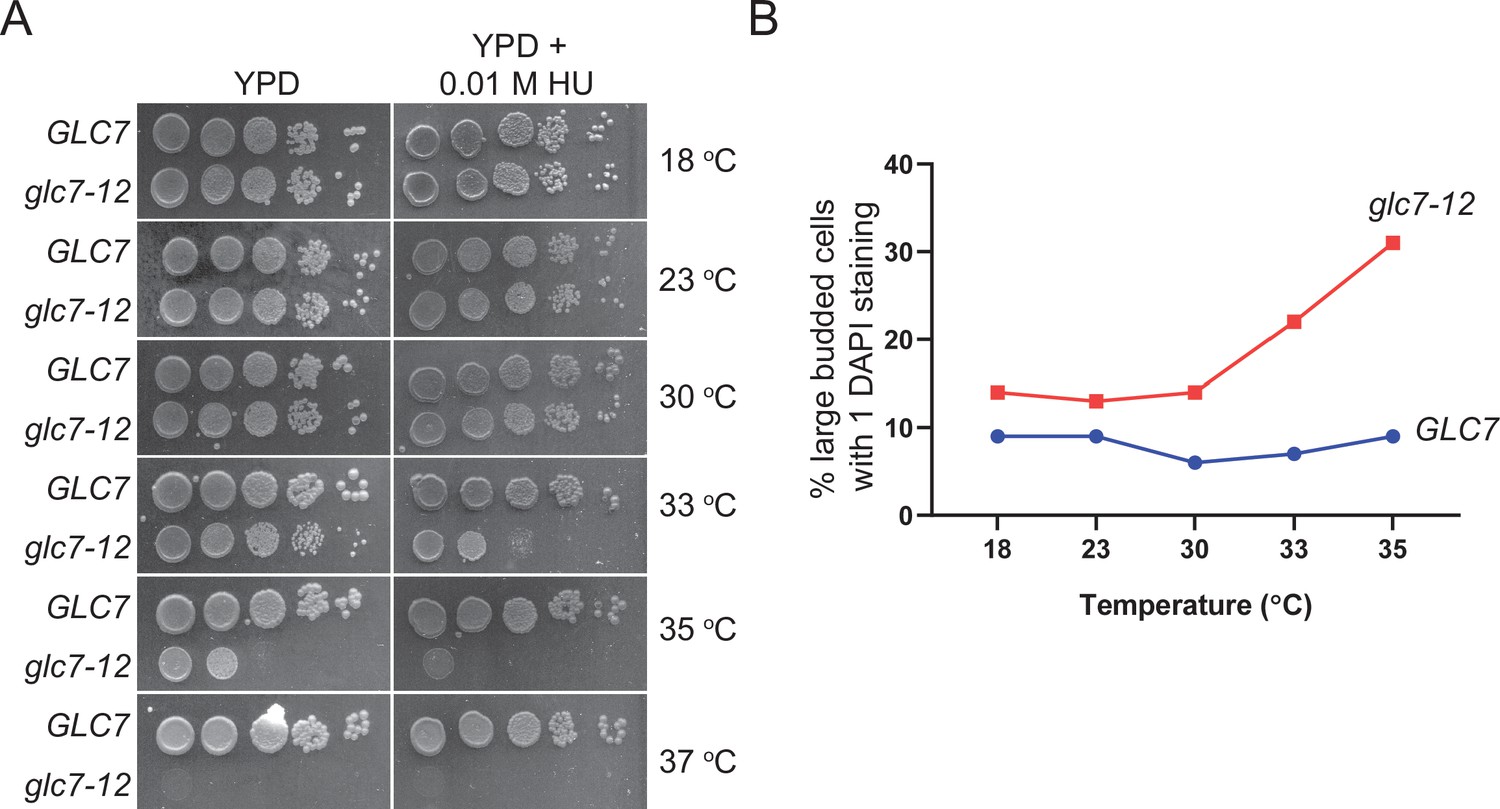
Assessment of glc7-12 inactivation at different temperatures.
(A) Serial dilutions of indicated strains were spotted on YPD and YPD-containing 0.01 M hydroxyurea (HU) and grown at indicated temperatures. The plates then were incubated at given temperatures for 2–3 days. (B) Analysis of cell morphology of GLC7 and glc7-12 cells at indicated temperatures. Liquid cultures were grown to log-phase at 23°C, shifted to indicated temperatures and further grown for 4 hr. Cells were fixed with ethanol and stained with DAPI. Cells were counted by microscopy and percentages of cells with large buds and single DAPI were plotted. A minimum of 100 cells were counted from each strain.
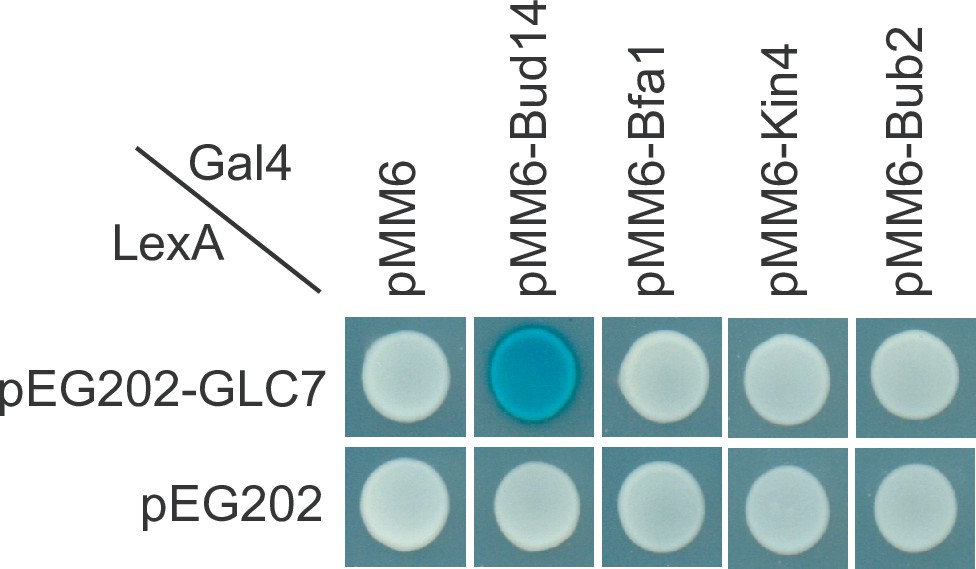
Figure 5 with 2 supplements
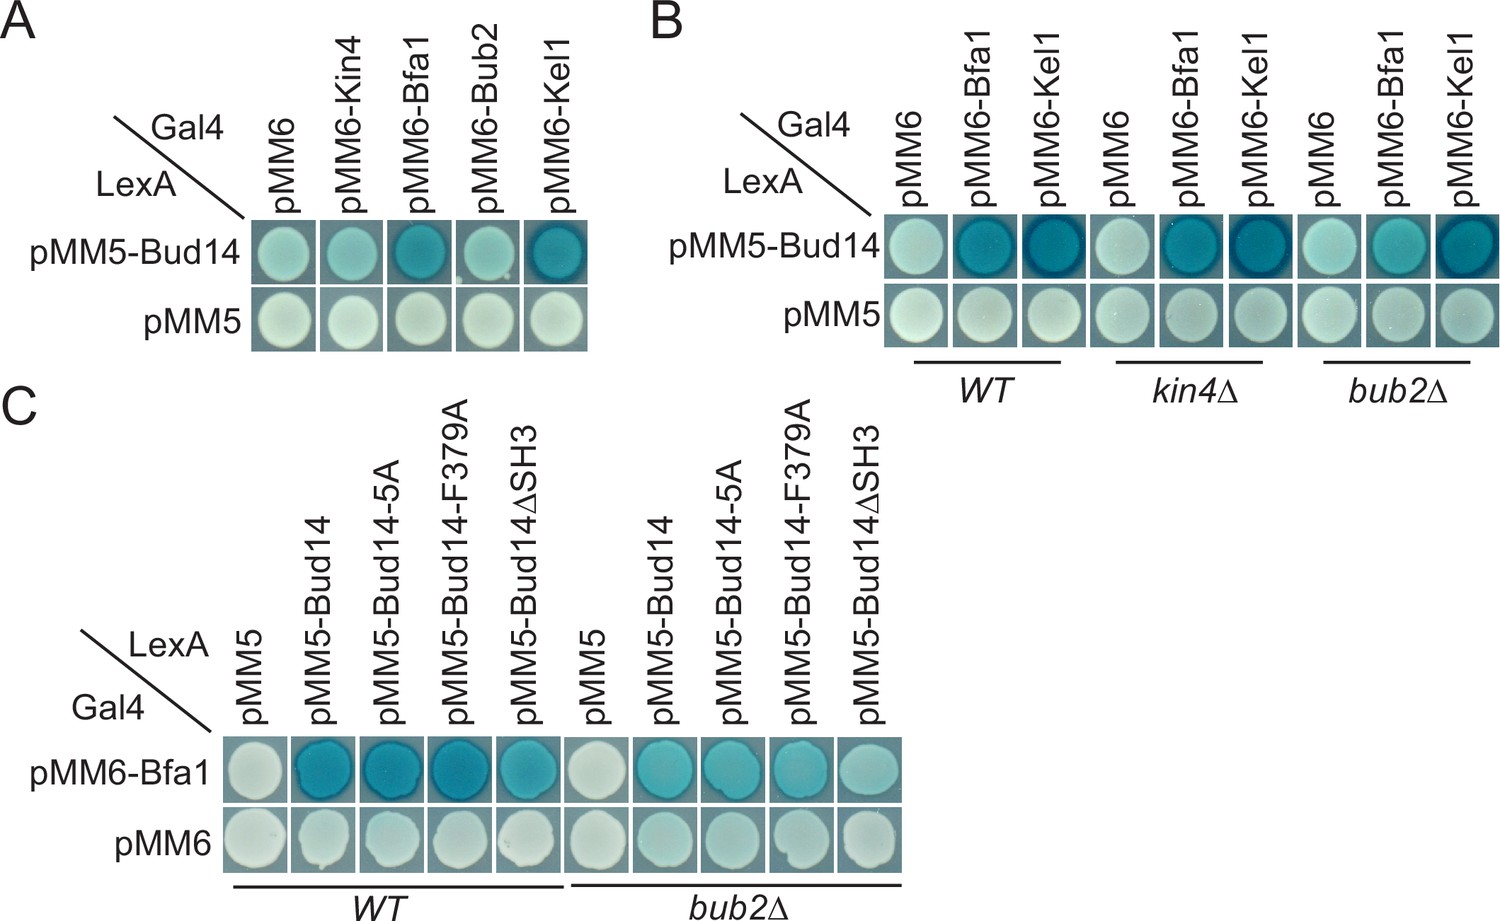
Yeast two hybrid analysis of Bud14 and Bud14 mutants with spindle position checkpoint (SPOC) proteins.
(A) Bud14 interacts with Bfa1 but not with Bub2 or Kin4. (B) Bud14-Bfa1 interaction is dependent on Bub2. (C) Bfa1-Bud14 interaction is reduced in Bud14∆SH3 mutant. SGY37 was co-transformed with indicated plasmids. Empty plasmids served as a control for any self-activation. Kel1 served as a positive control. Cells were grown for 2 days on selective agar plates before overlay. Blue color formation was monitored as an indication of protein-protein interaction.
Figure 5—figure supplement 1
Analysis of Glc7 interaction with spindle position checkpoint (SPOC) components.
Yeast two hybrid assays of Glc7 with Bfa1, Bub2, and Kin4. Bud14 was included as a positive control.
Figure 5—figure supplement 2
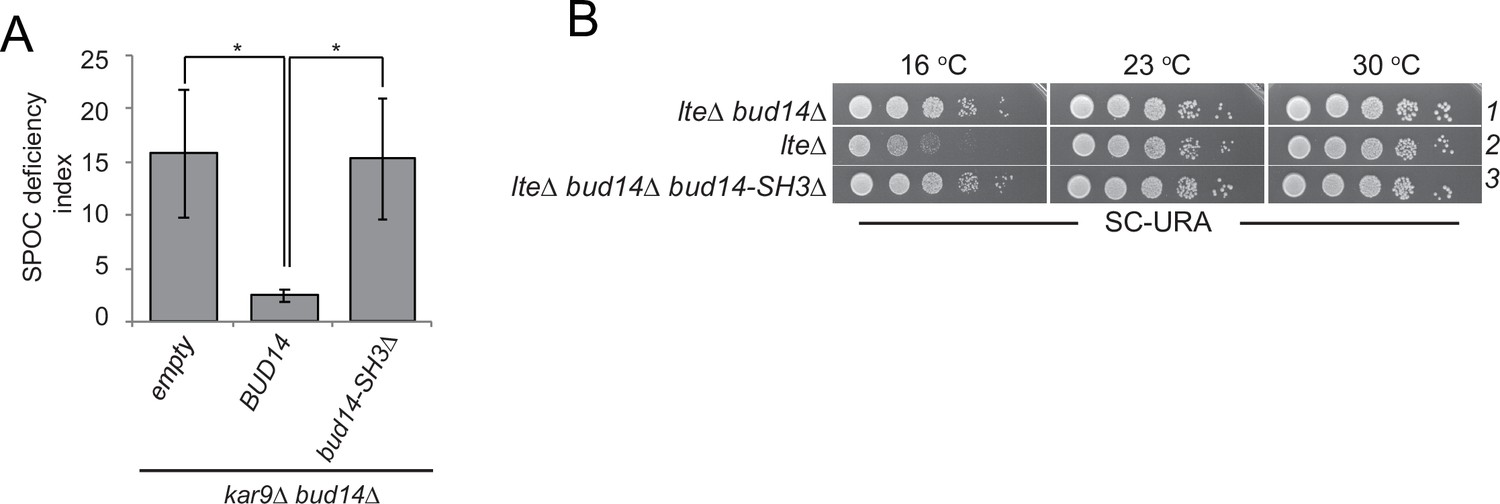
SH3 domain of Bud14 is important for Bud14 function in spindle position checkpoint (SPOC).
(A) Endpoint analysis of SPOC deficiency index in bud14∆ kar9∆ cells carrying URA3-based empty plasmid (empty) or BUD14-containing URA3-based plasmids (BUD14, bud14-ΔSH3). Values for controls (empty and BUD14) are identical to those shown in Figure 3A as experiments were performed together. Graphs are average of three independent experiments. A minimum of 100 cells were counted from each strain in each experiment. Error bars show standard deviation. *p<0.05 according to Student’s t-test. (B) Serial dilutions of indicated strains bearing URA3-based empty plasmid (not indicated on figure) or BUD14-containing URA3-based plasmids (BUD14 and bud14-ΔSH3) were spotted on SC-URA plate and grown at indicated temperatures. Controls (lanes 1 and 2) are identical to those shown in Figure 3B as all drops come from the same agar plate.
-
Figure 5—figure supplement 2—source data 1
Numerical data for Figure 5—figure supplement 2A.
- https://cdn.elifesciences.org/articles/72833/elife-72833-fig5-figsupp2-data1-v2.xlsx
Figure 6 with 3 supplements
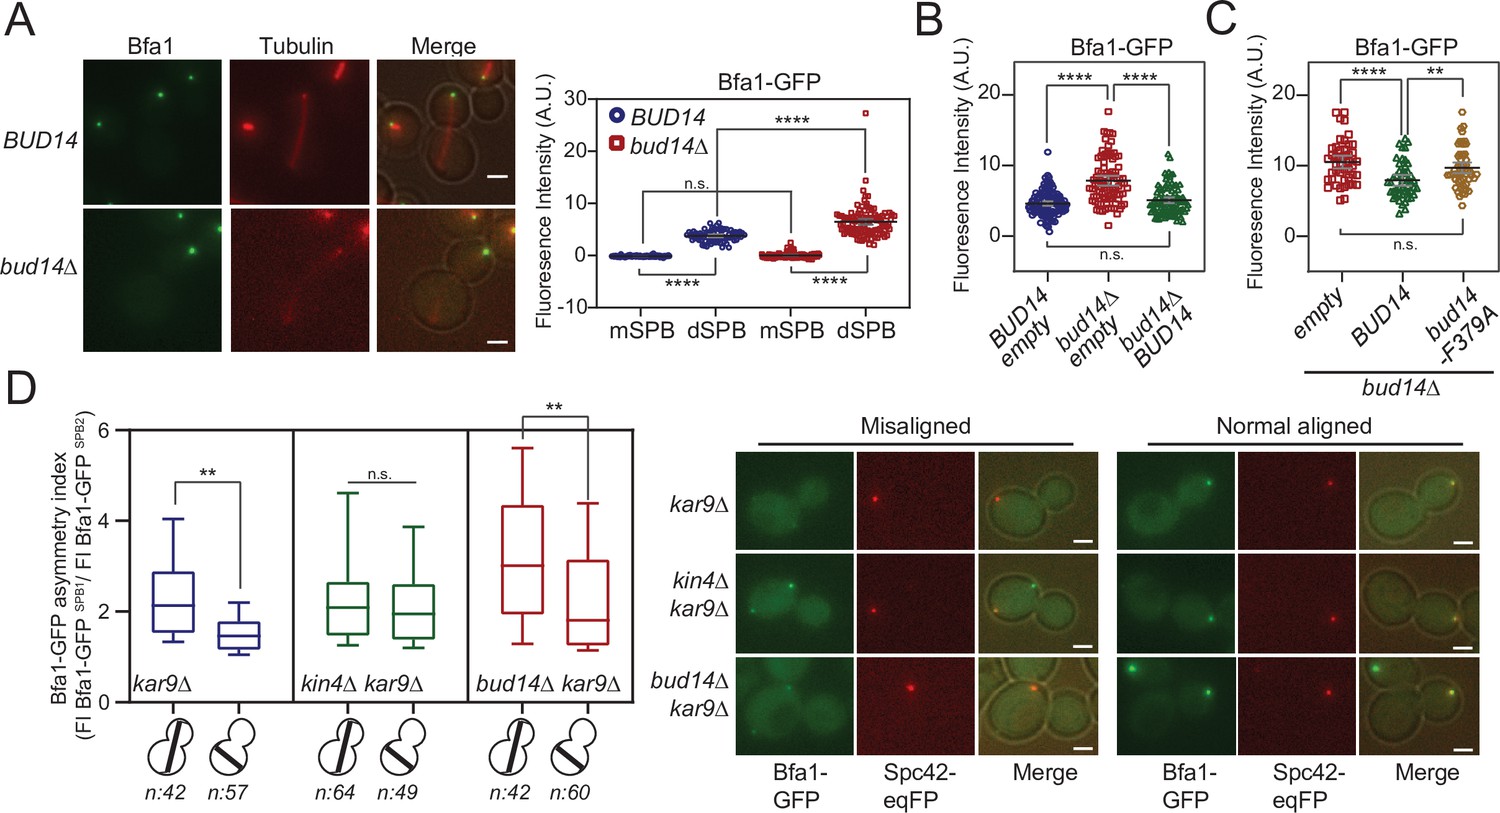
More Bfa1 localizes to daughter spindle pole body (dSPB) in the absence of BUD14.
(A) Bfa1-GFP signal intensity quantifications at the SPBs of BFA1-GFP mCherry-TUB1 or BFA1-GFP mCherry-TUB1 bud14∆ cells with normal aligned anaphase spindles were plotted on the right. Black and gray lines in the dotplots are the mean value and standard deviation, respectively. Representative still images of cells are shown on the left. (B) Bfa1-GFP signal intensities at the dSPB were plotted in BUD14 and bud14∆ cells bearing empty plasmid (blue and red), as well as bud14∆ cells bearing a ADH-BUD14-containing plasmid (green). (C) Bfa1-GFP signal intensities at the dSPB were plotted in bud14∆ cells bearing empty plasmid (red), ADH1-BUD14-containing plasmid (green) and ADH1-bud14-F379A-containing plasmid (yellow) (D) Analysis of Bfa1-GFP asymmetry at the SPBs of kar9∆, kar9∆ kin4∆, and kar9∆ bud14∆ cells with correctly aligned and misaligned anaphase spindles. Box and Whisker plot shows the ratio of Bfa1-GFP signal intensities at the SPB1 and SPB2, where SPB1 always corresponds to SPB with the greater Bfa1-GFP signal. The box represents first and third quartile while the whiskers show 10–90 percentile of the data. The horizontal line in the box indicates the median of the data. Only comparisons of normal and misaligned spindles are shown in the figure. Representative still images of cells are shown on the right. n: sample size. Scale bar: 2 µm. One-way ANOVA with uncorrected Fisher’s LSD was applied for all statistical analyses. **p<0.01, ***p<0.001, ****p<0.0001. All pairwise comparisons are shown in the corresponding source data files.
-
Figure 6—source data 1
Numerical data and statistics for Figure 6A.
- https://cdn.elifesciences.org/articles/72833/elife-72833-fig6-data1-v2.xlsx
-
Figure 6—source data 2
Numerical data and statistics for Figure 6B.
- https://cdn.elifesciences.org/articles/72833/elife-72833-fig6-data2-v2.xlsx
-
Figure 6—source data 3
Numerical data and statistics for Figure 6C.
- https://cdn.elifesciences.org/articles/72833/elife-72833-fig6-data3-v2.xlsx
-
Figure 6—source data 4
Numerical data and statistics for Figure 6D.
- https://cdn.elifesciences.org/articles/72833/elife-72833-fig6-data4-v2.xlsx
Figure 6—figure supplement 1
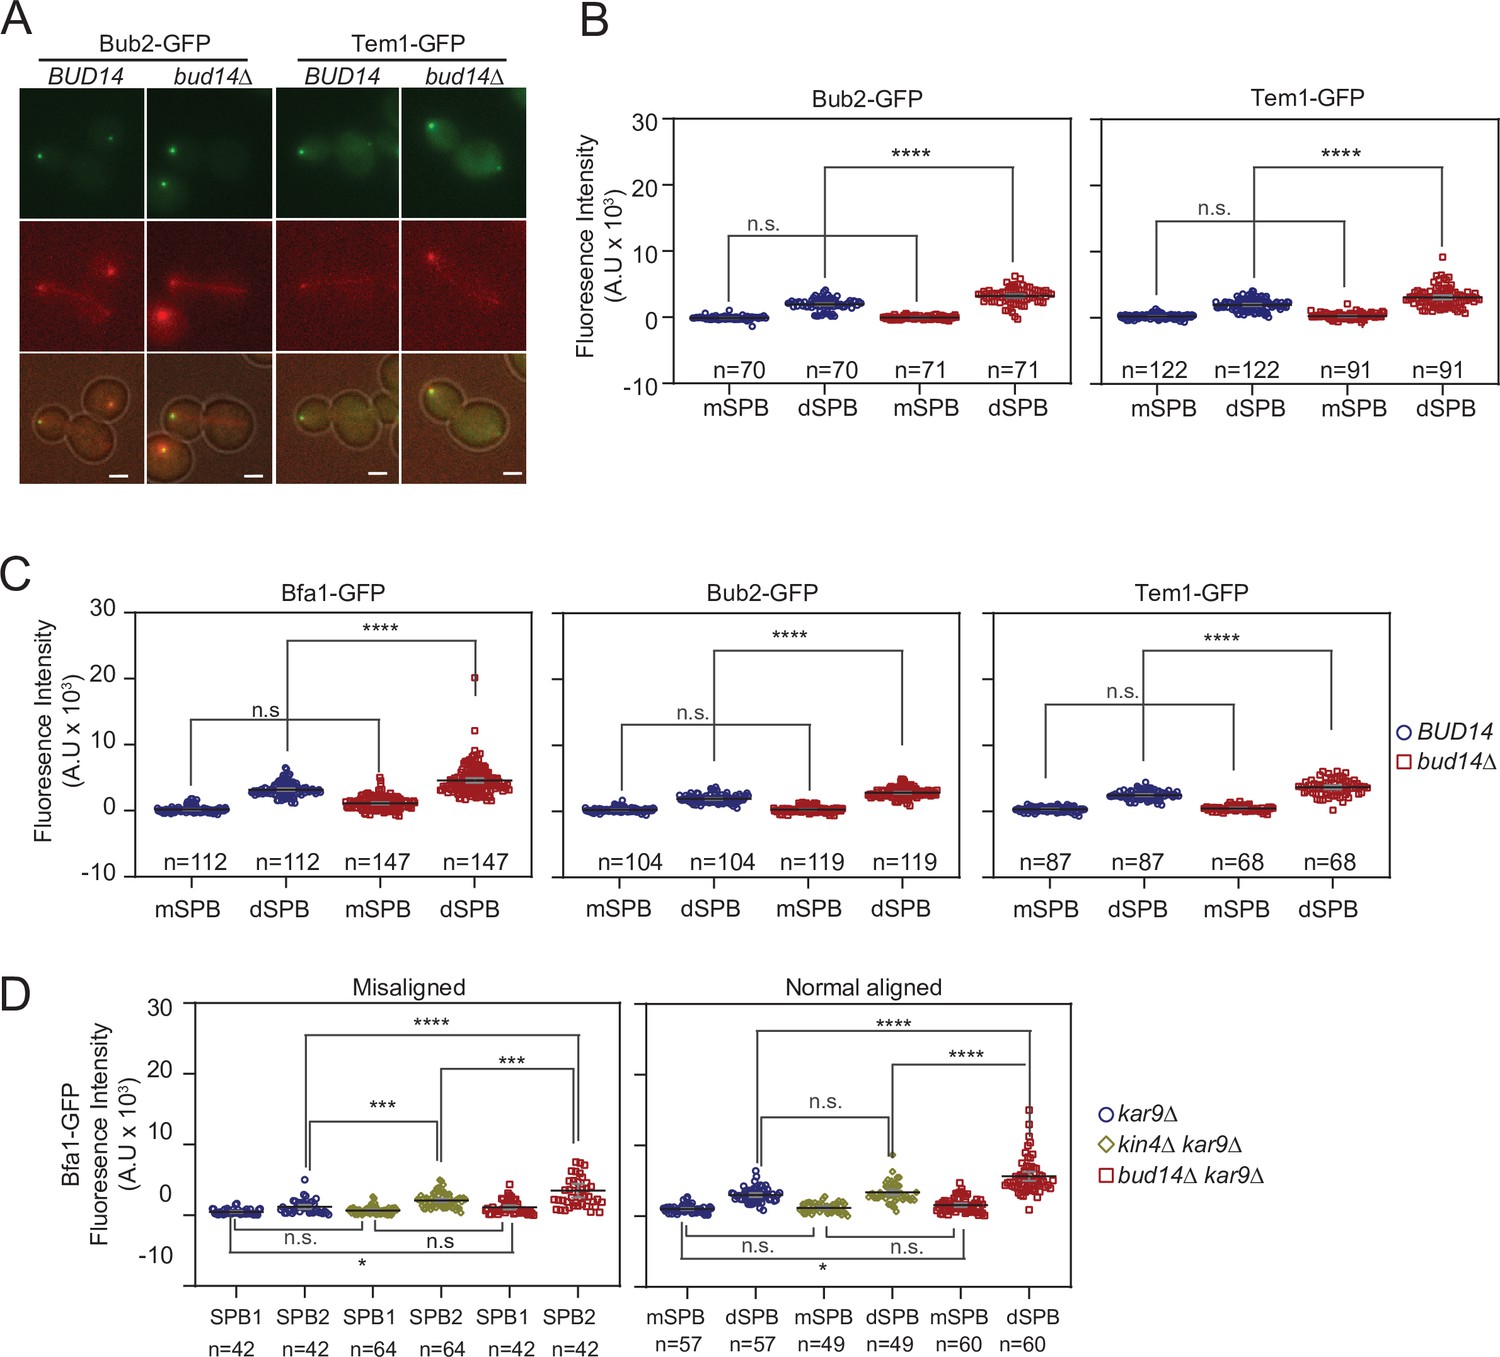
Bfa1, Bub2, and Tem1 localization in bud14∆ cells during anaphase and metaphase.
(A, B) Bub2-GFP and Tem1-GFP representative images (A) and signal intensity quantifications at the spindle pole bodies (SPBs) (B) of BFA1-GFP mCherry-TUB1 or BFA1-GFP mCherry-TUB1 bud14∆ cells with normal aligned anaphase spindles. Black and gray lines in the dotplots are the mean value and standard deviation, respectively. Representative still images of cells are shown in (A). (C) Bfa1-GFP, Bub2-GFP, and Tem1-GFP signal intensities at the SPBs of cells with metaphase spindles (spindle length = 1.5–2 µm). Graph is plotted as described in (B). (D) Analysis of Bfa1-GFP signal intensities at the SPBs of kar9∆, kar9∆ kin4∆, and kar9∆ bud14∆ cells with correctly aligned and misaligned anaphase spindles. The graph was plotted as in (B). Pairwise comparisons were performed using one-way ANOVA with uncorrected Fisher’s LSD. ***p<0.001, ****p<0.0001, n: sample size. Scale bar: 2 µm.
-
Figure 6—figure supplement 1—source data 1
Numerical data and statistics for Figure 6—figure supplement 1A.
- https://cdn.elifesciences.org/articles/72833/elife-72833-fig6-figsupp1-data1-v2.xlsx
-
Figure 6—figure supplement 1—source data 2
Numerical data and statistics for Figure 6—figure supplement 1B.
- https://cdn.elifesciences.org/articles/72833/elife-72833-fig6-figsupp1-data2-v2.xlsx
-
Figure 6—figure supplement 1—source data 3
Numerical data and statistics for Figure 6—figure supplement 1C.
- https://cdn.elifesciences.org/articles/72833/elife-72833-fig6-figsupp1-data3-v2.xlsx
-
Figure 6—figure supplement 1—source data 4
Numerical data and statistics for Figure 6—figure supplement 1D.
- https://cdn.elifesciences.org/articles/72833/elife-72833-fig6-figsupp1-data4-v2.xlsx
Figure 6—figure supplement 2
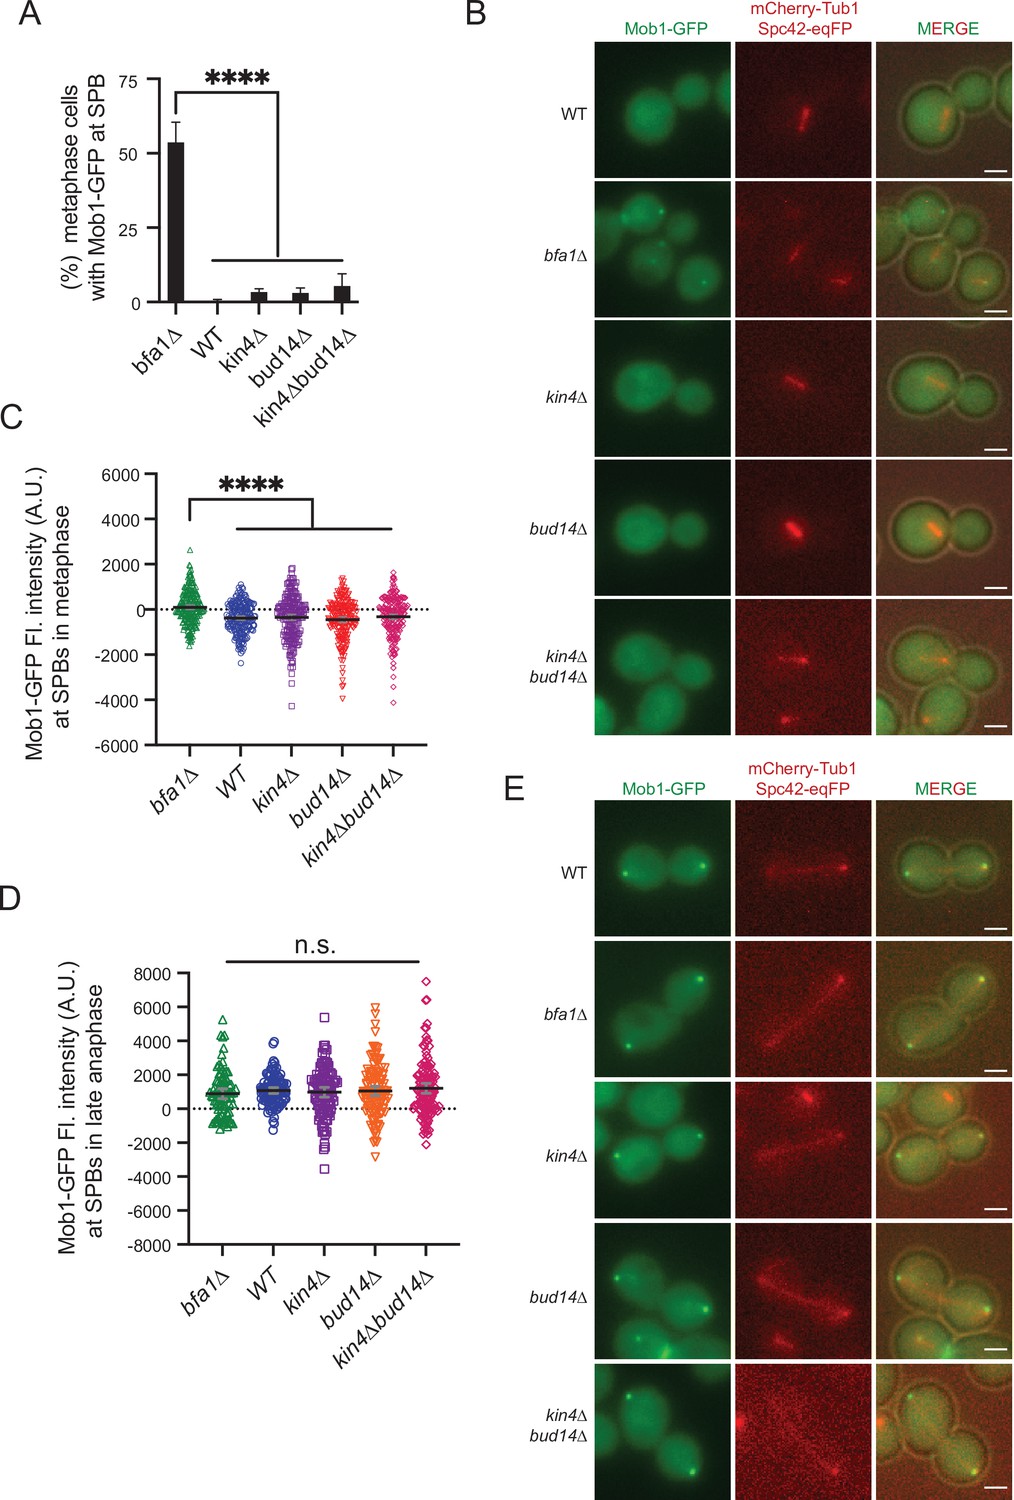
Analysis of Mob1 spindle pole body (SPB) localization.
(A) Percentage of metaphase cells (spindle length = 1.5–2 µm) with Mob1-GFP signal at the SPBs of the indicated cells. Graphs are average of three independent experiments. A minimum of 100 cells were counted from each strain in each experiment. Error bars show standard deviation. (B) Representative still images showing Mob1-GFP localization in metaphase cells. (C, D) Dotplot of Mob1-GFP signal intensity at the SPBs of indicated strains carrying MOB1-GFP mCherry-TUB1 in metaphase (C) and anaphase (D). Black lines represent the mean value, and gray lines show standard deviation. (E) Representative still images of anaphase cells. Scale bar: 2 µm. One-way ANOVA with uncorrected Fisher’s LSD was used for pairwise comparisons. ****p<0.0001.
-
Figure 6—figure supplement 2—source data 1
Numerical data and statistics for Figure 6—figure supplement 2C.
- https://cdn.elifesciences.org/articles/72833/elife-72833-fig6-figsupp2-data1-v2.xlsx
-
Figure 6—figure supplement 2—source data 2
Numerical data and statistics for Figure 6—figure supplement 2D.
- https://cdn.elifesciences.org/articles/72833/elife-72833-fig6-figsupp2-data2-v2.xlsx
Figure 6—figure supplement 3
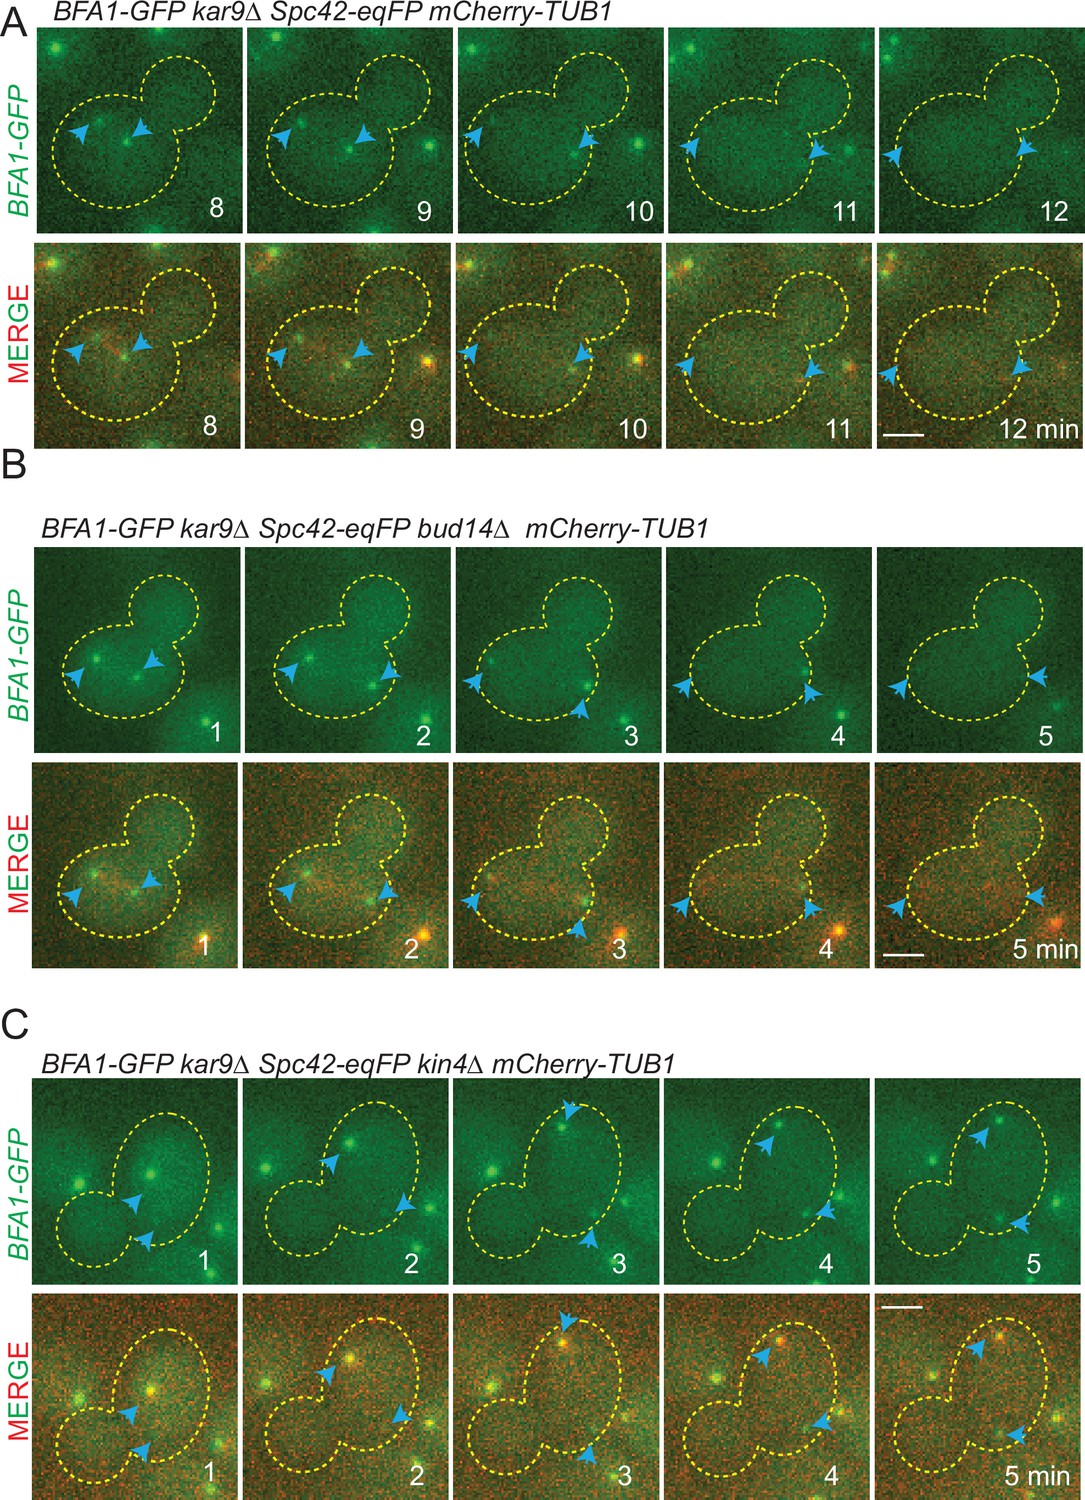
Bfa1-GFP localization during spindle misalignment.
Selected frames from time-lapse series of BFA1-GFP SPC42-eqFP mCherry-TUB1-bearing kar9∆ (A), kar9∆ bud14∆ (B), and kar9∆ kin4∆ (C) gene deletions. Cell boundaries are outlined with a dashed line. Blue arrows indicate the spindle pole bodies (SPBs). Time points from the beginning of the time lapse are indicated on the frames. Scale bar: 2 µm.
Figure 7 with 2 supplements
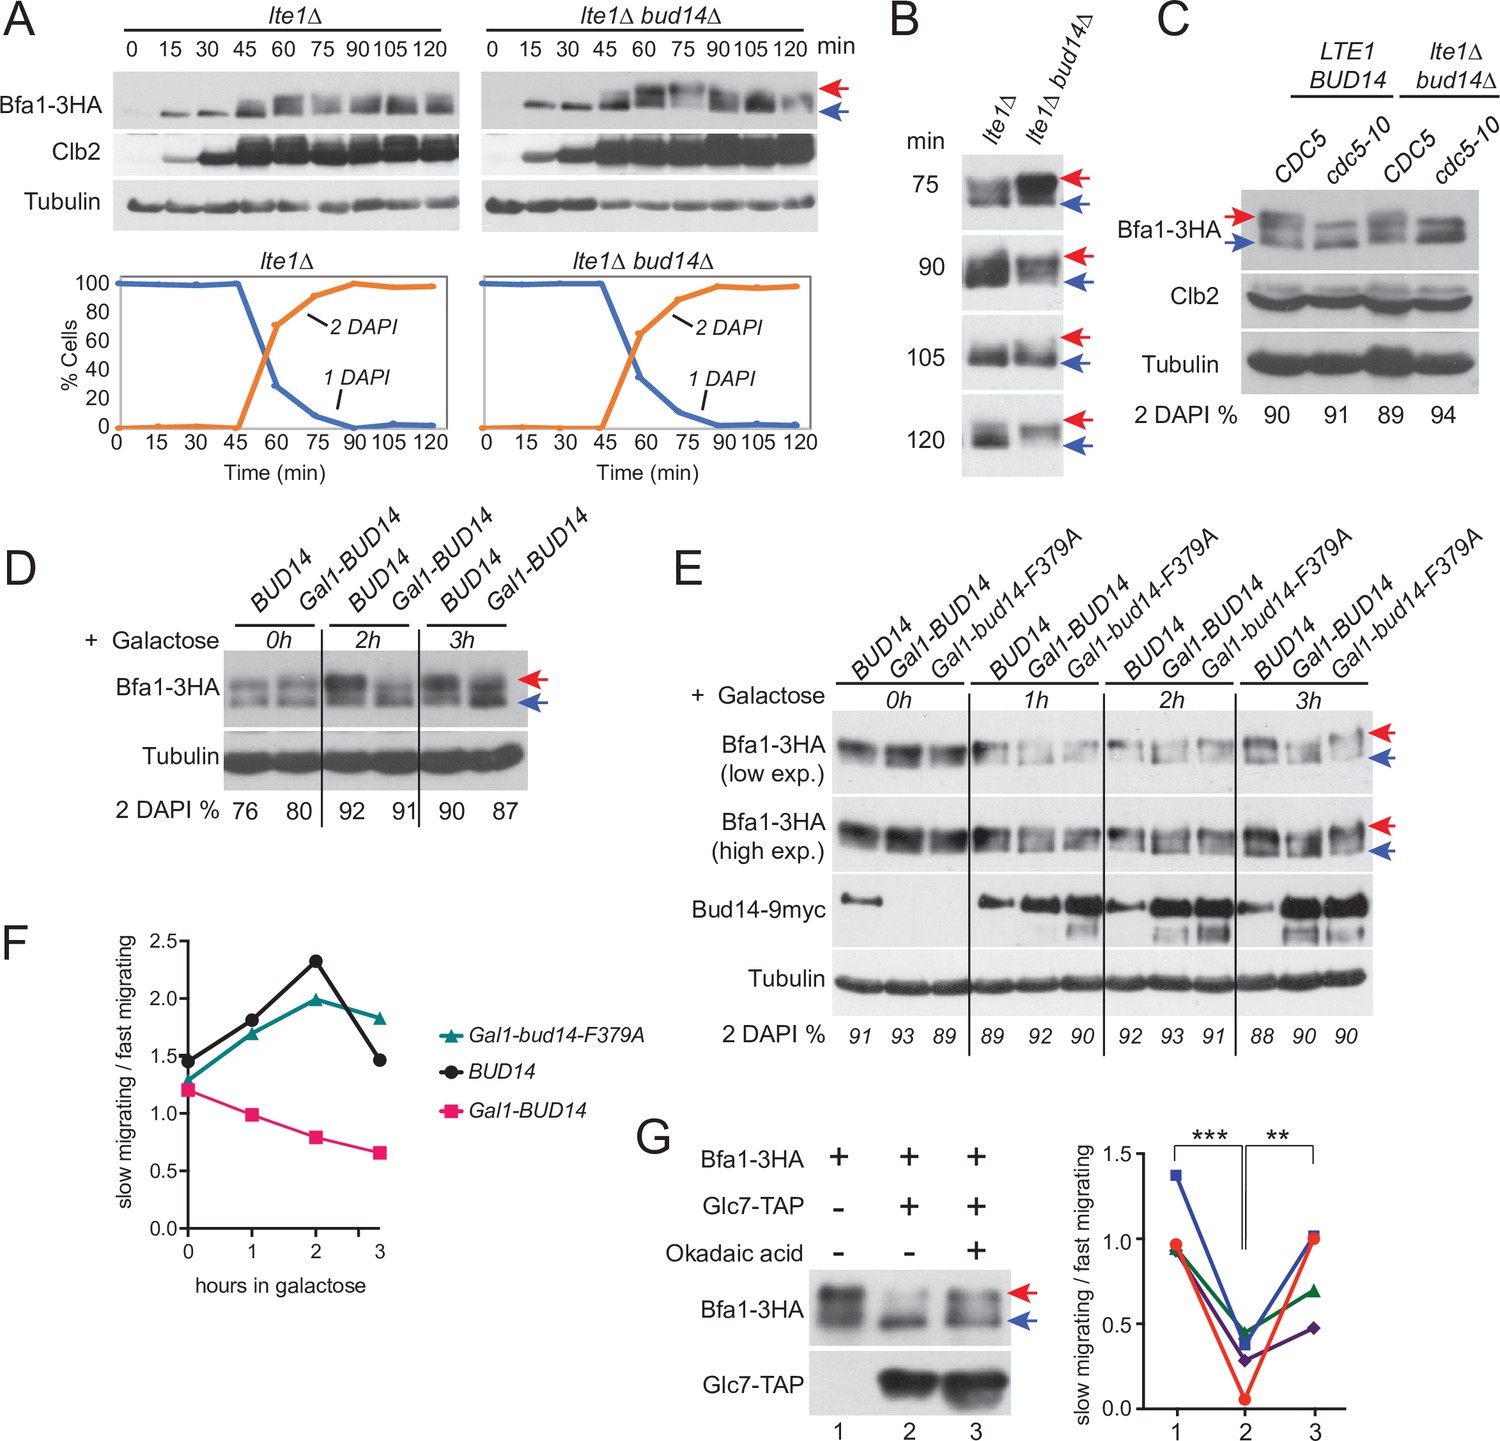
Glc7-Bud14 promotes Bfa1 dephosphorylation in anaphase.
(A) Bfa1-3HA Gal1-UPL-Tem1-containing lte1∆ and lte1∆ bud14∆ cells grown in galactose-containing medium were released from alpha factor-imposed G1 arrest (t = 0) into an alpha factor-free medium supplemented with glucose to achieve Tem1 depletion, and samples were collected at indicated time points. Bfa1-3HA mobility shift was analyzed via western blotting using anti-HA antibodies. Red arrow indicates hyperphosphorylated forms of Bfa1-3HA, whereas blue arrow indicates hypophosphorylated forms of Bfa1-3HA. Percentage of cells with single nucleus (1 DAPI) and two separate nuclei (2 DAPI) were plotted as a marker for cell cycle progression. (B) Indicated time points of each cell type from the experiment shown in (A) were loaded side-by-side for better comparison of Bfa1-3HA mobility. (C) Bfa1-3HA mobility in Gal1-UPL-TEM1 or cdc5-10-bearing LTE1 BUD14 or lte1∆bud14∆ cells. Percentage of cells with two separate nuclei (% 2 DAPI) are indicated as a measure of cells in anaphase. Cells were first arrested in G1, then released from the G1 arrest and cultured for 90 min before sample collection. Gal1-UPL-Tem1 cells were treated as in (A) to achieve the anaphase arrest, whereas anaphase arrest of cdc5-10 cells was achieved through growth at 37°C. (D) cdc15-as-bearing cells bearing BUD14 or Gal1-BUD14 at the Bud14 endogenous locus were grown to log-phase in raffinose-containing medium, treated with 1NM-PP1 for 2,5 hr followed by galactose addition (t0) to the medium. Samples were collected at 0 hr, 2 hr, and 3 hr after galactose addition and Bfa1 mobility was analyzed. Percentage of cells with two separate nuclei (% 2 DAPI) is indicated as a measure of cells in anaphase. (E) cdc15-as bud14∆ cells with BUD14-9myc, Gal1-BUD14-9myc, or Gal1-bud14-F379A-9myc integrated at the chromosomal leu2 locus were grown to log-phase in raffinose-containing medium, treated with 1NM-PP1 for 3 hr, followed by galactose addition (t0) to the medium. Samples were collected at 0 hr, 1 hr, 2 hr, and 3 hr after galactose addition and Bfa1 mobility was analyzed. Percentage of cells with two separate nuclei (% 2 DAPI) is indicated as a measure of cells in anaphase. (F) Quantification of relative levels of hypersphosphorylated Bfa1 from the experiment shown in (E). Band intensity ratio of slow-migrating forms to fast-migrating forms of Bfa1 is plotted. (G) In vitro phosphatase assay of immunoprecipitated Glc7-TAP on IgG beads is incubated with Bfa1-3HA purified from BFA1-3HA Gal1-UPL-TEM1 kin4∆ cells in the presence or absence of 1.5 µM okadaic acid. As a no Glc7-TAP control, IgG beads incubated with cell lysates of ESM356-1 were used. Glc7-TAP levels were detected using anti-TAP antibodies. Bfa1-3HA was detected using anti-HA antibodies. Red and blue arrows indicate slow-migrating and fast-migrating forms of Bfa1-3HA, respectively. Quantification of relative levels of hypersphosphorylated Bfa1 is shown on the right. Each color represents a different independent experiment. One-way ANOVA with uncorrected Fisher’s LSD was applied for statistical analysis. **p<0.01, ****p<0.0001.
-
Figure 7—source data 1
Labeled uncropped blot images for Figure 7A and B.
- https://cdn.elifesciences.org/articles/72833/elife-72833-fig7-data1-v2.zip
-
Figure 7—source data 2
Raw scans of the x-ray films for Figure 7—source data 1b, (A) anti-HA blot, (B) anti-Clb2 blot, (C) anti-tubulin blot, and (D) anti-HA blot.
- https://cdn.elifesciences.org/articles/72833/elife-72833-fig7-data2-v2.zip
Figure 7—figure supplement 1
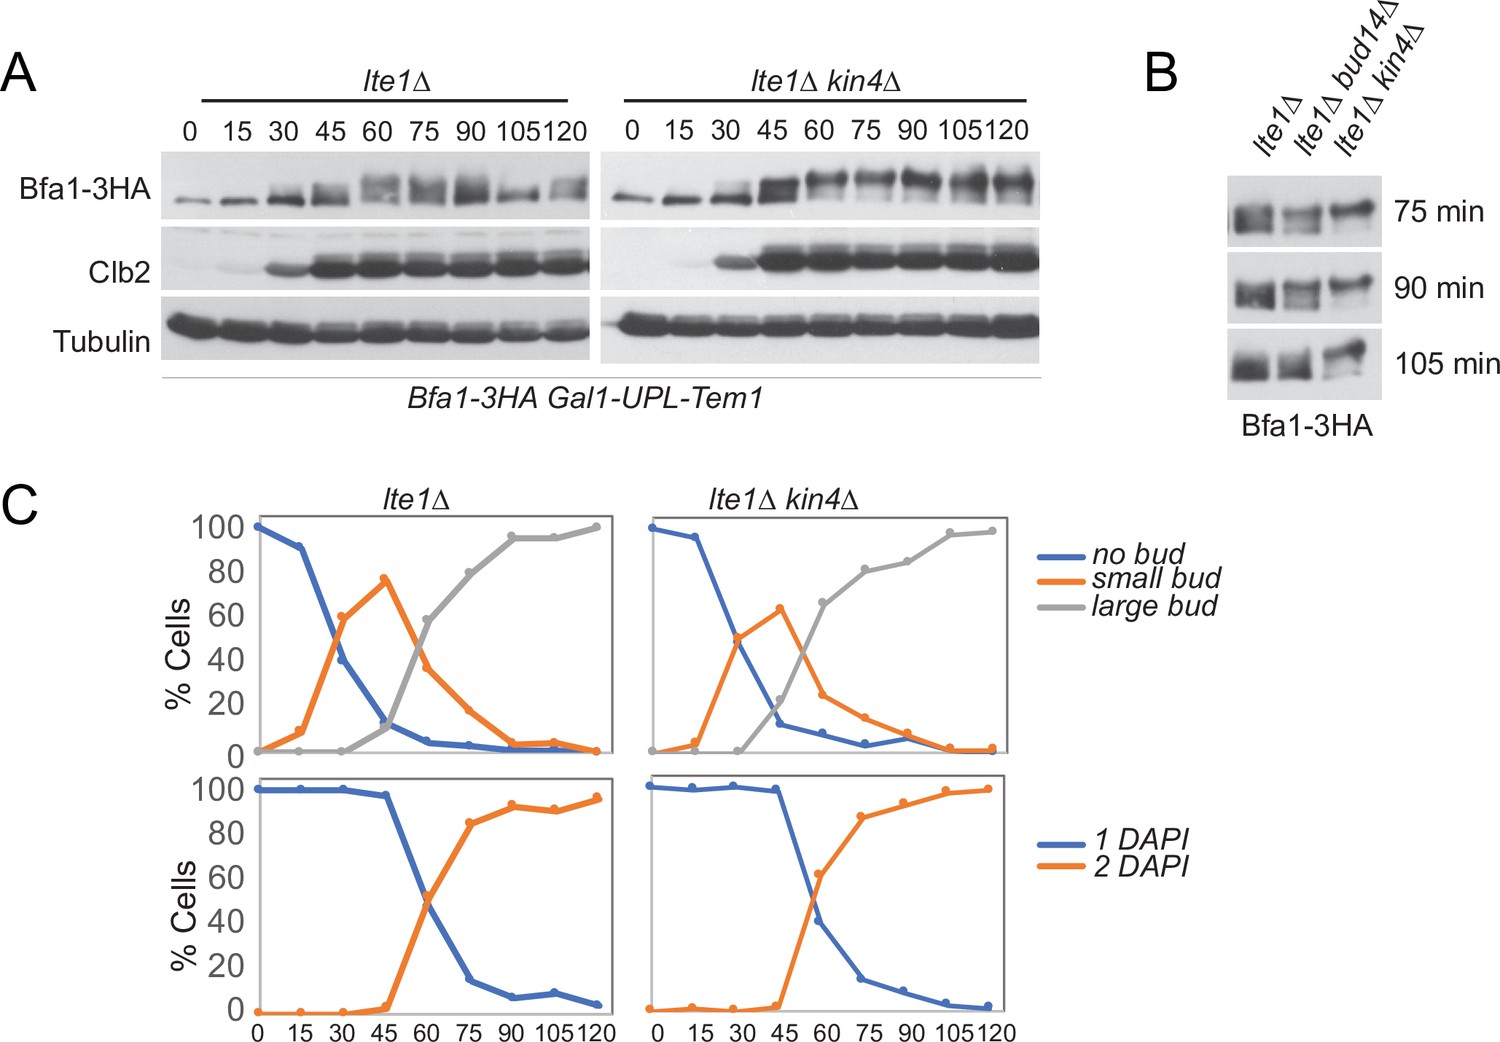
Analysis of Bfa1 mobility in lte1∆ and lte1∆ kin4∆ cells.
(A) Bfa1-3HA Gal1-UPL-Tem1-containing lte1∆ and lte1∆kin4∆ cells grown in galactose-containing medium were released from G1 arrest (t = 0) into an alpha factor-free medium supplemented with glucose. Samples were collected at indicated time points. Bfa1-3HA mobility shift was analyzed via western blotting. (B) Indicated time points of each cell type from the experiment shown in (A) were loaded side-by-side for better comparison of Bfa1-3HA mobility. (C) Percentage of cells with single nucleus (1 DAPI) and two separate nuclei (2 DAPI) as well as budding index of the experiment shown in (A) were plotted as a marker for cell cycle progression.
-
Figure 7—figure supplement 1—source data 1
Labeled uncropped blot images for Figure 7—figure supplement 1.
- https://cdn.elifesciences.org/articles/72833/elife-72833-fig7-figsupp1-data1-v2.pdf
-
Figure 7—figure supplement 1—source data 2
Raw scans of the blot images for (A) anti-HA blot.
- https://cdn.elifesciences.org/articles/72833/elife-72833-fig7-figsupp1-data2-v2.zip
Figure 7—figure supplement 2
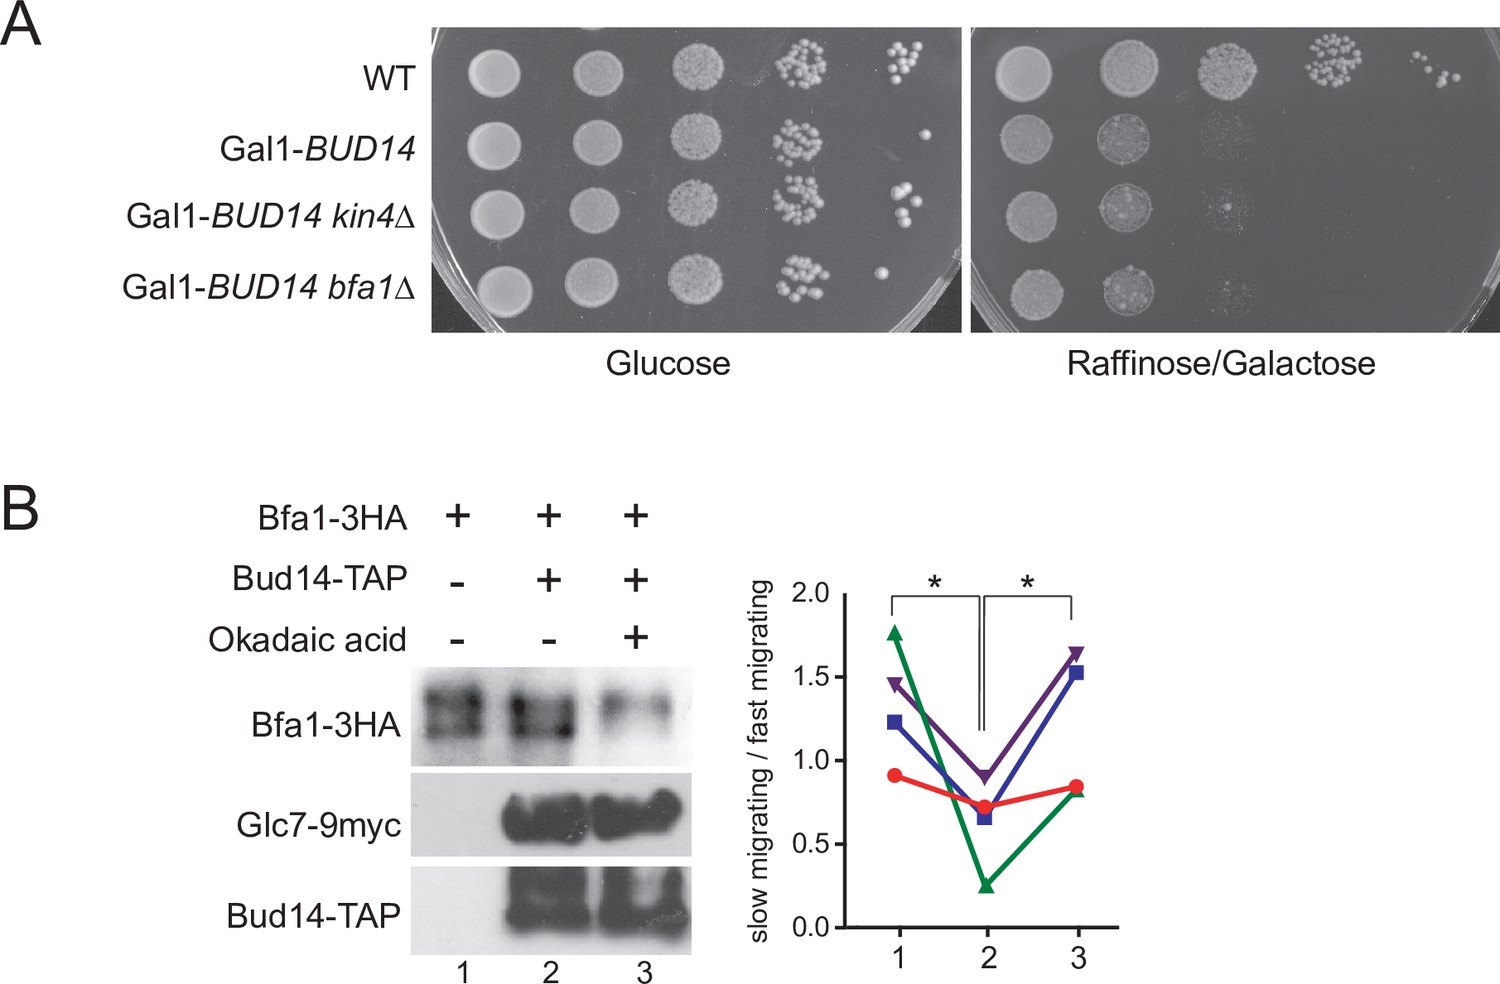
Kin4 overexpression toxicity in bud14∆ cells and phosphatase assay using Bud14-TAP.
(A) Serial dilutions of indicated strains were spotted on glucose-containing (YPD) and galactose-containing (YP Raf/Gal) agar plates. Gal1-Bud14 overexpression is induced on galactose-containing plates. (B) In vitro phosphatase assay of immunoprecipitated Bud14-TAP. Bud14-TAP was pulled on IgG Sepharose beads from the lysates of BUD14-TAP GLC7-9myc cells. Beads were incubated with Bfa1-3HA purified from BFA1-3HA Gal1-UPL-TEM1 kin4∆ cells in the presence or absence of okadaic acid. Beads incubated with ESM356-1 cell lysates were used as a negative control. Bud14-TAP levels were detected using anti-TAP, Glc7-9myc levels were detected using anti-myc, and Bfa1-3HA was detected using anti-HA antibodies. Quantification of relative levels of hypersphosphorylated Bfa1 is shown on the right. Each color represents a different independent experiment. One-way ANOVA with uncorrected Fisher’s LSD was applied for statistical analysis. **p<0.01.
-
Figure 7—figure supplement 2—source data 1
Labeled uncropped blot images for Figure 7—figure supplement 2B.
- https://cdn.elifesciences.org/articles/72833/elife-72833-fig7-figsupp2-data1-v2.pdf
-
Figure 7—figure supplement 2—source data 2
Raw scans of the blot images for (A) anti-HA blot and (B) anti-TAP and anti-Myc blots.
- https://cdn.elifesciences.org/articles/72833/elife-72833-fig7-figsupp2-data2-v2.zip
Tables
Table 1
Yeast strains used in this study.
| Strain name | Description | Reference |
|---|---|---|
| AKY038 | ESM356 Bfa1-GFP-kanMX6 Spc42-eqFP- hphNT1 mCherry-Tub1-URA3 | This study |
| AKY043 | ESM356 BFA1-GFP-kanMX6 Spc42-eqFP-hphNT1 kar9∆::klTRP1 pRS316-KAR9 | Caydasi and Pereira, 2009 |
| AKY1533 | ESM356 leu2::LEU2-pGal1-KIN4 | This study |
| AKY1574 | ESM356 leu2::LEU2-pGal1-KIN4 bub2∆::hphNT1 | This study |
| AKY2526 | FAY145 lte1∆::kanMX6 pRS316-LTE1 spo12∆::natNT2 | Caydasi et al., 2017 |
| AKY260 | ESM356 kar9∆::HIS3MX6 pRS316-KAR9 | Caydasi et al., 2017 |
| AKY2916 | FAY145 lte1∆::kanMX6 pRS316-LTE1 spo12∆::natNT2 bud14∆::HIS3MX6 | This study |
| AKY2917 | YPH499 GFP-Tub1-URA3 dyn1∆::klTRP1 bud14∆::HIS3MX6 | This study |
| AKY2918 | YPH499 GFP-Tub1-URA3 dyn1∆::klTRP1 kin4∆::hphNT1 bud14∆::HIS3MX6 | This study |
| AKY315 | ESM356 kar9∆::HIS3MX6 pRS316-KAR9 bfa1∆::klTRP1 | Caydasi et al., 2017 |
| AKY321 | ESM356 kar9∆::HIS3MX6 pRS316-KAR9 kin4∆::klTRP1 | Caydasi et al., 2017 |
| AKY346 | YPH499 kar9∆::klTRP1 pRS316-KAR9 GFP-Tub1-ADE2 | Caydasi et al., 2010b |
| AKY351 | YPH499 kar9∆::klTRP1 pRS316-KAR9 kin4∆::HIS3MX6 GFP-Tub1-ADE2 | Caydasi et al., 2017 |
| AKY4001 | ESM356 leu2::LEU2-pGal1-KIN4 bud14∆::klTRP1 | This study |
| AKY4006 | ESM356 KIN4-GFP-HIS3MX6 Spc42-eqFP-natNT2 bud14∆::klTRP1 lte1∆::hphNT1 mCherry-Tub1-URA3 | This study |
| AKY4007 | ESM356 Bub2-GFP-kanMX6 Spc42-eqFP-hphNT1 mCherry-Tub1-URA3 | This study |
| AKY4008 | ESM356 Tem1-GFP-kanMX6 Spc42-eqFP-hphNT1 bud14∆::HIS3MX6 mCherry-Tub1-URA3 | This study |
| AKY4009 | ESM356 Bub2-GFP-kanMX6 Spc42-eqFP-hphNT1 bud14∆::klTRP1 mCherry-Tub1-URA3 | This study |
| AKY4011 | ESM356 Bfa1-GFP-kanMX6 Spc42-eqFP-hphNT1 bud14∆::klTRP1 mCherry-Tub1-URA3 | This study |
| AKY4012 | ESM356 Bfa1-GFP-kanMX6 Spc42-eqFP-hphNT1 mCherry-Tub1-URA3 | This study |
| AKY4013 | ESM356 Tem1-GFP-kanMX6 Spc42-eqFP-hphNT1 mCherry-Tub1-URA3 | This study |
| AKY4016 | ESM356 KIN4-GFP-HIS3MX6 Spc42-eqFP-natNT2 lte1∆::URA3 mCherry-Tub1-kITRP1 | This study |
| AKY4028 | FAY145 lte1∆::kanMX6 bud14∆::HIS3MX6 | This study |
| AKY4036 | FAY145 lte1∆::kanMX6 bud14∆::HIS3MX6 pRS416-endogenous BUD14-promoter- GFP-BUD145A | This study |
| AKY4038 | FAY145 lte1∆::kanMX6 bud14∆::HIS3MX6 pRS416-endogenous BUD14-promoter- GFP-BUD14∆SH3 | This study |
| AKY404 | ESM356 KIN4-GFP-HIS3MX6 Spc42-eqFP-natNT2 rts1∆::klTRP1 | |
| AKY4040 | ESM356 Spc42-eqFP-hphNT1 BUD14-GFP-his3MX6 mCherry-Tub1-URA3 | This study |
| AKY4068 | YPH499 kar9∆::klTRP1 pRS316-KAR9 GFP-Tub1-ADE2 bud14∆::HIS3MX6 kin4∆::hphNT1 | This study |
| AKY4078 | PAY704 MATa ade2-1 his3-11,15 leu2-3,112 ura3-1 can1-100 ssd1-d2 glc7::LEU2 trp1-1::GLC7::TRP1 kar9∆::hphNT1 | This study |
| AKY4079 | PAY701 MATa ade2-1 his3-11,15 leu2-3,112 ura3-1 can1-100 ssd1-d2 glc7::LEU2 trp1-1::glc7-12::TRP1 kar9∆::hphNT1 | This study |
| AKY4087 | ESM356 cdc15::CDC15-as1(L99G)-URA3 Bfa1-3HA- kITRP1 pGal1-Bud14-natNT2 | This study |
| AKY4088 | ESM356 Mob1-GFP-kanMX6 Spc42-eqFP-hphNT1 kin4∆::natNT2 bud14∆::HIS3MX6 | This study |
| AKY4091 | YPH499 cdc5-10 Bfa1-3HA-kITRP1 lte1∆::natNT2 bud14∆::HIS3MX6 | This study |
| AKY4094 | YPH499 cdc14-2 pRS316-CDC14 bfa1Δ::klTRP3 | This study |
| AKY4095 | YPH499 dbf2-2 pRS316-DBF2 bfa1Δ::klTRP3 | This study |
| AKY4102 | ESM356 Mob1-GFP-kanMX6 Spc42-eqFP-hphNT1 kin4∆::natNT2 bud14∆::HIS3MX6 mCherry-Tub1-LEU2 | This study |
| AKY415 | ESM356 KIN4-6HA-hphNT1 rts1∆::klTRP1 | |
| BKY032 | ESM356 BFA1-GFP-kanMX6 Spc42-eqFP-hphNT1 kar9∆::klTRP1 pRS316-KAR9 kin4∆::HIS3MX6 | |
| DGY001 | ESM356 KIN4-6HA-hphNT1 bud14∆::klTRP1 | This study |
| DGY004 | ESM356 KIN4-GFP-HIS3MX6 Spc42-eqFP-natNT2 bud14∆::klTRP1 | This study |
| DKY056 | YPH499 bud14∆::kITRP3 | This study |
| DKY057 | YPH499 cdc14-2 pRS316-CDC14 bud14Δ::klTRP3 | This study |
| DKY058 | YPH499 mob1-67 pRS316-MOB1 bud14Δ::klTRP3 | This study |
| DKY060 | YPH499 dbf2-2 pRS316-DBF2 bud14Δ::klTRP3 | This study |
| DKY061 | YPH499 cdc15-1 pRS316-CDC15 bud14Δ::klTRP3 | This study |
| DKY063 | ESM356 KIN4-GFP-HIS3MX6 Spc42-eqFP611-natNT2 bud14∆::klTRP1 | This study |
| DKY069 | FAY145 lte1∆::kanMX6 pRS316-LTE1 bud14∆::HIS3MX6 | This study |
| DKY070 | PAY704 MATa ade2-1 his3-11,15 leu2-3,112 ura3-1 can1-100 ssd1-d2 glc7::LEU2 trp1-1::GLC7::TRP1 | This study |
| DKY071 | PAY701 MATa ade2-1 his3-11,15 leu2-3,112 ura3-1 can1-100 ssd1-d2 glc7::LEU2 trp1-1::glc7-12::TRP1 | This study |
| DKY074 | PAY701 glc7::LEU2 trp1-1::glc7-12::TRP1 lte1∆::HIS3MX6 | This study |
| DKY075 | PAY704 glc7::LEU2 trp1-1::GLC7::TRP1 lte1∆::HIS3MX6 | This study |
| DKY078 | PAY704 glc7::LEU2 trp1-1::GLC7::TRP1 lte1∆::HIS3MX6 pRS316-LTE1 | This study |
| DKY079 | PAY701 glc7::LEU2 trp1-1::glc7-12::TRP1 lte1∆::HIS3MX6 pRS316-LTE1 | This study |
| DKY080 | PAY701 glc7::LEU2 trp1-1::glc7-12::TRP1 lte1∆::HIS3MX6 pRS316-LTE1 spo12∆::hphNT1 | This study |
| DKY081 | ESM356 BFA1-GFP-kanMX6 Spc42-eqFP hphNT1 kar9∆::klTRP1 pRS316-KAR9 bud14∆::HIS3MX6 | This study |
| DKY101 | ESM356 GAL1-UPL-TEM1::kITRP1 Bfa1-3HA-hphNT1 | This study |
| DKY113 | SGY37-VIII,3 bub2∆::hphNT1 | This study |
| DKY115 | ESM356 Bfa1-3HA-hphNT1 kin4∆::natNT2 pWS103 (pGal1-UPL-Tem1-kITRP1) | This study |
| DKY118 | ESM356 GAL1-UPL-TEM1::kITRP1 Bfa1-3HA-hphNT1 lte1∆::natNT2 | This study |
| DKY123 | YPH499 cdc5-10 Bfa1-3HA-hphNT1 | This study |
| DKY125 | ESM356 GAL1-UPL-TEM1::kITRP1 Bfa1-3HA-hphNT1 kin4∆::natNT2 bud14∆::HIS3MX6 | This study |
| DKY126 | ESM356 GAL1-UPL-TEM1::kITRP1 Bfa1-3HA-hphNT1 lte1∆::natNT2 bud14∆::HIS3MX6 | This study |
| DKY131 | FAY145 lte1∆::kanMX6 pRS316-LTE1 bud14∆::HIS3MX 6GFP BUD14 CEN URA | This study |
| DKY132 | ESM356 bud14∆::klTRP GFP BUD14 CEN URA | This study |
| DKY135 | FAY145 lte1∆::kanMX6 bud14∆::HIS3MX6 pRS416-ADH-BUD14 | This study |
| DKY137 | FAY145 lte1∆::kanMX6 bud14∆::HIS3MX6 pRS416-ADH-BUD14-F379A | This study |
| DKY145 | ESM356 kar9∆::HIS3MX6 bud14∆::klTRP1 pRS316 | This study |
| DKY147 | ESM356 kar9∆::HIS3MX6 bud14∆::klTRP1 pMK125 | This study |
| DKY149 | ESM356 kar9∆::HIS3MX6 bud14∆::klTRP1 pMK131 | This study |
| DKY167 | ESM356 KIN4-GFP-HIS3MX6 Spc42-eqFP-natNT2 bud14∆::klTRP1 lte1∆::hphNT1 | This study |
| DKY179 | YPH499 cdc5-10 pRS316-CDC5 bud14Δ::klTRP3 | This study |
| DKY188 | ESM356 KIN4-GFP-HIS3MX6 Spc42-eqFP-natNT2 lte1∆::URA3 | This study |
| ESM2156 | YPH499 GFP-Tub1-URA3 dyn1∆::klTRP1 kin4∆::hphNT1 | Pereira and Schiebel, 2005 |
| ESM2282 | YPH499 cdc15-1 pRS316-CDC15 | Caydasi et al., 2017 |
| ESM2283 | YPH499 dbf2-2 pRS316-DBF2 | Caydasi et al., 2017 |
| ESM2285 | YPH499 mob1-67 pRS316-MOB1 | Caydasi et al., 2017 |
| ESM2326 | ESM356 KIN4-6HA-hphNT1 | Caydasi et al., 2010b |
| ESM356 | MATa ura3-52 leu2∆one his3∆200 trp1∆63 | Pereira and Schiebel, 2001 |
| FAY145 | MATa ura3-52 his3∆200 leu2∆one lte1∆::kanMX6 pRS316-LTE1 | Bertazzi et al., 2011 |
| GPY1033 | ESM356-1 KIN4-GFP-his3MX6 Spc42-eqFP-natNT2 | Pereira and Schiebel, 2005 |
| GPY1054 | ESM356 Mob1-GFP-kanMX6 Spc42-eqFP-hphNT1 | This study |
| GPY491 | YPH499 cdc14-2 pRS316- CDC14 | Caydasi et al., 2017 |
| GYBY005 | ESM356 Glc7-TAP-kanMX6 (CBP-Tev-4ProtA-kanMX6) | This study |
| HKY099 | ESM356 BFA1-GFP-kanMX6 Spc42-eqFP-hphNT1 kar9∆::klTRP1 pRS316-KAR9 mCherry-Tub1-LEU2 | This study |
| HKY100 | ESM356 BFA1-GFP-kanMX6 Spc42-eqFP-hphNT1 kar9∆::klTRP1 pRS316-KAR9 kin4∆::HIS3MX6 mCherry-Tub1-LEU2 | This study |
| HKY101 | ESM356 BFA1-GFP-kanMX6 Spc42-eqFP-hphNT1 kar9∆::klTRP1 pRS316-KAR9 bud14∆::HIS3MX6 mCherry-Tub1-LEU2 | This study |
| HKY114 | ESM356 Bfa1-GFP-kanMX6 Spc42-eqFP-hphNT1 mCherry-Tub1-LEU2 pRS416 | This study |
| HKY115 | ESM356 Bfa1-GFP-kanMX6 Spc42-eqFP-hphNT1 bud14∆::klTRP1 mCherry-Tub1-LEU2 pRS416 | This study |
| HKY116 | ESM356 Bfa1-GFP-kanMX6 Spc42-eqFP-hphNT1 bud14∆::klTRP1 mCherry-Tub1-LEU2 pRS416-BUD14 | This study |
| HKY133 | FAY145 lte1∆::kanMX6 pRS316-LTE1 kel1∆::hphNT1 | This study |
| HKY134 | FAY145 lte1∆::kanMX6 pRS316-LTE1 kel2∆::hphNT1 | This study |
| HKY135 | FAY145 lte1∆::kanMX6 pRS316-LTE1 spo12∆::natNT2 kel1∆::hphNT1 | This study |
| HKY136 | FAY145 lte1∆::kanMX6 pRS316-LTE1 spo12∆::natNT2 kel2∆::hphNT1 | This study |
| HKY139 | ESM356 kar9∆::HIS3MX6 pRS316-KAR9 kel1∆::hphNT1 | This study |
| HKY140 | ESM356 kar9∆::HIS3MX6 pRS316-KAR9 kel2∆::hphNT1 | This study |
| HKY155 | ESM356 BUD14-TAP-kanMX6 | This study |
| HKY164 | ESM356 Bud14-TAP-kanMX6 Glc7-9myc-HIS3MX6 | This study |
| HKY171 | ESM356 Mob1-GFP-kanMX6 Spc42-eqFP-hphNT1 mCherry-Tub1-LEU2 | This study |
| HKY172 | ESM356 Mob1-GFP-kanMX6 Spc42-eqFP-hphNT1 mCherry-Tub1-LEU2 bud14∆::HIS3MX6 | This study |
| HKY173 | ESM356 Mob1-GFP-kanMX6 Spc42-eqFP-hphNT1 mCherry-Tub1-LEU2 kin4∆::natNT2 | This study |
| HKY174 | ESM356 Mob1-GFP-kanMX6 Spc42-eqFP-hphNT1 mCherry-Tub1-LEU2 bfa1∆::natNT2 | This study |
| HKY175 | YPH499 kar9∆::klTRP1 pRS316-KAR9 GFP-Tub1-ADE2 bud14∆::HIS3MX6 bfa1∆::natNT2 | This study |
| HKY177 | YPH499 bfa1∆::kITRP1 | This study |
| HKY180 | YPH499 mob1-67 pRS316-MOB1 bfa1Δ::klTRP3 | This study |
| HKY182 | YPH499 cdc15-1 pRS316-CDC15 bfa1Δ::klTRP3 | This study |
| HKY183 | YPH499 cdc5-10 pRS316-CDC5 bfa1Δ::klTRP3 | This study |
| HKY184 | ESM356 cdc15::CDC15-as1(L99G)-URA3 Bfa1-3HA- kITRP1 bud14∆::HIS3MX6 | This study |
| HKY185 | ESM356 pRS416 | This study |
| HKY186 | ESM356 pMK60 (Bud14-GFP) | This study |
| HKY187 | ESM356 pHK002 (Bud14-F379A-GFP) | This study |
| HKY188 | ESM356 pDK003 (Bud14-∆SH3-GFP) | This study |
| HKY189 | ESM356 pDK001 (Bud14-5A-GFP) | This study |
| HKY190 | ESM356 BFA1-GFP-kanMX6 Spc42-eqFP-hphNT1 bud14∆::klTRP1 mCherry-TUB1-Leu2 pMK131 | This study |
| IKY075 | SGY37-VIII,3 kin4∆::klTRP1 | This study |
| DKY133 | SGY37-VIII,3 bub2∆::hphT1 | This study |
| IKY192 | ESM356 kar9∆::HIS3MX6 bud14∆::klTRP1 pRS416-endogenous BUD14-promoter- GFP-BUD14-5A | This study |
| IKY193 | ESM356 kar9∆::HIS3MX6 bud14∆::klTRP1 pRS416-endogenous BUD14-promoter- GFP-BUD14-∆SH3 | This study |
| JOY79 | YPH499 cdc5-10 pRS316-CDC5 | Caydasi et al., 2017 |
| PAY701 | W303 MATa ade2-1 his3-11,15 leu2-3,112 ura3-1 can1-100 ssd1-d2 glc7::LEU2 trp1-1::glc7-12::TRP1 | Andrews and Stark, 2000 |
| PAY704 | W303 MATa ade2-1 his3-11,15 leu2-3,112 ura3-1 can1-100 ssd1-d2 glc7::LEU2 trp1-1::GLC7::TRP1 | Andrews and Stark, 2000 |
| SEY032 | YPH499 kar9Δ::klTRP3 pRS316-KAR9 GFP-Tub1-ADE2 bud14∆::HIS3MX6 | This study |
| SEY206 | ESM356 cdc15::CDC15-as1(L99G)-URA3 Bfa1-3HA- kITRP1 | This study |
| SEY212 | ESM356 cdc15::CDC15-as1(L99G)-URA3 Bfa1-3HA- kITRP1 Bud14-9myc-HIS3MX6 | This study |
| SEY218 | ESM356 cdc15::CDC15-as1(L99G)-URA3 Bfa1-3HA- kITRP1 bud14∆::HIS3MX6 leu2::LEU2- pGal1-Bud14-9myc-hphNT1 | This study |
| SEY219 | ESM356 cdc15::CDC15-as1(L99G)-URA3 Bfa1-3HA- kITRP1 bud14∆::HIS3MX6 leu2::LEU2- pGal1-Bud14- F379A-9myc-hphNT1 | This study |
| SGY37-VIII,3 | MATa leu2 his3 trp1 ADE2 ura3-52::URA3-lexA-op-LacZ | Geissler et al., 1996 |
| SHM562 | YPH499 GFP-Tub1-URA3 dyn1∆::klTRP1 | Maekawa et al., 2007 |
| YDA101 | ESM356 kar9∆::HIS3MX6 bud14∆::klTRP1 | Caydasi and Pereira, 2017 |
| YPH499 | MATa ura3-52 lys2-801 ade2-101 trp1∆63 his3∆200 leu2∆1 | Sikorski and Hieter, 1989 |
Table 2
Plasmids used in this study.
| Plasmid name | Description | Reference |
|---|---|---|
| pRS316 | URA3-dependent CEN-based yeast-E. coli shuffle plasmid AmpR | Sikorski and Hieter, 1989 |
| pRS416 | URA3-dependent CEN-based yeast-E. coli shuffle plasmid AmpR | Geissler et al., 1996 |
| pAFS125 | GFP-TUB1-URA3-containing integration plasmid | Straight et al., 1997 |
| pSM1027 | GFP-TUB1-ADE2-containing integration plasmid | Caydasi et al., 2010b |
| pAK010 | mCherry-TUB1-kıTRP1-containing integration plasmid | Khmelinskii et al., 2007 |
| pAK011 | mCherry-TUB1-URA3-containing integration plasmid | Khmelinskii et al., 2007 |
| pBK067 | mCherry-TUB1-LEU2-containing integration plasmid | Caydasi et al., 2014 |
| pWS103-1 | pRS304-Gal1-UPL-TEM1 | Shou et al., 1999 |
| pMM5 | p423-Gal1-lexA-Myc | Geissler et al., 1996 |
| pMM6 | p425-Gal1-Gal4-HA. | Geissler et al., 1996 |
| pCDV471 | pEG202 ADH1-LexA-DBD-GLC7 | Lenssen et al., 2005 |
| pEG202 | 2 μm ADH1-LexA-DBD-HIS3 | Pereira et al., 1999 |
| pCL2-1 | pMM6-BUB2 | Höfken and Schiebel, 2004 |
| pCL4a-3 | pMM6-BFA1 | Höfken and Schiebel, 2004 |
| pHA132-2 | pMM6-KIN4 (1–750 aa) | Gift from G. Pereira |
| pHA69-1 | pMM5-BUD14 | Gift from G. Pereira |
| pHA70-1 | pMM6-BUD14 | Gift from G. Pereira |
| pTH221 | pMM6-KEL | Höfken and Schiebel, 2004 |
| IKY006 | pMM5-BUD14-5A | This Study |
| IKY007 | pMM5-BUD14-F379A | This Study |
| IKY008 | pMM5-BUD14-∆SH3 | This Study |
| IKY010 | pMM6-BUD14-5A | This Study |
| IKY011 | pMM6-BUD14-F379A | This Study |
| IKY012 | pMM6-BUD14-∆SH3 | This Study |
| pMK125 | pRS416 ADH-BUD14 | Knaus et al., 2005 |
| pMK131 | pRS416 ADH-BUD14-F379A | Knaus et al., 2005 |
| pMK60 | pRS416-endogenous BUD14-promoter-GFP-BUD14 | Knaus et al., 2005 |
| pDKY001 | pRS416-endogenous BUD14-promoter-GFP-BUD145A (135A 137A 138A 139A 140A) | This Study |
| pDKY003 | pRS416-endogenous BUD14-promoter-GFP-BUD14∆SH3(∆aa 262–318) | This Study |
| pHK002 | pRS416-endogenous BUD14-promoter-GFP-Bud14-F379A | This study |
| pGW399-1 | pRS316-KAR9 | Caydasi et al., 2010b |
| pSM805 | pRS305-pGal1 | König et al., 2010 |
| pHK003 | pSM805 pGal1-Bud14-Leu2 | This study |
| pHK004 | pSM805 pGal1-Bud14-F379A-Leu2 | This study |
| pIK007 | pMM5-Bud14-F379A | This study |
| pSM903-4 | pRS316-LTE1 | Höfken and Schiebel, 2002 |
| pSM908 | pRS316-DBF2 | Caydasi et al., 2017 |
| pSM926 | pRS316-MOB1 | Caydasi et al., 2017 |
| pUG120 | pRS316-CDC14 | Gruneberg et al., 2000 |
| pBS9 | pRS316-CDC15 | Caydasi et al., 2017 |
| pCL33 | pRS316-CDC5 | Höfken and Schiebel, 2004 |
Additional files
Download links
A two-part list of links to download the article, or parts of the article, in various formats.
Downloads (link to download the article as PDF)
Open citations (links to open the citations from this article in various online reference manager services)
Cite this article (links to download the citations from this article in formats compatible with various reference manager tools)
Protein phosphatase 1 in association with Bud14 inhibits mitotic exit in Saccharomyces cerevisiae
eLife 10:e72833.
https://doi.org/10.7554/eLife.72833


