Architecture and evolution of the cis-regulatory system of the echinoderm kirrelL gene
- Department of Biological Sciences, Carnegie Mellon University, United States
Figures
Figure 1

Characterization of the transcriptional regulatory landscape surrounding the S. purpuratus kirrelL (Sp-kirrelL) locus.
(A) Diagram of the Sp-kirrelL locus showing neighboring genes, regions of chromatin differentially accessible in primary mesenchyme cells (PMCs) at the mesenchyme blastula stage (ATAC-seq DE peaks and DNase-seq DE peaks) (Shashikant et al., 2018b), Sp-Alx1-binding sites at the mesenchyme blastula stage (Sp-Alx1 ChIP-seq peaks) (Khor et al., 2019), and enhancer RNA (eRNA) peaks (union of all peaks from the nine developmental stages examined by Khor et al., 2021). (B) Signal obtained from each assay in the vicinity of the Sp-kirrelL locus. The bottom part of the panel shows the expression of eRNAs at the nine developmental stages analyzed by Khor et al., 2021. (C) Phylogenetic footprinting of genomic sequences near S. purpuratus and L. variegatus kirrelL (±10 kb of an exon) using GenePalette. Black lines indicate identical sequences of 15 bp or longer in the same orientation while red lines indicate identical sequences of 15 bp or longer in the opposite orientation. Nine putative cis-regulatory elements (CREs; labeled elements A–I) were identified based on sequence conservation and chromatin signatures.
Figure 2
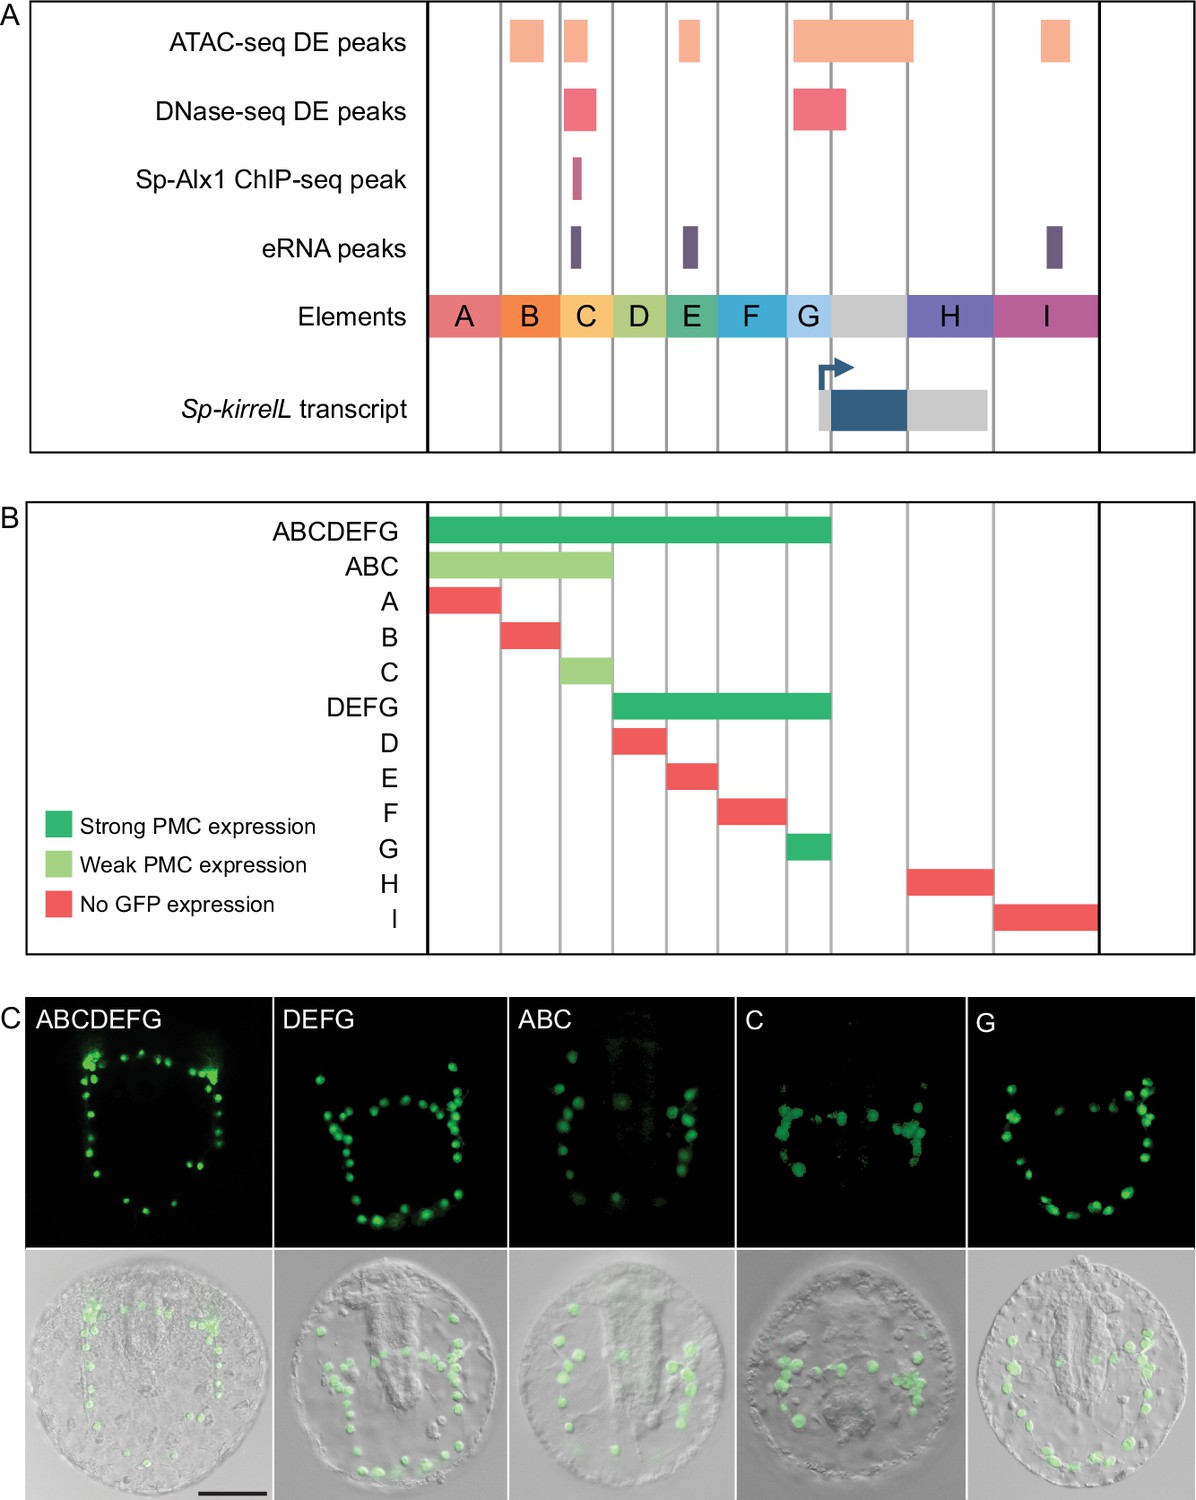
Functional analysis of noncoding genomic sequences flanking Sp-kirrelL to identify cis-regulatory elements (CREs).
(A) Nine putative CREs (labeled elements A–I) were identified based on sequence conservation and previously published datasets (Khor et al., 2021; Khor et al., 2019; Shashikant et al., 2018b). (B) Summary of GFP expression regulated by putative CREs, as assessed by transgenic reporter assays. To be indicated as ‘strong primary mesenchyme cell (PMC) expression’, two criteria were satisfied: (1) more than 1/3 of all GFP-expressing embryos showed expression that was completely restricted to PMCs, and (2) the number of embryos in this class represented >15% of all injected embryos. ‘Weak PMC expression’ was defined similarly except that the number of embryos with expression completely restricted to PMCs represented <15% of all injected embryos. Complete scoring data for all constructs are contained in Figure 2—source data 1. (C) Spatial expression patterns of GFP reporter constructs containing different Sp-kirrelL elements at 48 hr postfertilization (hpf). Top row: GFP fluorescence. Bottom row: GFP fluorescence overlayed onto differential interference contrast (DIC) images. Scale bar: 50 μm.
-
Figure 2—source data 1
Quantification of GFP expression patterns in embryos injected with reporter constructs.
- https://cdn.elifesciences.org/articles/72834/elife-72834-fig2-data1-v2.xlsx
Figure 3 with 2 supplements

Molecular dissection of element C and the identification of direct transcriptional inputs.
(A) Summary of transgenic GFP expression regulated by element C truncations using reporter constructs. Serial truncation of element C was performed based on boundaries of peaks defined by chromatin accessibility, Sp-Alx1-binding, and enhancer RNA (eRNA) expression. (B) Summary of GFP expression driven by C.ChIP element mutants. Criteria for strong and weak primary mesenchyme cell (PMC) expression are defined in Figure 2. (C) Stacked bar plot showing a summary of GFP expression patterns of injected embryos scored at 48 hpf. Each spatial expression category is expressed as a percentage of total injected embryos.
Figure 3—figure supplement 1
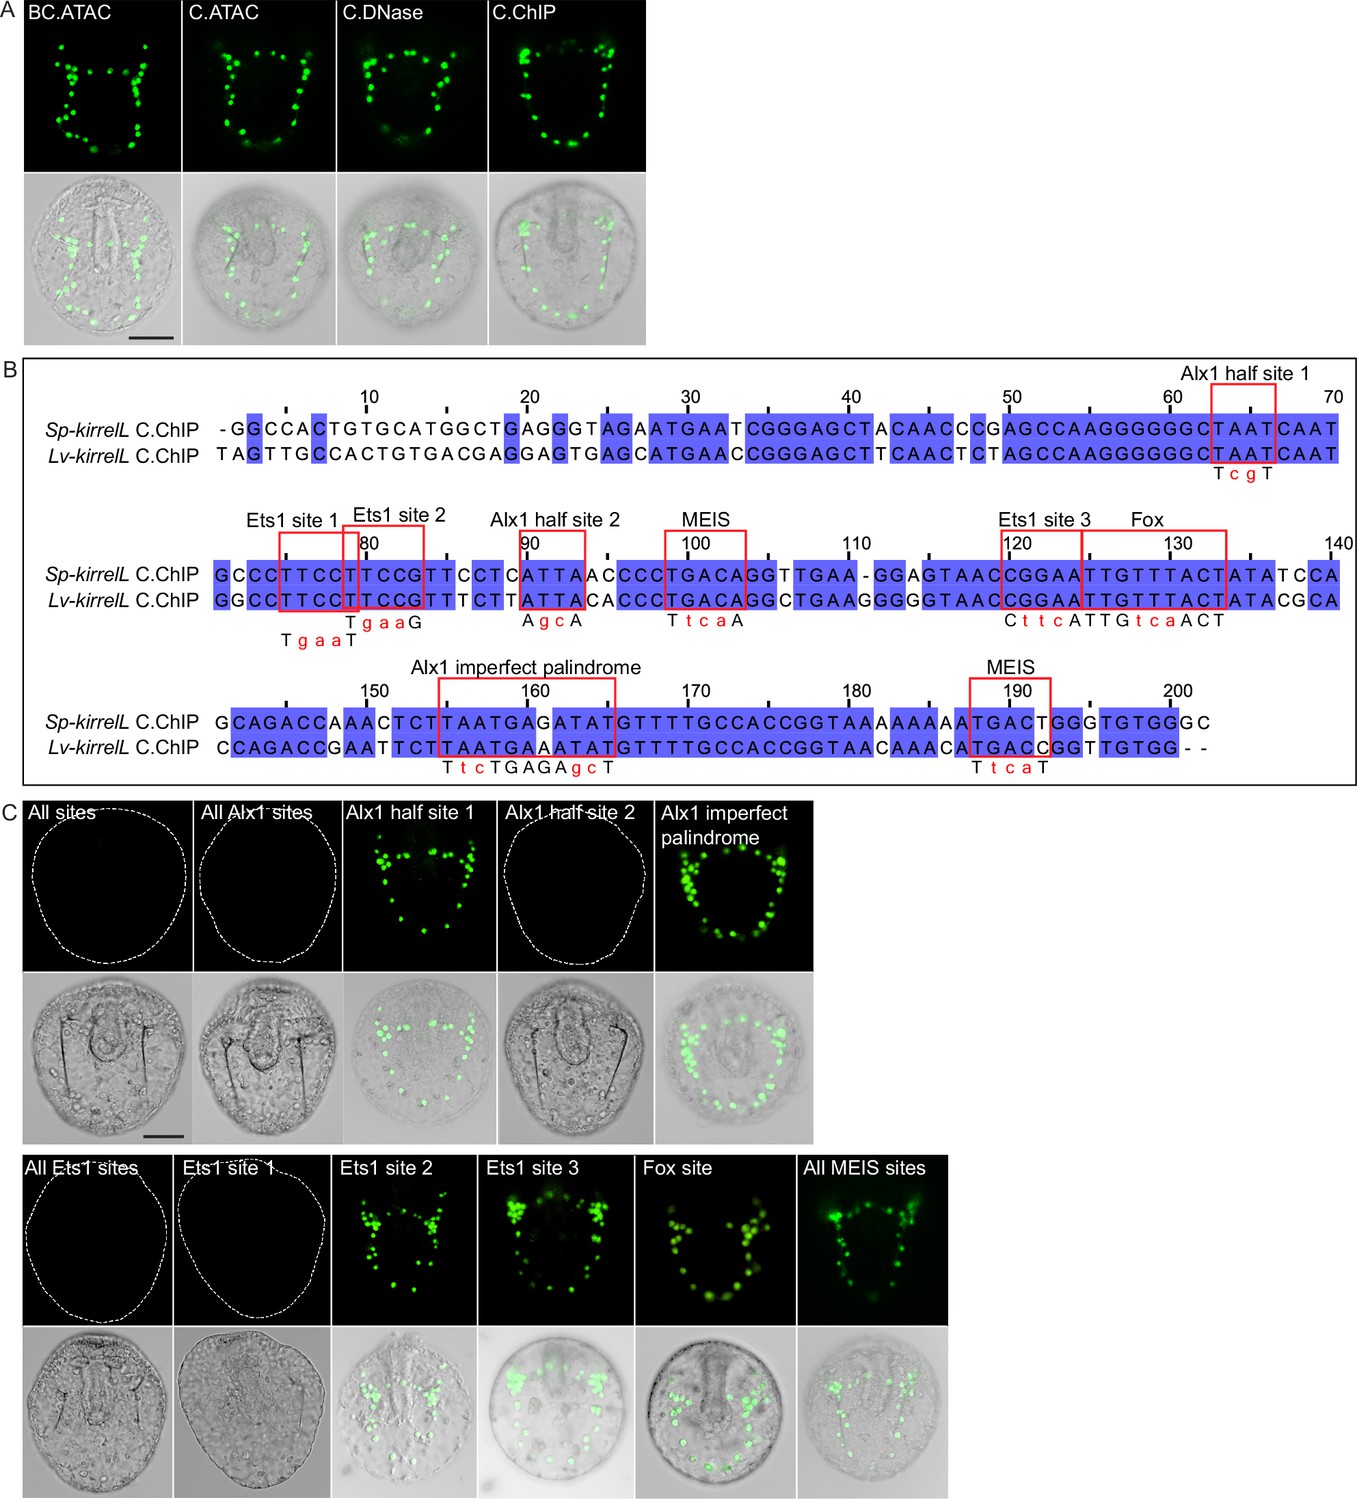
Element C truncation and mutational analysis.
(A) Spatial expression patterns of GFP reporter constructs containing different element C truncations in embryos at 48 hpf. (B) Clustal alignment of Sp-kirrelL and Lv-kirrelL C.ChIP sequences. Violet shading indicates conserved sequences. Red boxes highlight putative transcription factor-binding sites. Mutations generated in binding sites are indicated in red letters below the aligned sequences. (C) Spatial expression patterns of GFP reporter constructs containing different C.ChIP element mutants at 48 hpf. Dotted lines show outlines of embryos that did not show GFP expression. Top rows: GFP fluorescence. Bottom rows: GFP fluorescence overlayed onto differential interference contrast (DIC) images. Scale bar: 50 μm.
Figure 3—figure supplement 2
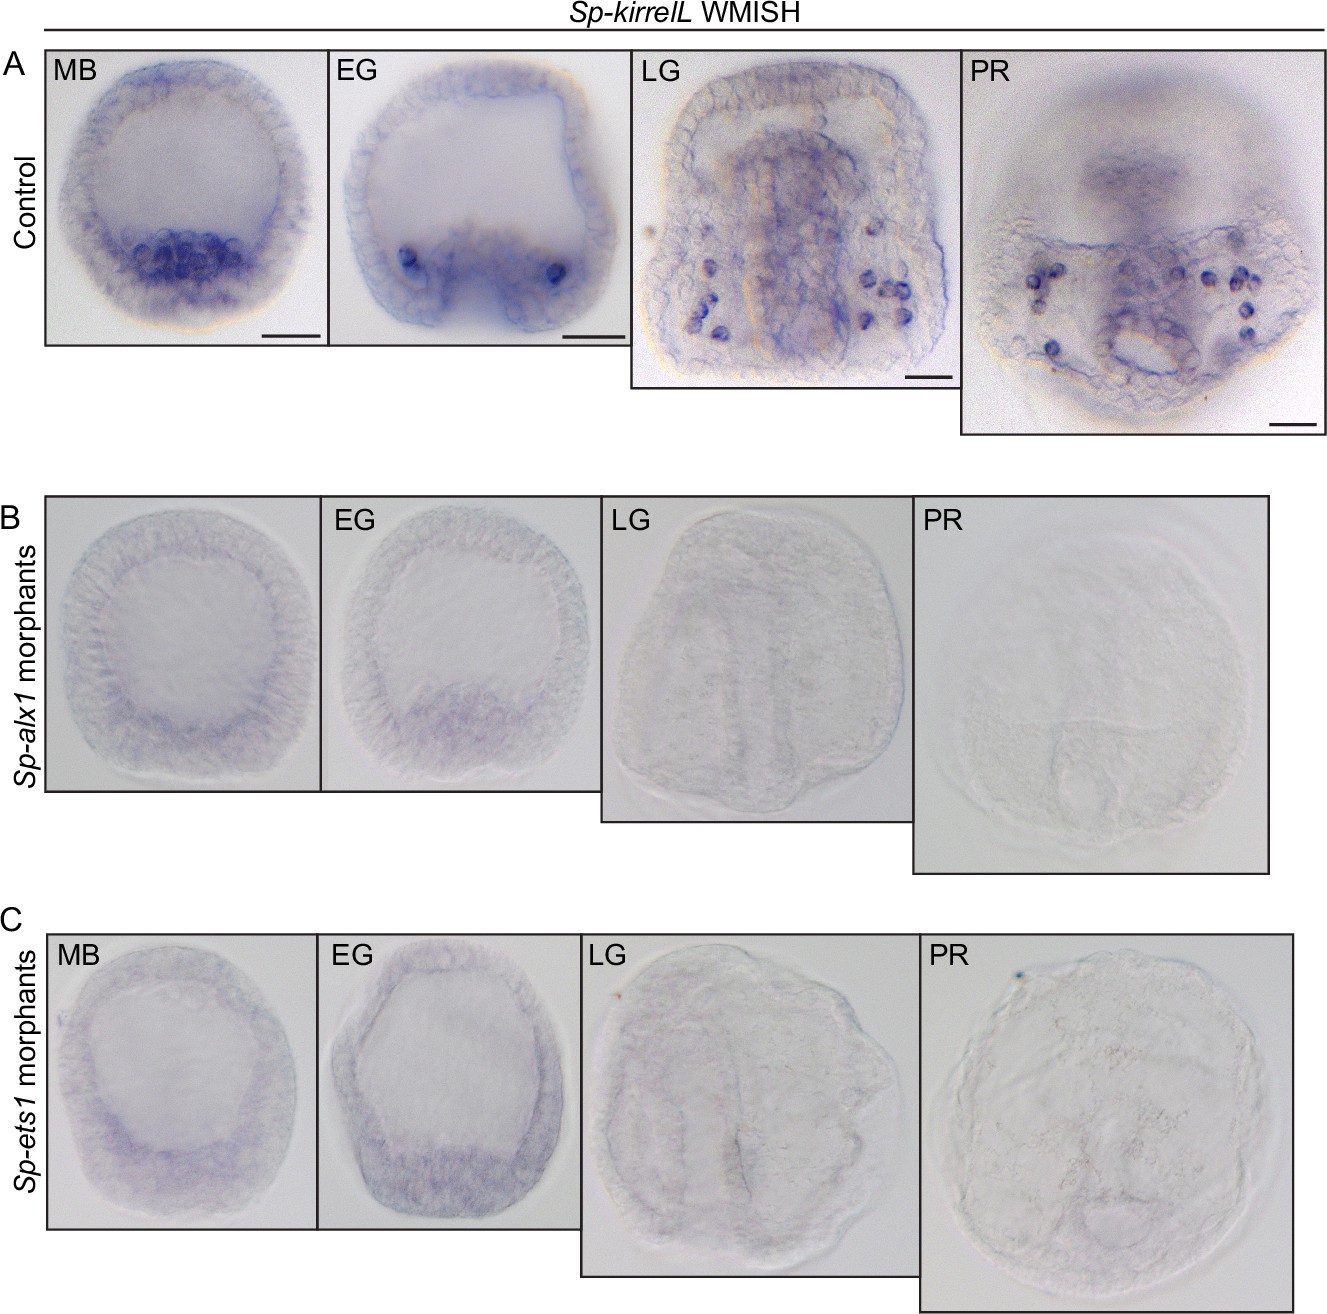
Effects of Sp-alx1 and Sp-ets1 knockdown on Sp-kirrelL expression.
(A) Representative whole-mount in situ hybridization (WMISH) images showing Sp-kirrelL expression in the primary mesenchyme cells (PMCs) of uninjected control embryos. (B) Representative WMISH images showing lack of Sp-kirrelL expression in Sp-alx1 morphants. (C) Representative WMISH images showing lack of Sp-kirrelL expression in Sp-ets1 morphants. Scale bar: 20 μm. MB, mesenchyme blastula; EG, early gastrula; LG, late gastrula; PR, prism stage.
Figure 4 with 4 supplements
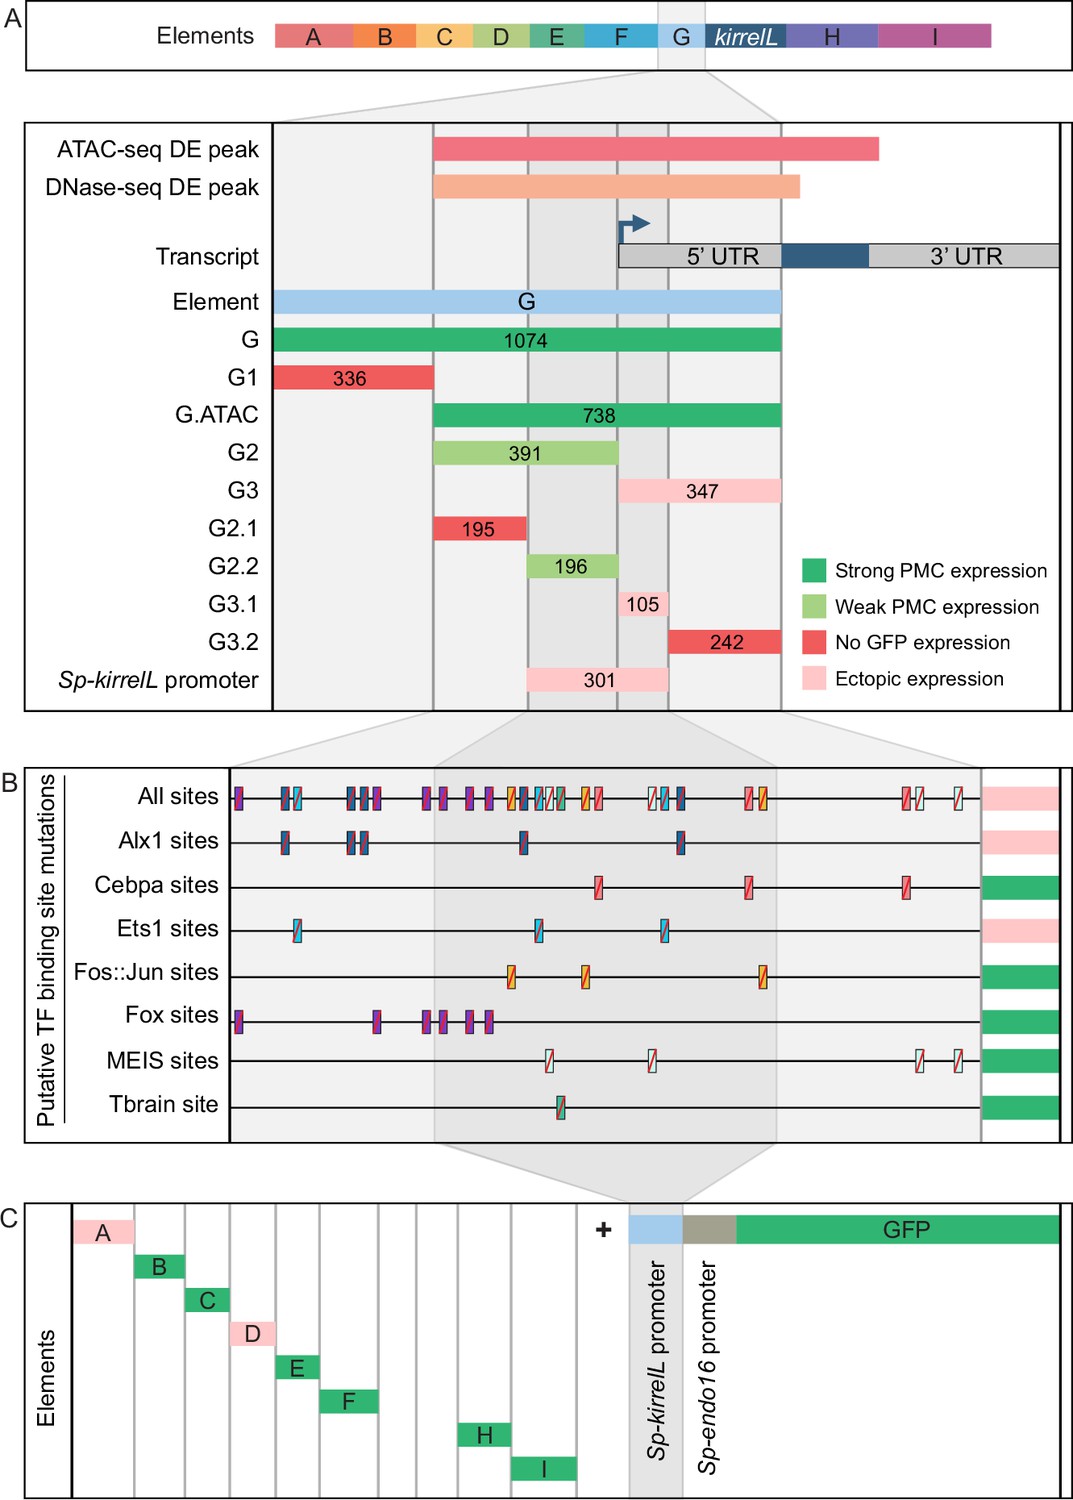
Molecular dissection and mutation of element G.
(A) Summary of GFP expression regulated by element G truncations using EpGFPII reporter constructs. Serial truncation of element G was performed based on boundaries defined by chromatin accessibility and the kirrelL 5′-UTR. Criteria for strong and weak primary mesenchyme cell (PMC) expression are defined in Figure 2. Ectopic expression is defined as majority of injected embryos exhibiting GFP expression in cells other than PMCs. (B) Summary of GFP expression driven by G.ATAC element mutants using EpGFPII reporter constructs. (C) Analysis of element enhancer activity in modified EpGFPII reporter constructs containing the endogenous Sp-kirrelL promoter elements.
Figure 4—figure supplement 1
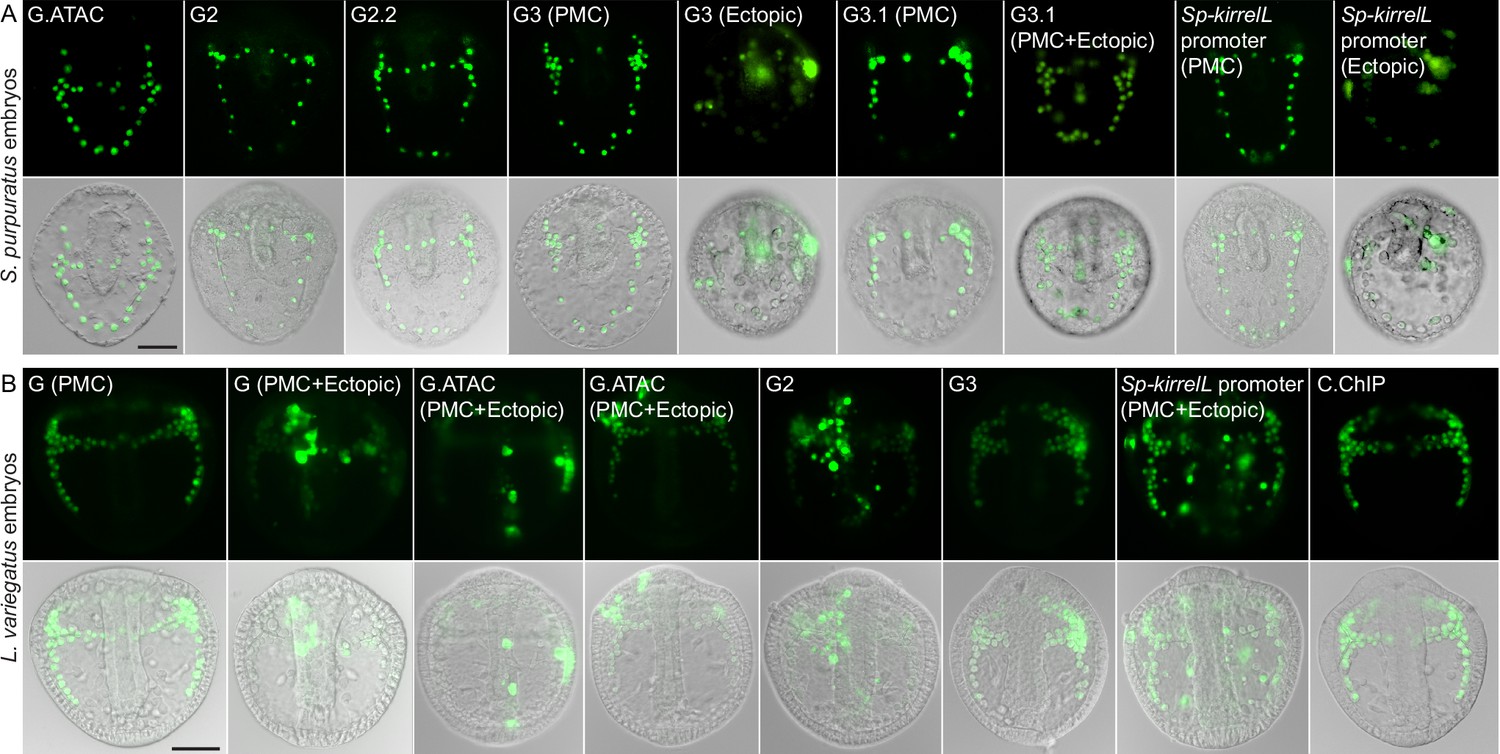
Element G truncation and mutational analysis.
(A) Spatial expression patterns of GFP reporter constructs containing element G truncations in S. purpuratus embryos at 48 hpf. (B) Spatial expression patterns of GFP reporter constructs containing element G truncations in L. variegatus embryos at 28 hpf. Representative images of primary mesenchyme cell (PMC)-specific and ectopic GFP expression are shown for some constructs. Top rows: GFP fluorescence. Bottom rows: GFP fluorescence overlayed onto differential interference contrast (DIC) images. Scale bar: 50 μm.
Figure 4—figure supplement 2
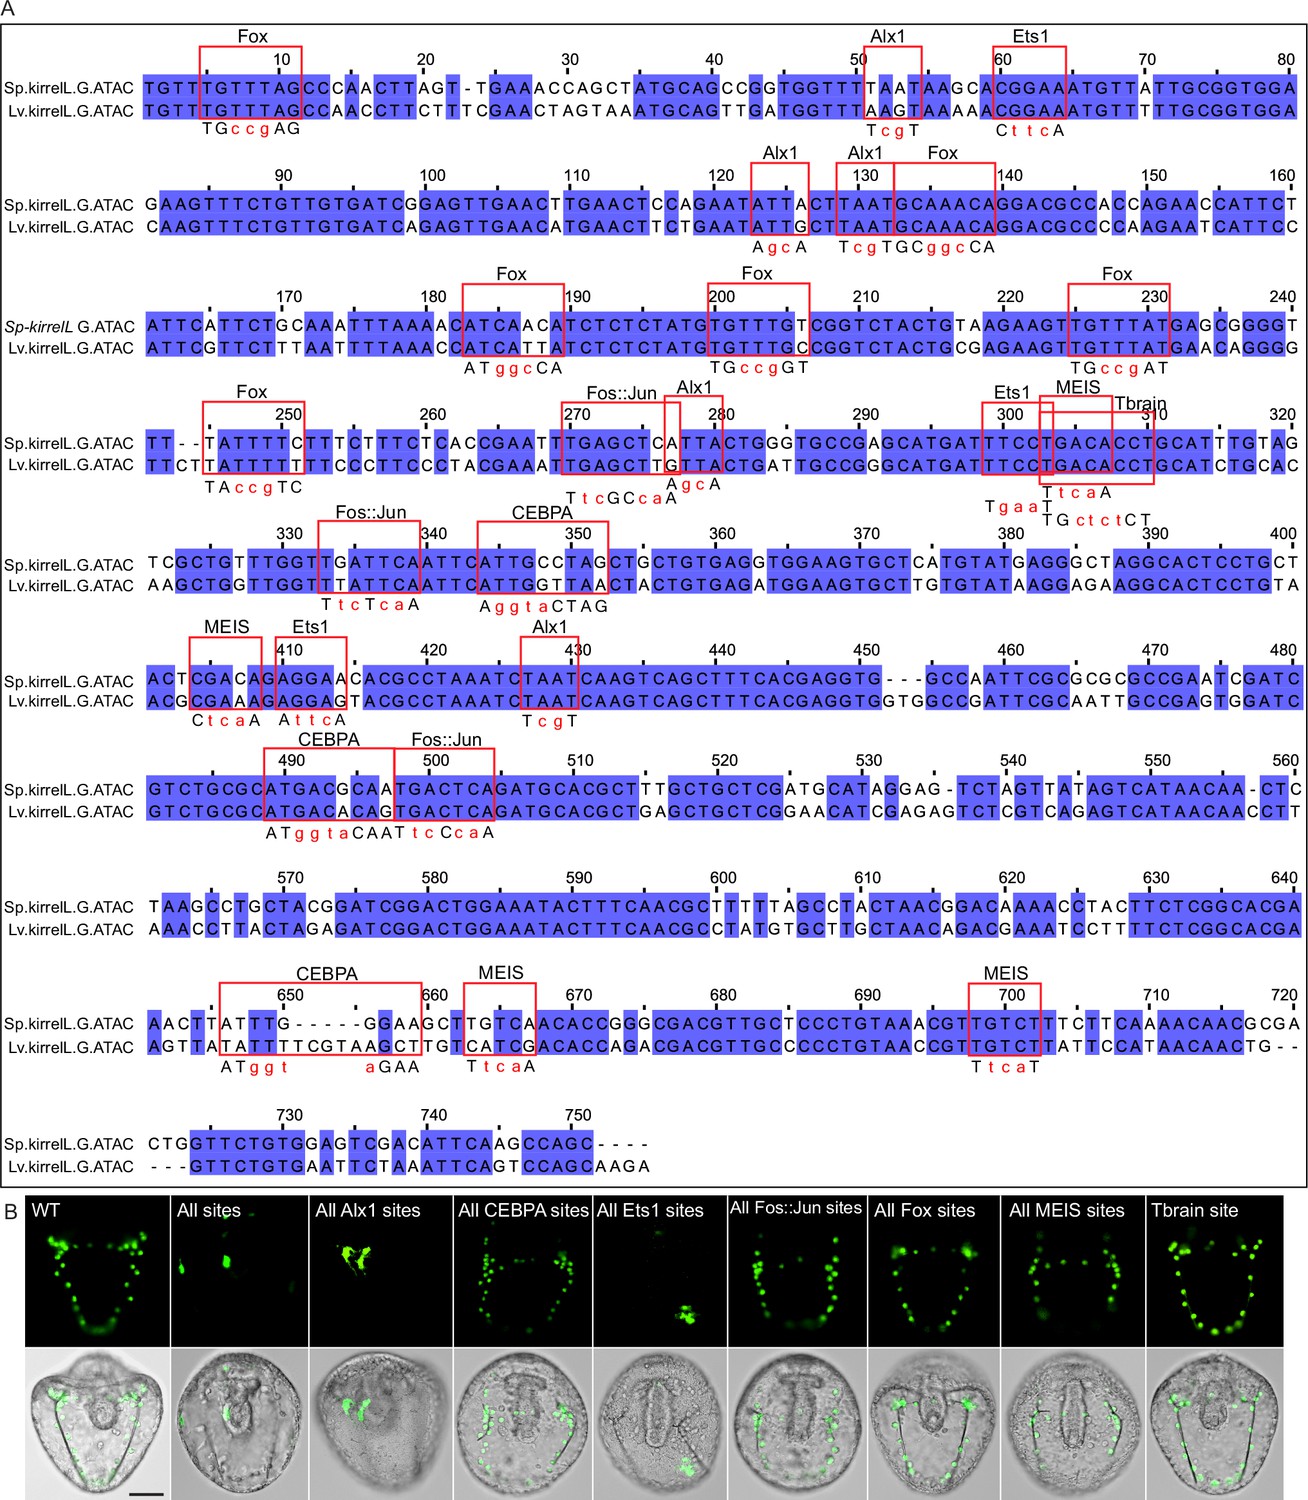
Mutational analysis of G.ATAC element.
(A) Clustal alignment of Sp-kirrelL and Lv-kirrelL G.ATAC sequences. Violet shading indicates conserved sequences. Red boxes highlight putative transcription factor-binding sites. Mutations generated in binding sites are indicated in red letters below the aligned sequences. (B) Spatial expression pattern of GFP reporter constructs containing different G.ATAC element mutants. Top row: GFP fluorescence. Bottom row: GFP fluorescence overlayed onto differential interference contrast (DIC) images. Scale bar: 50 μm.
Figure 4—figure supplement 3
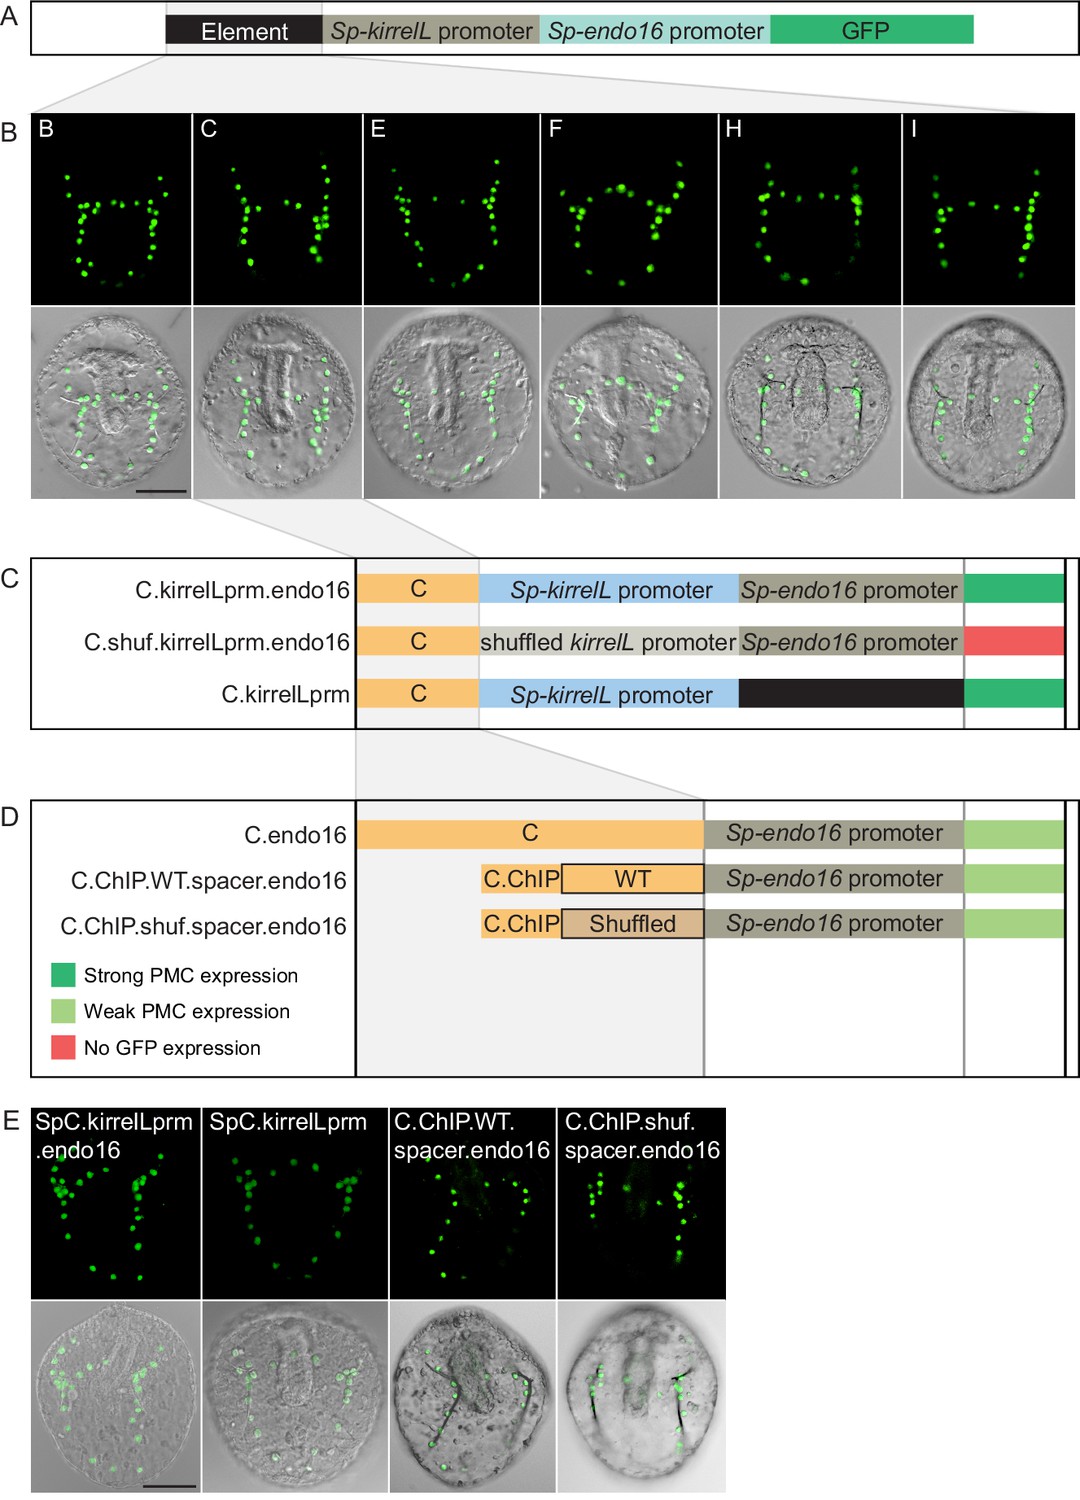
Interactions between Sp-kirrelL cis-regulatory elements (CREs) and the endogenous Sp-kirrelL promoter.
(A) Diagram showing the backbone of a modified, EpGFPII reporter construct containing the endogenous Sp-kirrelL promoter upstream of the Sp-endo16 promoter. (B) Spatial expression patterns of the modified GFP reporter constructs containing the various Sp-kirrelL elements indicated (elements B, C, E, F, H, and I). (C) Analysis of C element enhancer activity in modified EpGFPII reporter constructs. (D) Analysis of C.ChIP element enhancer activity in constructs containing wild-type (WT) or shuffled C element spacer sequences. Criteria for strong and weak primary mesenchyme cell (PMC) expression are defined in Figure 2. (E) Spatial expression patterns of the GFP reporter constructs. Top rows: GFP fluorescence. Bottom rows: GFP fluorescence overlayed onto differential interference contrast (DIC) images. Scale bar: 50 μm.
Figure 4—figure supplement 4
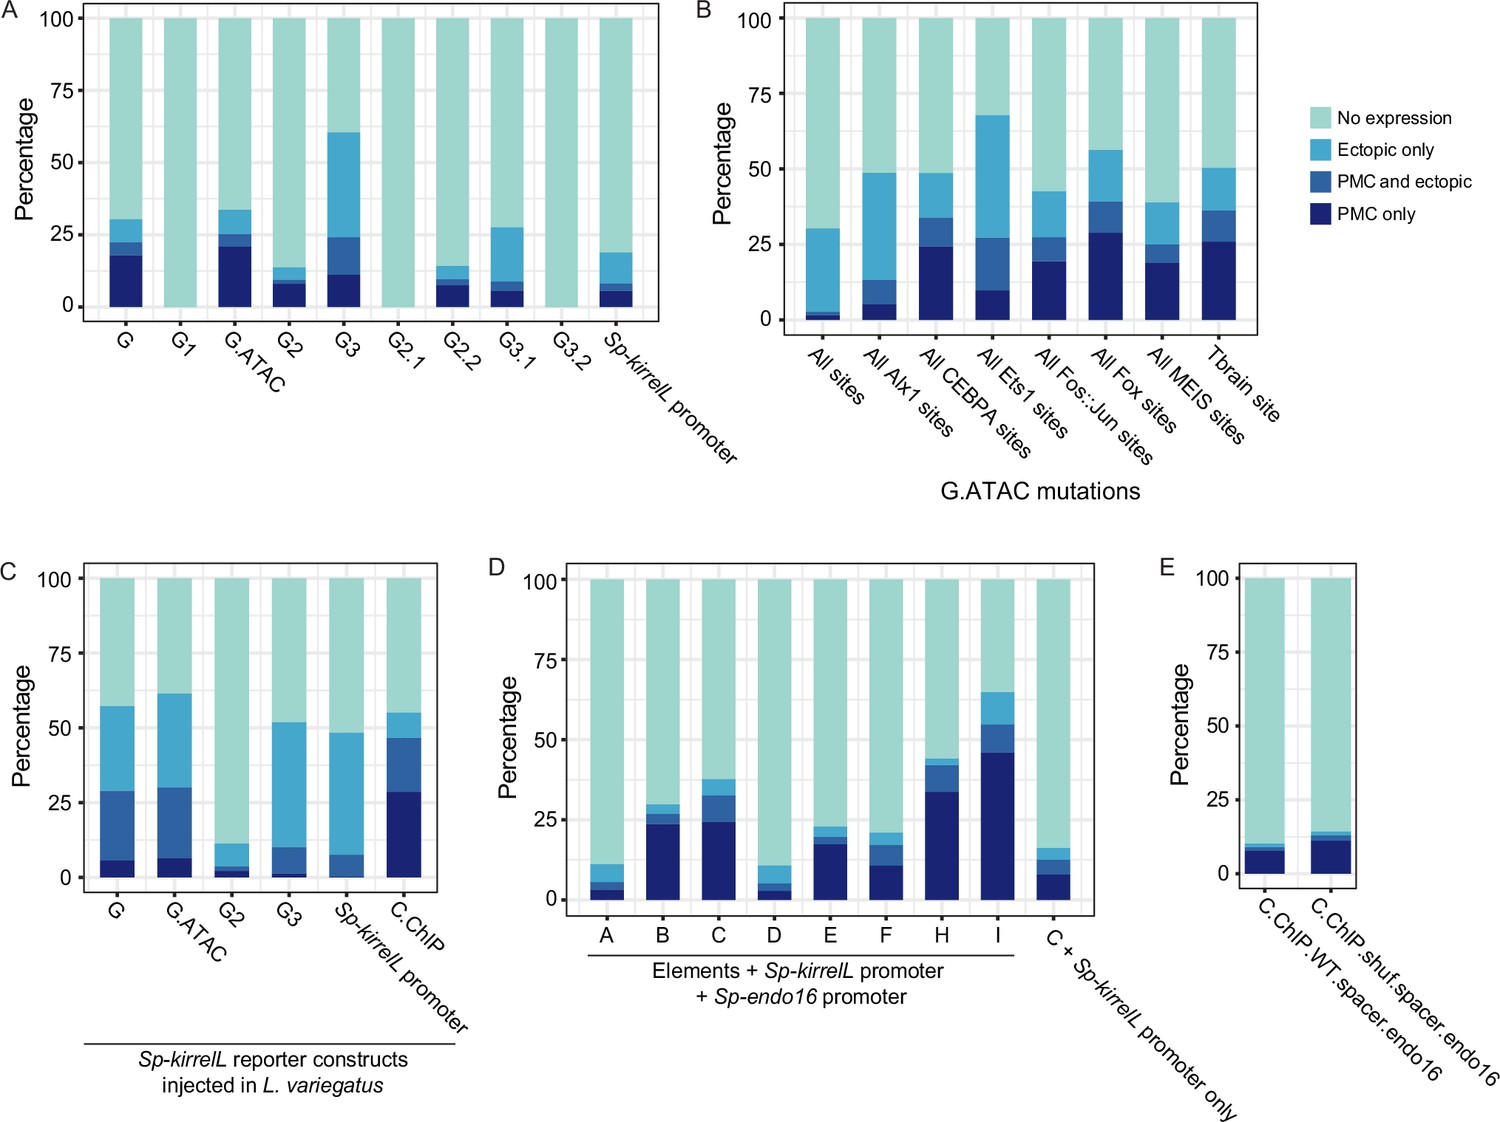
Stacked bar plots showing summary of GFP expression patterns of injected embryos scored at 48 hpf.
Each spatial expression category is expressed as a percentage of total injected embryos. (A) GFP spatial expression patterns of transgenic embryos injected with element G and truncation of element G mutant reporter constructs. (B) GFP spatial expression patterns of embryos injected with reporter constructs containing G.ATAC and G.ATAC with different transcription factor-binding site mutations. (C) GFP spatial expression patterns of transgenic L. variegatus embryos injected with Sp-kirrelL reporter constructs at 24 hpf. (D) GFP spatial expression patterns of embryos injected with constructs comprising of elements A–G in a modified EpGFPII vector containing the endogenous Sp-kirrelL promoter. (E) GFP spatial expression patterns of embryos injected with reporter constructs containing C.ChIP and wild-type (WT) or shuffled spacer sequences.
Figure 5 with 2 supplements
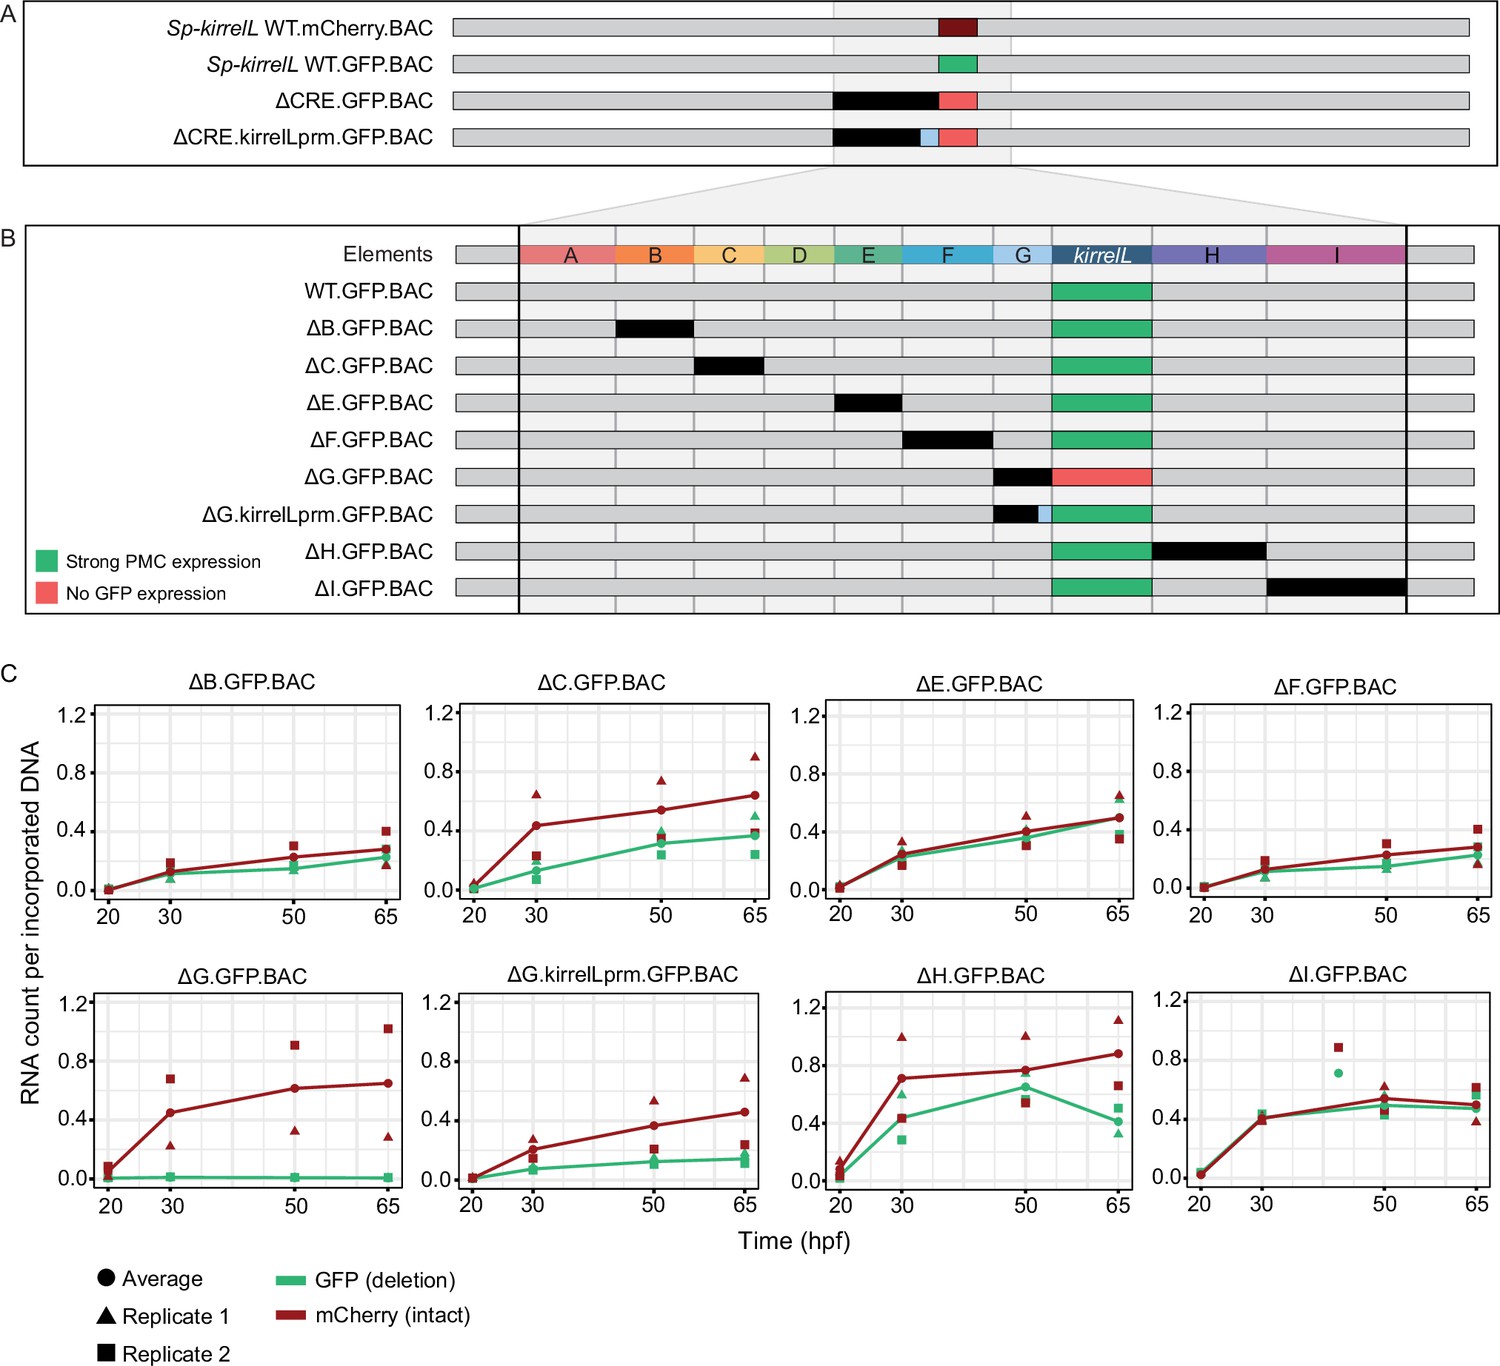
Sp-kirrelL cis-regulatory analysis using BACs.
(A) BAC deletions show that elements A–G are necessary for GFP expression, regardless of the presence of the endogenous Sp-kirrelL core promoter elements. (B) Summary of GFP expression patterns of individual Sp-kirrelL elements using GFP BAC deletions. Criteria for strong primary mesenchyme cell (PMC) expression are defined in Figure 2. (C) Quantitative NanoString analysis of reporter expression in embryos coinjected with parental mCherry and mutant GFP BACs. Embryos were collected at 20, 30, 50, and 65 hpf. The average expression profile for each pair of BAC injection was calculated from NanoString counts of two biological replicates (see Materials and methods).
-
Figure 5—source data 1
Summary of NanoString analysis.
- https://cdn.elifesciences.org/articles/72834/elife-72834-fig5-data1-v2.xlsx
-
Figure 5—source data 2
Raw NanoString data for BAC-injected embryos.
- https://cdn.elifesciences.org/articles/72834/elife-72834-fig5-data2-v2.xlsx
-
Figure 5—source data 3
NanoString analysis probe target sequences.
- https://cdn.elifesciences.org/articles/72834/elife-72834-fig5-data3-v2.xlsx
Figure 5—figure supplement 1
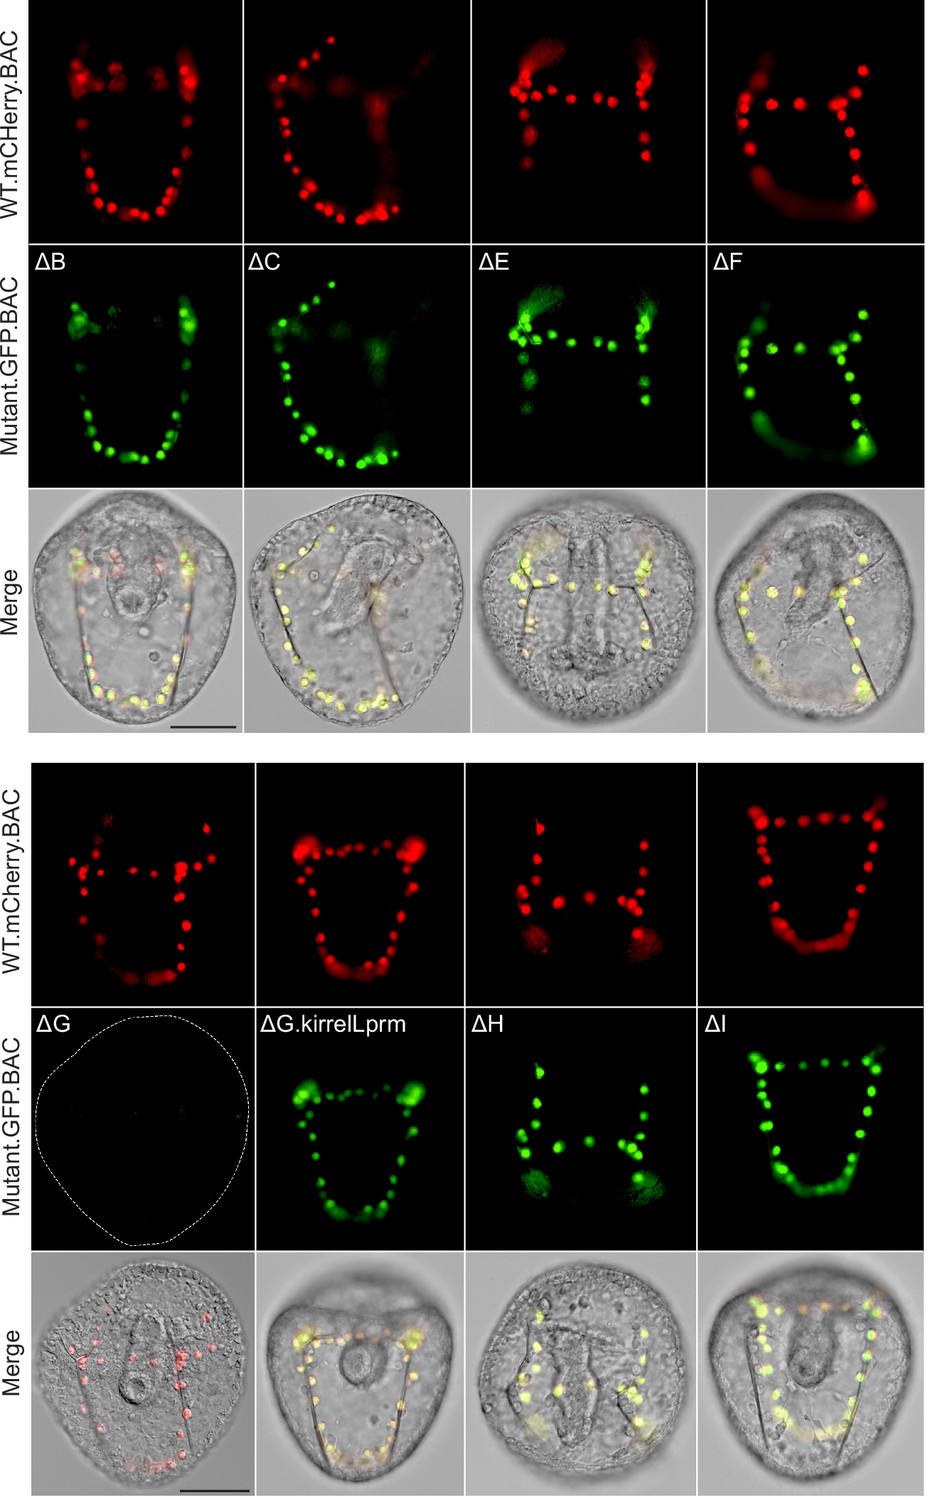
Spatial expression patterns of embryos coinjected with parental mCherry and mutant GFP BACs.
Top rows: mCherry fluorescence. Middle rows: GFP fluorescence. Dotted lines show outlines of embryos that did not show GFP expression. Bottom rows: mCherry and GFP fluorescence overlayed onto differential interference contrast (DIC) images. Scale bar: 50 μm.
Figure 5—figure supplement 2
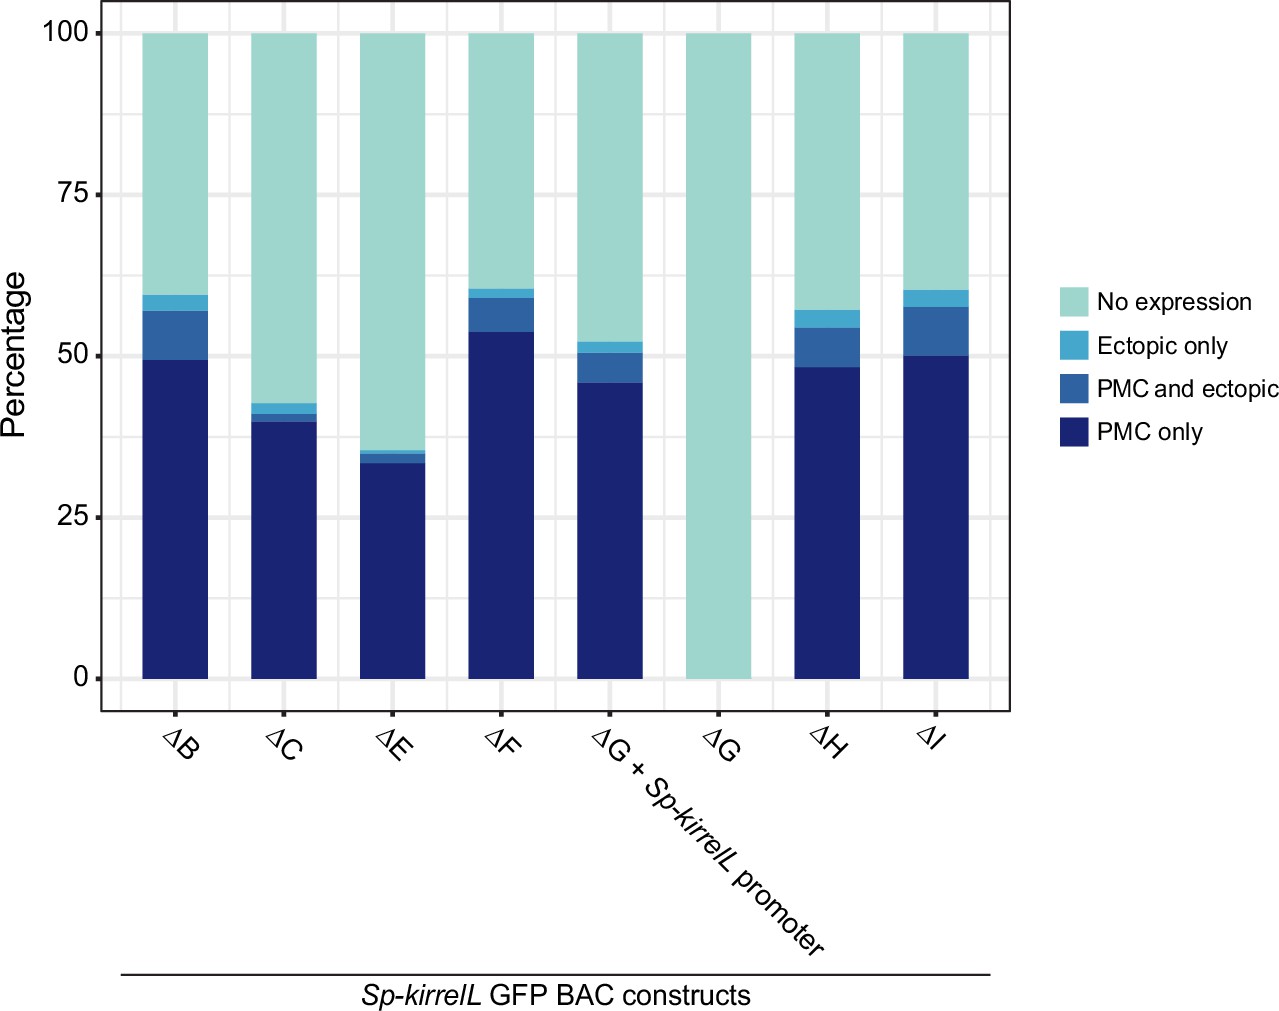
Stacked bar plots showing summary of GFP expression patterns of transgenic embryos injected with Sp-kirrelL GFP BACs containing different element deletions.
Each spatial expression category is expressed as a percentage of total injected embryos.
Figure 6 with 3 supplements

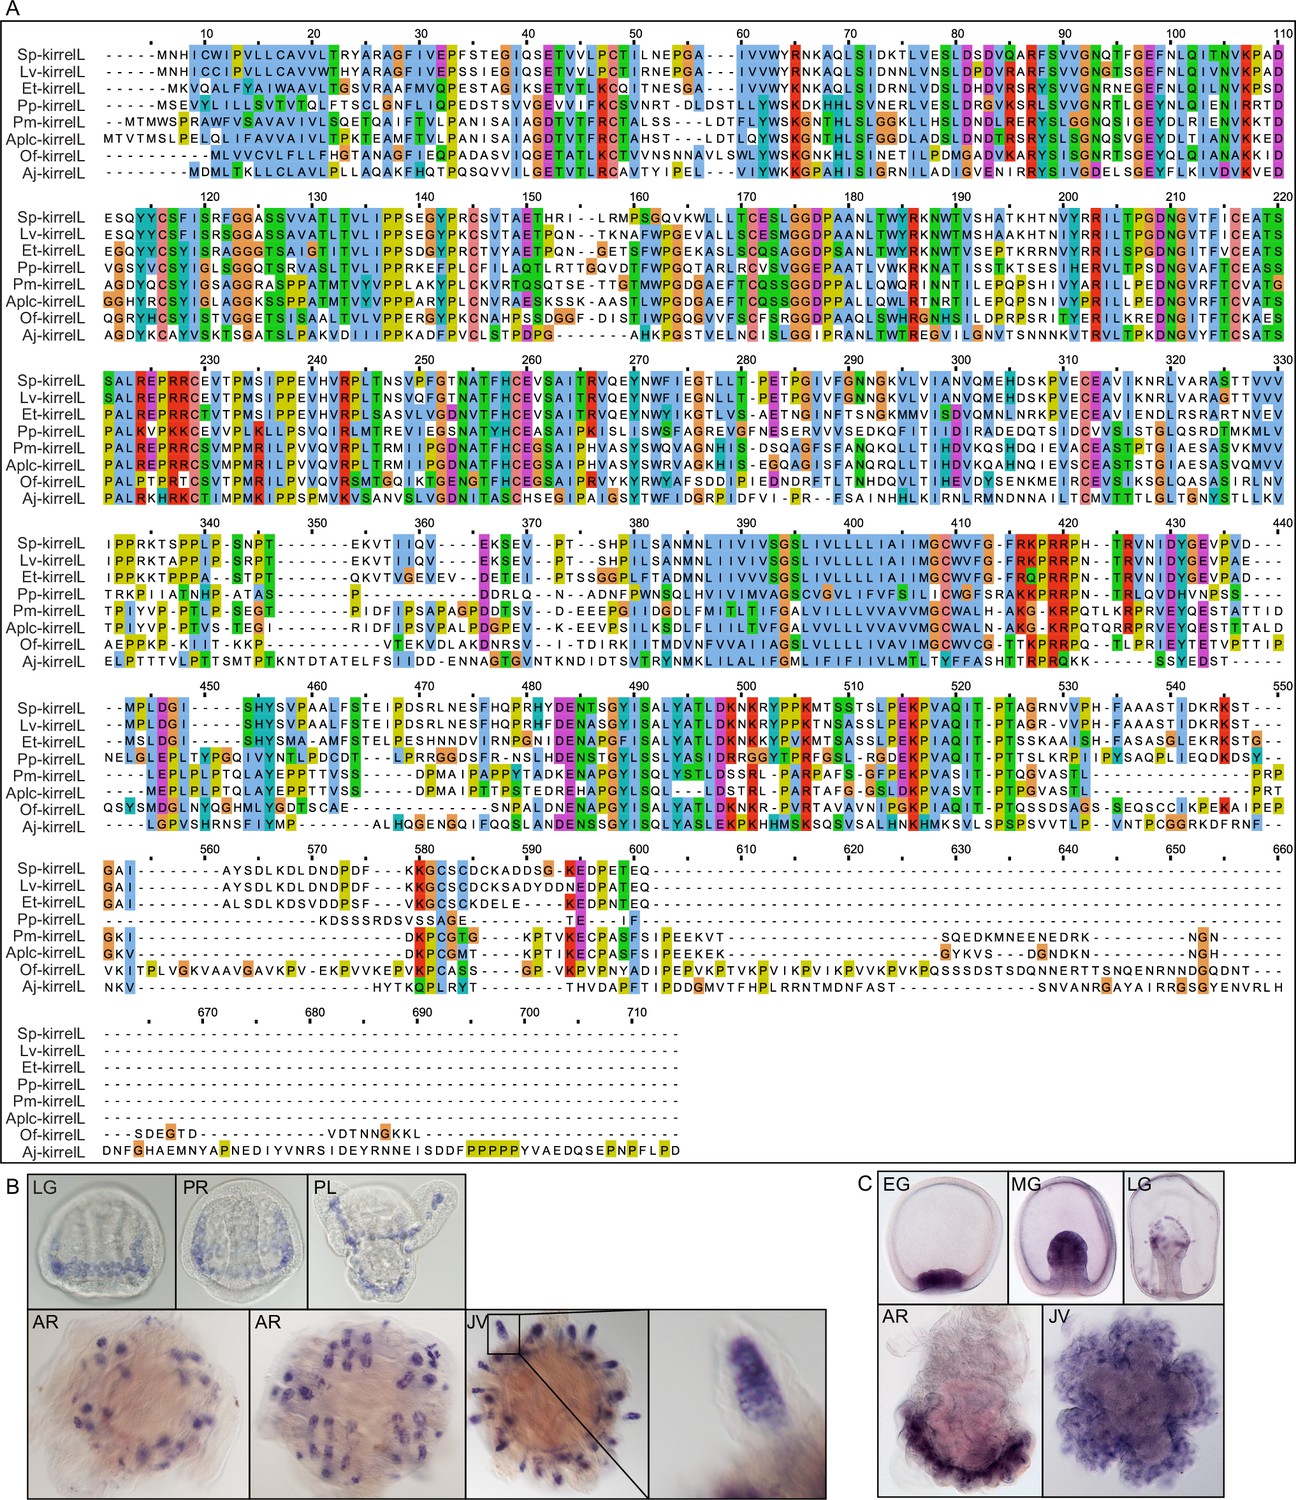
Cross-species analysis of kirrelL cis-regulatory elements (CREs) from diverse members of the echinoderm phylum.
(A) Phylogenetic relationships of kirrelL genes based on the consensus view of evolutionary relationships among echinoderms. Branch lengths are not drawn to scale. Box colors correspond to expression of GFP in S. purpuratus embryos, driven by noncoding sequences upstream of kirrelL genes of Eucidaris tribuloides (Et-kirrelL), Parastichopus parvimensis (Pp-kirrelL), Patiria miniata (Pm-kirrelL), Acanthaster planci (Aplc-kirrelL), Ophionereis fasciata (Of-kirrelL), and Anneissia japonica (Aj-kirrelL). Criteria for strong and weak primary mesenchyme cell (PMC) expression are defined in Figure 2. (B) Spatial expression patterns of GFP reporter constructs containing kirrelL CREs from other echinoderm species in S. purpuratus embryos at 48 hpf. Top row: GFP fluorescence. Bottom row: GFP fluorescence overlayed onto differential interference contrast (DIC) images. Scale bar: 50 μm. (C) Representative whole-mount in situ hybridization (WMISH) images showing Lv-kirrelL expression during L. variegatus development. (D) Pm-kirrelL expression during P. miniata development. EG, early gastrula; MG, midgastrula; LG, late gastrula; PR, prism stage; PL, pluteus larva; AR, adult rudiment; JV, juvenile stage. All genomic coordinates and DNA sequences for the CREs are shown in Figure 6—source data 2.
-
Figure 6—source data 1
Sequence coordinates for echinoderm kirrelL cis-regulatory elements (CREs) tested (Arshinoff et al., 2022; Long et al., 2016).
- https://cdn.elifesciences.org/articles/72834/elife-72834-fig6-data1-v2.xlsx
-
Figure 6—source data 2
DNA sequences for cis-regulatory elements (CREs) validated in this study from Eucidaris tribuloides (Et-kirrelL), Parastichopus parvimensis (Pp-kirrelL), Patiria miniata (Pm-kirrelL), Acanthaster planci (Aplc-kirrelL), Ophionereis fasciata (Of-kirrelL), and Anneissia japonica (Aj-kirrelL).
- https://cdn.elifesciences.org/articles/72834/elife-72834-fig6-data2-v2.docx
-
Figure 6—source data 3
Echinoderm primary mesenchyme cell (PMC)-specific Ig-domain protein sequences from Strongylocentrotus purpuratus (Sp), Lytechinus variegatus (Lv), Eucidaris tribuloides (Et), Parastichopus parvimensis (Pp), Patiria miniata (Pm), Acanthaster planci (Aplc), Ophionereis fasciata (Of), and Anneissia japonica (Aj) used for tree construction.
- https://cdn.elifesciences.org/articles/72834/elife-72834-fig6-data3-v2.docx
Figure 6—figure supplement 1
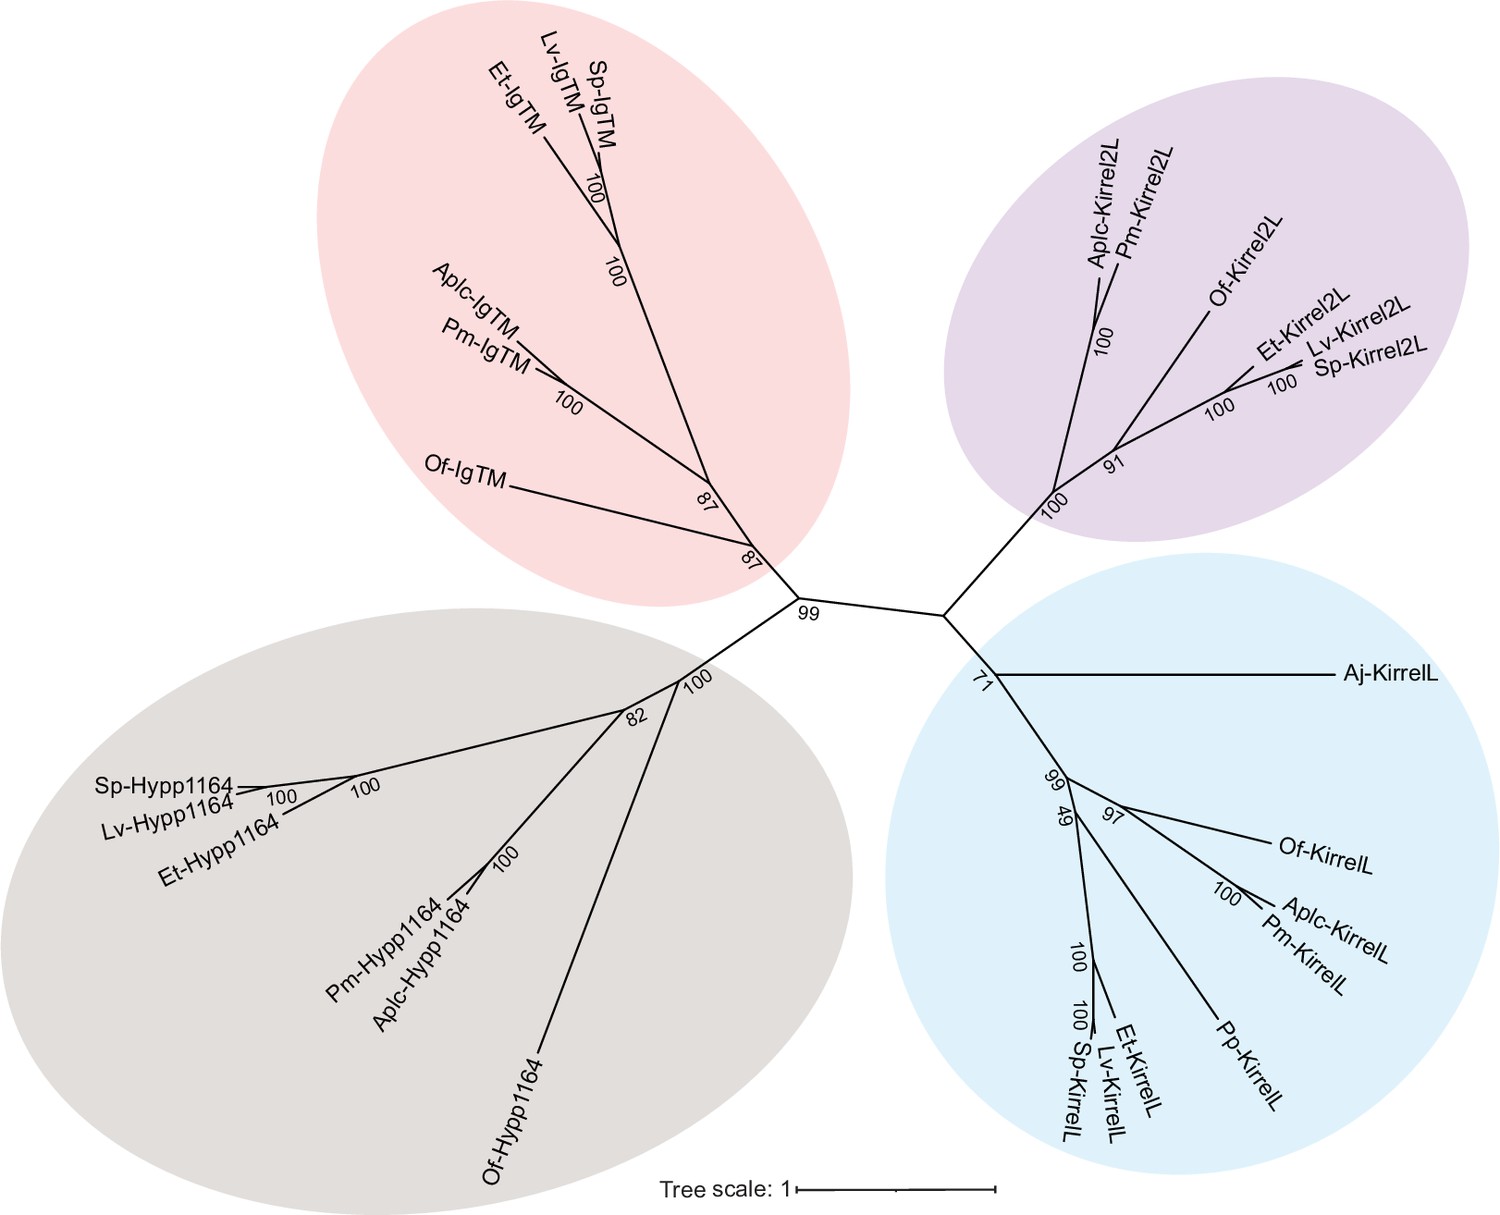
Unrooted, maximum likelihood tree showing clustering of primary mesenchyme cell (PMC)-specific Ig-domain proteins from different echinoderm species that represent all classes within the phylum.
The evolutionary history was inferred by using the Maximum Likelihood method and JTT matrix-based model (Jones et al., 1992). There were 26 protein sequences and all positions with less than 90% site coverage were eliminated (partial deletion). There was a total of 463 positions in the final dataset. Evolutionary analyses were conducted in MEGA X (Kumar et al., 2018; Stecher et al., 2020). Only bootstrap values greater than 45 were shown. Bootstrap replicates: 1000. Strongylocentrotus purpuratus (Sp), Lytechinus variegatus (Lv), Eucidaris tribuloides (Et), Parastichopus parvimensis (Pp), Patiria miniata (Pm), Acanthaster planci (Aplc), Ophionereis fasciata (Of), and Anneissia japonica (Aj). All protein sequences used for tree building are shown in Figure 6—source data 3.
Figure 6—figure supplement 2
Alignment of echinoderm KirrelL proteins and representative whole-mount in situ hybridization (WMISH) images of positive control probes.
(A) Clustal alignment of echinoderm KirrelL proteins from Eucidaris tribuloides (Et-KirrelL), Parastichopus parvimensis (Pp-KirrelL), Patiria miniata (Pm-KirrelL), Acanthaster planci (Aplc-KirrelL), Ophionereis fasciata (Of-KirrelL), and Anneissia japonica (Aj-KirrelL). Colors correspond to the Clustal default residue coloring scheme. (B) Lv-msp130r2 expression during L. variegatus development. (C) Pm-ets1 expression during P. miniata development. EG, early gastrula; MG, midgastrula; LG, late gastrula; PR, prism stage; PL, pluteus larva; AR, adult rudiment; JV, juvenile stage. All protein sequences used for Clustal alignment are shown in Figure 6—source data 3.
Figure 6—figure supplement 3
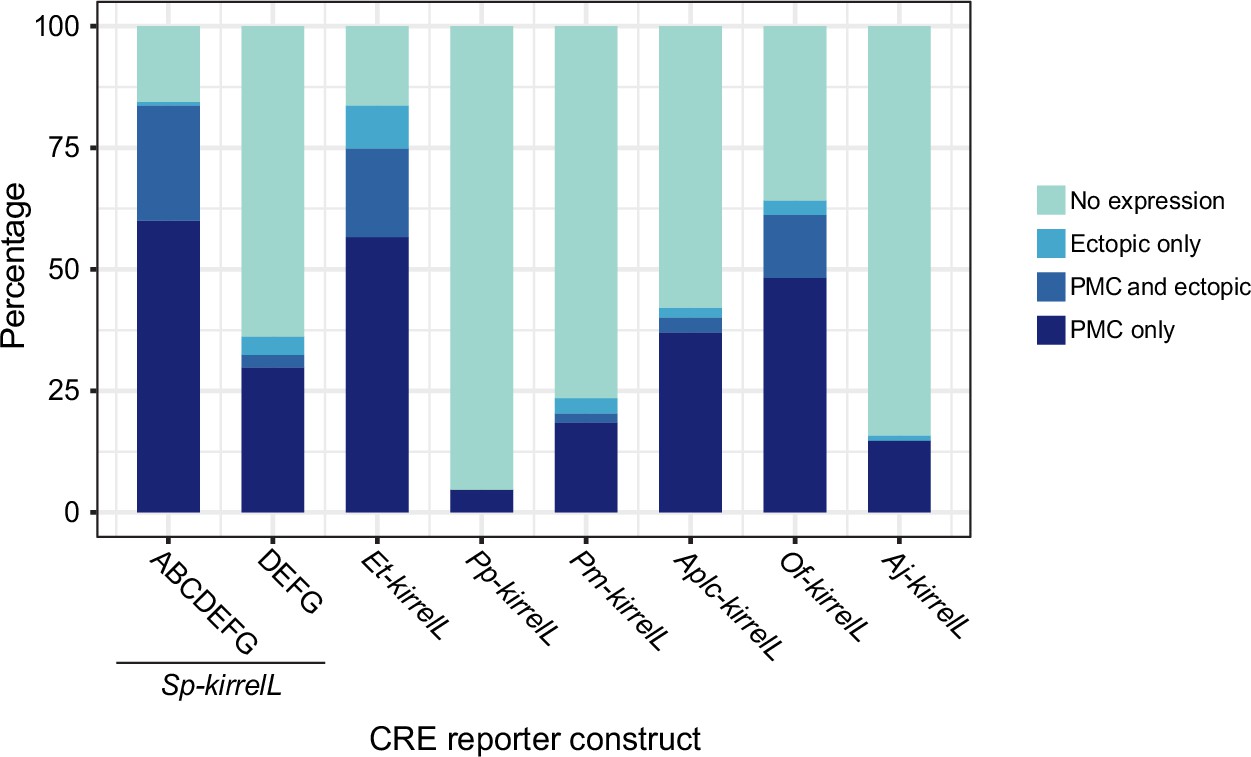
Stacked bar plots showing summary of GFP expression patterns of transgenic S. purpuratus embryos injected with constructs containing noncoding sequences upstream of kirrelL genes of Eucidaris tribuloides (Et-kirrelL), Parastichopus parvimensis (Pp-kirrelL), Patiria miniata (Pm-kirrelL), Acanthaster planci (Aplc-kirrelL), Ophionereis fasciata (Of-kirrelL), and Anneissia japonica (Aj-kirrelL).
Each spatial expression category is expressed as a percentage of total injected embryos.
Figure 7 with 4 supplements
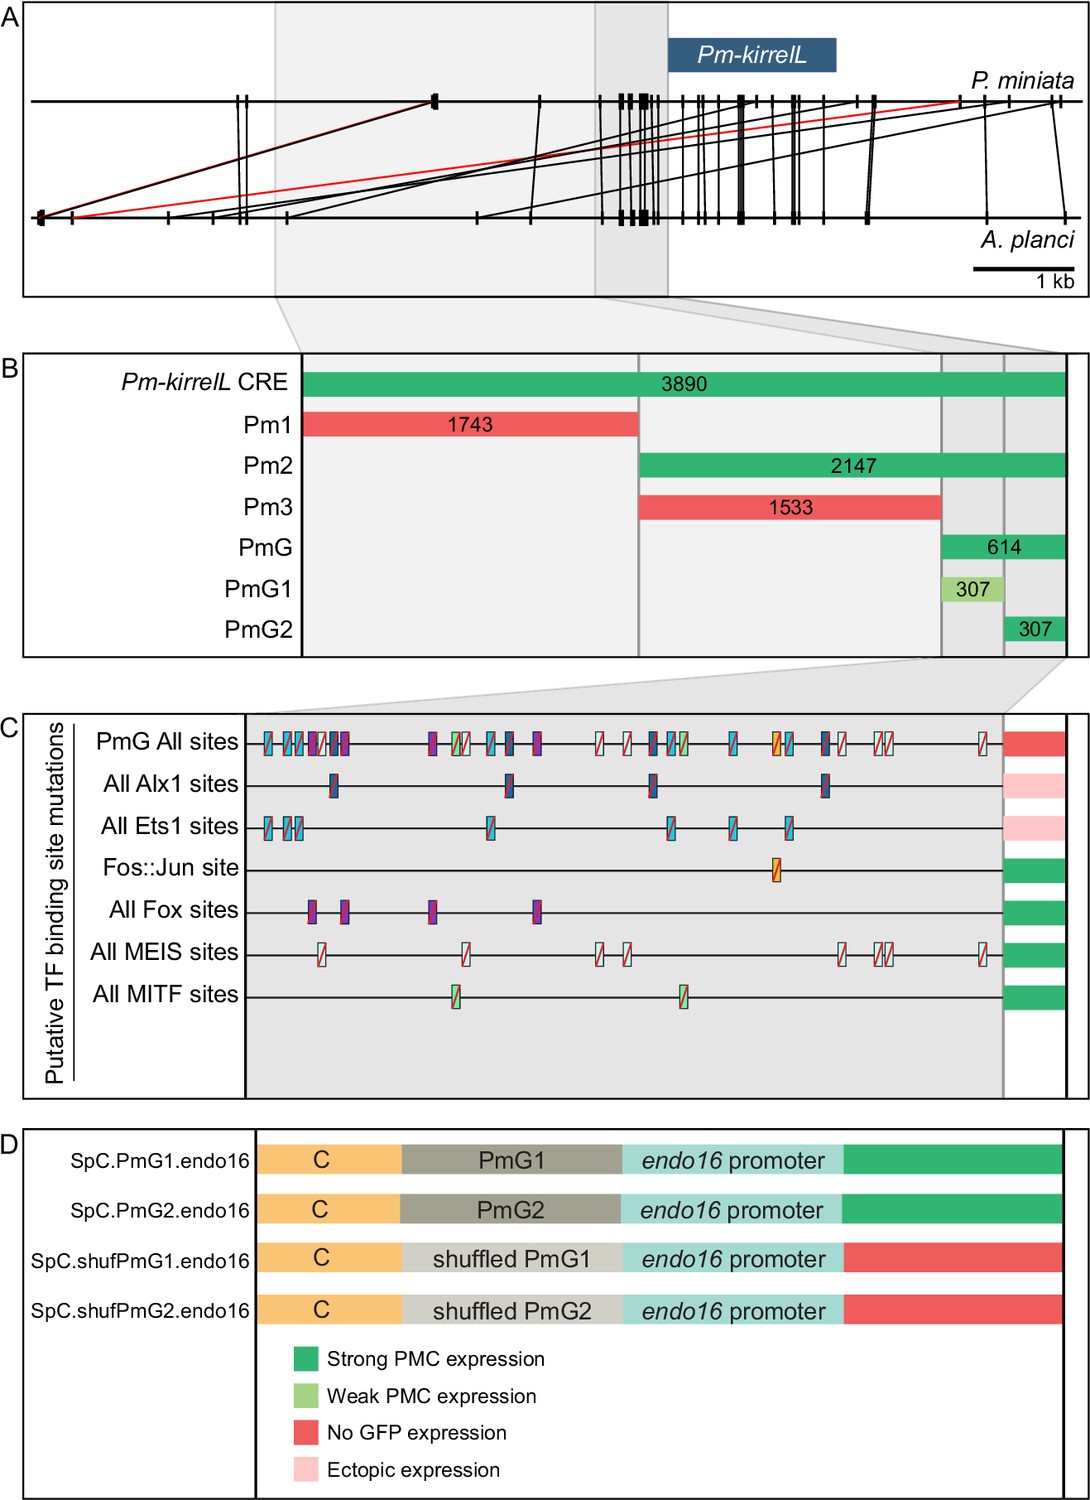
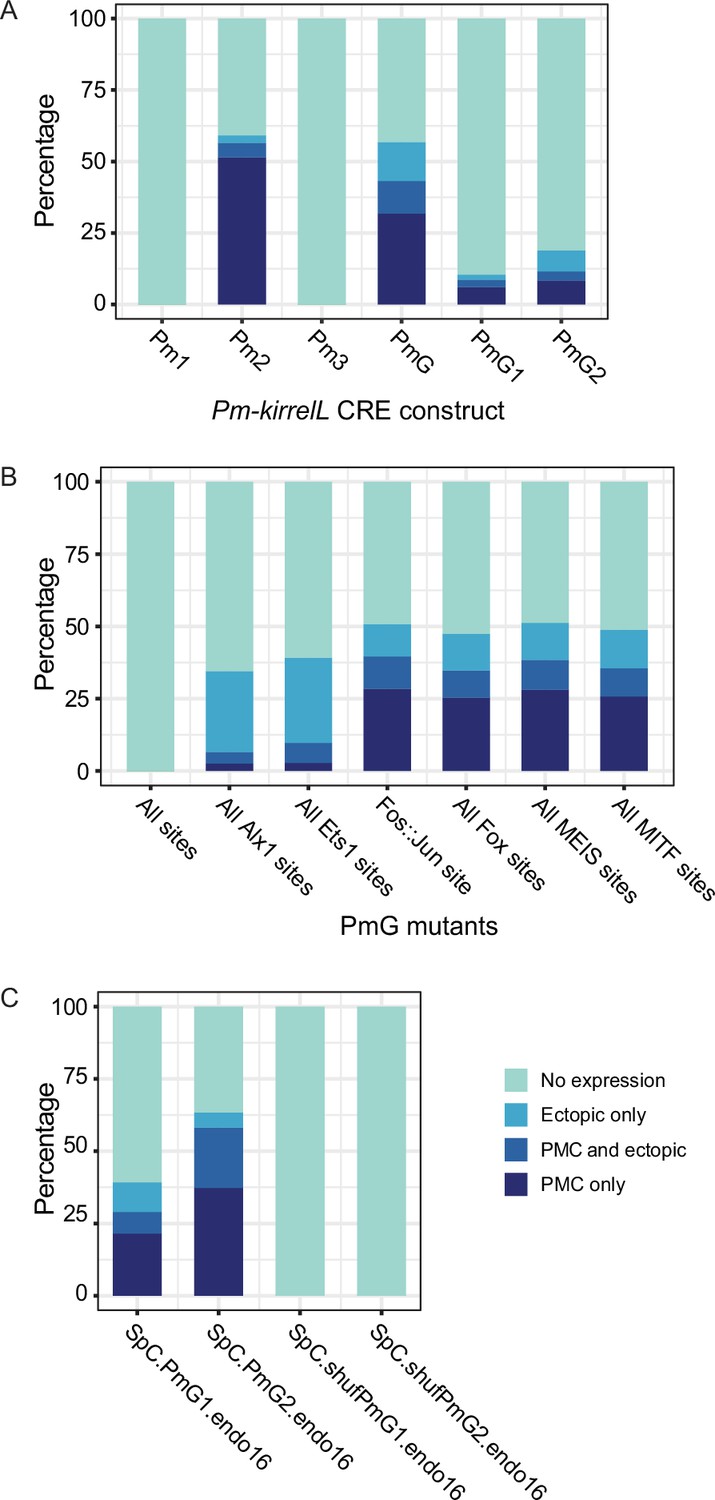
Functional analysis of noncoding genomic sequences upstream of Pm-kirrelL to identify cis-regulatory elements (CREs).
(A) Phylogenetic footprinting of genomic sequences near P. miniata and A. planci kirrelL using GenePalette. Black lines indicate identical sequences of 13 bp or longer in the same orientation while red lines indicate identical sequences of 13 bp or longer in the opposite orientation. (B) Summary of GFP expression regulated by noncoding sequences upstream of the Pm-kirrelL translational start site. (C) Summary of GFP expression driven by PmG element mutants. (D) Summary of GFP expression regulated by chimeric reporter constructs containing Sp-kirrelL element C and Pm-kirrelL G1 or G2 elements. Criteria for strong and weak primary mesenchyme cell (PMC) expression are defined in Figure 2. Ectopic expression is defined as majority of injected embryos exhibiting GFP expression in cells other than PMCs.
Figure 7—figure supplement 1
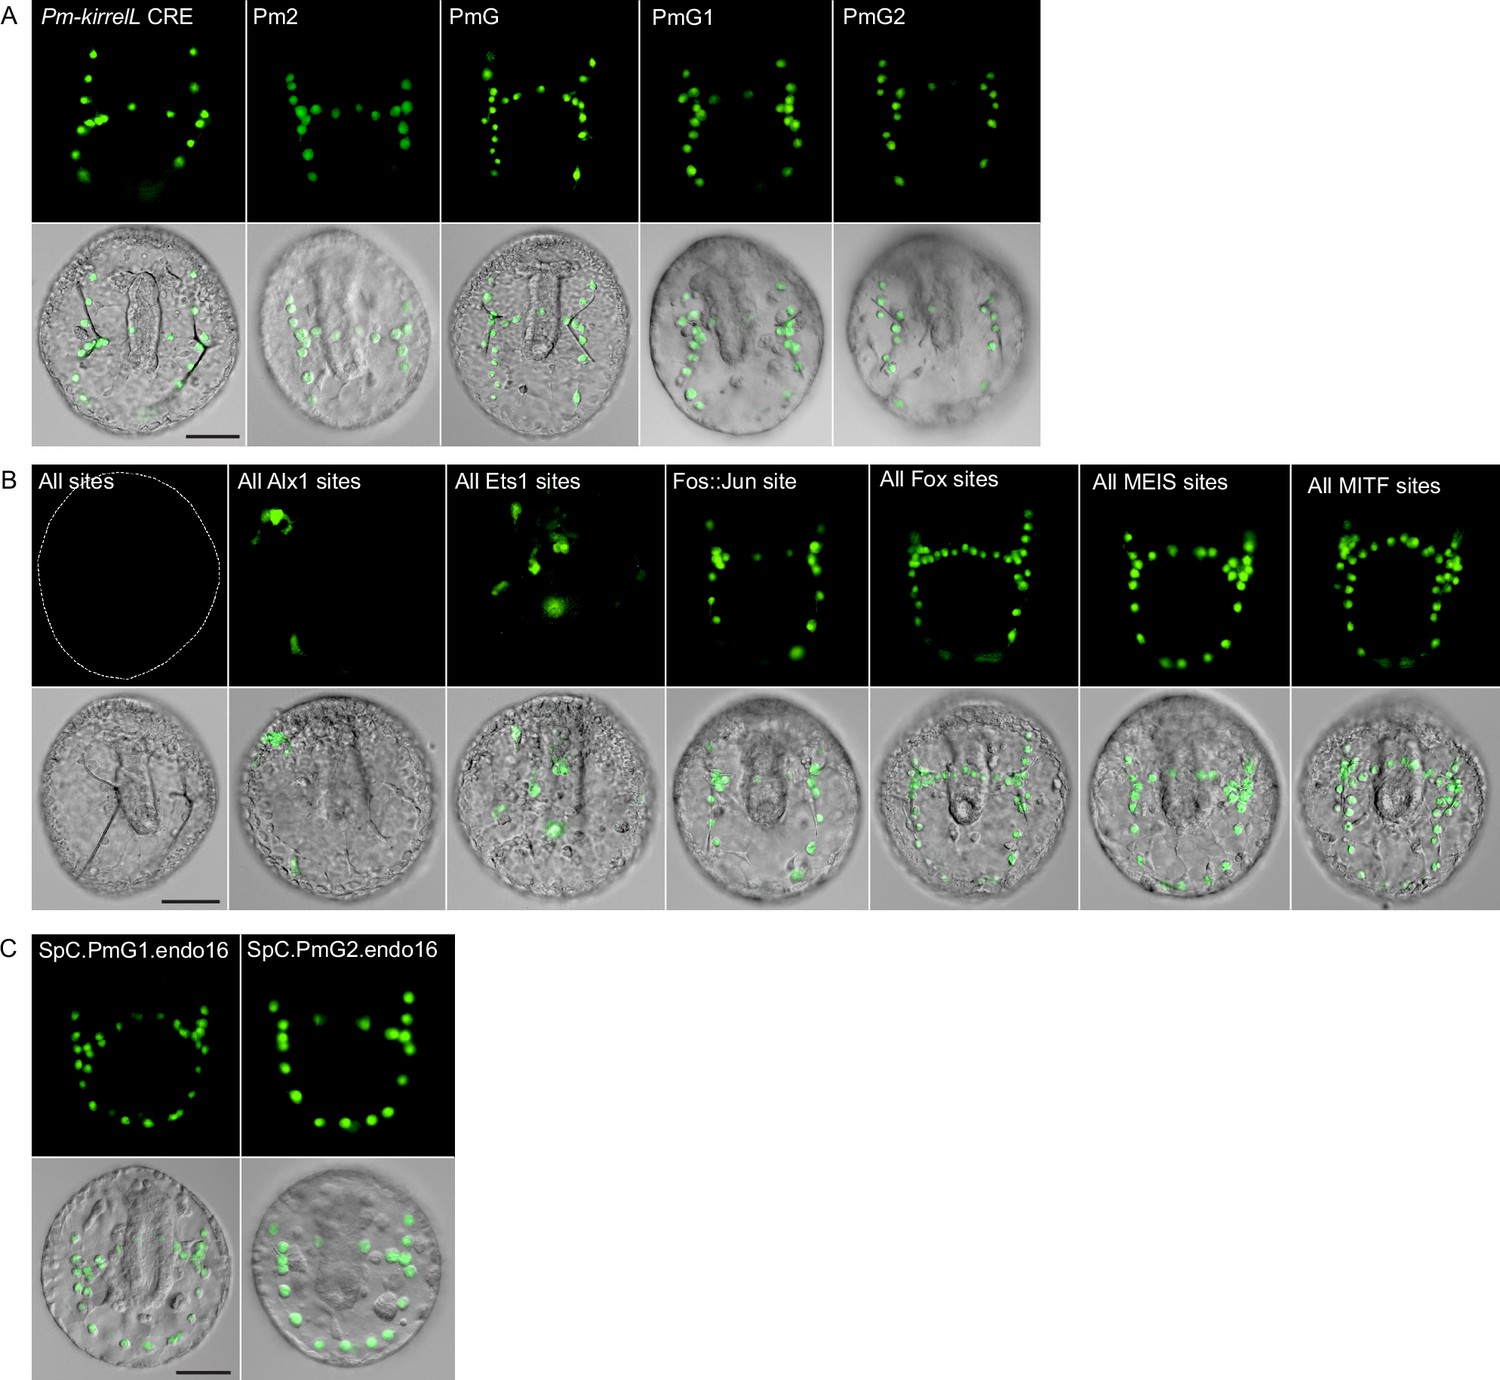
Sea star Pm-kirrelL cis-regulatory element (CRE) truncation and mutational analysis.
(A) Spatial expression patterns of GFP reporter constructs containing Pm-kirrelL truncations in S. purpuratus embryos at 48 hpf. (B) Spatial expression patterns of GFP reporter constructs containing sea star PmG element mutants in S. purpuratus embryos at 48 hpf. (C) Spatial expression patterns of chimeric reporter constructs containing Sp-kirrelL element C and Pm-kirrelL G1 or G2 elements. Dotted lines show outlines of embryos that did not show GFP expression. Top rows: GFP fluorescence. Bottom rows: GFP fluorescence overlayed onto differential interference contrast (DIC) images. Scale bar: 50 μm.
Figure 7—figure supplement 2
Stacked bar plots showing summary of GFP expression patterns of injected embryos scored at 48 hpf.
Each spatial expression category is expressed as a percentage of total injected embryos. (A) GFP spatial expression patterns of transgenic embryos injected with Pm-kirrelL cis-regulatory element (CRE) reporter constructs. (B) GFP spatial expression patterns of embryos injected with PmG transcription factor-binding site mutant constructs. (C) GFP spatial expression patterns of embryos injected with constructs containing Sp-kirrelL C element with wild-type (WT) or shuffled Pm-kirrelL PmG1 or PmG2.
Figure 7—figure supplement 3
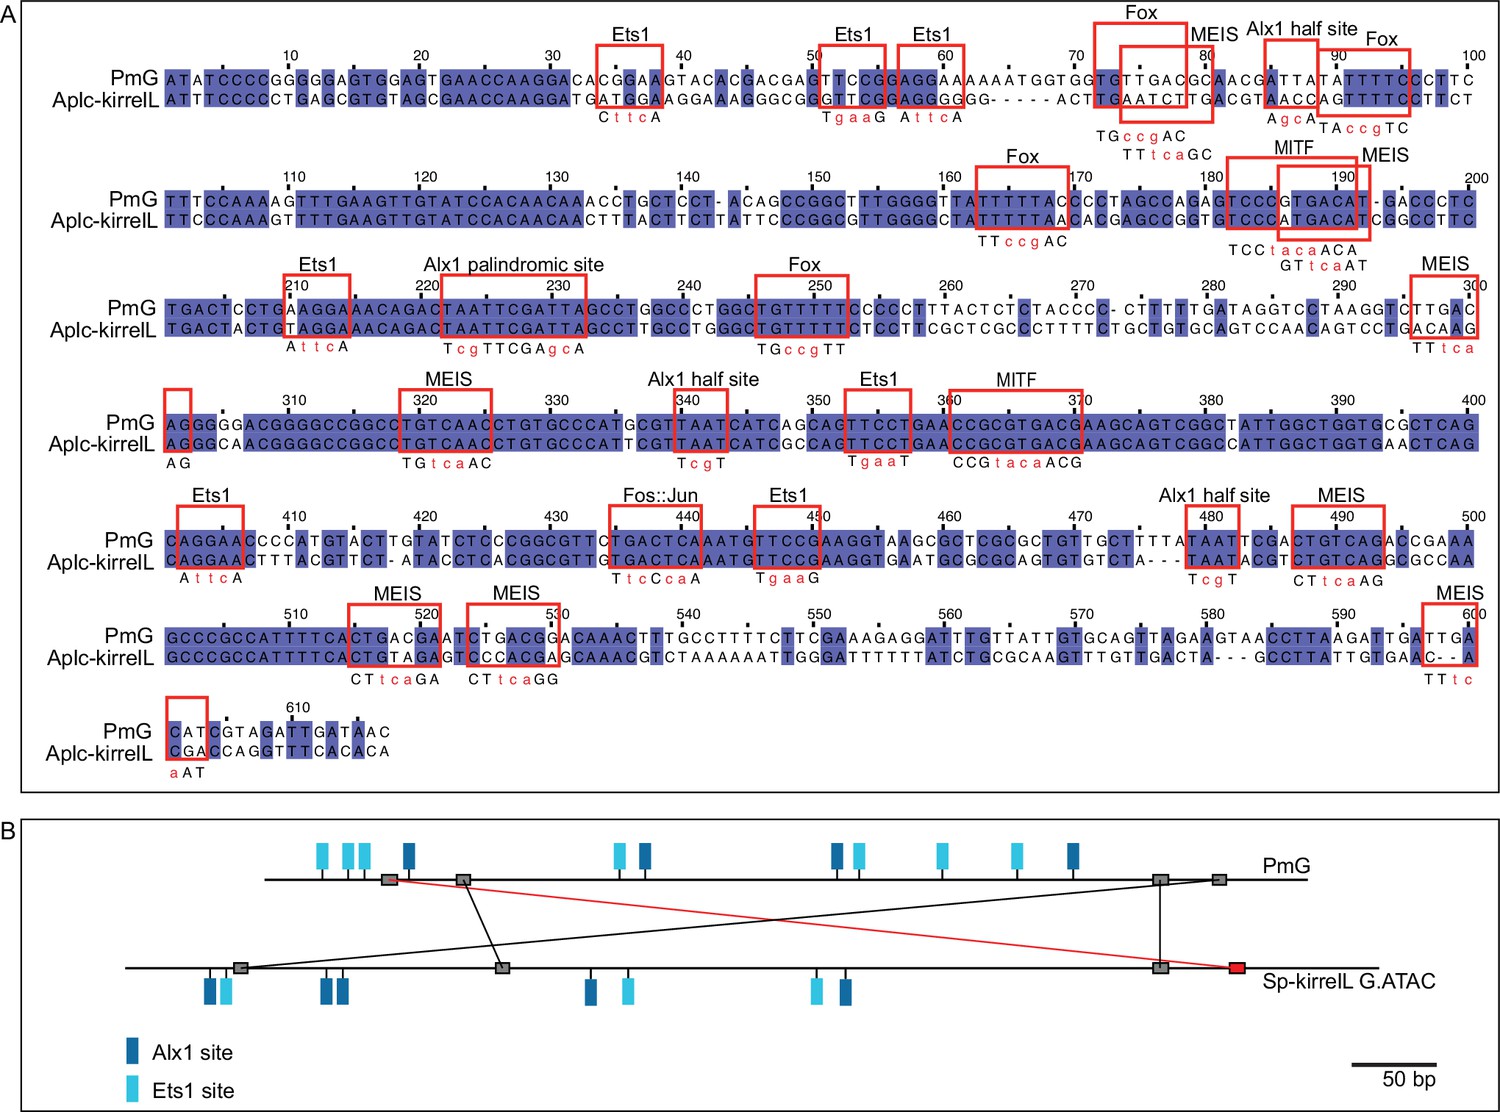
Mutational analysis of the sea star P. miniata kirrelL element G (PmG).
(A) Clustal alignment of PmG and homologous sequences from crown-of-thorns starfish A. planci kirrelL element G (Aplc-kirrelL.G). Red boxes highlight putative transcription factor-binding sites. Sequences in red indicate transcription factor-binding site mutations that were generated. (B) Phylogenetic footprinting of PmG and Sp-kirrelL G.ATAC using GenePalette. Black lines indicate identical sequences of 9 bp or longer in the same orientation while red lines indicate identical sequences of 9 bp or longer in the opposite orientation.
Figure 7—figure supplement 4
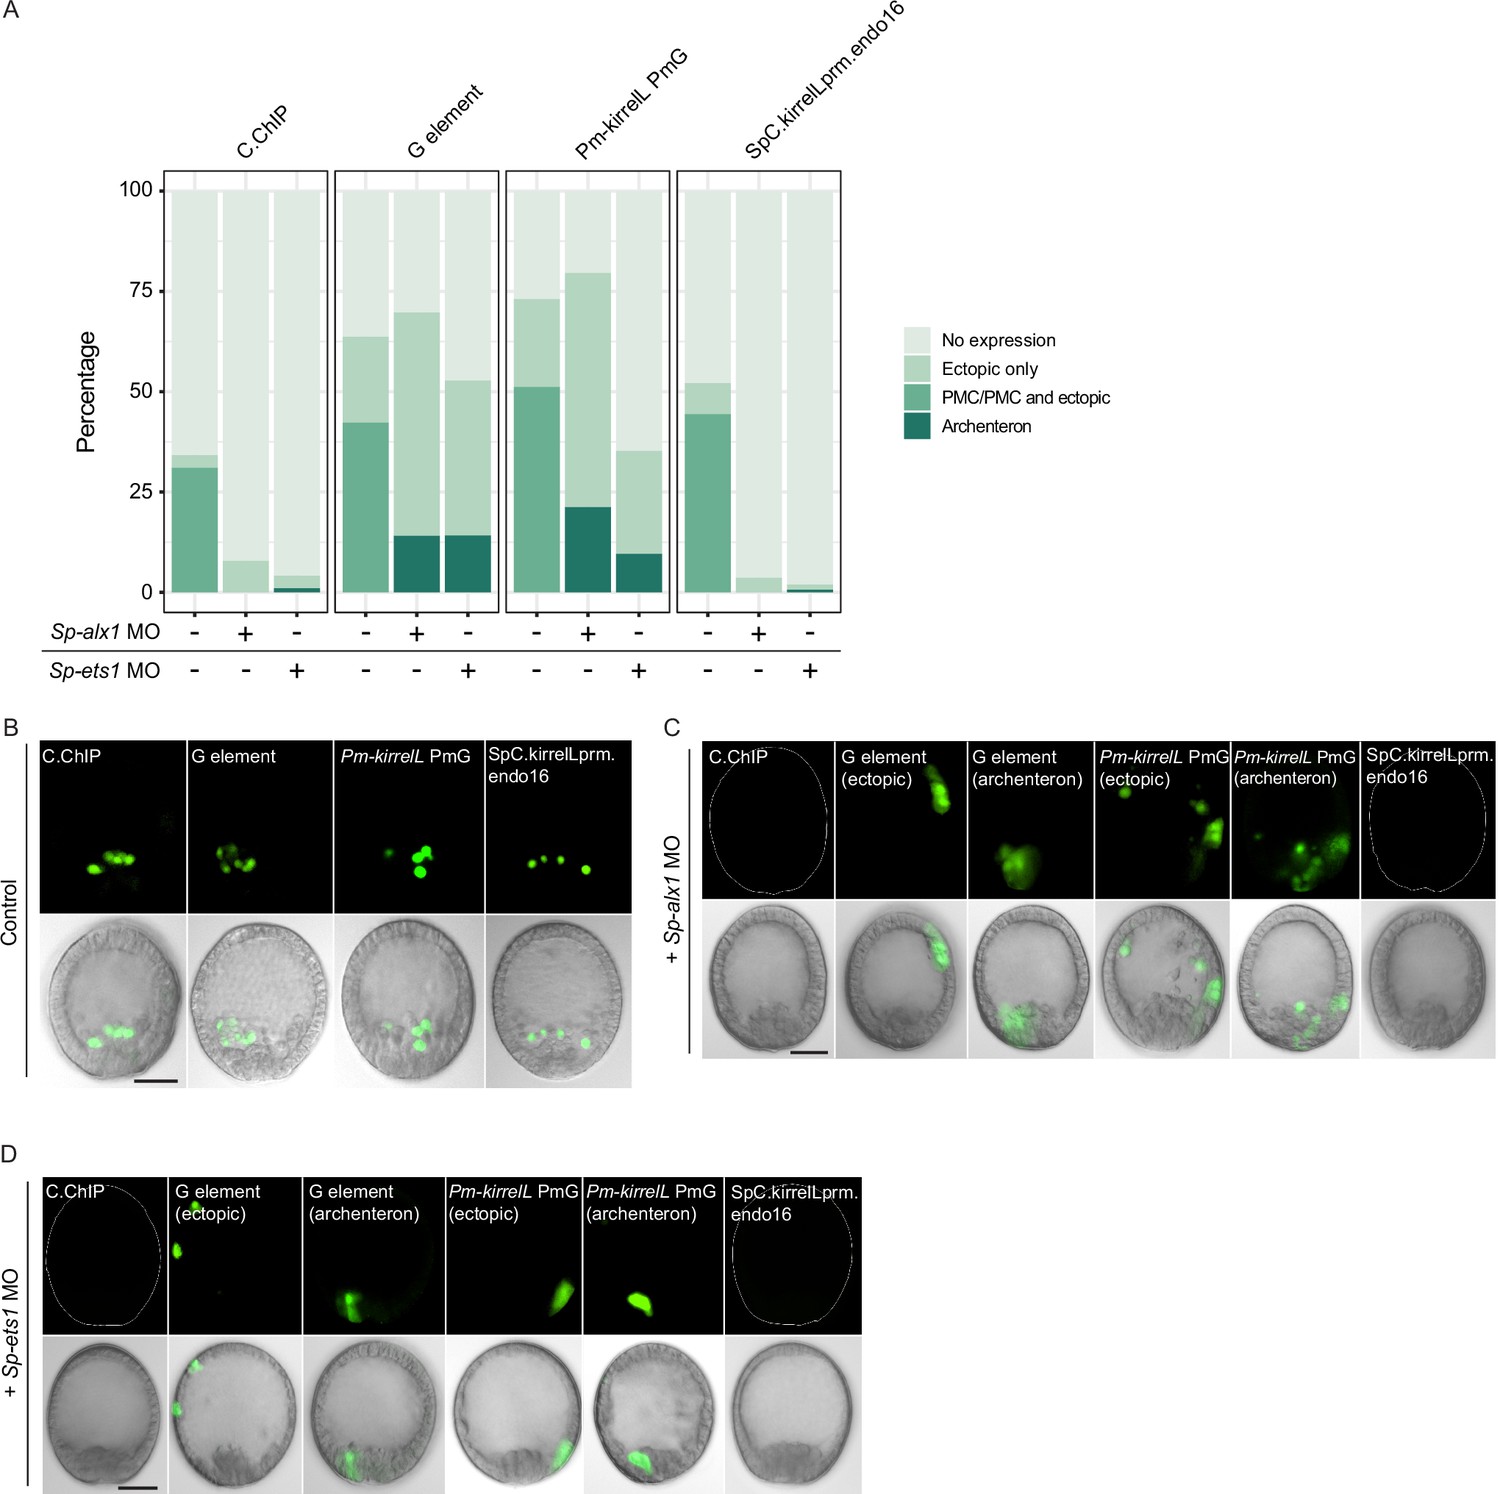
Effects of Sp-alx1 and Sp-ets1 knockdown on transgenic Sp-kirrelL cis-regulatory element (CRE) reporter construct expression.
(A) Stacked bar plot showing a summary of GFP expression patterns of embryos coinjected with morpholino and reporter constructs. Each spatial expression category is expressed as a percentage of total injected embryos. Representative images of primary mesenchyme cell (PMC)-specific and ectopic GFP expression in control embryos (B), Sp-alx1 morphants (C), and Sp-ets1 morphants (D). Dotted lines show outlines of embryos that did not exhibit GFP expression. Top row: GFP fluorescence. Bottom row: GFP fluorescence overlayed onto differential interference contrast (DIC) images. Scale bar: 20 μm.
Additional files
Download links
A two-part list of links to download the article, or parts of the article, in various formats.
Downloads (link to download the article as PDF)
Open citations (links to open the citations from this article in various online reference manager services)
Cite this article (links to download the citations from this article in formats compatible with various reference manager tools)
Architecture and evolution of the cis-regulatory system of the echinoderm kirrelL gene
eLife 11:e72834.
https://doi.org/10.7554/eLife.72834


